


Introduction
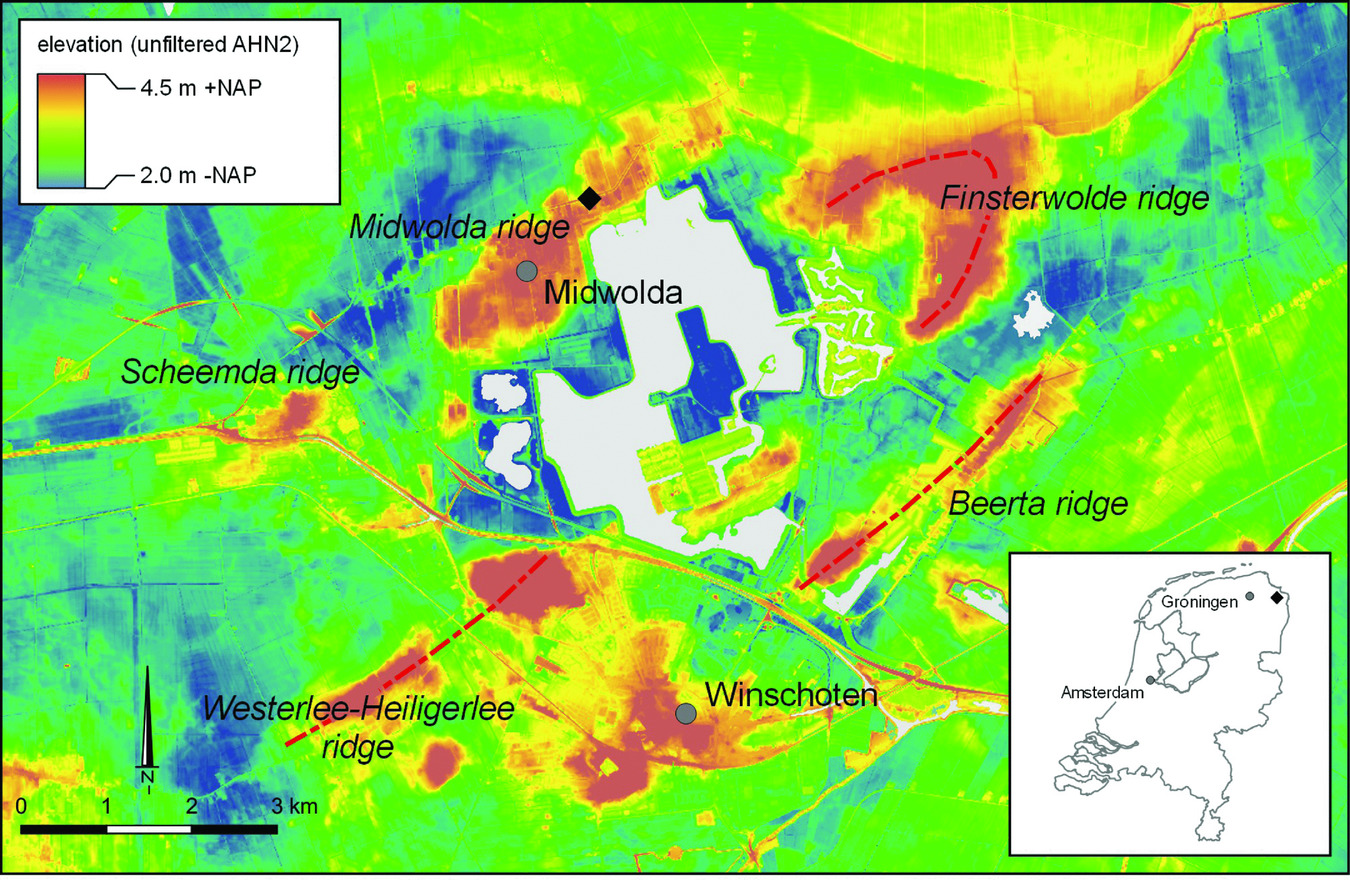
Contrasting with the typical flat farmland topography often associated with the coastal regions of the northern and western Netherlands, the coastal landscape in the northeastern part of Groningen has a slightly elevated and undulating character (Fig. 1). One of the more prominent features in this region is the Midwolda ridge, a 3.3 km long and 1.3 km wide series of hills, with elevations of 1.2–2.5 m above sea level. The hills form a more or less horseshoe-shaped landform. At present, this landform is further accentuated by the excavation of the artificial Oldambt lake.
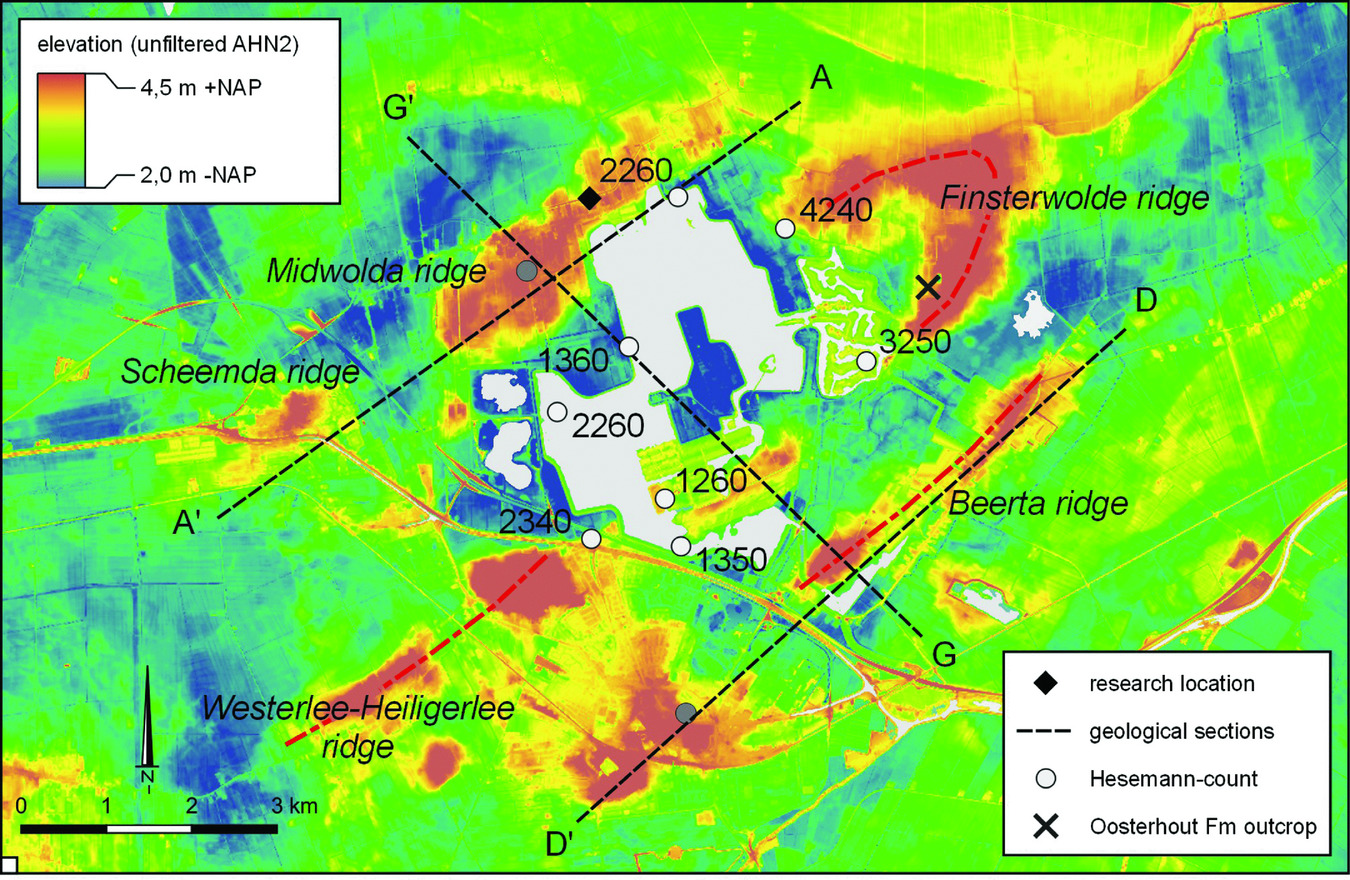
Digital elevation map of the glacial landscape of eastern Groningen. The Midwolda ridge is located in the north, all other glacial ridges as red dashed lines. The map shows a dominant NE–SW orientation of the elongated relief next to irregular non-oriented relief forms in the NE and SW part of the map (www.ahn.nl/viewer).
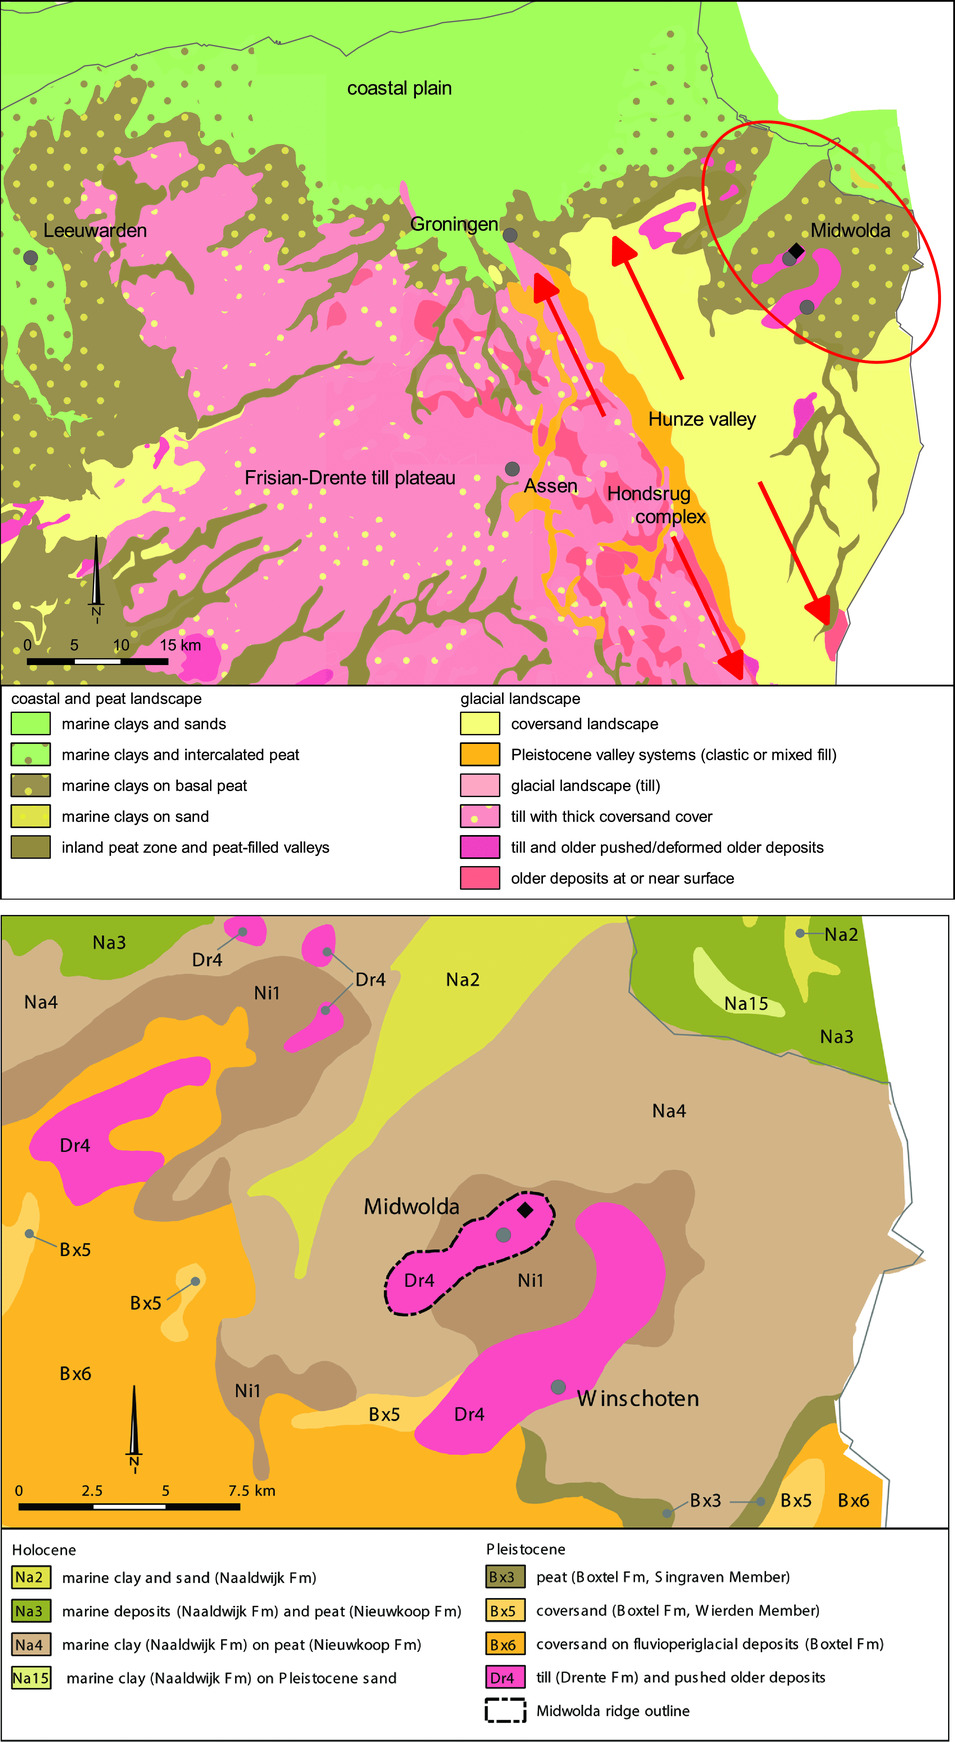
A similar series of hills forms the nearby Winschoten ridge (Fig. 2A). Together, the Midwolda and Winschoten glacial ridges are part of a larger Pleistocene region of roughly 40 km × 20 km, representing glacial ridges in the NE Netherlands (De Mulder et al., Reference De Mulder, Geluk, Ritsema, Westerhoff and Wong2003). To the west, this complex of ridges is separated by the Hunze valley from the Hondsrug, a NNW–SSE-oriented mega-scale glacial lineation at the eastern margin of the Drenthe–Friesian till plain (Fig. 2B) (Rappol, Reference Rappol and Van der Meer1987). Since Saalian times, erosion and sedimentation processes may have reduced up to 10–20 m of relief, as has been demonstrated for the Hunze valley (De Gans, Reference De Gans1981). Till abrasion and erosion have removed 2 m of sediment further westward at Urk (Van der Meer & Lagerlund, Reference Van der Meer and Lagerlund2000).
(A) Simplified geological map of the NE Netherlands showing the main landscape units associated with the Saale glaciation. Red arrows indicate NNW–SSE orientation of Hondsrug ridges and Hunze valley (modified after De Mulder et al., Reference De Mulder, Geluk, Ritsema, Westerhoff and Wong2003). (B) Geological map of the study area. The Midwolda ridge is marked with a black contour. (Source: DINOloket/De Mulder et al., Reference De Mulder, Geluk, Ritsema, Westerhoff and Wong2003.)
Initially, the ridges around Midwolda have been interpreted as the last phase of a series of recession moraines in the Netherlands during the second part of the penultimate ice age, the Saalian, marine isotope stage (MIS) 6: c.200,000–130,000 years ago (Ter Wee, Reference Ter Wee1962). In this model, a lobe-shaped ice front formed a horseshoe-shaped push moraine. Van den Berg & Beets (Reference Van den Berg, Beets and Van der Meer1987), however, reinterpreted the landforms in the northeast of the province of Groningen as ice-pushed structures (push moraines), overridden and drumlinised by ice moving in a SW direction during the last stage of the Saalian glacial history. This model seems to be in agreement with digital elevation data, which clearly show that the Midwolda glacial ridge has a NE–SW orientation. A lobate pattern in the north of the NW margin of the Midwolda ridge suggests a potential overprint from a different (opposite) direction (Fig. 1).
In this paper we use a combination of glaciotectonic and sedimentological data, in large part assembled in a series of trenches, to investigate the glacial history of the Midwolda ridge. In addition, we evaluate the relation of the structures to the composition of the subsurface.
Geological and geomorphological setting
The relief in the wider region has been described as two NE–SW-oriented tails of the horseshoe shape (Ter Wee, Reference Ter Wee1962), with the pushed structure expected to be in the horseshoe bend. Midwolda is located on the northern drumlinoid, Winschoten on the southern drumlinoid, while the area around Finsterwolde is located on the horseshoe bend (Fig. 2A). Close examination of the digital elevation model (DEM) shows that the Midwolda ridge may appear to be somewhat off the inferred Winschoten–Finsterwolde horseshoe bend, and may form an independent glacial ridge just north of, but still parallel aligned to, the horseshoe bend structure (Fig. 2A). The glacial ridges on the southern part of the horseshoe structure seem to be composed of two parallel sub-ridges.
In an attempt to revitalise the area, the 800 ha Oldambt lake was created as part of the larger ‘Blauwestad’ project. The municipality of Oldambt recognised the geoscientific value of this landform and in 2011 facilitated the digging and analysis of two relatively short temporary trenches (1 and 3). These trenches, 4–5 m in depth, had the specific aim of documenting the glacial sedimentology and structural geology of the Midwolda ridge (Aalbersberg and Kluiving, Reference Aalbersberg and Kluiving2012; Kluiving & Koster, Reference Kluiving, Koster, Kluiving, Kasse and Van Balen2012). In 2014, the construction of the canal resulted in another, c.1 km long temporary exposure through the northern flank of the same glacial ridge (Aalbersberg, Reference Aalbersberg, Van Kruining and Veenstra2016) (Fig. 3).
Map of study area showing the location of the 2011-1 (WP-1), 2011-3 (WP3) and 2014 trenches. The large 2014 trench is subdivided into ‘north 1’, ‘north 2’, ‘south 0’, ‘south 1’ and ‘south 2’ parts, of which the latter ‘south’ parts have been investigated in this study.
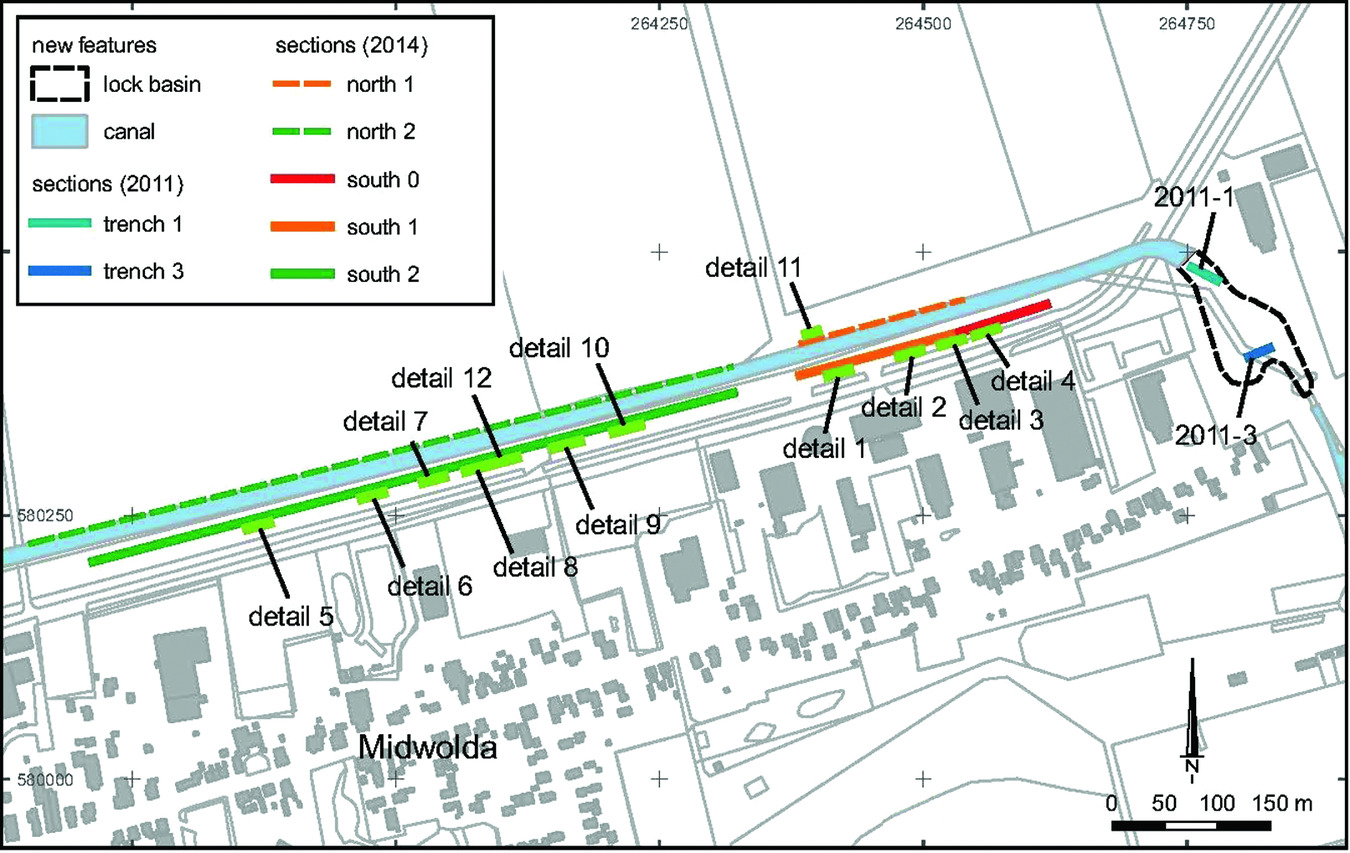
The orientation of the 2011 trenches was chosen so that trench 3 was oriented NE–SW, parallel to the assumed main ice-movement direction, and trench 1 NNW–SSE, more or less at right angles to that direction and parallel to the last ice-flow direction from the NW (Fig. 3). The 2014 exposure cuts in an oblique fashion through the glacial ridge in an ENE–WSW orientation. The eastern end of the 2014 temporary exposure is located only several tens of metres west of the 2011 trenches, facilitating correlation of the trenches. The western end of the 2014 exposure more or less coincides with the location where the glacial ridge disappears underneath the Holocene marine cover, NW of the glacial ridge. The rapidly advancing canal works, covering the exposed sediments with wattlework and boulders to prevent erosion, unfortunately made observations further to the west impossible.
Methods
In the 2011 trenches two long sections, the NW side (of trench 3) and the WSW side (of trench 1), were documented using standard geological procedures. Both sides of the 2014 exposure were photographed and sketched, and lithological logs and additional detailed drawings were made. The orientation of faults, boundary units and periglacial structures (e.g. ice-wedge casts) was also measured.
Comparable to e.g. Kluiving (Reference Kluiving1994, Reference Kluiving2001), we used lithological and sedimentological descriptions, measurements of fault orientations, dip directions and fold axes, and analyses of fine gravel (2–4 mm), grain size and microstructures and thermogravimetric analysis (TGA). Samples for provenance analysis based on fine gravel and erratics were taken in the 2011 trenches.
The 2011 trenches were dug with the explicit purpose of geological research, allowing the construction of clean, near-vertical sections. In contrast, the sides of the 2014 temporary exposure had an angle of c.30° and were excavated in a fairly rough manner and then left exposed to the weather. Despite these disadvantages, the 2014 exposure provides important information on the large-scale structure of the ridge, that could not be obtained from the comparatively small 2011 trenches. Within the Supplementary Material of this paper (available online at https://doi.org/10.1017/njg.2018.16) a full and more complete coverage of the 2014 exposure is depicted.
The fine-gravel analysis of the 2011 samples was performed on the 2–4 mm fraction, comparable to the fraction commonly used in gravel counts from subglacial till material (3–5 mm; cf. Zandstra, Reference Zandstra1983a,Reference Zandstra and Ehlersb; Rappol et al., Reference Rappol, Kluiving and Van der Wateren1991). Grain-size analysis (GSA) and TGA were carried out on subsamples from the same 17 bulk samples used for fine-gravel analysis, as well as on four additional samples from Elsterian glaciolacustrine clay (the so-called pot clay) (2), an intrusion in the pot clay, and a sample from sand within an involution. GSA and TGA measurements have been carried out on the 2011-1 and -3 exposures. Fine-gravel analysis (2–4 mm) has been carried out previously in till stratigraphy analysis in order to contribute to the analysis of the different till types (Rappol, Reference Rappol and Van der Meer1987; Kluiving et al., Reference Kluiving, Rappol and Van der Wateren1991). The relation between flint (F) and crystalline (C) material in the 2–4 mm fraction is expressed as the F/C ratio. The absence or presence, as well as proportion, of flint in tills has been used in the past to unravel till stratigraphy (Rappol, Reference Rappol and Van der Meer1987; Kluiving et al., Reference Kluiving, Rappol and Van der Wateren1991). Two samples for microstructural analysis have been sampled at the contact of the pot clay with the basal till in trench 2011-1 and within the intrusion in the pot clay in trench 2011-3. The two samples were air-dried in the laboratory for two to four weeks, impregnated, cut, and mounted on glass slides measuring 10 cm × 10 cm (cf. Van der Meer, Reference Van der Meer1993, Reference Van der Meer and Menzies1996).
Geological cross-sections from the Regis II v2.2 hydrogeological model were complemented with those of the GEOTop v1.3 model (both from DINOLoket, TNO) and used to infer potential relationships of glacial structures with lithology and structures in the subsurface. Regis hydrogeological models were combined with the GEOTop model, because of the greater lithological resolution of sands in the Regis model in the Peelo Formation, as well as the higher resolution of the GEOTop model with regard to surface layers, e.g. the Drente Formation and Holocene deposits.
Results
Below, the lithostratigraphy and structural data of three glacial periods at Midwolda are described, the Elsterian, Saalian and Weichselian deposits. The Saalian deposits are divided into a lower and an upper till layer. The exposures show a distinct pattern of intrusive structures that is overprinting the lithostratigraphy of all deposits. A group of intrusions is interpreted to originate from below and can be divided into two specific types. Type 1 intrusions occur in the Elsterian deposits below the lower Saalian till with, in most cases, the Elsterian deposits as a source rock. Type 2 intrusions are present within the upper till layer, and originate from the Elsterian–Saalian interface or higher. The Weichselian deposits show intrusive structures interpreted to originate from cryoturbation processes from above that sometimes reach into Elsterian deposits. The results will also be incorporated in a regional synthesis based on available core databases and references.
Elsterian: glaciolacustrine deposits (Peelo Formation, Nieuwwolda Member): stratigraphy and structures
The base of the exposed sequence in the 2011 trenches consists of a (brown) black calcareous clay with variable amounts of grey silty clay. In trench 2011-1 the grey silty clay is exposed as a fine lamination alternating with the brown black clay in a vertical position (Fig. 4A). The basal unit is interpreted as the glaciolacustrine Peelo Formation, Nieuwwolda Member (Ebbing, Reference Ebbing2003), which is of Elsterian age. Informally this clay is called ‘potklei’ (pot clay). In adjoining German territory it is known as Lauenburger Ton (Meyer, Reference Meyer1983; Ehlers, Reference Ehlers1990).
(A) Detail of glaciolacustrine clay in 2011 pit. The laminated clay is rotated (pushed) in vertical position. The individual layers show current ripples as well as discontinuities pointing to syn- or post-sedimentary deformation caused by rapid deposition and liquefaction of the sediment. Top of sequence is to the right. (B) Detail of section south 2 in the 2014 pit. Synclinal shape of glaciolacustrine deposits (units E) points to large-scale folding prior to till deposition (units D).
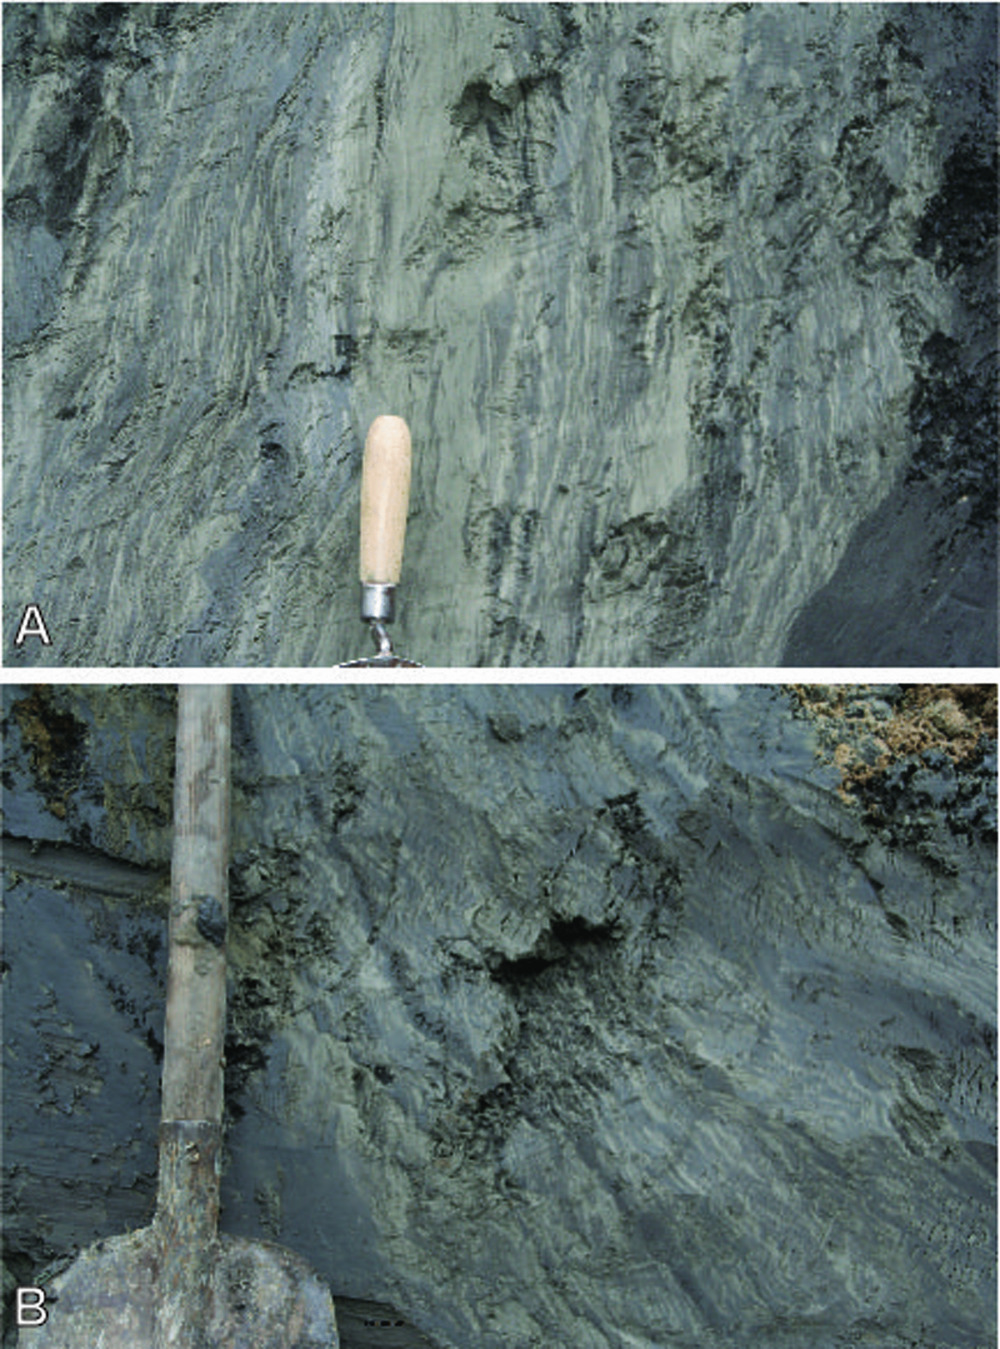
In all trenches the fine layering shows discontinuities and small-scale folding, suggesting syn- or post-sedimentary deformations caused by rapid deposition and liquefaction of the sediment (Fig. 4A and B). The larger 2014 trenches show several other (sub)units, ranging from pure clay to silty clay with sandy intercalations and sandy beds with climbing ripple bedding and with coarse sands to fine gravel. The latter subunits are interpreted as more proximal turbiditic deposits compared to the distal clay sediments.
Clay unit E1a is a homogeneous, dark chocolate brown to almost black, heavy clay, weathering to a brownish-grey clay with a distinct angular crumbly structure. Few sedimentary structures have been observed, although locally a cm-scale colour banding occurred. Sporadically, whitish, small silt lenses have been found (Fig. 4A). Unit E1a is interpreted as glaciolacustrine deposits in which the silt lenses may represent distal turbidites (Bouma E).
Clays of unit E1b are brown to brownish-black, heavy clays with few to abundant mm or sub-mm thick white or light-grey silt lenses and laminae, which can be traced over several dm. Where silt layers are abundant, the deposits have a characteristic barcode-like appearance. In particular where the unit is rich in silt layers, small-scale synsedimentary deformation structures are common. Unit E1b is interpreted as (glacio)lacustrine deposits with distal turbidites (Bouma D).
Clays of unit E4 are homogeneous dark brown to brownish-black, alternating with thin sand and silt layers. Sedimentary structures in the sand and silt layers consist of parallel lamination and small current ripple lamination. Synsedimentary deformation structures are common. Unit E4 is interpreted as (glacio)lacustrine deposits with a transition from distal to more proximal turbidites (Bouma D and C).
Unit E2a consists of predominantly light-grey to yellowish-grey, fine sands with abundant micas alternating with dark-brown clay layers. This subunit is further characterised by the presence of current ripples, although parallel and subparallel lamination is present as well. The clay occurs as thin drapes and lenses within and on top of individual current ripples, and as continuous, up to 1 cm thick, layers. Synsedimentary deformation structures are common. Unit E2a is interpreted as (glacio)lacustrine sediments formed by proximal turbidites (Bouma C and D).
Unit E2b has been described as greenish-grey, blueish-grey or light-brownish-grey fine sands (median particle size c.210 µm) with abundant micas. Sediment colour appears to depend mainly on the oxidation/reduction state; after several days to weeks the outermost 20 cm of the exposed sediments have weathered from blue- or greenish-grey to light-brownish grey. The unit consists of conspicuous sets of climbing ripples, which can be up to several decimetres thick. Sets are often separated from each other by thin layers of parallel laminated fine sand and/or clay. Current ripples and shallow channels or troughs filled with small-scale cross-bedding also occur.
The units and subunits form a continuous sequence, from deep lacustrine conditions without influxes of coarser material to an environment dominated by sedimentation from turbidity currents, and the various subunits can be interpreted in terms of facies (C, D and E) as proposed by Bouma (Reference Bouma1962). Such a sequence can be interpreted (1) spatially, from a central position in the glaciolacustrine basin via the basin slopes with turbidites to the nearshore region where meltwater flows into the lake and a more or less fluviatile mode of deposition dominates (e.g. Walker, Reference Walker1978) and (2) chronologically, with increasing influence of deposition from turbidity currents and flowing water caused by decreasing water depth as the basin progressively fills. Because the Elsterian deposits are not in situ, and the boundaries between units often consist of faults or other discontinuities, it is not possible to distinguish between the two modes of deposition.
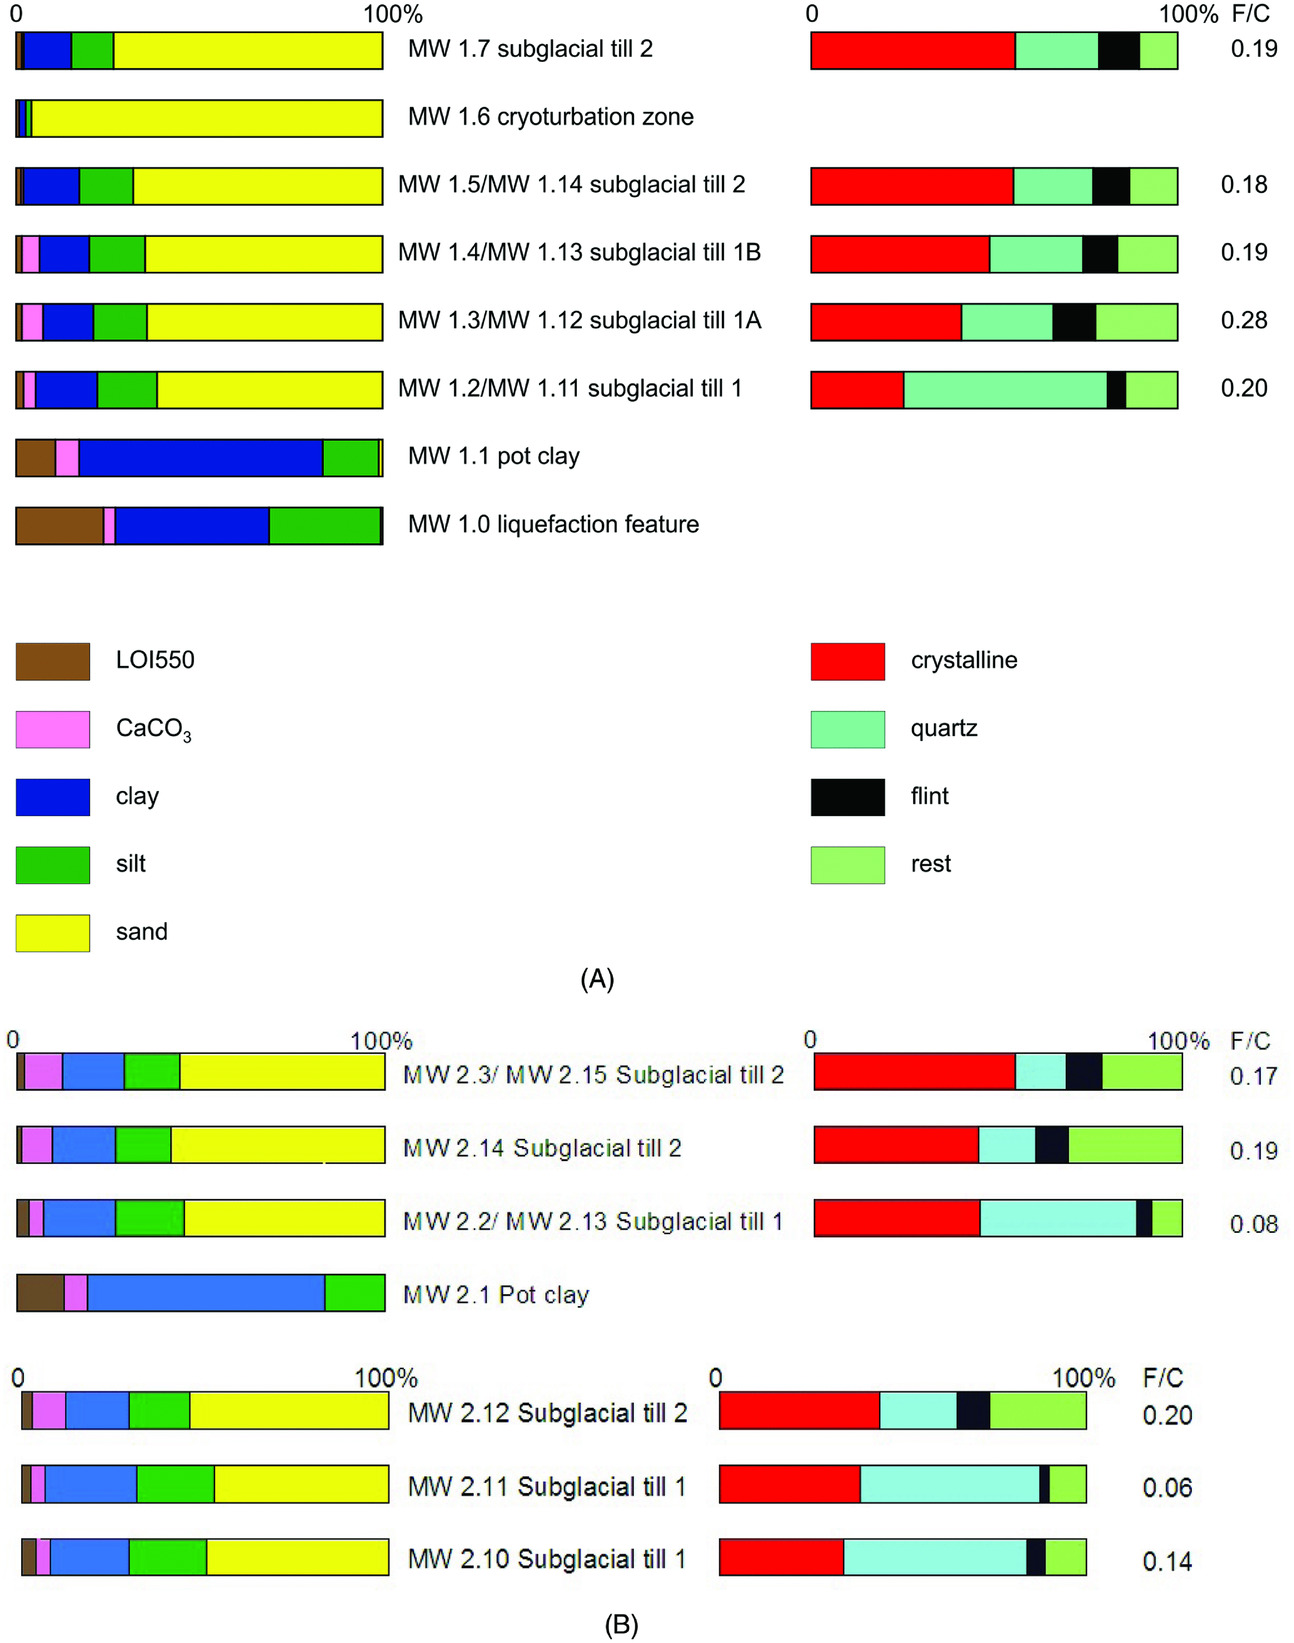
GSA and TGA measurements indicate slight variations in the lithological content of the glaciolacustrine clay. In both 2011 trenches the lowest unit exhibits 80% clay and 20% silt where the pot clay in trench 2011-3 shows 2% sand content in contrast to 0% in trench 2011-1 (Fig. 5B). The grey silty clay in the intrusion has a more silty texture with 57% clay, 42% silt and 1% sand (sample MW1.0). According to the TGA measurements, organic values are more than doubled in the grey clay in the intrusion (23–10%) while the carbonate content is considerably less with respect to the surrounding pot clay (4–7%) (Fig. 5A).
(A) 2011-3 exposure: grain-size, TGA and fine-gravel (2–4 mm fraction) analysis of samples MW 1.0–1.7 (from old to young). Subglacial till 1 has a higher quartz/crystalline ratio, than subglacial till 2 and intermediate layers. There is an increasing sand content going upwards from till 1 to till 2. Sample MW1.7 is a duplicate of MW1.5. Samples MW1.11–MW1.14 are duplicates (control samples) of samples MW1.2–1.5; all represented values are averages of the two samples. F/C = flint/crystalline ratio. (B) 2011-1 exposure: grain-size, TGA and fine-gravel analysis of samples MW2.1–2.3, 2.10-2–12, 2.14 in two separate sections. In both sections subglacial till 1 layer had a higher quartz/crystalline ratio than subglacial till 2. In both sections subglacial till layer 2 shows a (much) higher rest gravel content, higher F/C ratio and higher sand content than subglacial till layer 1. See (A) for legend.
Structures
Near-vertical slabs can be observed almost everywhere in the sections, in particular where the clay occurs (Figs 4A, 6 and 7). Where sandy subunits are present, the overall structure appears slightly more complicated, with remnants of synclinal folds (Fig. 4B). The parallel and small-scale cross-lamination together with top–bottom criteria relations, suggest that the original orientation of the lamination must have been horizontal, and that the deposits become younger in the SE direction. In trench 2011-1 it has been observed that all the turbidite deposits have been rotated, up to a vertical position (Fig. 4A).
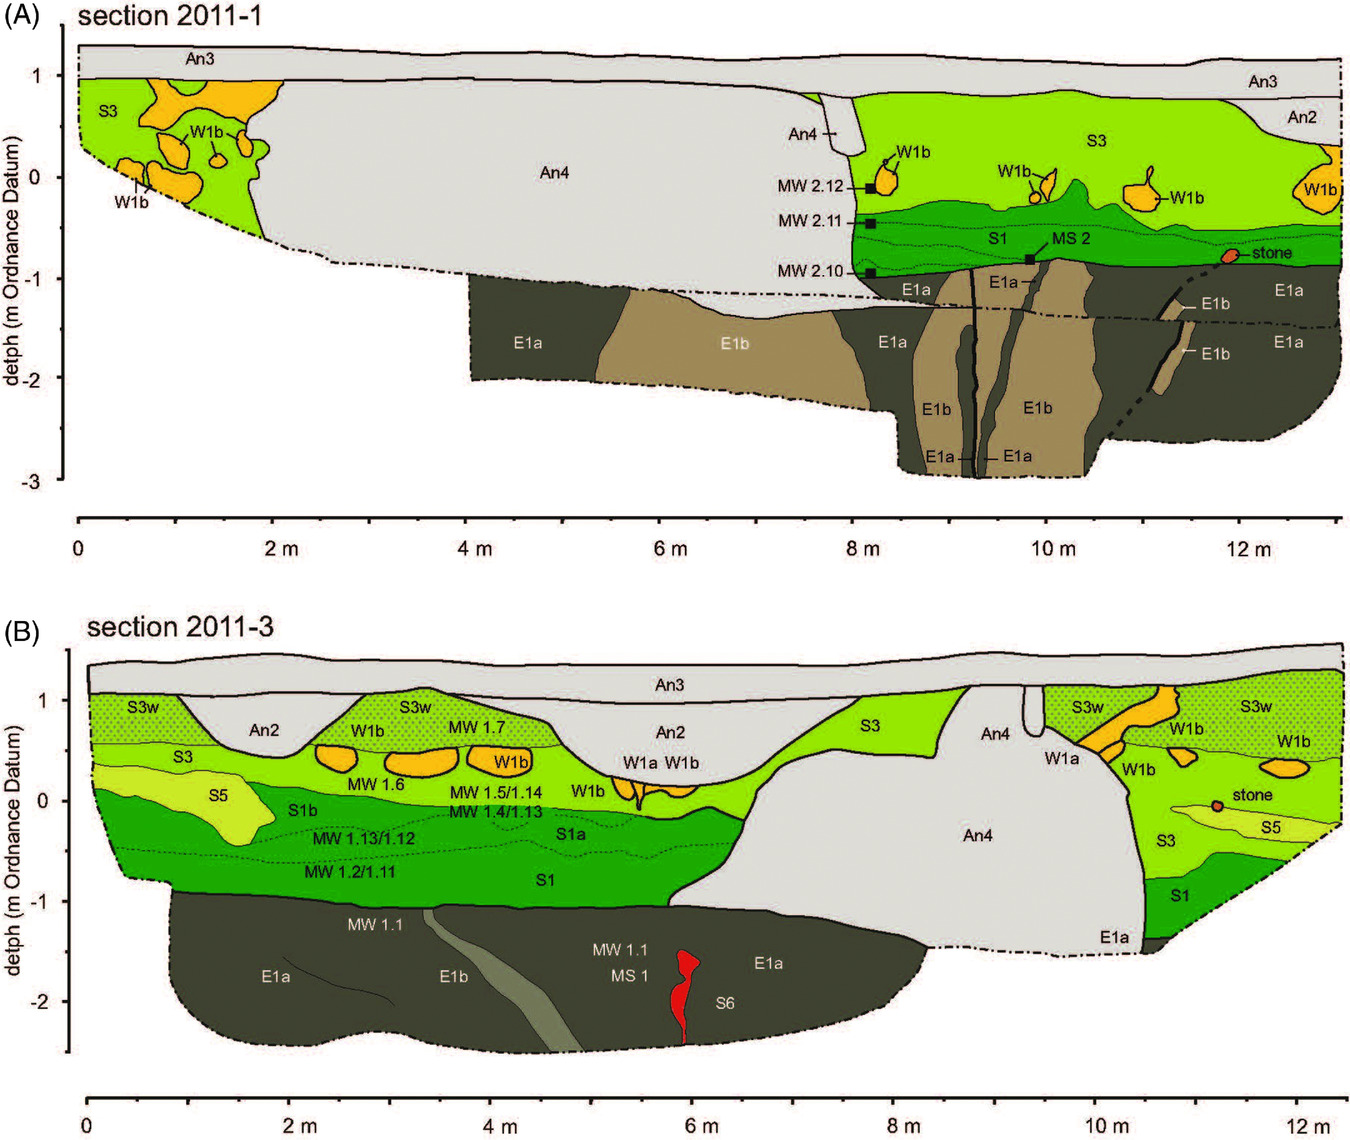
(A) Lithostratigraphy of Elsterian (E), Saalian (S) and Weichselian (W) sediments of trench 2011-1. The Elsterian deposits (E1 and E3) have been pushed in almost vertical position. Subglacial tills 1 (S3 dark green) and 2 (S3 light green) are on top of each other, differing in a higher sand content of till 2 (S3 light green). (B) Lithostratigraphy of Elsterian (E), Saalian (S) and Weichselian (W) sediments of trench 2011-3. E1: clay; E2: slightly sandy clay. S6: vertical intrusion in a 3-D ball-shaped form (Fig. 10A); S1: lower till; S1a and S1b: intermediate deformed till layers (see Fig. 5A); S3: subglacial till layer 2 (with sandy sheath folds (S5)); W1b: discontinuous sand layers that are interpreted as Weichselian involutions. S3w: weathered upper part of the upper till.
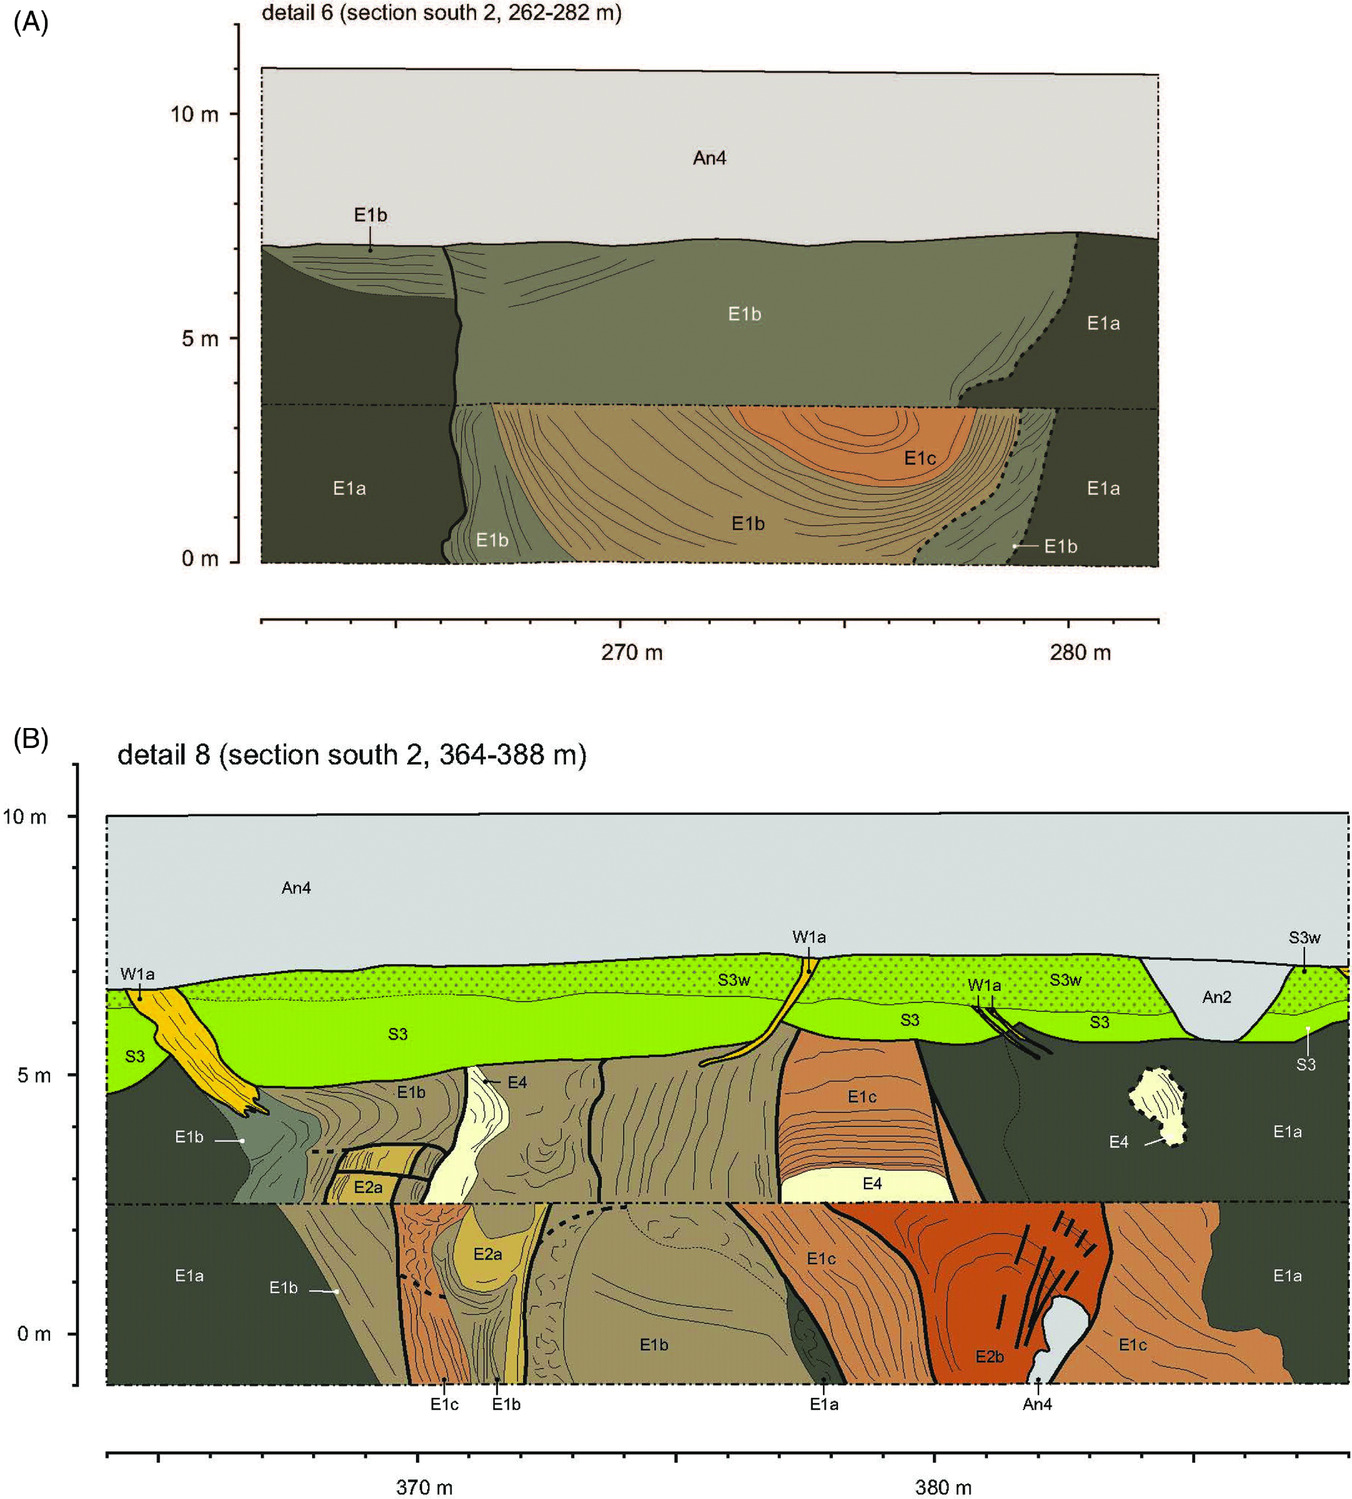
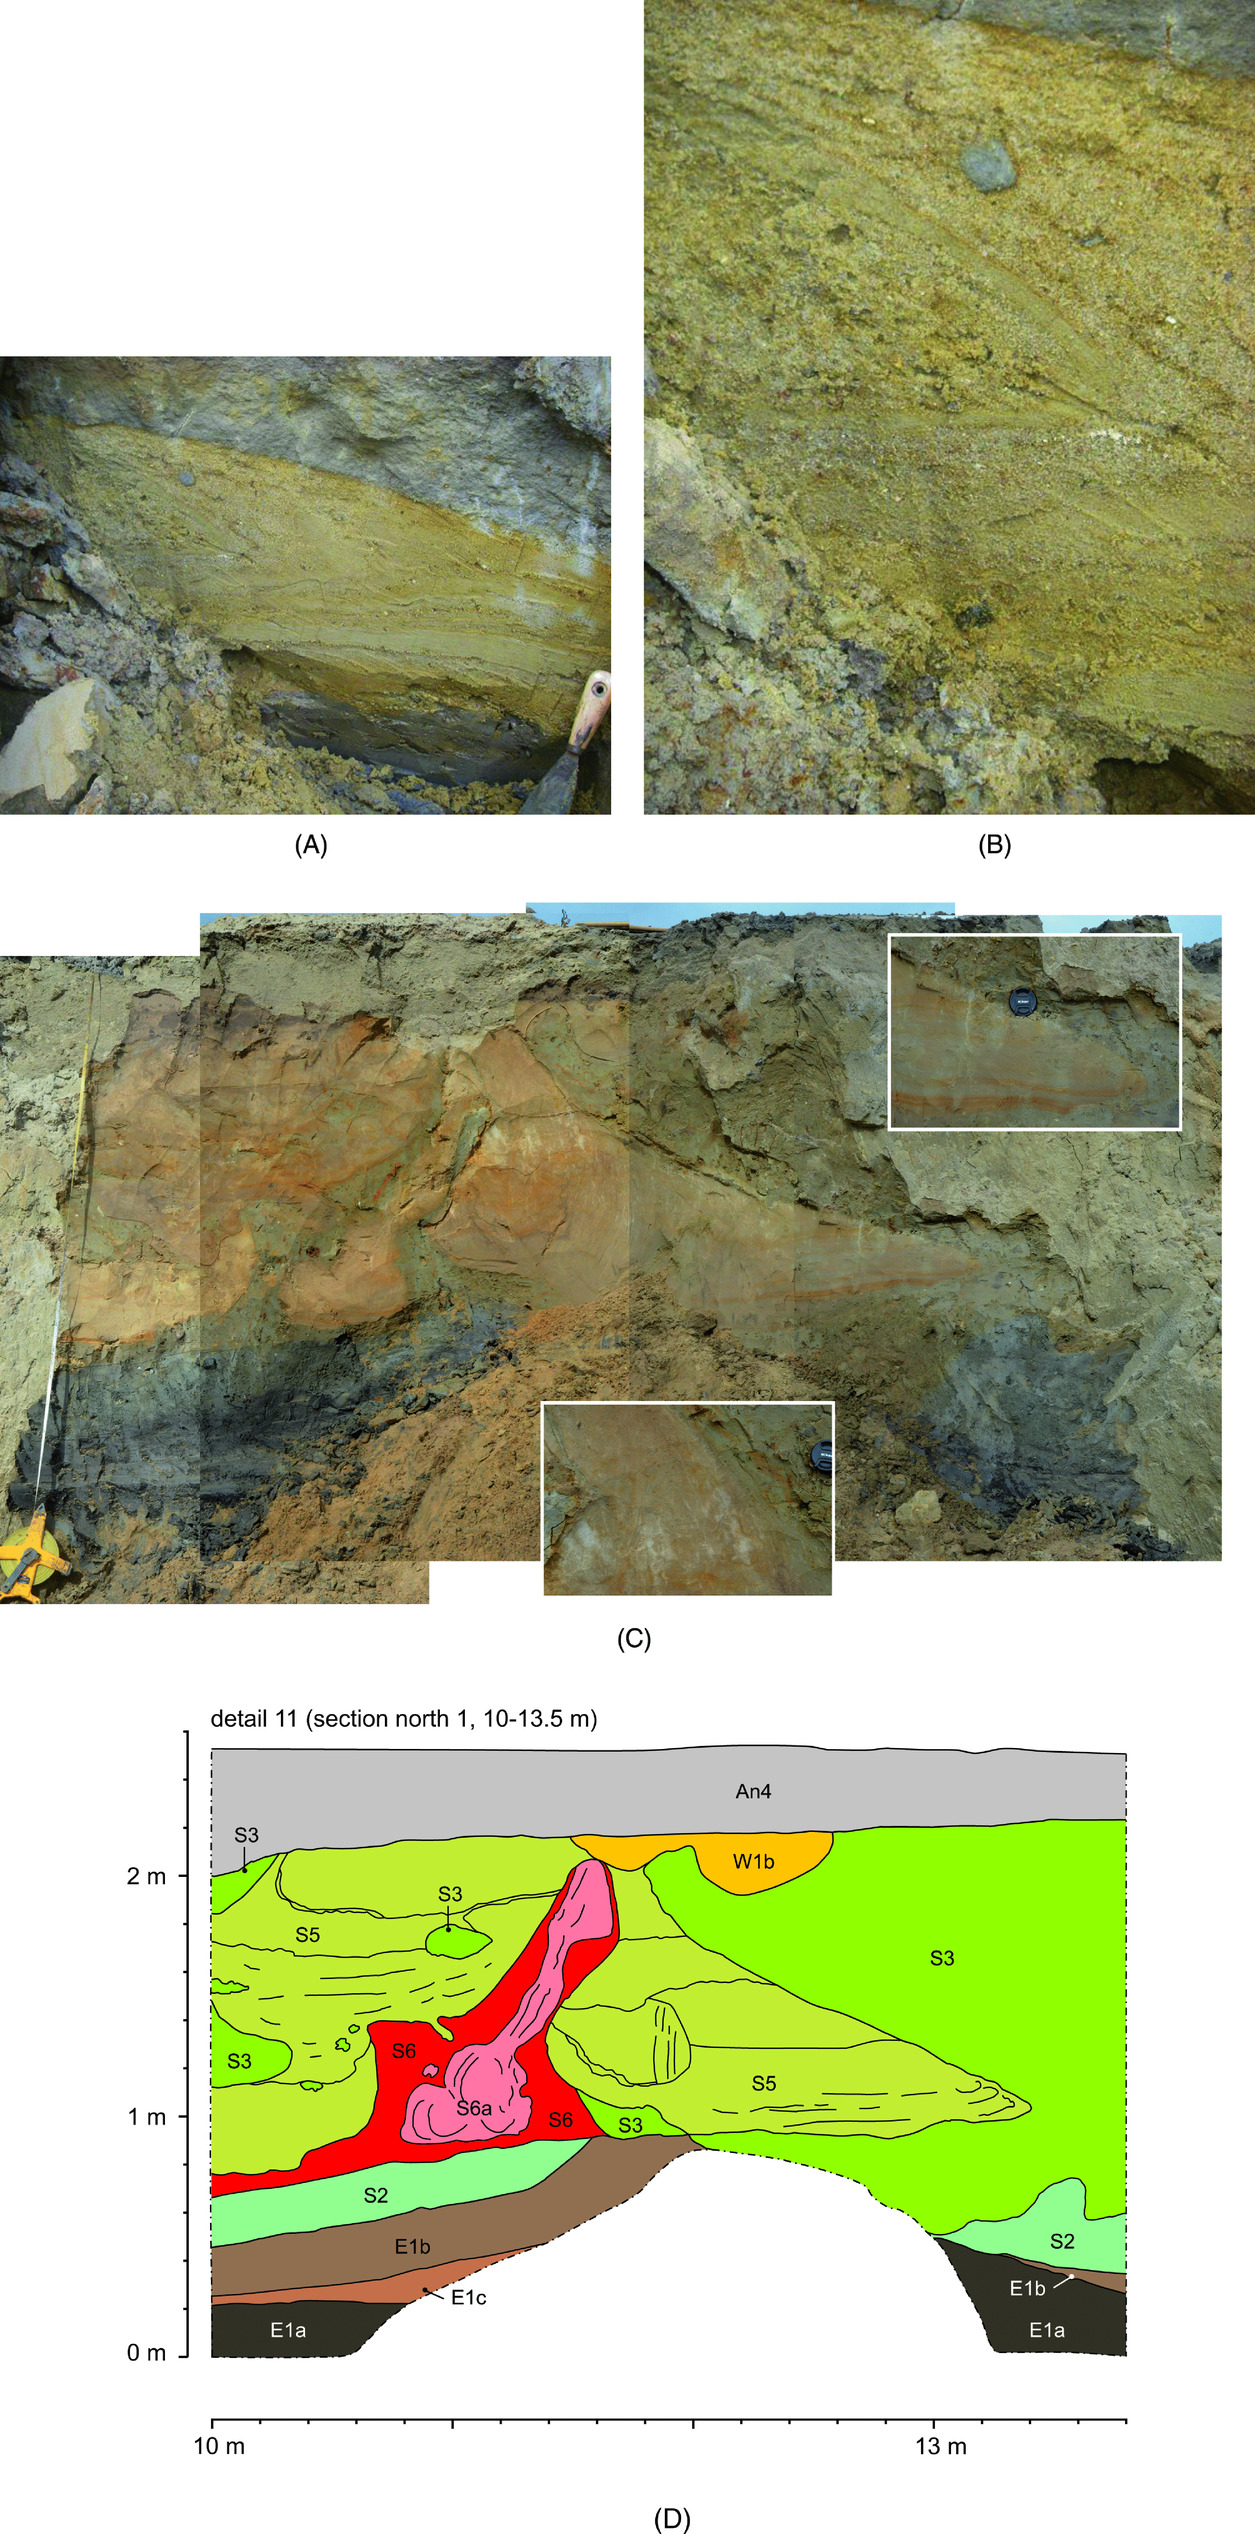
(A) Lithostratigraphy and glaciotectonics of Elsterian sediments of trench 2014 south 2, detail 6. Synclinal structure with sandy clays (E1b) and sands (E1c) in the core of the structure. (B) Lithostratigraphy and glaciotectonics of Elsterian (units E) and sediments of trench 2014 south 2, detail 8: the layered units have a near-vertical attitude, caused by continuous compressional folding causing overprinted folding and attenuated layering.
In the 2014 trench, and in particular on the floor of the fully excavated lock basin, relatively small (max. 10 × 5 m) ‘rafts’ or floes of distal turbidite beds are present, floating in a matrix of massive dark-brown clays. However, the presence of these rafts, in which the bedding planes usually are (sub)vertical, suggests that the dark-brown clays have been deformed in a similar manner. The lack of visible layering within these clays prevents recognition of separate ‘rafts’ and boundaries or faults between clay rafts but does not rule out intense deformation style (cf. Van der Wateren, Reference Van der Wateren1992).
Where the lithology of the subunits permits (e.g. in the sandier units with distinct bedding), other large-scale deformation structures have been observed. In particular in the elongated 2014 trench, several fold-like structures are detected (Fig. 4B). In overview the basal unit, as observed in the southern wall of the 2014 trench, is a strongly folded and faulted sequence, whereby overturned and recumbent fold types may produce the vertical attitudes of e.g. the distal turbidite deposits (Fig. 7B).
Glaciotectonic measurements within the glaciolacustrine clay show oriented bedding planes with dip direction / dip angle values 120/28 and 105/22 (trench 2011-3). Dip directions and dip angles of sedimentary layering in the turbidite deposits in trench 2011-1 measure 320/45, 120/58, 128/88, 090/58 and 118/62. A reverse fault, causing a stratigraphic ‘repetition’ of the turbidite deposits, has a dip direction / dip angle oriented 130/64. The measured structures in both 2011 trenches indicate a movement in the NW–SE direction, with a vergence towards the NW (Fig. 8B).
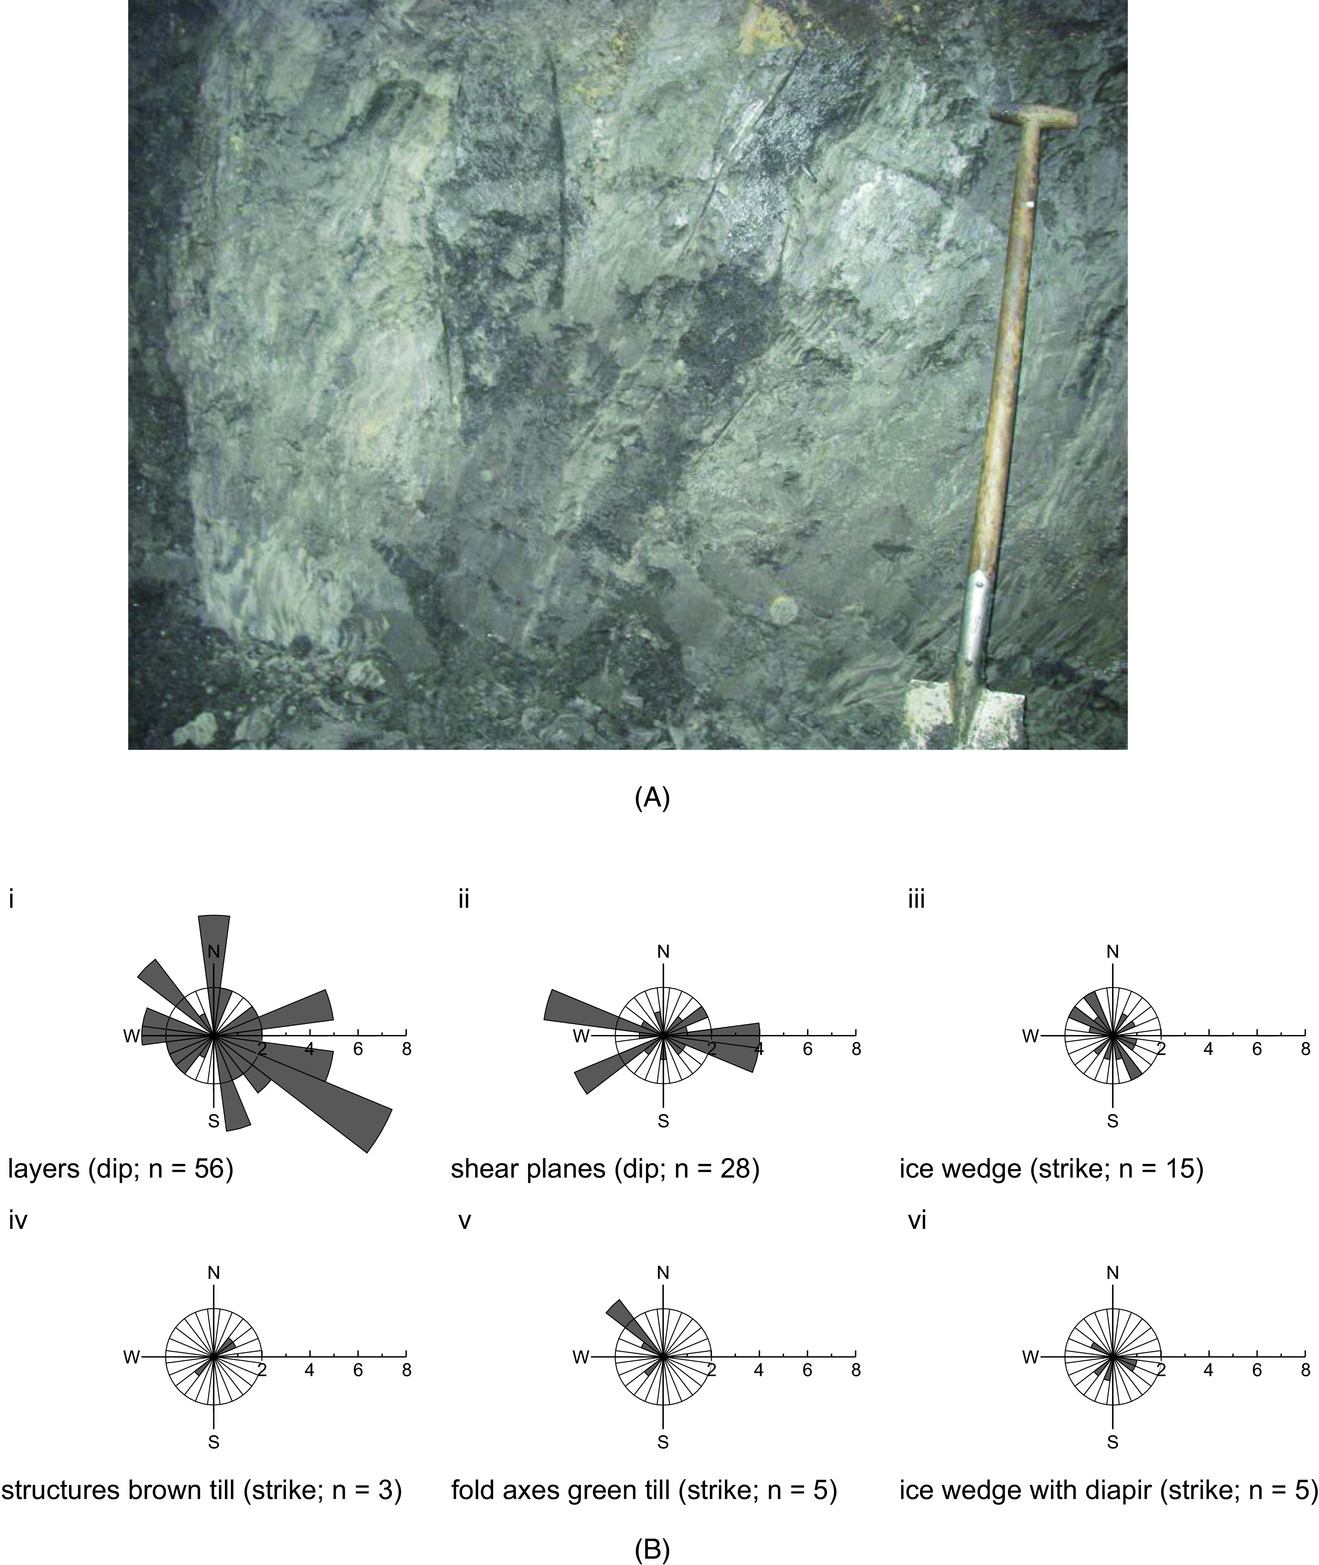
(A) Glaciolacustrine clay with dark homogeneous clay layers (dark-coloured bands) showing a reverse fault in the centre of the photo, with fold axis orientation 130/64. (B) Glaciotectonic measurements in the glaciolacustrine clay as well as till layers plotted in rose diagrams: (i) strike-dip measurements on sedimentary bedding planes in the glaciolacustrine clay; (ii) strike-dip measurements on shear- and other fault planes in the glaciolacustrine clay and till layers; (iii) strike measurements on ice wedge structures; (iv) structural planes of the lower till; (v) fold axes of sheath folds of the upper till; (vi) strike measurements on ice wedge structures with diapirs.
The 2014 trench (overview) clearly shows a strongly folded and faulted appearance of the glaciolacustrine clay, including recumbent folding (Figs 4B, 7A and B). All folds show at least one set of faults that overprints the compressed structures, indicative of the large-scale (regional) shortening style of this deformation. The observations of trench 2014 point to a compressional tectonic style, with a slight vergence towards the NW (Fig. 8B).
In trench 3 (2011) the brown-black pottery clay has a massive structure, does not appear to be rotated and has a ‘grainy’ and compact appearance. Next to the dark-coloured pottery clay a grey silty clay with a heterogeneous appearance is observed in discrete localities. Dip directions and dip angles in trench 3 of this grey sandy, loamy clay measured in 2–3 mm thick laminae, interpreted as oriented bedding planes, are 120/28 and 105/22 (Fig. 6B).
In trench 3 the intrusion of grey clay has a 3-D ball-shaped form, where the clay exhibits calcareous concretions of loamy clay. The ball shape shows no continuation upwards, while downwards it is connected to an irregular, discontinuous, cm-thick near-vertical layer (Fig. 9A). The irregular form has been interpreted in the field as an intrusion from below and is based on its position below the lower till, classified as a type 1 intrusion (Fig. 6B, location S6).
Microstructural analysis on a sample from the rim/boundary of the intrusion has a twofold appearance: 1. isolated banded appearance, clearly macroscopically recognizable; 2. multiple zonated ‘pervasive’ appearance, in a ‘zigzag’ geometry e.g. of lithological boundaries, clearly microscopically recognizable (Fig. 9B).
Microstructural observations describe sediment clasts with differently oriented fabrics, implying that the intrusion process took place after initial deformation. In addition, the intrusion shows a faulted pattern at its margin, implying a deformation phase after the intrusion took place, although this pattern might also be the consequence of the intrusion itself (Fig. 9C).
Saalian: glacial deposits (Drente Formation, Gieten Member): stratigraphy and structures
Overlying the Elsterian deposits is a multi-layered complex of Saalian tills and associated liquefaction features, that belong to the Drente Formation, Gieten layer (Bakker et al., Reference Bakker, Den Otter and Weerts2003). In both the 2011 trenches a lower till and an upper till layer are present (Fig. 6A and B). Locally, the till layers can be subdivided into separate layers. In the large 2014 trench this till stratigraphy is observed on a larger scale showing laterally e.g. a thick sequence of tills in the west, a zone of pushed pottery clay devoid of till in the centre, and a discontinuous till in the east. In the eastern part of the 2014 section, the till exposure is rather continuous, and shows only the upper till of the two-layered till sequence of the 2011 pits.
Lower till (subglacial till 1)
The lower till layer is an olive-black slightly sandy clay to sandy loam with a low gravel content, in sharp contact with underlying glaciolacustrine clay (Fig. 9A). Isolated lenses of sand and loam occur, such as an 8 cm thick lens of black sandy loam at the contact with the Elsterian clays, as well as an isolated olive-brown strong sandy loam lens higher in the layer (trench 1, 2011). Lenses of green sand also occur in the lower till. In the extended 2014 trenches it appears that the lower till is rather discontinuous: it has only an isolated lateral appearance over 40–50 m length in the southern wall of the 2014 trench, and an even smaller appearance of <10 m in the central part of the 2014 trench (Fig 7A and B).
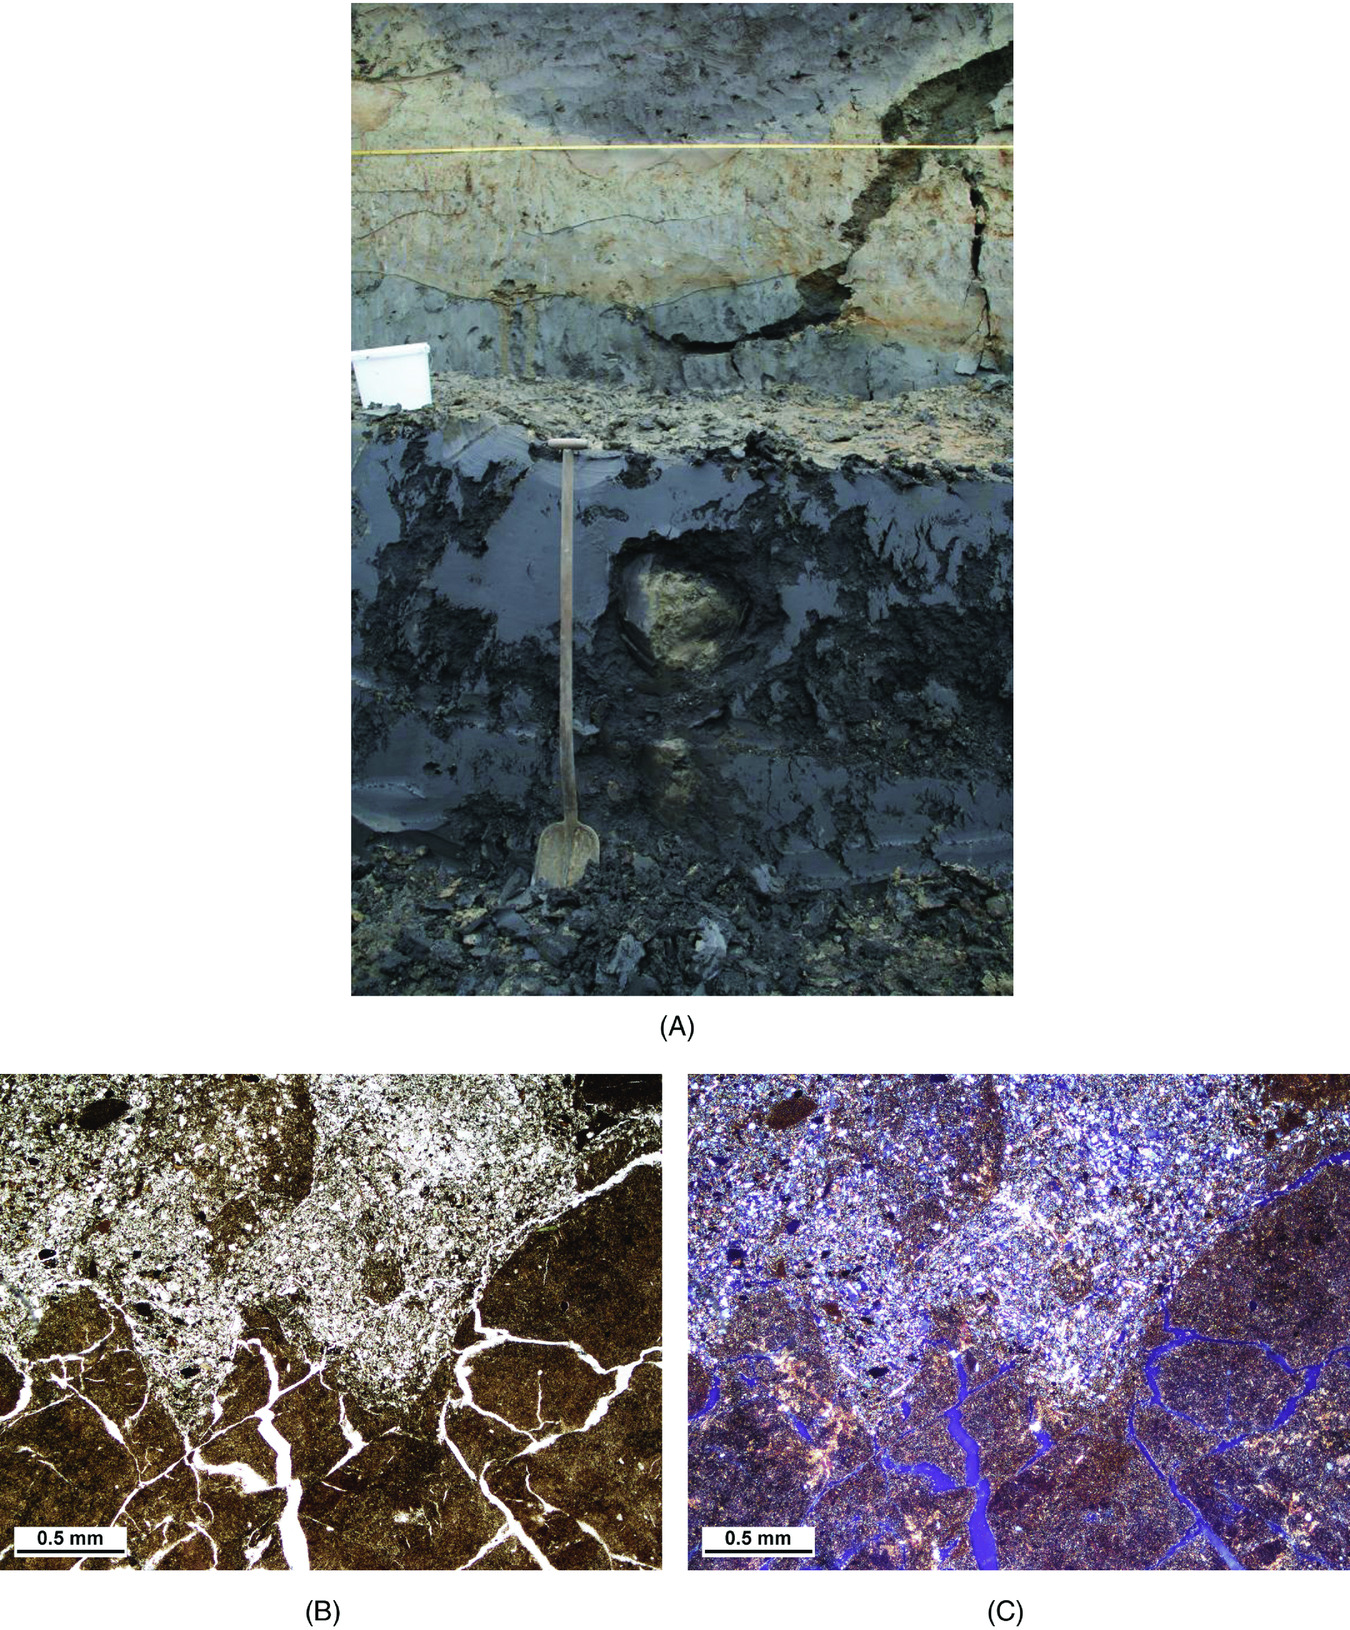
(A) Lithostratigraphy of trench 2011-1: Elsterian glaciolacustrine clay at the base with a ball shape of light-coloured silty clay that has been interpreted as an intrusion. The contact between the glaciolacustrine clay and the Saalian till is near the white bucket. Above the contact the lower ‘dark’ till is overlain by the upper iron-mottled ‘green’ till, that has been subdivided into multiple sublayers in this section.(B) Thin section of sample MS1 showing the boundary between the intrusion and the glaciolacustrine clay, showing a ‘zigzag’ geometry, implying faulting (Plane Light; for location see MS1 in Fig. 6B). (C) Thin section of sample S1-34 showing the boundary between the intrusion and glaciolacustrine clay (X POL Light). High birefringence (= difference in refractive index under microscope) is observed parallel to the faulted boundary intrusion, at right angles fitting in the ‘zigzag’ geometry, as well as in intermediate zones of low birefringence. Note also the corresponding rectangular pattern of micro-voids supporting the tectonic structure.
The fine-gravel content in the lower till of both trenches 2011-1 and -3 is clearly dominated by quartz (48–54%) and to a lesser extent by crystalline rocks (29–41%) (Fig 5A and B). Grain size of the lower till consists of 64% sand, 18% silt and 18% clay. The organic content of the lower till is slightly higher in trench 2011-3 compared to trench 2011-1 (on average, 2.1 vs 1.1%), while the carbonate content appears to be similar in both pit trenches (on average, 3.3 vs 3.4%). The F/C content is variable in the lower till, ranging from 0.16 to 0.20 in pit trench 2011-3 (Fig. 5A) and between 0.14 and 0.60 in trench 1 (2011) (Fig. 5B). The high quartz and low crystalline content for the lower till is confirmed with qualitative gravel analysis from the 2014 trenches.
Above the lower till in pit trench 3 (2011) two till sublayers occur that slightly differ macroscopically from the lower till in content and colour (Fig. 6B): an olive-black strong sandy loam (Dr1a) below an olive-brown strong sandy loam (Dr1b). Both sublayers are dominated by crystalline material that is increasing upwards (Fig. 5A). The distinction between the two sublayers is further illustrated by the F/C content: 0.28 for till layer 1A and 0.19 for till layer 1B. The high F/C number for layer 1A illustrates the relatively high flint content of this sublayer (Fig. 5A and B).
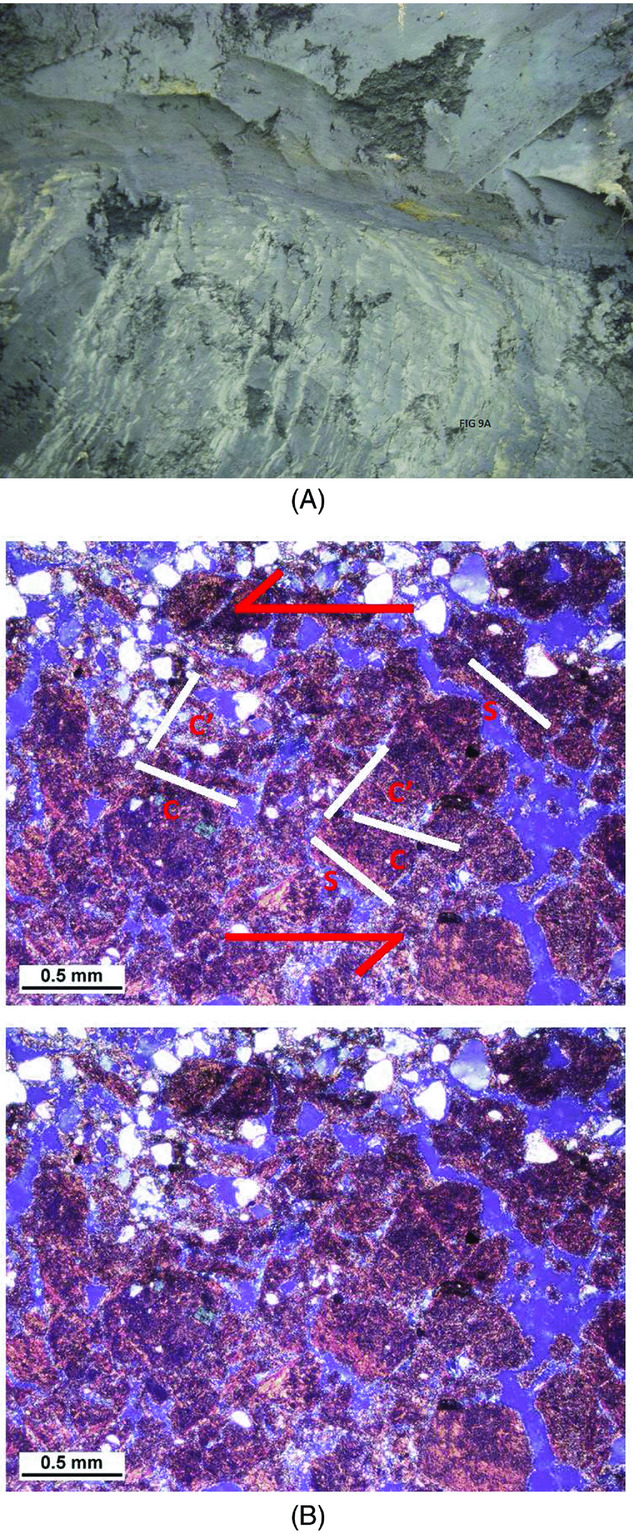
The general orientation of discontinuous isolated, elongated sand lenses (boudins) in the lower till of pit 2 (2011) is 045–225°. The sand lenses have been interpreted as sheath folds; one fold has an axis orientation of dip direction / dip degree 054/03 (Fig. 8B). Shear structures deforming at the base of the till may form shear planes as well as shear folds that all point to movement towards the SW (Fig. 8B). Microstructural analysis shows under crossed polarizers a typical subglacial shear zone of progressive simple shear: the c (spaced antithetic cleavage) orientation of the s (continuous cleavage)–c–c’ shear zone is visible in the narrow zone between the lower till and the Elsterian clay (Fig. 10A and B). The type of shear zone structure compares to ductile shear zones commonly referred to in hard-rock settings (Van der Wateren et al., Reference Van der Wateren, Kluiving, Bartek, Maltman, Hubbard and Hambrey2000; Kluiving, Reference Kluiving2001; Van der Meer & Menzies, Reference Van der Meer and Menzies2011; Menzies et al., Reference Menzies, van der Meer and Ravier2016).
(A) Sharp contact between lower till and (vertically) pushed glaciolacustrine clay below, showing folded nature of subglacial shear zone at the contact. (B) Thin section of sample MS-2 shows the shear zone between the lower till and the Elsterian displays (i) above a high birefringent matrix with sense of shear a continuous cleavage (s), cisaillement planes parallel to the shear zone boundary (c), and a spaced antithetic cleavage (c’) in a s–c–c’ shear zone (annotated, under crossed polarizers), and (ii) below image repeated without annotation (under crossed polarizers); see Figure 6A for sample location.
Upper till (subglacial till 2)
The upper till is a grey to greenish-grey diamicton, discordantly positioned on top of the lower till. In trench 2011-3, sand lenses interpreted as large sheath folds are present within the upper till (Fig. 11). In trench 2011-1, the upper till is a variably sandy and slightly gravelly loam. The colour is dark olive grey to yellow. Sheath folds and sand lenses are absent. In the large 2014 trench, folded intrusions occurred, 50–100 cm wide, that most likely represent sheath folds.
(A) Medium-scale sheath fold structure within the upper till layer (2011-3 pit). Sheath fold structure has a sand lithology. (B) Detail of the characteristic ‘eye’ structure of fine-grained ‘loamy’ layering in the central part of the sheath fold structure (2011-3 pit). (C) Large-scale sheath fold structure in the upper till layer overprinted by a dark-grey type 2 intrusion in the lower left corner see also overview in (A). The centre bottom inset shows near-vertical layering in the ‘eye’ of the sheath fold; the right upper inset shows first phase of sheath folding of the sand in the upper till. (D) Schematic section showing upper till with large sheath fold (S5) consisting of sand lithology, overprinted by a younger intrusion (S6, 6a) that appears to originate from the basis of the sheath fold structure (2014 pit).
The gravel in the upper till is dominated by crystalline gravel (55–56%) in trench 2011-1 (samples 2.3, 2.14, 2.15), and up to 67% in trench 2011-3 (samples 1.5, 1.7, 1.14) (Fig. 5A and B). In 2011-1 the upper part of the upper till, located in the cryoturbated zone (Fig. 5A), is less dominated by crystalline gravel (42–44%; sample 2.12). The F/C values for all samples in the upper till are moderately high (just below 0.20). In general, the upper till contains twice as much gravel as the lower till.
The upper till has a sand content of 73–75%, the highest sand content of all units (MW 1.7, MW2.15; Fig. 5A and B). While the carbonate content shows no trend, a clear upward decrease in organic content is observed in all sampled sections (Fig. 5A and B).
In trench 3 (2011) as well as in the 2014 pit, a series of folds in a sand matrix are present in the non-cryoturbated upper till, verging towards dip direction N240E, while the fold axis measures dip direction N315E (Figs 8B and 11A–D). Although a N240E dip direction could mean that the main deformation was towards the SW (coming from the NE), this reasoning does not hold true for the so-called sheath folds (Kluiving et al., Reference Kluiving, Rappol and Van der Wateren1991). Sheath folds always have a fold axis that is not at right angles but parallel to the principal deformation direction (Boulton, Reference Boulton, Rose and Menzies1987). Characteristic ‘eye’ structures result from isolated fold shapes that have been extended in the direction of deformation. Other measured fold axes, almost always in sandy matrices, clearly point to a NW–SE strain component, with a main principal deformation direction from the NW (Fig. 8B).
Within the upper green till a second type of intrusion is found, that is interpreted to be deformed by sock folding, a longitudinally extended tube-like 3-D shape that is the result of high extensional strain (Fig 11A–D). Most type 2 intrusions consist of a well-sorted sand matrix. The intrusions appear to be systematically incorporated in the folded matrix of the till layer, as can be seen in the overview of the 2014 exposure. Spatially the type 2 intrusions occur concentrated and as singular intermittently clastic intrusions in the western part of the southern wall of the 2014 trench (Fig. 7B).
Weichselian: aeolian and periglacial deposits (Boxtel Formation): sedimentology and post-depositional deformation
In the upper part of the sections the till is a greenish-grey cryoturbated sandy and gravelly loam with large, up to 1 m diameter involutions. The base of the involutions occurs at the contact between Elsterian deposits and the overlying tills, testifying to the intensity of the periglacial processes. The sandy fill of these involutions consists most likely of coversand (Boxtel Formation; Schokker et al., Reference Schokker, De Lang, Weerts, Den Otter and Passchier2005). Frost cracks and sand-filled ice-wedge casts have been recorded, some of which reach down to several metres below the present-day surface and into the Elsterian clays. Several of these frost cracks and ice-wedge casts are developed in the tectonic strike and dip direction of the clastic intrusions (Fig. 8C; Table 1). The periglacial features probably date from the Weichselian Pleniglacial (Vandenberghe, Reference Vandenberghe1983).
Sequence of sedimentological and glacial events (n = 7) at the Midwolda glacial ridge as deduced from this study, showing event, (till) stratigraphy, gravel assemblage, stress type, main orientation of structures, and chronology. Till stratigraphy according to Rappol et al. (Reference Rappol, Kluiving and Van der Wateren1991) and Zandstra (Reference Zandstra1983a,b).

Geological cross-sections
According to geological cross-sections from DINO-loket (Fig. 12), the barchan-shaped Finsterwolde, Westerlee–Heiligerlee ridge, and Scheemda–Winschoten ridges all consists of pushed sequences of Elsterian sand and clay layers. These sections show >25 m deep glaciotectonic structures, indicating an overall compressive style of deformation (Fig. 13A). In contrast, the Midwolda ridge, and to a lesser extent the Beerta ridge, contain glacial till on top of the Elsterian sand-and-clay sequence (Fig. 13A–C). This till sequence is virtually absent on all other transverse NW–SE-oriented ridges (Fig. 13A).
Overview of Regis II v2.2 cross-sections Finsterwolde–Winschoten (Fig 13A–C) and Hesemann countings of erratic boulders in the vicinity of the Midwolda ridge; X indicates location of exposure of the Oosterhout Formation.
(A) D–D’ NE–SW cross-section shows ridge of Beerta with isolated plug of sandy Peelo Formation and Drente Formation (till) and the Westerlee–Heiligerlee ridge with thick isolated plug of sandy Peelo Formation. (B) A–A’ NE–SW cross-section shows Midwolda ridge with small isolated plug of sandy Peelo Formation covered with Drente Formation (till) sloping upwards to the SW. (C) G–G’ SE–NW cross-section shows Beerta and Midwolda ridges showing relatively steep slope on the SE part of the Peelo clay, as well as the shallow (5 m deep) basin between both ridges.
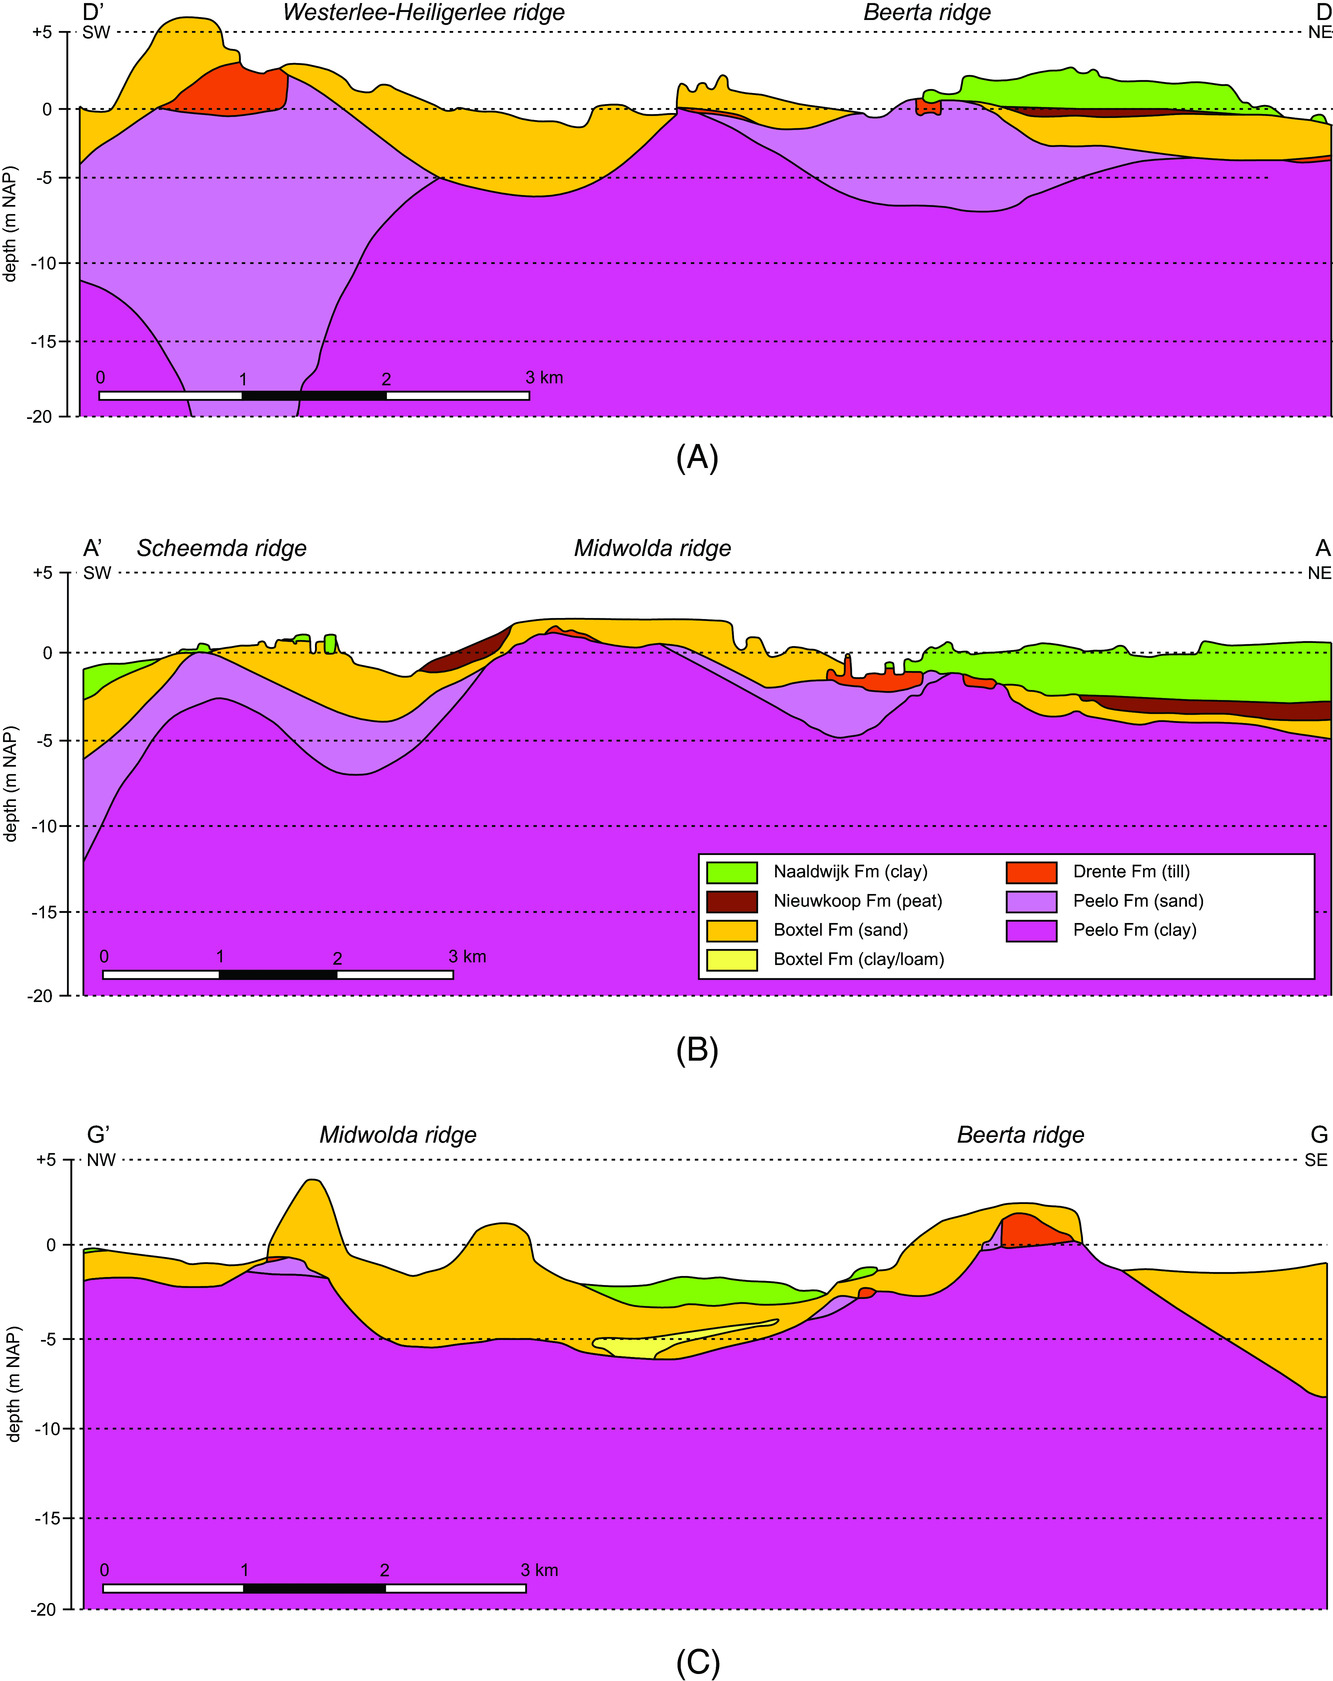
The Elsterian relief, presumably caused by deformation by Saalian glaciation, is quite distinct. Multiple ridges as well as a shallow basin just SE of the Midwolda ridge testify to a Saalian push mechanism. Also the SE slope of the Beerta ridge is relatively distinct, obliterated by thick Weichselian and Holocene deposits (Fig. 13C).
Discussion
This study shows that the glacial ridge of Midwolda contains deformed, pushed structures. The basal part of all trenches consists of the massive brown heavy clay, alternating with silty clay with sandy intercalations to sandy beds (Nieuwwolda Member, Peelo Formation). The unit is clearly deformed, as shown by the oblique to vertical position of the sedimentary layering. The glacio-tectonic structures point to a compressive style of deformation and a main deformation component from the SE to the NW (Fig. 4A and B). Given the similarity of the compressive style in Midwolda and several Saalian push moraines in the neighbouring German region (Van Gijssel, Reference Van Gijssel and Van der Meer1987; Van der Wateren, Reference Van der Wateren1992; Kluiving, Reference Kluiving1994; Kluiving & Van Balen, Reference Kluiving and Van Balen2014), it is assumed that the structures originated from a (lateral) ice-marginal pushing process, induced by glacial loading. A pushing mechanism is supported by the presence of a (shallow) glacial basin in the area of Midwolda and Winschoten (Fig. 2B). The compression preceded the type 1 intrusions and the deposition of the lower till. Liquefaction features in the upper part of the pottery clay, that are cut off by the overlying till unit, point primarily to overpressure in the pore water, potentially augmented by an extensional stress regime preceding or during the till 1 deposition (Fig. 9A).
Subsequent to the pushing process and liquefaction, the till 1 layer is deposited. Structures point to a NE–SW transport direction (Fig. 8B), which is parallel to the orientation of the Midwolda ridge. The fine-gravel content of the lower till shows a dominance in quartz, with a minor amount of crystalline gravel. Also the dark colour and clayey lithology of the lower till point to mixing with local sediment due to subglacial deformation. In addition, green-coloured sand lenses in this lower till may point to a provenance from locally exposed (<5 km east of the trenches’ location) glauconitic sands of the Pliocene Oosterhout Formation (Fig. 13). These observations indicate influence of local sediments on the composition of the till. The basal till in the 2014 pits shows laterally a high variation between pure clay and sandy lithologies (Fig. 7). The varied lithology of the lower till may also be explained by the exposure of the Peelo sand facies next to the clay facies caused by the pushing process.
Where the lower till is more fragmentary, the upper till is more continuous. Also the lithology of the upper till differs from the lower till with a higher sand content, and a different gravel composition rich in crystalline materials and relatively low in quartz (Fig. 5). Glaciotectonic structures are dominant in the upper till, such as the sheath folds that occur just below and within the till and that point to glacial overriding from the NW (Table 1).
The process of subglacial deformation is further illustrated by the presence of sublayers in the till, that have lithological compositions intermediate between both till types. It can be explained by subglacial deformation during deposition of the upper green till, leading to incorporation of sheath folds consisting of the lower till which results in a tectonic layering. When this process continued it would have resulted in a homogeneous till layer, until another lower till or sediment layer was incorporated and the cycle was repeated (cf. Boulton, Reference Boulton, Rose and Menzies1987; Kluiving et al., Reference Kluiving, Rappol and Van der Wateren1991; Van der Wateren et al., Reference Van der Wateren, Kluiving, Bartek, Maltman, Hubbard and Hambrey2000; Kluiving, Reference Kluiving2001; Menzies et al., Reference Menzies, Van der Meer and Rose2006, Reference Menzies, van der Meer and Ravier2016). The observations in all exposures, including the microstructural evidence, confirm these multiple and various stages in the process of subglacial deformation. Microfabric analysis points to evident structures typical for subglacial deformation, like (parts of) S–C and S–C–C’ shear zone fabrics, homogeneity and other features such as microscale water-escape structures (Kluiving, Reference Kluiving2001; Menzies et al., Reference Menzies, Van der Meer and Rose2006; Philips et al., Reference Phillips, Evans, Van der Meer and Lee2018).
The lower till has a large component of local materials like a dominance of quartz gravel and reworked pottery clay. Although erratic gravel counts are not conclusive, the lower NE–SW-oriented till can be tentatively interpreted as part of the Heerenveen Group (J. De Jong & H. Huisman, pers. comm., 2011; cf. Zandstra, Reference Zandstra1983a,Reference Zandstra and Ehlersb; Rappol et al., Reference Rappol, Kluiving and Van der Wateren1991). The Heerenveen Group interpretation is supported by the similar NE–SW directional features of the till on the Frisian–Drente plateau (Fig. 2A). The upper till with NW–SE tectonic directions and high crystalline gravel content is interpreted as the Assen Group (Hondsrug type). Morphological observations of the Midwolda ridge with attenuated NW–SE small-scale lineations combined with the till lithology support this interpretation. Results of erratic gravel counts on the eastern side of the study area show a dominance of Eastern Baltic erratic gravel assemblages, which would fit the Eastern Baltic origin of the upper Assen till (Fig. 12; Table 1). The upper Assen till was the last till to be deposited from the NW to the SE over the NE–SW-oriented fluted topography in the northern Netherlands. The characteristic red-coloured flint-poor Emmen type of this group is not present here. However, it should be taken into account that Hesemann type counting is usually performed on erratic gravels gathered at the surface, thereby potentially representing a mixture of the gravel of multiple tills (Fig. 12).
During the process of subglacial deformation and deposition of the upper till, intrusion (type 2) formation has taken place (Fig. 11C and D). The process of intrusions can be interpreted as syntectonic since the intrusion has been folded as sheath folds within the till layer. The fact that these folds are visible at all may very well indicate that the syntectonic folding process happened in the last stages of subglacial deformation. It is also possible that, given the nature of subglacial deformation, earlier phases of folding have been erased after repeated folding and attenuating of the liquefaction features until a massive matrix results.
The result of the longitudinally extended exposures of the 2011 and 2014 excavations over >1000 m allowed us to map till thicknesses, lithology and stratigraphy with respect to the elevation of this part of the glacial ridge (Figs 3 and 14). The lateral distribution of till with respect to the drumlinised northern part of the glacial ridge shows that no till is present on the glacial ridge or only minimal thicknesses, while thick till sequences are observed in the saddles, or stoss sides, between ridges. In the western part of the 2014 exposure, till is absent, where the Elsterian deposits are sand-rich and highly deformed in a compressive style and laterally continuous. This implies that the internal structure of the fluted terrain forms consists predominantly of deformed Elsterian clays and sands (Fig. 14). Furthermore, post-Saalian erosion over 120 kyr has to be taken into account (cf. Van der Meer & Lagerlund, Reference Van der Meer and Lagerlund2000) and may also have partly influenced the distribution of till.
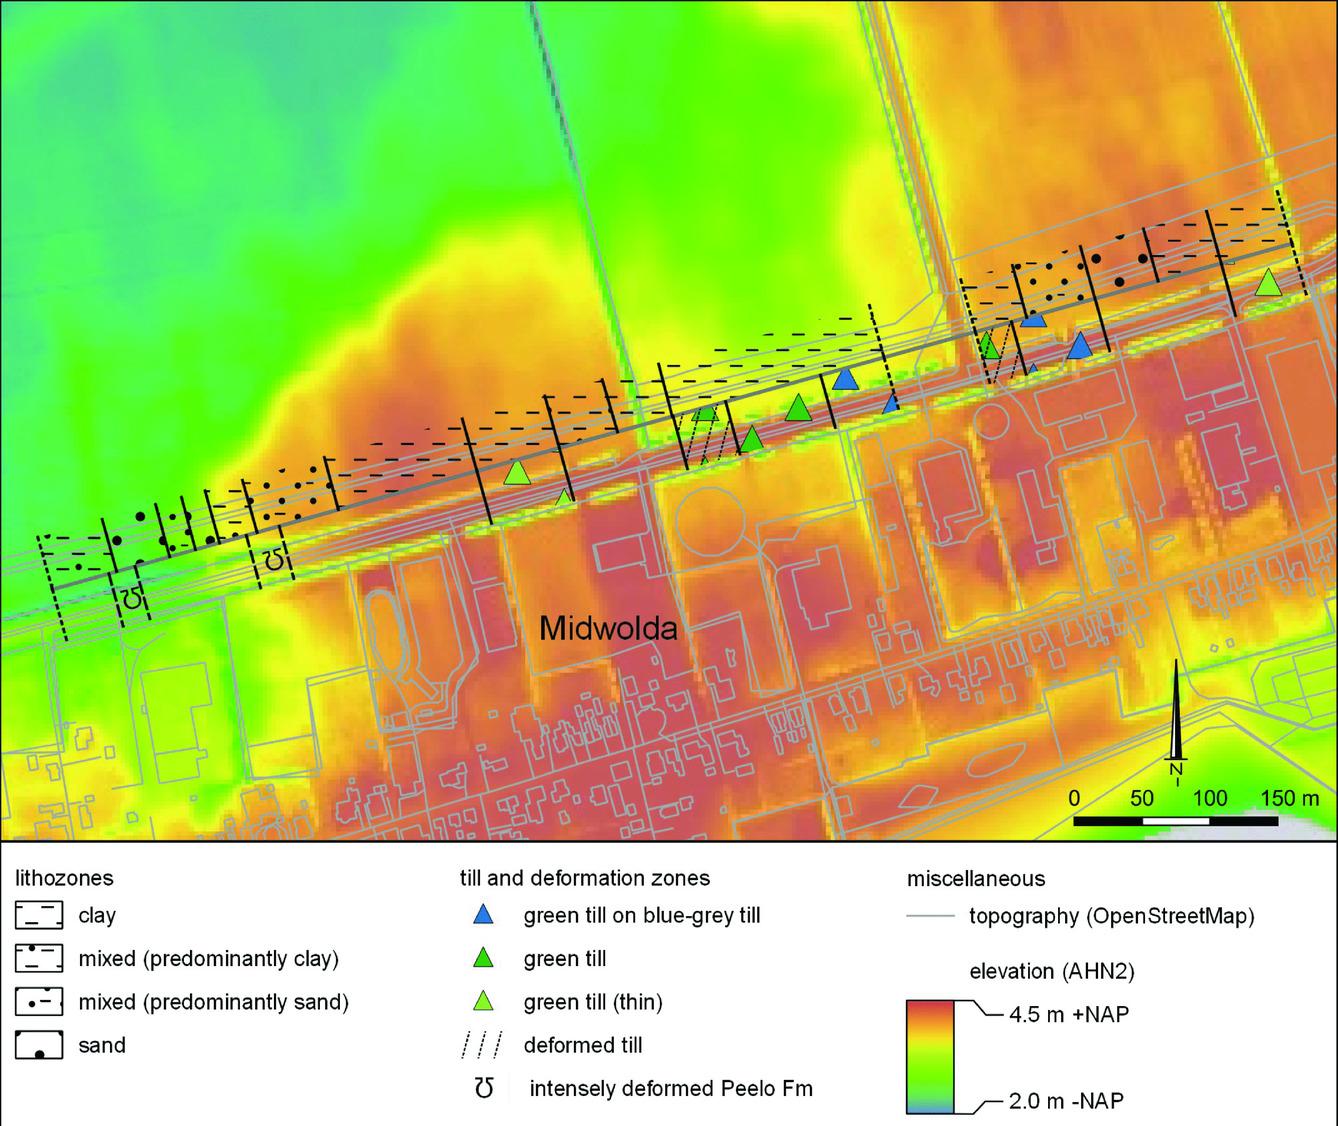
Structural and lithological map of Midwolda ridge showing lateral distribution of glacial tills as well as structural and lithological characteristics of Elsterian sand and clay.
During the last cold phase of the Saalian, about 200,000–130,000 years ago, land ice first approached the northern Netherlands from the NE (De Mulder et al., Reference De Mulder, Geluk, Ritsema, Westerhoff and Wong2003). Previous research has concluded that at the current location of Midwolda–Winschoten the lobe-shaped ice front created a horseshoe-type push moraine first, that was subsequently overridden by the land ice; a process that most likely deformed the push moraine to a complex of drumlinoids (Van den Berg & Beets, Reference Van den Berg, Beets and Van der Meer1987). Our data show that in the area of Midwolda, pushing has taken place from three sides, with a main push force from the SE (Fig. 1A). Because this direction is somewhat unlikely in this terrain, given the dominant ice movement from the NE, other explanations or models are needed (cf. Boulton, Reference Boulton, Rose and Menzies1987).
The glaciotectonic landscape development based on the results of this study indicates a pushing (compressional) phase, followed by two ice overriding (extensional) phases (Table 1). The wider landscape around Midwolda can be tentatively further interpreted as a result of lateral differences between fast and slow deformation phases (cf. Boulton, Reference Boulton, Rose and Menzies1987). The predominant morphological direction in this region is NE–SW due to fast ice flow initially over a fine-grained substrate consisting of Elsterian clay deposits. The geological cross-sections (DINO Loket) show that the two areas with transversal topography correlate with high topographies in the Peelo Formation (Figs 12 and 13). The Peelo Formation in these areas consists of sandy units of 5–10 m thickness on top of a clayey matrix. The depth of pushing reaches at least 25 m below the surface (Fig. 13A). This confirms the Boulton model, that the most significant compressive pushing occurs at the lithological contrasts of the substrate, i.e. the clay and sand of the Elsterian Peelo Formation. The presence of glacial till only in the NE–SW ridges of Midwolda and Beerta fits with the fast (Midwolda/Beerta) and slow (Finsterwolde/Scheemda-Winschoten) glacial flow model.
The pre-, syn- to post-glacial history in the region of Midwolda can be summarised in seven phases (Table 1): 1. Elsterian: glaciolacustrine sedimentation in deep lacustrine environments with distal clay to nearshore proximal turbiditic sandy deposits; 2. Saalian: ice-marginal pushing of glaciolacustrine sand and clay from a SE direction; 3. Saalian: first liquefaction shown by intrusions in various forms and sizes; 4. Saalian: drumlinisation or streamlining of the push moraine and deposition of subglacial till 1 from a NE direction; 5. Saalian: (small-)scale fluting and deposition of subglacial till 2 from a NW direction, as well as second liquefaction; 6. Weichselian: aeolian deposition; 7. Weichselian: cryoturbation.
The nature of the intrusions, including their apparent origin from below, allows them to be interpreted as clastic dikes in the (sub)glacial context (cf. Larsen & Mangerud, Reference Larsen and Mangerud1992; Kluiving, Reference Kluiving1994; Kluiving & Van Balen, Reference Kluiving and Van Balen2014; Philips et al., Reference Phillips, Evans, Van der Meer and Lee2018). Possibly clastic dikes originated when hydrostatic pressures reached a threshold value potentially caused by closed aquifer systems that are bounded by glaciotectonic structures and imposed by the pressure of overriding ice. In the push moraine complex of Itterbeck–Uelsen (Germany), 80 km south of Midwolda, clastic dikes have been observed in a sector where compression was highest against an existing pushed sequence (Kluiving & Van Balen, Reference Kluiving and Van Balen2014).
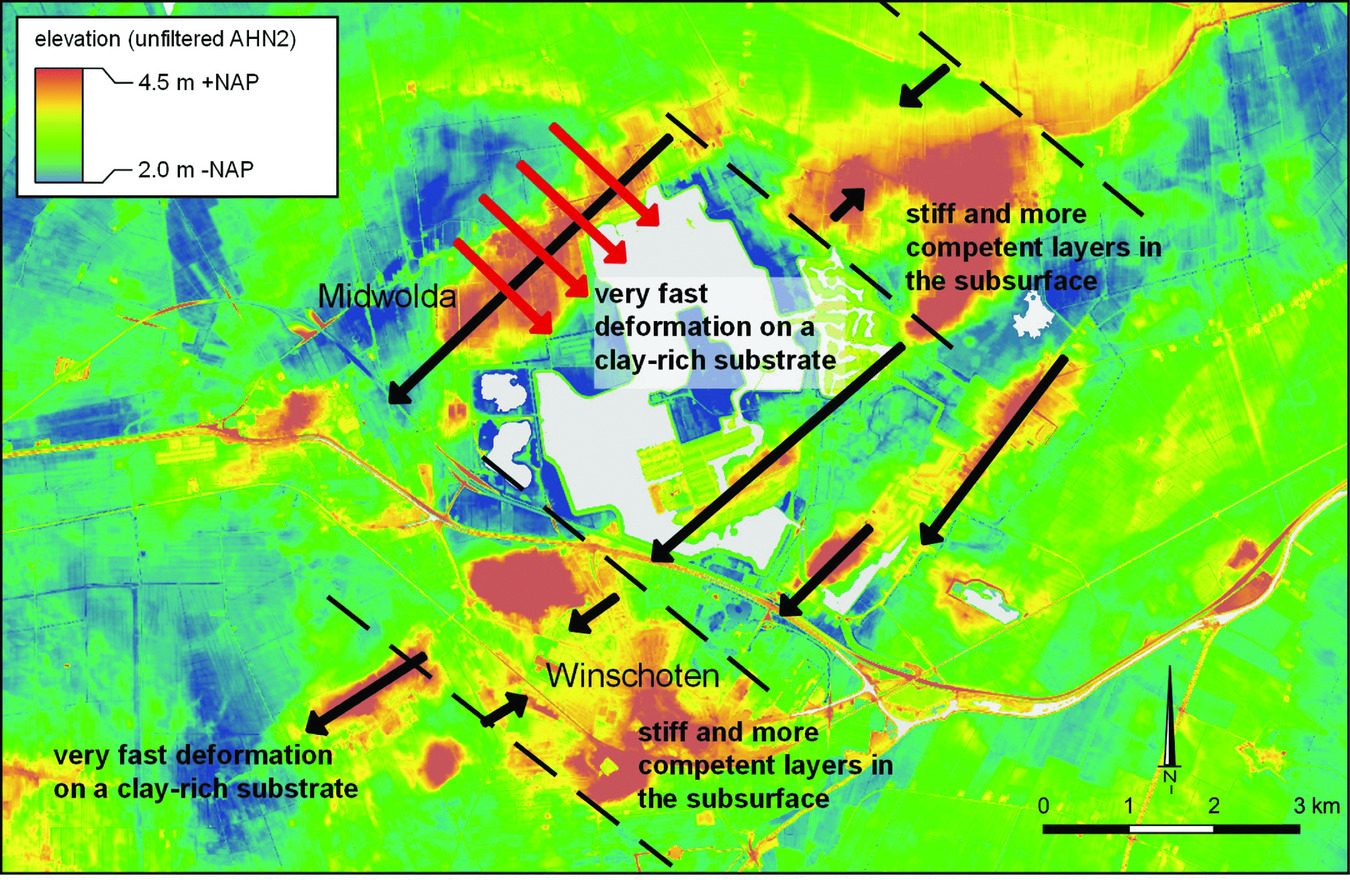
The regional impact of this study on the landscape development in eastern Groningen can be explained in terms of ice-flow behaviour, substrate variations and morphological changes (Fig. 15). The flat areas surrounding the isolated barchan shapes represent a subsurface where the ice sheet has produced high strain values, over which the subglacial sediment has been extended and ‘ smeared’ over considerable distances (Boulton, Reference Boulton, Rose and Menzies1987). These plains of ‘high strain’ also comprise the glacial elongated ridges with deformation till, like Midwolda, Beerta and other linear extensive streamlined landforms. The presence of large sand bodies of the Peelo Fomation in the topographic barchan-shaped highs of Finsterwolde and Winschoten, as well as the absence of till, explain the pushed compressive sequence and relatively low strain rates over a stiffer or more resistant substrate (Fig. 15).
Substrate-controlled glacial morphology reconstruction based on DEM and the results of this study. Zones with stiff and more competent layers in the subsurface show compressional pushed structures and are alternating with zones with an incompetent clay-rich substrate that show elongated isolated lineations all oriented towards a NE–SW ice-flow regime. The dashed lines represent the separation between the extensional and compressional zones. The short thick black arrows represent the direction of glaciotectonic shortening. The long black arrows represent elongated lineations like the Midwolda ridge. Superimposed, observed in the Midwolda ridge, are NW–SE lineations (red arrows) with associated till deposits that are classified as the Assen Group till (Rappol, Reference Rappol and Van der Meer1987; Rappol et al., Reference Rappol, Kluiving and Van der Wateren1991) with an Eastern Baltic gravel assemblage.
Conclusions
Elsterian sedimentary deposits around Midwolda range from coarse sands to thick clay layers which have been deposited in a lacustrine environment with turbidity currents. The observed Elsterian units are interpreted as part of Bouma sequences.
Cross-sections through the Regis/GEOTop (hydro)geological combined models demonstrate that on a macroscale (tens of km) the high Pleistocene areas of Finsterwolde and Winschoten contain thick Elsterian sand units in the predominantly clay deposits, indicative of glacial pushing.
The 25 m deep glacial pushing in the transverse ridges of Finsterwolde and Scheemda-Winschoten contrasts with the more shallow pushing of the sands and clays of the Elsterian deposits at Midwolda from the SE.
Two main types of till were deposited in the area. The lower till is variable in showing several substages of the subglacial deformation process with ice flow from the NE to the SW. The first till is classified as the Heerenveen type originating from a NE–SW ice-sheet movement. The lower till complex also reflects the drumlinisation and streamlining of the glacial ridge. The second upper till is correlated with the Assen type, belongs to a NW–SE ice movement, which correlates with the Hondsrug ridge direction, and is superimposed on the main NE–SW-oriented glacial relief.
Water-escape structures like clastic dikes appear to be a common phenomenon in subglacial contexts. At Midwolda, two phases of liquefaction are associated, one with the Heerenveen and subsequently one with the Assen till.
Future research on (temporary) exposures needs to explore the regional substrate variability in the area of eastern Groningen and its connection to the glacial ridge formation, to test if coarse substrates are tied to pushed structures and landforms while fine substrates are tied to elongated ridges and fast deformation.
Acknowledgements
Kay Koster (Deltares) is thanked for fieldwork assistance, fine-gravel analysis and field reporting on the 2011 field season. We thank Jaap van der Meer and an anonymous reviewer for constructive and helpful comments that improved the quality of the paper. Roel van Elsas (VUA) is acknowledged for providing us access to the ‘micro-lab’ of the Vrije Universiteit Amsterdam. We thank RAAP Archaeological Consultancy for field assistance and permission to use the data, and the City Council of Midwolda for largely funding the research in the 2011 and 2014 field seasons.
Supplementary material
To view supplementary material for this article, please visit https://doi.org/10.1017/njg.2018.16


