


1. Introduction
The St Elias Mountains straddle the border between Alaska, Yukon and British Columbia, and form one of the largest extra-polar ice masses in the world, with a glaciated area of 33 170 km2 (Reference PfefferPfeffer and others, 2014). The region is glaciologically diverse, containing land-, lake- and tidewater-terminating glaciers, as well as an unusually high concentration of surge-type glaciers (Reference PostPost, 1969; Reference Field and CollinsField and Collins, 1975; Reference Clarke, Holdsworth, Williams and FerrignoClarke and Holdsworth, 2002). Until recently, prior ice-dynamics research in the St Elias Mountains was limited to small areas of individual glaciers. In the 1960s−70s, for example, there was a period of focused interest in the Yukon St Elias Mountains with the Icefield Ranges Research Project (IRRP). Based on an east−west transect along Kaskawulsh, upper Hubbard and Seward glaciers, measurements included firn temperatures, meteorological conditions, ice thicknesses derived from seismic soundings and the first annual velocity measurements in this region (e.g. Reference Marcus and RagleMarcus and Ragle, 1970; Reference AndertonAnderton, 1973). From the 1980s, extensive studies were made on the small surge-type Variegated (e.g. Reference Raymond and HarrisonRaymond and Harrison, 1988) and Trapridge (e.g. Reference Frappé and ClarkeFrappé and Clarke, 2007) Glaciers. These studies provide an important long-term record of the surface and subglacial evolution of these surge-type glaciers, although the applicability of the findings to the much larger surge-type glaciers in the region has never been fully evaluated.
Over the past decade, detailed studies of individual surge-type glaciers have continued (e.g. Reference Flowers, Roux, Pimentel and SchoofFlowers and others, 2011; Reference Bevington and CoplandBevington and Copland, 2014), and new studies have focused on the quantification of recent changes in thickness, extent, volume and mass of Gulf of Alaska glaciers. For example, a 300 year time series of accumulation was reconstructed from an ice core retrieved from Mount Logan at 5340 m elevation, which indicates a significant increase in high-elevation snow accumulation since the 1940s (Reference Moore, Holdsworth and AlversonMoore and others, 2002). At lower elevations and for the region as a whole, mass balance has been strongly negative. Reference Berthier, Schiefer, Clarke, Menounos and RémyBerthier and others (2010) estimate that Gulf of Alaska glaciers contributed 24% to the global sea-level rise from glaciers and ice caps between 1962 and 2006. Recent GRACE (Gravity Recovery and Climate Experiment) estimates indicate that the rate of mass loss of Alaskan glaciers exceeded that of all other glaciated regions outside of the ice sheets, at 50 ± 17 Gt a−1 from 2003 to 2009 (Reference GardnerGardner and others, 2013). Including the 250 ± 57 Gt a−1 contribution from the Greenland and Antarctic ice sheets over the same period, Alaskan glaciers accounted for ∼9.5% of the total annual land-ice mass budget (Reference GardnerGardner and others, 2013). Over the past 2 years, the first regional velocity maps of the St Elias Mountains have been produced from speckle tracking of the Japanese Advanced Land Observing Satellite (ALOS) Phased Array-type L-band Synthetic Aperture Radar (PALSAR) fine-beam image pairs (Reference Burgess, Forster and LarsenBurgess and others, 2013a; Reference Abe and FuruyaAbe and Furuya, 2014). These maps have revealed the general velocity structure of the region, but have missed important details such as the terminus of Hubbard Glacier, some steep tributary glaciers and the upper accumulation areas of some basins. These studies have underscored the fact that dynamic variations (e.g. surging and tidewater dynamics) play a large role in the storage, redistribution and loss of mass in this region, and that these variations may not be linear or synchronous between glacier systems. In such a situation, glacier velocity monitoring provides essential information for understanding the interplay between climate and glacier dynamics.
The objective of this study is to extend the velocity record of the Icefield Ranges of the eastern St Elias Mountains and provide the most comprehensive assessment to date of glacier motion, its temporal variability and its long-term evolution in this region. This is achieved from high-resolution regional velocity measurements from 2011 and 2012 RADARSAT-2 imagery, derivation of past velocities at selected glaciers from Landsat imagery, and comparison with previously published measurements. These assessments help with the identification of long-term trends in surface velocity versus shorter-term dynamics relating to surge behaviour, and enable an evaluation of whether glaciers in this region are flowing faster or have slowed in response to long-term negative mass-balance conditions. Our calculations improve upon the coverage provided by previous studies to encompass >99% of the glaciated portion of the Icefield Ranges, including a marked upward estimate of the current calving flux from Hubbard Glacier.
2. Methodology
2.1. Speckle tracking
High-resolution velocity mapping was performed from speckle tracking of RADARSAT-2 image pairs acquired on 24 day repeat orbits between January and April of 2011 and 2012 (Table 1). In 2011 the study area was imaged using ‘fine’ beam mode imagery (∼8m resolution), while in 2012 ‘ultrafine wide’ beam mode imagery was used (∼3m resolution). Image footprints were ∼50 km × 50 km. In 2011, 15 image pairs (segments) from six swaths were processed to derive velocities over an ice area of 14 208 km2. In 2012, the study area was extended southward to include the terminus of Hubbard Glacier, with 23 image pairs from seven swaths used to cover an ice area of 15 103 km2.
Summary of RADARSAT-2 (R2) and Landsat 5 (L5) band 4 image pairs processed to derive glacier velocities in this study. Date format is mm/dd/yyyy

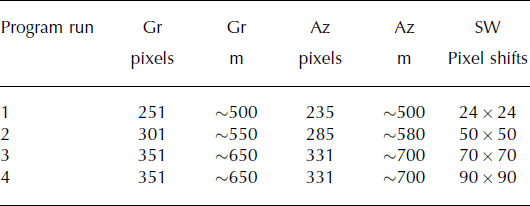
The speckle-tracking algorithm comprised a custom MATLAB® script previously used in the Canadian High Arctic (Reference Van Wychen, Copland, Gray, Burgess, Danielson and SharpVan Wychen and others, 2012, Reference Van Wychen2014; modified from Reference Short and GrayShort and Gray, 2005). The script employs a spatial cross-correlation approach to determine the two-dimensional (2-D) displacement of the pattern of ‘speckle’ in the phase returns between two time-separated single-look complex radar images. The surface must not be significantly altered between image pairs (e.g. due to melt, snowfall, snow redistribution by wind), so image acquisitions were limited to the winter, when surface characteristics are most constant. To obtain a velocity measurement, a block of cells in the first image, known as the ‘image chip’, is systematically correlated within a predefined area known as the ‘search window’ in the second image. The highest correlation provides the displacement, with velocity vectors defined in relation to each image chip. The size of the image chip was defined as the minimum size that will give an identifiable signal (e.g. Reference Huang and LiHuang and Li, 2011), and the size of the search window was determined based on the expected displacement over the 24 day acquisition interval. In general, it was found that regions of fast-flowing ice required larger image chips to constrain them, so in areas of complex flow, such as near the Pacific coast where glacier velocities can range from <10 to >3000 m a−1 within a single scene, pairs were run multiple times using different image-chip and search-window parameters. These are referred to in the text as ‘composite images’.
Slant range displacements were converted to ground range displacements assuming surface-parallel flow and using the 30 m resolution Advanced Spaceborne Thermal Emission and Reflection Radiometer (ASTER) Global Digital Elevation Model version 2 (GDEMv2), released in October 2011, and obtained from NASA’s Reverb portal (http://reverb.echo.nasa.gov). Displacements in the azimuth direction were corrected for pixel-spacing drift using orbital information, and both range and azimuth calculations were further refined by calibrating to an area of known zero displacement, usually a bedrock outcrop, in order to remove systematic biases due to inaccuracies in the baseline or squint effects (Reference Gray, Short, Matter and JezekGray and others, 2001). Errors were higher for image pairs where suitable outcrops were limited in extent, such as at high elevations in the icefields. Final displacements were scaled to annual values and exported to ESRI ArcGIS™ v. 10.1 for viewing and editing.
Mismatches may arise where the algorithm finds a higher correlation with a different block of cells than the true match. These were manually filtered out of the dataset in ArcGIS™ 10.1 using the criteria described by Reference Van Wychen, Copland, Gray, Burgess, Danielson and SharpVan Wychen and others (2012): (1) flow direction and rate should not change abruptly over short distances (e.g. >20° change in direction between neighbouring data points); and (2) velocities should be oriented more-or-less downslope and parallel to surface moraines and flow stripes, except in the case of surge-related features. Areas of widespread coherence loss (e.g. where surface characteristics were altered by melt or snow accumulation) were identifiable as areas of randomly oriented vectors with no dominant flow direction and a similarly random distribution of flow magnitudes. These areas were removed from further analysis and constitute any data gaps visible in Figure 1. Where data points remained in sufficient concentration, an inverse distance weighting (IDW) algorithm was employed to derive a continuous raster surface (2011 pixel size = 100 m; 2012 pixel size = 50 m) from the filtered datasets. No interpolation was performed for parts of the image where data points were spaced >1 km apart (2011 dataset) or >500 m apart (2012 dataset). IDW provides conservative velocity estimates, as interpolated values cannot exceed the measured values they are calculated from.
Velocity structure of the Icefield Ranges, St Elias Mountains, derived from speckle tracking of ultrafine wide RADARSAT-2 imagery from February to April 2012 (Table 1). Non-glaciated areas masked using v3.0 of the Randolph Glacier Inventory. Heavy red lines show primary ice divides; dotted lines indicate longitudinal profiles shown in Figure 4; red circles indicate dGPS stations (L = Lower; M = Middle; U = Upper, S = South Arm). Note nonlinear colour scale. Base image: Landsat 8, August 2013. Geographic coordinate system: WGS84.

2.2. Feature tracking
To assess long-term changes in velocity, feature tracking of Landsat 5 Thematic Mapper (TM) band 4 (30 m resolution) imagery was used on select glaciers (Table 1). Efforts were focused on Kaskawulsh Glacier because of the availability of ground-based measurements from the IRRP in the 1960s (Reference Clarke, Bushnell and RagleClarke, 1969; Reference AndertonAnderton, 1973), as well as the Lowell and Logan surge-type glaciers. Cloud-free late summer images were preferentially selected due to their minimum annual snow extent, and matched with pairs as close as possible to 1 year apart. Of the available Landsat 5 bands, the near-infrared band 4 generally offered the greatest contrast on glacier ice and snow, so was used for the feature tracking. Images were selected to provide at least one pair per decade from 1980 to 2000.
The feature-tracking analysis applied an Interactive Data Language algorithm (CIAS; Reference Kääb and VollmerKääb and Vollmer, 2000; Reference Heid and KääbHeid and Kääb, 2012a) to individual glacier subsets of pairs of Landsat images from the same path/row. The program employs a 2-D cross-correlation methodology similar to the speckle-tracking algorithm described above, and sub-sampled the initial imagery by a factor of four. Filtering was undertaken following the same guidelines employed with the speckle-tracking process. Mismatches were generally more frequent due to the relatively low resolution of Landsat imagery, so filtering was stringent, such that only areas of high confidence were retained and patchy results were removed entirely.
To standardize results, all measured displacements are scaled to annual velocities. To evaluate any seasonal bias from doing this, the velocity patterns derived from the satellite images were compared with velocities derived from differential GPS (dGPS) stations on Kaskawulsh Glacier, as discussed below.
2.3. Differential GPS and surface melt rates
In order to provide independent ice motion estimates for comparison with the satellite-derived estimates, dGPS data were recorded at a network of four stations across Kaskawulsh Glacier between 2007 and 2013 (Fig. 1). The Trimble R7 dGPS receivers recorded their positions at 15 s intervals for 24 hours d–1 during the summer (May–August), and 3 hours d−1 for the rest of the year. Their data were post-processed using Natural Resources Canada’s Precise Point Positioning service (http://webapp.geod.nrcan.gc.ca/geod/tools-outils/ppp.php), which provides positions to ∼1–2 cm horizontal and ∼5 cm vertical accuracy. Measurements of the antenna height above the surface made during field visits to the dGPS sites (typically April, July and end of August each year), and data from Senix automated snow depth sounders installed at the Upper and South Arm stations in 2010, provide a record of surface melt at Kaskawulsh Glacier.
2.4. Error analysis
Errors in the speckle-tracking method can arise due to factors such as poor image co-registration, DEM errors, inconsistencies in the satellite orbital model, cross-correlation errors and layover or foreshortening effects in the radar imagery. While gross mismatches are removed during the filtering process, other errors likely remain. To quantify these, apparent motion over bedrock areas was calculated for each image pair individually using a buffer of either 100 m from the glacier margin for the 2012 speckle-tracking results, or 200 m from the glacier margin for the 2011 speckle-tracking results and all feature-tracking results. The buffer was necessary to avoid inflating the error estimate with artefacts from interpolating across a large velocity gradient at the glacier edge. Evaluation of ice motion along assumed zero-motion ice divides was also used to quantify errors for image pairs from heavily glaciated regions where bedrock outcrops were limited to steep ridges and small nunataks. Initial ice divides were extracted from v3.0 of the Randolph Glacier Inventory (Reference PfefferPfeffer and others, 2014), and refined using the 2011 and 2012 flow vectors. Velocities were extracted at 10 m increments along major ice divides and averaged per image pair. For composite images, errors were calculated separately for each run of the algorithm.
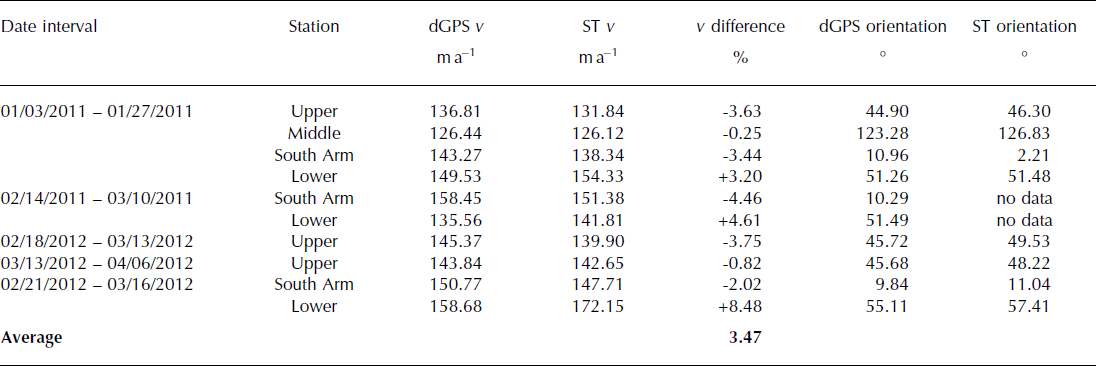
The mean errors derived from the 2011 fine-beam imagery were 16.58 m a−1 over bedrock areas and 24.89 m a−1 along ice divides, compared to 12.66 m a−1 over bedrock areas and 17.98 m a−1 along ice divides for the 2012 ultrafine wide imagery (Table 2). The errors were not evenly distributed, however, with higher values associated with high-elevation and coastal image pairs and the lowest errors occurring for inland pairs which encompassed relatively slow-flowing glaciers. One of the causes of this gradient was the fact that steep, highly glaciated accumulation basins provided few flat, stable areas needed as zero-motion reference points to calibrate the initial displacements. Secondly, fast-flowing Pacific-facing glaciers required a large search area in the algorithm, which increases the probability of random mismatches. The effect of steep terrain was quantified by binning all bedrock error points by local slope as derived from the ASTER GDEMv2, with 2011 errors increasing from ∼10 m a−1 at 0–10 ° slope to ∼17 m a−1 at 50–90 ° slope, and 2012 errors increasing from ∼3ma−1 at 0–10 ° slope to ∼11 m a−1 at 50–90 ° slope. Comparison of the 2011 and 2012 speckle-tracking-derived velocities with simultaneous dGPS measurements indicated a mean difference of 5.15 m a−1 (3.47%) (Table 3). This provides confidence that the apparent motion over bedrock areas accurately reflects the true maximum error of the dataset, so these values were used for inland image pairs. For high-elevation and coastal image pairs, where few bedrock regions were available, the more conservative ice-divide error values are used.
Velocity errors derived from apparent motion over stable areas. Values given indicate the range and average of the mean error evaluated per image pair

Displacement and orientation of in situ dGPS stakes compared to the results from speckle tracking (ST) for overlapping time intervals and locations. Date format is mm/dd/yyyy
Errors for velocities derived from Landsat feature tracking were evaluated from apparent motion over bedrock and are inversely related to the time interval between image acquisitions. Errors range from 1.75 m a−1 for a 4736 day separation used for Logan Glacier (∼10% of mean velocity), to 104.10 m a−1 for a 16 day separation used for the Hubbard Glacier terminus (∼4.1%). For near-annual pairs, typical errors are 5–10 m a−1 (2–11 %). In the following presentation of results, the errors shown are the mean error of the individual image pair for velocities derived from RADARSAT-2 speckle tracking, or of the individual glacier dataset for velocities derived from Landsat feature tracking.
3. Results
3.1. Regional velocity patterns
The velocity map derived from 2012 speckle tracking is shown in Figure 1. Its most striking feature is the Pacific to inland velocity gradient, with glaciers draining the southwest coastal-facing slope of the mountain divide (peak v ∼1500–3600 m a−1) flowing up to an order of magnitude faster than the inland glaciers draining the northeastern flank (peak v ∼ 150–400 m a−1), even where the catchment area drained is significantly smaller (e.g. Agassiz and Tyndall Glaciers). This velocity pattern is consistent with large-scale patterns of precipitation due to the winter advection of Pacific moisture toward the land mass combined with orographic uplift (e.g. Reference Fleming, Chapin, Cramer, Hufford and SerrezeFleming and others, 2000). In the following subsections we focus on new insights into glacier dynamics and ice discharge patterns in the St Elias Mountains that are provided by our results.
3.2. Hubbard Glacier calving flux
Previous regional velocity mapping in the St Elias Mountains (Reference Burgess, Forster and LarsenBurgess and others, 2013a; Reference Abe and FuruyaAbe and Furuya, 2014) has provided poor to no coverage of the terminus of Hubbard Glacier. Limited previous (summer) field measurements have indicated high velocities (>10 m d−1; Reference Krimmel and SikoniaKrimmel and Sikonia, 1987; Reference Trabant, Krimmel, Echelmeyer, Zirnheld and ElsbergTrabant and others, 2003), but the innovative processing of nested search windows to produce composite images in this study provides the best velocity coverage to date of the entire Hubbard Glacier catchment (Table 4; Fig. 1). We recorded winter velocities up to 3.6 km a−1 near the calving face of Hubbard Glacier (Fig. 2a), the highest in the study area. Fortunately, independent airborne ice thickness mapping was undertaken across the terminus of Hubbard Glacier on 21 March 2012 (Reference Rignot, Mouginot, Larsen, Gim and KirchnerRignot and others, 2013a), within the interval of an ultrafine wide image pair acquired between 13 March and 6 April 2012. This provides the ability to determine a much improved estimate of Hubbard Glacier calving flux. The only previous estimate for this glacier is found in Reference Burgess, Forster and LarsenBurgess and others (2013a), where ice discharge was calculated across a flux gate 26.2 km upstream of the terminus. This estimate did not include contributions from down-glacier tributaries (with the exception of Valerie Glacier), and the 702 m estimated ice thickness was less than the thicknesses of 750–860 m measured by Reference Rignot, Mouginot, Larsen, Gim and KirchnerRignot and others (2013b) at a location west of the centre line.
(a) Hubbard Glacier terminus velocities from spring 2012 R-2 imagery, and location of Rignot and others’ (2013a) radar flight line (fine black line). Coordinate system: WGS 1984 UTM zone 7N. (b) Ice flux at 25 m increments across profiles B and F (bolded in (a)). Shaded area indicates difference between maximum and minimum flux estimates, with best estimate taken as the midpoint. Interpolated velocity data marked by dotted lines on profile B.

Processing parameters used to produce the composite image of Hubbard terminus from 13 March 2012 to 6 April 2012 (U24W2 segment No. 3; Table 1). Gr: ground range; Az: azimuth; SW: search window (Gr Az). Each run of the program was individually filtered to remove mismatches, and the highest-quality result for each point from the four runs was used to produce the final ‘composite image’
Ice fluxes in this study were derived for two of the six profiles flown by Reference Rignot, Mouginot, Larsen, Gim and KirchnerRignot and others (2013a), where velocity data were most complete (B and F in Fig. 2). Data were downloaded from the US National Snow and Ice Data Center, Boulder, CO (Reference Rignot, Mouginot, Larsen, Gim and KirchnerRignot and others, 2013b). The ice thickness dataset is complete at 25 m increments along profiles B and F, while the velocity dataset is complete for profile F but possesses gaps representing 10.0% of the length of profile B. These velocity gaps were linearly interpolated between adjacent known values and sampled at 25 m increments. The total volumetric flux for each profile was then obtained by summing the fluxes across the individual 25 m wide ice columns. Given that the depth-averaged velocity is unknown, the ice flux estimates are bracketed using an upper bound (Q max) which assumes that all motion is due to basal sliding, and a lower bound (Q min) which assumes that the depth-averaged velocity is 80% of the surface velocity, following the frequently employed relationship outlined by Cuffey and Paterson (2010), and previously used by others such as Reference Burgess, Forster and LarsenBurgess and others (2013a) and Reference Van WychenVan Wychen and others (2014):


where v is measured surface velocity, v error is its associated error (23 m a−1 for the 13 March–6 April 2012 speckle-tracking dataset), h is ice thickness, h error is its associated error (17 m for the Reference Rignot, Mouginot, Larsen, Gim and KirchnerRignot and others (2013b) dataset) and W is the width of the column between adjacent data points (25 m).
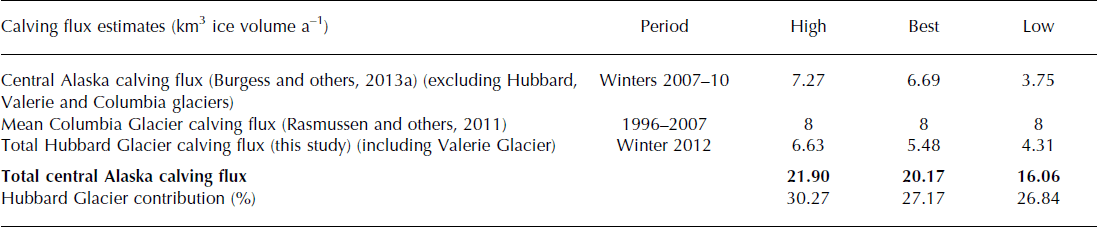
Using the above method, the flux through profile B (∼6 km from terminus) was measured at 5.73 ± 0.90 km3 a−1, whereas at profile F (∼1 km from the terminus) the flux was measured at 5.24 ± 0.93 km3 a−1 (Fig. 2b). The differences lie within error limits, although the discrepancy between flux gates could also be related to factors such as differences in vertical motion between the confluence of Valerie and Hubbard Glaciers and strong lateral extension near the terminus. If both profiles are used to bracket the fluxes, the Hubbard near-terminus ice flux ranges between 4.31 and 6.63 km3 a−1, with a mean of 5.48 km3 a−1. This is a marked upward revision of the best previous estimate of 2.70 km3 a−1 given by Reference Burgess, Forster and LarsenBurgess and others (2013a), and also significantly exceeds their maximum estimate of 2.97 km3 a−1.
To relate the ice flux recorded at the profiles to iceberg calving at the terminus in light of the ongoing advance of Hubbard Glacier, the volume stored as glacier advance was calculated by multiplying the width of the terminus (11.2 km) by the mean ice thickness along profile F (256 m) and the long-term rate of advance (∼60 m a−1 average from 1972 to 2012; Reference McNabb and HockMcNabb and Hock, 2014). This calculation yields a storage volume of only 0.172 km3 a−1, or 2.6–4.0% of the calculated ice flux. Given that this value lies within the error range of our discharge calculations, the current ice flux through profiles B and F is likely very close to the Hubbard Glacier calving flux.
Comparison of the Reference Burgess, Forster and LarsenBurgess and others (2013a) results for the remainder of the Gulf of Alaska glaciers, together with the estimate by Reference Rasmussen, Conway, Krimmel and HockRasmussen and others (2011) for Columbia Glacier, suggests that Hubbard Glacier accounts for up to 30% of current central Alaska calving flux (Table 5) and is the largest contributor to regional calving flux after Columbia Glacier. This high calving flux is likely close to a steady-state value given the slow advance of the Hubbard Glacier terminus over the past century or so (Reference Trabant, Krimmel, Echelmeyer, Zirnheld and ElsbergTrabant and others, 2003; Reference Ritchie, Lingle, Motyka and TrufferRitchie and others, 2008; Reference McNabb and HockMcNabb and Hock, 2014), and is supported by its extensive accumulation area (∼3100 km2 above the equilibrium-line altitude (ELA)), large accumulation-area ratio of ∼0.9 (Reference Rignot, Mouginot, Larsen, Gim and KirchnerRignot and others, 2013a) and high accumulation rates driven by the advection of moist Pacific air masses into the St Elias Mountains. Recent high ice fluxes from Columbia Glacier have been driven by rapid unstable retreat (Reference O’Neel, Pfeffer, Krimmel and MeierO’Neel and others, 2005), so Hubbard Glacier represents the highest steady-state discharge for any ice mass in Alaska. Indeed, it likely represents the highest steady-state discharge for any glacier in the world outside of Greenland and Antarctica. For example, it accounts for approximately double the 2.84 km3 a−1 calving flux of all glaciers in the Canadian High Arctic combined (Reference Van WychenVan Wychen and others, 2014).
Central Alaska regional calving flux, following Burgess and others (2013a), with updated estimates for Hubbard Glacier
3.3. Interannual velocity changes
In assessing glacier velocities across the Icefield Ranges, it is clear that they can vary substantially between years on both surge-type glaciers (Reference Raymond and HarrisonRaymond and Harrison, 1988; Reference Abe and FuruyaAbe and Furuya, 2014; Reference Bevington and CoplandBevington and Copland, 2014) and non-surge-type glaciers (Reference Burgess, Larsen and ForsterBurgess and others, 2013b). In the following discussion, we evaluate the variability in velocities between our 2011 and 2012 measurements, make comparisons with historical measurements since the 1960s, and use this to provide insight into the drivers of short- vs long-term variations in glacier motion in the St Elias Mountains.
3.3.1. Velocity variations on a non-surge-type glacier
Kaskawulsh Glacier provides a unique site to examine long-term velocity variations in the St Elias Mountains as it is a large valley glacier that does not surge (although some tributaries are surge-type; e.g. Reference Flowers, Roux, Pimentel and SchoofFlowers and others, 2011), and has velocity measurements since the 1960s. In comparing the 2011 and 2012 speckle-tracking results, transects across Kaskawulsh Glacier indicate that mean velocities were generally higher in 2012 than 2011 (Fig. 3b), with a maximum difference of ∼25% for individual points and 9.7% for the transect with the greatest difference (D-D′). To put the 2011–12 variability into a broader context, the Kaskawulsh dGPS records were used to evaluate the range of interannual velocity variability between 2010 and 2013. Over this 4 year period, mean annual velocities varied between 154 and 181 m a−1 (17.5%) at the Lower Station, 139 and 170 m a−1 at the Middle Station (22.3%) and 141and 167 m a−1 (18.4%) at the Upper Station. It is beyond the scope of this paper to assess the causes of these variations, but they are in line with the findings of Reference Burgess, Larsen and ForsterBurgess and others (2013b) that winter velocities across Yukon-Alaska decrease by an average of 11% per meter of melt the previous summer. Given the ∼2m interannual variability in melt on Kaskawulsh Glacier, it is likely that velocity variations of upto ∼25% are typical of interannual changes on this glacier. The 2011–12 variation in the speckle-tracking results is thus near the interannual range of variability as determined from the dGPS measurements.
(a) Locations of transverse velocity profiles on Kaskawulsh Glacier; red circles indicate positions of Upper (U) and Lower (L) dGPS stations; ELA indicates location of long-term equilibrium-line altitude (base map, glacier outlines and coordinate system as in Fig. 2). (b) Transverse velocity profiles; for speckle-tracking (2011, 2012) and feature-tracking (1987–88, 1997–98) results, velocities were extracted at 50 m increments and averaged over a 250 m moving window. Error bars shown by coloured shading for datasets in profile H–H′ are applicable to all other profiles. Bar on southern half of profile E–E′ indicates range of variability in motion recorded by the Upper dgps station over the period 2010–13, plus the systematic speckle-tracking error.

An important additional question when assessing velocity changes is the representativeness of winter velocities recorded by the speckle-tracking method versus annual velocities measured by the feature-tracking method and most historical studies. To quantify this, winter velocities were extracted from the dGPS records for 24 day periods matching the RADARSAT-2 image acquisition intervals and compared to true annual velocities measured in the same year by the dGPS. Annual velocities were found to be higher than 24 day winter velocities by 7.83 m a−1 (∼4.7%) at the Lower Station and by 7.81 m a−1 (∼5.1%) at the Upper Station, significantly less than the natural range in inter-annual variability discussed above. An error bar on profile E−E′ in Figure 3b shows the combined range of seasonal and interannual variability plus systematic error as measured from the Upper Station 2010–13 dGPS record.
To evaluate long-term changes in velocity, the 2011 and 2012 speckle-tracking results were compared with historical records from a total of seven cross-profiles across the ablation and lower accumulation areas of Kaskawulsh Glacier, and a ∼12 km long-profile across the top of the glacier (Fig. 3a). Ground-based measurements from the 1960s are available for the long profile (A–A′), which consisted of 23 stakes measured in the summers of 1962 and 1963 by Reference Clarke, Bushnell and RagleClarke (1969), and cross-profiles D–D′–D″, E–E′ and F–F′, which consisted of 53 stakes arranged in three parallel rows ∼1 km apart and measured in 1964 and 1965 by Reference AndertonAnderton (1973). Stake positions for these profiles were determined from georectification of published figures. For cross-profiles B–B′, C–C′, G–G′ and H–H′, historical motion was derived from feature tracking of Landsat 5 image pairs from 22 August 1987 to 9 September 1988, and 30 June 1997 to 29 August 1998 (Table 1; Fig. 3). These profiles were positioned at locations where data points from both feature tracking and speckle tracking were continuous across the glacier surface after filtering.
Velocities along the long profile (A–A′; not shown) at the top of the accumulation area showed no significant change over the 49 year measurement period. The North Arm (B–B′) profile showed few differences between 1987–88, 2011 and 2012, while the Central Arm profile (C–C′) only showed some variability near its margins between 1987–88, 1997–98, 2011 and 2012 (Fig. 3b). Moving down-glacier to the three Reference AndertonAnderton (1973) profiles (D′−D″, E–E′, F–F′), 1964–65 velocities were generally less than 2012 velocities but fell well within the ∼25% range of interannual variability discussed above. On the lower glacier there is little evidence for velocity changes between 1997–98, 2011 and 2012 at profiles G–G′ or H–H′. However, there was a large decrease in velocity at profile H-H′ between 1987–88 and the more recent periods, with a reduction in the peak velocity from 181 m a−1 to 79 m a−1.
The cumulative signal of change in the pattern and magnitude of flow of Kaskawulsh Glacier over the past 50 years is consistent along much of its length. In the upper glacier, at the Kaskawulsh−Hubbard Glacier Divide and in the accumulation basins of the North and Central Arms through to at least 33 km below the ELA, there has been no significant velocity change between the 1960s and 2012. Near the terminus, however, mean velocity has decreased by 40–50 % since 1987–88. This pattern closely resembles the pattern of glacier elevation changes identified regionally by Reference Arendt, Luthcke, Larsen, Abdalati, Krabill and BeedleArendt and others (2008), and on Kaskawulsh Glacier by Reference Foy, Copland, Zdanowicz, Demuth and HopkinsonFoy and others (2011), with the terminus experiencing the highest rates of thinning (average 2.0 m a−1 from 1977 to 1995, up to 6.2 m a−1 from 1995 to 2000), but surface-elevation changes being much less near the top of the ablation zone (<1.0 m a−1) and close to zero above the equilibrium line. It has been noted elsewhere that the response of mountain glaciers to prolonged mass loss is one of deceleration (Reference Heid and KääbHeid and Kääb, 2012b), but from this study it seems clear that decelerations are restricted to regions where the ice was already thin and recent thinning has been most pronounced. Areas of slight thinning in the upper ablation zone have seen no corresponding change in velocity beyond the range of natural interannual variability.
3.3.2. Velocity trends on surge-type glaciers
Velocities extracted along centre-line profiles of surge-type glaciers (Fig. 1) can provide insight into the range of velocity variations experienced by glaciers in different phases of the surge cycle (Fig. 4). For example, Lowell Glacier experienced a surge in 2009–10 (Reference Bevington and CoplandBevington and Copland, 2014), so the velocities measured in 2011 and 2012 represent the evolution of a glacier returning to quiescence (Fig. 4a). The ablation area of Lowell Glacier decreased in velocity by ∼100 m a−1 (40%) over this period, and of the two accumulation basins that feed the glacier, the North Arm (Figs 1 and 4a) experienced a more subdued decrease of ∼50 m a−1 relative to a decrease in velocity of the South Arm of ∼200 m a−1 (not shown). Based on feature tracking performed on the main trunk on a Landsat image pair from 1987–88, several years into quiescence after a 1983–84 surge (Reference Bevington and CoplandBevington and Copland, 2014), the glacier is expected to further decelerate.
Measurements at Logan Glacier enable the positive identification of a new surge-type glacier in this region (Fig. 4b). Feature tracking on a Landsat pair from 1986–99 revealed very little motion of the lower 25 km (km 47 to km 72) of the glacier at that time, a fact supported by manual observation of distinctive looped moraines in Landsat images from 1986, 1987, 1992, 1995 and 1999 that showed motion of <50 m a−1. In comparison, the 2011–12 velocities were much higher, increasing from ∼290 m a−1 in 2011 to∼380 m a−1 in 2012 at km 50 (Fig. 4b). The fast-flowing portion of the glacier also extended ∼5 km further down-glacier in 2012 compared to 2011, as evidenced by the down-glacier progression of the location of peak velocity. These changes, combined with the profile of strongly increasing down-glacier motion followed by an abrupt deceleration, are indicative of an ongoing surge. This provides the first conclusive evidence that the main trunk of Logan Glacier is surge-type, confirming the suggestion of Reference PostPost (1969) and Reference Abe and FuruyaAbe and Furuya (2014). Using winter measurements from 2010, Reference Burgess, Forster and LarsenBurgess and others (2013a) showed a region of active ice comparable in extent to that found in this study, but with peak velocities of only ∼240 m a−1. This suggests that the surge of Logan Glacier has been building over a number of years. The minimum 3 year duration of its surge suggests that its surge behaviour may differ markedly from neighbouring Walsh Glacier, which was last observed to surge in 1960 with a maximum displacement of 10.1 km in its central part in∼4 years (Reference PostPost, 1966). The comparatively gradual acceleration of Logan Glacier without a terminus advance may explain the relative lack of distorted surface features, and hence explain why it has not previously been positively identified as a surge-type glacier.
Profiles on other known surge-type glaciers in the study area (Agassiz, Chitina, Spring, Anderson; Fig. 4c−f) illustrate glaciers that appear to be in quiescence, although most of them show increases in velocity between 2011 and 2012 in their upper reaches. The magnitude of the increase and portion of the glacier affected varies, with increases ranging from 20% to 150% of the 2011 velocity, typically well beyond the ∼25% natural interannual variability determined for Kaskawulsh Glacier. It is unlikely that the differing acquisition times of the 2011 (January–March) and 2012 (February–April) data can account for the observed acceleration from 2011 to 2012, given that both sets of imagery were acquired prior to any spring speed-up as a result of the onset of melt. Air-temperature and velocity data recorded at the Kaskawulsh dGPS stations (Fig. 1) indicate that positive air temperatures and spring speed-up did not occur until after mid-April in both 2011 and 2012.
Longitudinal velocity profiles (positions shown in Fig. 1) of six surge-type glaciers illustrating: (a) marked deceleration near the terminus in the post-surge phase, indicating a return to quiescence; (b) velocity increases from 2010 to 2012 in the lower glacier, associated with an ongoing surge (*2010 velocity profile from Reference Burgess, Forster and LarsenBurgess and others, 2013a); (c−f) surge-type glaciers in the quiescent phase, with velocity variations in the upper glacier of 20–30 %. Shading shows range of error associated with each dataset.

The observation of velocity increases in the upper portions of quiescent surge-type glaciers is consistent with the patterns described by Reference Raymond and HarrisonRaymond and Harrison (1988) for the evolution of Variegated Glacier over the latter half of its quiescent phase prior to its 1982–83 surge. Over the period 1973–81, Variegated Glacier experienced a gradual increase in velocity, particularly in the upper glacier where the maximum year-to-year increase in winter velocity ranged from 15 to 40 m a−1 (∼10–25 %), for a threefold increase over 1974 velocities by 1981, combined with thickening in the upper glacier and thinning towards the terminus. Similar acceleration in the upper reaches of multiple known quiescent glaciers over at least 2 years suggests that quiescent velocity evolution is widespread among the large surge-type glaciers of the St Elias Mountains and could amount to up to several hundred m a−1 variation between early and late quiescence.
Broadly speaking, interannual changes in the velocity patterns of surge-type glaciers can be indicative of their stage in the surge cycle. Increases in the upper glacier seem to be correlated with glaciers in quiescence, while increases in the lower glacier may be associated with surge events, if observed in conjunction with other surge indicators such as increased crevassing, fresh moraine distortions or a longitudinal profile of velocity increasing with distance along most of the glacier length. The velocity changes of glaciers returning to quiescence after a recent surge are particularly distinctive, comprising a considerable deceleration in the lower glacier accompanied by a smaller increase in velocity in the upper glacier.
4. Conclusions
Regional velocity tracking from 2011 and 2012, augmented by feature tracking for selected glaciers, has provided insight into the temporal variability of ice motion in the Icefield Ranges in the eastern St Elias Mountains. Determination of the stage of activity of surge-type glaciers can be possible with (at least) two consecutive years of velocity data, as distinct patterns of acceleration or deceleration are present along their longitudinal profiles. When compared with historical velocity measurements since the mid-1980s, it is clear that surge-type glaciers display a high degree of interannual variability. In a region with a high concentration of such glaciers, it is therefore very difficult to accurately identify long-term evolution in their motion and ice flux until there is a better understanding of the surge cycle. The few non-surge-type glaciers in the region exhibited less variability in motion than surge-type glaciers, and multi-decadal measurements on Kaskawulsh Glacier indicate that it has slowed significantly near its terminus since 1987. This deceleration appears to be linked to pronounced thinning that has occurred across the lower ablation zone over the past three decades. At higher elevations, glacier velocities have remained similar since the 1960s, both in the accumulation area where there is little evidence for recent thinning, and in the upper ablation area where some thinning has taken place (Reference Arendt, Luthcke, Larsen, Abdalati, Krabill and BeedleArendt and others, 2008; Reference Foy, Copland, Zdanowicz, Demuth and HopkinsonFoy and others, 2011). Finally, the coincidence of ice thickness measurements at the terminus of Hubbard Glacier (Reference Rignot, Mouginot, Larsen, Gim and KirchnerRignot and others, 2013a) and velocity measurements derived from speckle tracking has allowed for an improved estimate of the Hubbard Glacier calving flux, increasing its estimated contribution to an average of 5.48 km3 a−1, or up to 30% of the total calving flux from central Alaska.
Acknowledgements
We thank the Natural Sciences and Engineering Research Council, Polar Continental Shelf Project, Northern Scientific Training Program, University of Ottawa, Ontario Graduate Scholarships, Canada Foundation for Innovation and Ontario Research Fund for assistance with funding to complete this project. We thank Parks Canada (particularly Jean Poitevin and Carmen Wong) for providing RADARSAT-2 imagery and assisting in the field, and Champagne and Aishihik First Nations for permission to work in Kluane National Park. In addition, we thank the staff and pilots at Kluane Lake Research Station and Trans North Helicopters for their hospitality and flight observations. Additional thanks are due to L. Gray for providing, and assisting with, the speckle-tracking algorithm, W. Van Wychen for numerous insights and for sharing his speckle-tracking experience, and to E. Burgess for his generosity in sharing his findings. We also gratefully acknowledge comments from two anonymous reviewers which helped to improve the manuscript.



