

1. INTRODUCTION
Glaciers and the seasonal snowpack are important sources of water in many regions (Jansson and others, Reference Jansson, Hock and Schneider2003; Barnett and others, Reference Barnett, Adam and Lettenmaier2005), and are essential components of the Earth's climate system. Widespread decline in glacier size and snowpack depth as well as extent, has occurred in recent decades (IPCC, 2013). Previous studies have suggested that along with rising temperatures, a decrease in surface albedo plays a role in their decline (Hock, Reference Hock2005; Flanner and others, Reference Flanner, Zender, Randerson and Rasch2007). Albedo is defined as the ratio of the radiant flux reflected from a unit surface area into the whole hemisphere to the incident radiant flux of hemispherical angular extent (Schaepman-Strub and others, Reference Schaepman-Strub, Schaepman, Painter, Dangel and Martonchik2006). For snow and ice, albedo is influenced by the ageing of snow, which affects snow grain size (Dozier and Painter, Reference Dozier and Painter2004); the presence of liquid water (Colbeck, Reference Colbeck1979; Gardner and Sharp, Reference Gardner and Sharp2010; Brun, Reference Brun2017); the exposure of underlying bare ice on glaciers; and the presence of light absorbing impurities (LAI) (Warren and Wiscombe, Reference Warren and Wiscombe1980; Flanner and others, Reference Flanner2009). LAI cause darkening of the snow/ice surface (i.e., reduce the albedo), resulting in greater absorption of solar energy, heating of the snow/ice and accelerated snow and glacier melt. In regions with high LAI deposition, LAI can be a larger driver of snow/ice melt than temperature (Hansen and Nazarenko, Reference Hansen and Nazarenko2004; Ramanathan and Carmichael, Reference Ramanathan and Carmichael2008).
LAI include black carbon (BC), and certain types of mineral dust and organic matter. BC is a product of incompletely combusted gas phase condensates of biomass or fossil fuels and has both natural and anthropogenic sources. BC has been investigated extensively in the climate science community because it strongly absorbs light (mass absorption cross section >7.5 ± 1.2 m2 g−1 at 550 nm; (Bond and others, Reference Bond2013)) and is a major contributor to positive climate forcing by warming the atmospheric layer it is in and reducing snow and ice albedo (Hansen and others, Reference Hansen2005; Bond and others, Reference Bond2013; IPCC, 2013). Dominant mineral dust sources are desert regions; however local outcrops or land-use (construction and agriculture) can also be important sources of dust emissions. Light absorption due to mineral dust is highly variable depending on the mineral composition, but in general is considerably lower than BC (Clarke and others, Reference Clarke2004). Due to the high MAC of BC, most research on LAI in snow has focused on BC. However, recent research suggests that because dust is present in much larger concentrations than BC in some regions, dust can dominate LAI albedo reductions and melt (Skiles and others, Reference Skiles, Painter, Deems, Bryant and Landry2012; Kaspari and others, Reference Kaspari, Painter, Gysel, Skiles and Schwikowski2014). Organic matter can be present in snow and ice in many forms, some of which contribute to the darkening of these surfaces. It was estimated that red algae bloom can cause a decrease in snow broadband albedo of 13% over the course of one melt season of glaciers and snow patches in various locations in the Artic (Lutz and others, Reference Lutz2016). The presence of organic matter as humic substances, the matrix composing cryoconite granules (which consist of dead organic matter, algae, bacteria, mineral dust and BC particles) was reported to influence surface albedo as well (Takeuchi and others, Reference Takeuchi, Kohshima and Seko2001; Takeuchi, Reference Takeuchi, Winther and Solberg2002; Takeuchi and others, Reference Takeuchi2015). Humic substances are formed by the decay of microorganisms and exhibit dark colouration due to a large amount of conjugated double bonds related mainly to phenolic and carboxylic functional groups (Kumada, Reference Kumada1965).
Previous research investigating the role of LAI in albedo reduction has utilized chemical analysis (e.g. thermal optical methods, Single Particle Soot Photometer, mineral composition analysis) to determine the relative abundances of LAI, for example Gabbi and others (Reference Gabbi, Huss, Bauder, Cao and Schwikowski2015). For studies where snow spectral albedo measurements were not taken, various snow albedo models such as the Snow, Ice and Aerosol Radiation (SNICAR) model (Flanner and others, Reference Flanner, Zender, Randerson and Rasch2007; Flanner and others, Reference Flanner2009) have been widely used (Sandells and others, Reference Sandells2017). SNICAR inputs include user-defined BC concentration and dust concentration and snow size distributions. A key limitation of this approach is that most users utilize generic optical properties (Dang and others, Reference Dang, Brandt and Warren2015) for the LAI that is based on global means, and that may not accurately reflect the unique optical properties of LAI inherent to different sampling locations. Furthermore, the optical properties of organic LAI have only minimally been investigated (Takeuchi, Reference Takeuchi, Winther and Solberg2002) and are not incorporated into snow albedo models. Poorly constrained optical properties of LAI, particularly in the visible range, can result in differences in observed and modelled snow albedo (Kaspari and others, Reference Kaspari, Skiles, Delaney, Dixon and Painter2015). Advanced methods are needed to constrain the optical properties of LAI, which will improve our ability to identify the contribution of the different LAI constituents to albedo reductions and snow and ice melt.
The aim of this study is to establish a method to analyse the reflectance of LAI in environmental samples using a Hyperspectral Imaging Microscope Spectrometer (HIMS, called Hyperspectral Microscope by CytoViva). This instrument captures the hemispherical directional reflectance (which will be referred to as reflectance throughout this paper) of each class of LAI in a heterogeneous sample. The identification of the impurities is possible as well as the characterization of their reflectance. The use of HIMS is unique in measuring LAI in snow and on glacier surfaces and has the potential to improve quantifying the contributions of different LAI classes to albedo reduction, and therefore, to attribute causes of snow and ice melt. We describe modifications made to HIMS to allow particle reflectance to be measured at the submicron scale. We present the instrument's internal calibration, a test done to identify the optimal sample substrate for measurement and the results comparing reflectance spectra of reflectance standards, Diesel soot, mineral standards and humic substances at the particle scale measured with the HIMS to spectra of the bulk materials obtained with a spectroradiometer that has previously been used for measuring LAI (FieldSpec 3, ASD Inc., PANanalytical) (Kaspari and others, Reference Kaspari, Skiles, Delaney, Dixon and Painter2015; Naegeli and others, Reference Naegeli, Damm, Huss, Schaepman and Hoelzle2015). Lastly, for a sample collected on Plaine Morte glacier, reflectance spectra of various particles belonging to different classes of LAI were measured. These spectra provide information on how much radiation is reflected from each class of LAI and could allow quantifying the contribution of each class to the overall reflectance of the glacier surface through spectral un-mixing data obtained in the field or by remote sensing, offering the possibility to upscale to entire glacier systems.
2. METHODS
2.1. Modifications of the HIMS
We used optical microscopy combined with a hyperspectral imaging spectrometer. The system included an integrated camera (Dage-MTI) and a prism-grating-prism (PGP) type spectrometer (V10D, Specim) mounted onto the camera mount of an optical microscope (BX43F, Olympus) with a motorized stage (Fig. 1). When capturing a hyperspectral image the motorized stage moves the sample across the field of view, this way spectral images are created in a line scan fashion with a 10 nm step resolution. The motorized stage also allows the user to manually move the area of the sample that is viewed to select the region to be scanned.
Scheme of the measurement setup: (A) 100×objective. (B) Light source. (C) Spectrometer. (D) Motorized stage. (E) Ring light. (F) Black microscope slide. (G) Camera. (H) Rotatable slide holder.

The spectrometer's internal calibration was carried out using a mercury-argon pencil style calibration lamp (Hg (Ar) Lamp, Orel). Each wavelength corresponding to a peak in the calibration lamp was assigned to a camera line of the spectrometer and a relationship was established for the whole spectral range (400–1000 nm); the camera lines of the instrument are proxies of the wavelengths of the detected range. Multiple calibration lamps can be used to cover the full HIMS spectral range. For example, at Central Washington University the HIMS system was calibrated with a helium lamp between 400 and 713 nm, and a xenon lamp between 756 and 1000 nm.
The light source is a quartz halogen aluminium reflector (DC-950, Fiber-Lite) (400–2500 nm; 150 watts) used at 75% of its full power. The hyperspectral image is composed using pushbroom imaging (one line, all spectral bands) by moving the sample across the field of view with a motorized stage. Spectra are collected between 400 and 1000 nm (visible and near-infrared) with a 2.5 nm spectral resolution (Beach and others, Reference Beach, Uertz and Eckhardt2015) and a spectral sampling interval of 1.2 nm. The wavelength range of the HIMS is particularly apt at measuring LAI as their main influence to snow/ice albedo is in the visible region. At 100× magnification the pixel in the hyperspectral image is ~ 129 nm × 129 nm. One scan line has a length of 89.8 µm equivalent to 696 pixels). By selecting, through visual inspection, a region of interest (ROI) in the hyperspectral image, an average spectrum for the selected ROI can be obtained with specific software (4.8, Harris ENVI). Hence, with the ROI tool, it is possible to obtain the average spectrum of every pixel that makes up the ROI, ranging from as small as one pixel to the whole hyperspectral image (8064 µm2). The ROI is selected along the edges of a particle, avoiding the pixels closest to the edge as they may not be representative of the particle. Typical applications of the HIMS utilize darkfield microscopy to map and characterize bacteria or pathogens in tissue (Mortimer and others, Reference Mortimer2014) or to confirm functional groups added to nanomaterials (Roth and others, Reference Roth, Tahiliani, Neu-Baker and Brenner2015). For measuring reflectance spectra of individual LAI a series of modifications were made to the microscope. Reflectance measurements require illumination from a similar geometry as the observation. For this purpose, the microscope objective was fitted with a ring light of 2.8 cm inner diameter (1.125″ ID, Dolan-Jenner) that minimizes shadow effects. To use the ring light the objective was changed from the regular 100× magnification objective to a long working distance 100× objective, with a Field of View (FOV) of 72°, to ensure that the sample was fully illuminated. A rotatable slide holder was added to the motorized stage of the microscope to allow collecting directional, rotational-symmetric reflectance spectra when measuring the same particle from different viewing geometries. On a daily basis, a white reference (SRS-99-010, Labsphere) was measured to normalize every spectrum to unity and minimize calibration drift (also for the field spectroradiometer). The integration time was set to 0.25 s for the white reference as well as for bright materials (reflectance standards and minerals); while for darker materials (e.g. BC and humic substances), the integration time was set to 0.5 s. We assumed linearity in the instruments response when doubling integration time (Butz and others, Reference Butz2015). To create a noninterfering substrate on which to place the LAI samples, a glass microscope slide was spray painted with three layers of black matte paint of ~100 µm thickness each (Black Mat, Motip Dupli).
2.2. Validation of the HIMS
Since particle reflectance at this scale has not previously been measured, we first needed to investigate how reflectance at the particle scale, measured using the HIMS method, compares to spectral reflectance of bulk samples using a common field spectroradiometer. The latter measures in the spectral range between 250 and 2500 nm, but for comparison with the HIMS throughout this paper, only the 400–1000 nm range will be shown. The spectral sampling interval of the spectroradiometer is 1.4 nm (250–1000 nm) and 2 nm (1000–2500 nm) and a full-width half maximum of 3 nm at 700 nm and 10 nm at 1400 nm (Analytical Spectral Devices, 2017). This instrument has been used to measure the reflectance of a wide range of materials (Kokaly and others, Reference Kokaly2017), including snow and ice containing LAI (Kaspari and others, Reference Kaspari, Skiles, Delaney, Dixon and Painter2015). The measurements with the field spectroradiometer were conducted in an optical laboratory (Remote Sensing Laboratories, University of Zurich) using a collimated and stabilized tungsten halogen light source (Dedolight Aspherics 2, with stabilized power source). The FOV of the field spectroradiometer is 46° (bare fibre), the diameter of the measured area is 2 cm and consequently, the distance between the sample and the fibre is 4.7 cm.
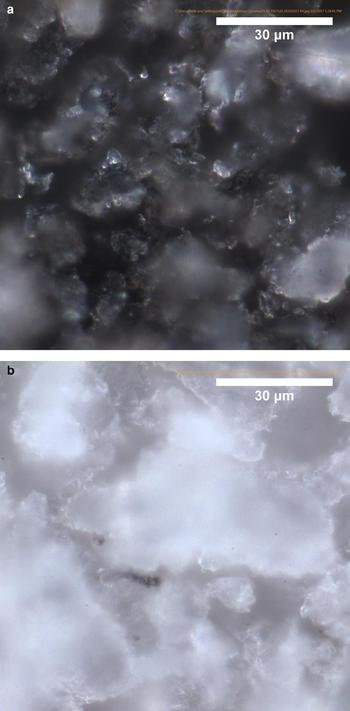
Reference materials were measured with both the field spectroradiometer and the HIMS to assess the potential of the latter instrument to collect representative reflectance spectra. With the exception of the commercial reflectance reference standards, which are provided as compressed discs, the standards for the field spectroradiometer measurement were deposited on a black microscope slide (prepared with the same black coating as for the HIMS measurement) and slightly compacted to form an optically thick layer of ~2 mm (Mulder and others, Reference Mulder, de Bruin, Weyermann, Kokaly and Schaepman2013). The reflectance measured in the macroscale of particles typical for Diesel soot, minerals and humic substances can vary depending on the size, shape and orientation of each particle (see also Section 3.3). Thus, at least ten measurements of different particles of each standard material were averaged. Three reflectance standards were used for calibration: a 10% reflectance reference panel (SRS-10-010, Labsphere); a 50% reflectance reference panel (SRS-50-010, Labsphere); and a Multi-Component Wavelength Standard (MCWS) (WCS-MC-020, Labsphere). The three hemispherical reflectance spectra used in this study were provided by the producer (for the 250–2500 nm range) and they were measured using a dual beam spectrophotometer with Labsphere PELA-1000 integrating sphere over a wavelength range 250–2500 nm (Perkin Elmer Lambda 900 or Lambda 950). The 10% and 50% reflectance standards were commercially produced by mixing different amounts of white and dark particles (as is visible in Fig. 2). At the macroscopic level this results in 10% and 50% reflectance, respectively, but at the microscopic level, the standards are heterogeneous. To take this into account, the reflectance spectra presented in Figure 3 are based on averages of each individual wavelength point of ten HIMS hyperspectral images (ROI of 89.8 µm × 89.8 µm) taken from different areas of the standard. Ten measurements were found to be sufficient in obtaining a representative average. The Diesel soot (2975) and urban dust (1649b) are from the National Institute of Standard and Technology (NIST). The mineral samples are of high purity and include hematite (44956, Fluka), quartz, chlorite and kaolinite, which were kindly provided by Dr M. Plözte (ETHZ) and were previously characterized by Mulder and others (Reference Mulder, de Bruin, Weyermann, Kokaly and Schaepman2013). The humic substances represent a mix between Elliot Soil HA standard (Elliot soil is typical of the fertile prairie soils of the US states of Indiana, Illinois and Iowa; humic and fulvic acids were isolated from the source material) and Leonardite HA standard (Leonardite is produced by the natural oxidation of exposed lignite, a low-grade coal; and was obtained from the Gascoyne Mine in Bowman County, North Dakota, USA) (mixture ratio of 1:1, International Humic Substance Society). The Diesel soot, minerals and humic substances were obtained dry and ground with an agate mortar and pestle to the appropriate size for measurement (~1 < x < 50 µm of diameter). To investigate the influence of the particle orientation on reflectance, hematite was selected because it does not display any optical interference as was the case for the other mineral standards examined in this study (described in Section 3.4), and because it has more distinct spectral features than Diesel soot or humic substances. Five spectra were obtained with the HIMS from the same hematite particle rotated 360° in equal increments of 72°.
Microscopic images at 100× magnification of the 10% (a) and 50% (b) reflectance standards.
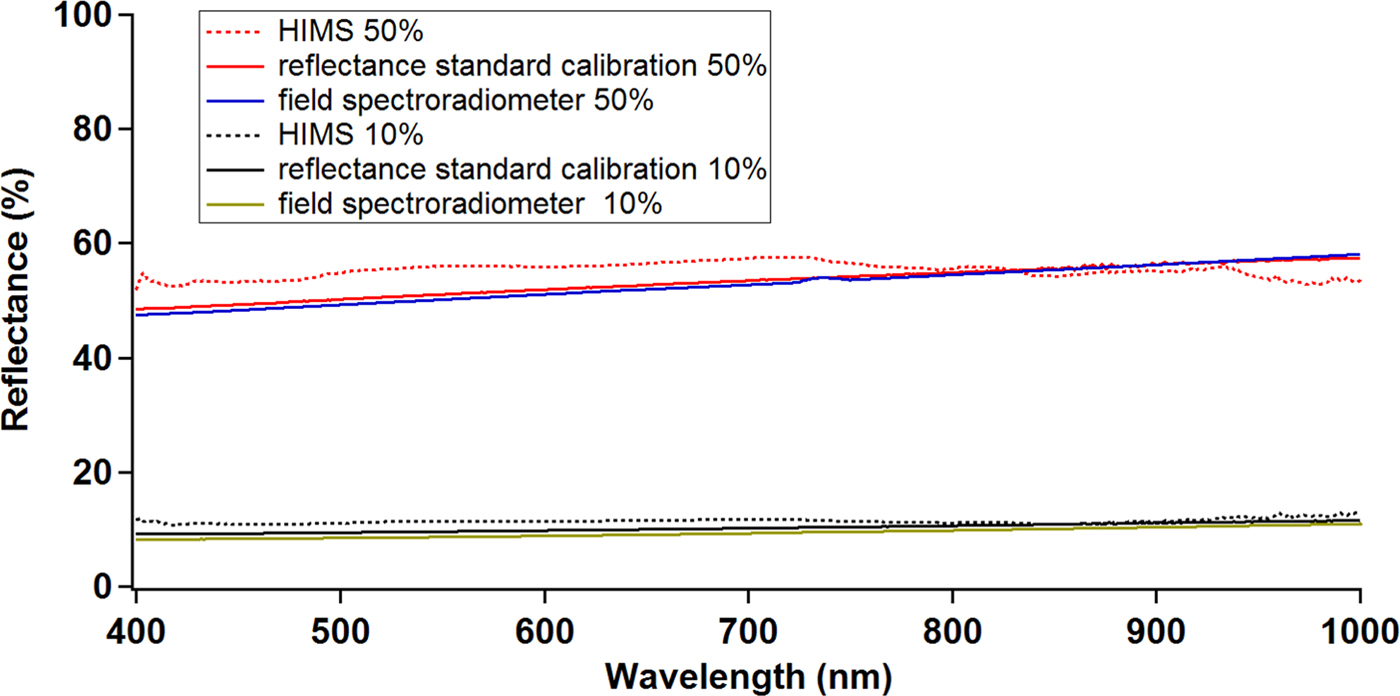
Reflectance spectra of the 10% and 50% reflectance standards measured with the HIMS and the field spectroradiometer and provided by the producer (Labsphere).
2.3. The environmental sample
The environmental sample consists of surface ice containing LAI collected in 500 mL PET containers on Plaine Morte glacier, Switzerland, on 20 August 2015. The ice was melted at room temperature and the LAI were separated from the melted ice through vacuum filtration on a glass fibre filter (Whatman GF/B, 4 cm diameter). The sample was collected from the filter with a spatula without scraping the surface of the filter itself to avoid contamination by the glass fibres. The filtrate was then dried at 80°C overnight, weighed (~3 g) and a fraction of it was slightly ground in an agate mortar with the purpose of breaking apart the larger aggregates which formed during the filtration step. For the HIMS measurement, a small amount of the sample was deposited with a spatula on the microscope slide to obtain as many isolated particles as possible. The observed impurities in the Plaine Morte environmental sample were assigned to different LAI classes according to their morphology and the colour perceivable to the human eye. BC particles are mostly spherical and dark (Fig. 4e); minerals have angular shapes and display on average brighter colours (Fig. 4c, a), while humic substances compose the matrix of most of the aggregates in the sample, i.e. cryoconite granules (Fig. 4i).
Images of LAI from an environmental sample from Plaine Morte glacier. a, c, e, g and i show the hyperspectral image, while in b, d, f, h and j the measured ROI is indicated in red. (a, b) rotated hematite particle (ROI indicated with a red arrow). (c, d) mineral particle. (e, f) BC particle. (g, h) hematite particle. (i, j) humic substances matrix of a cryoconite particle.

3. RESULTS AND DISCUSSION
3.1. Internal calibration of the HIMS
The fit of calibration lamp's wavelengths and the instrument's camera lines proved linear (R 2 = 0.999, Fig. 5) as shown in Figure 5. The regression line obtained allows the conversion of each camera line of the instrument to a wavelength.
Linear calibration function for attributing the camera lines to a certain wavelength, based on the four known peaks of the calibration lamp at 404.66, 435.84, 546.07 and 578.01 nm.
3.2. Measurement substrate
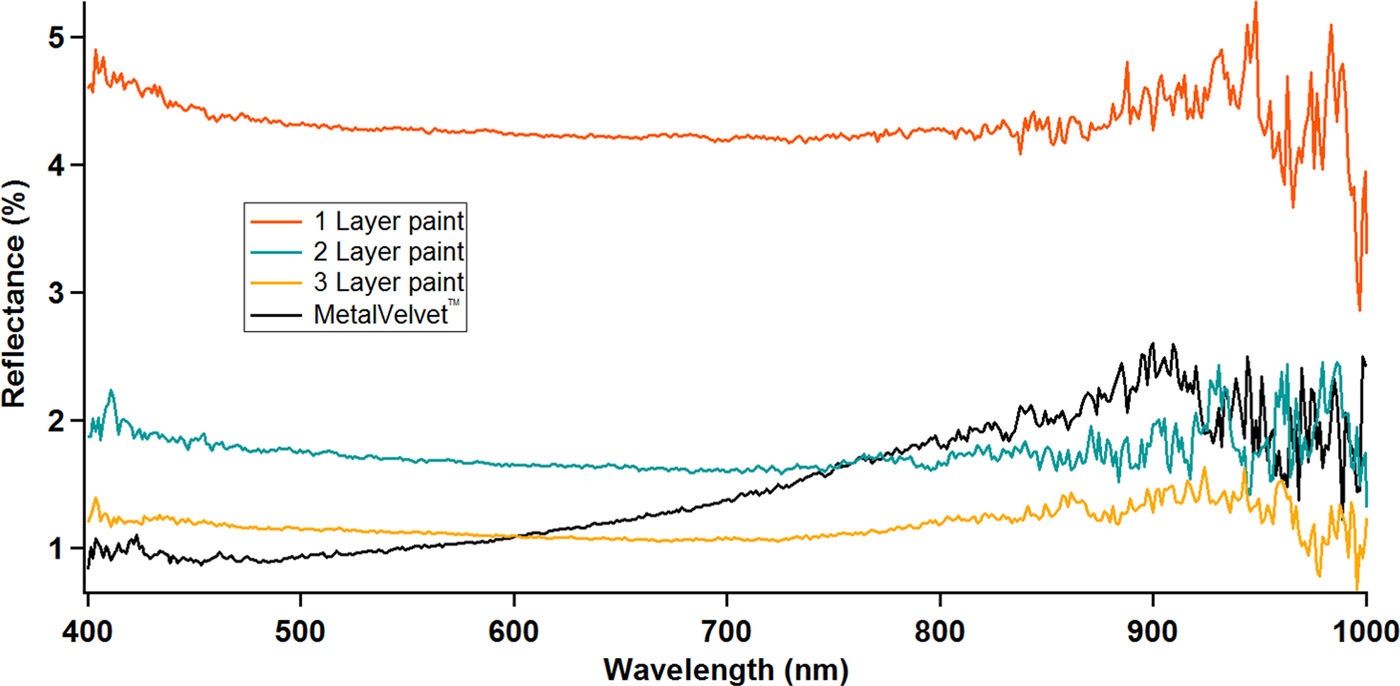
The spectra in Figure 6 show the reflectance of a microscope slide with three layers of black spray paint, compared with just one and two layers as well as a standard low reflecting material (MetalVelvet™, Acktar) measured with the HIMS. The low reflectance of the triple paint coat (1.17 ± 0.12% reflectance) guarantees that the measurement of the samples is not influenced by its background, and was subsequently used in all experiments. With increasing numbers of layers the noise in the range 800–1000 nm is smaller (decreasing from a reflectance of ±1.2% for one layer to ±0.58% for two layers to ±0.34% for the three layers of paint), suggesting that only one or two layers might not be sufficiently opaque in that wavelength region.
Reflectance spectra of a microscope slide with different numbers of black paint layers and of a low reflecting material (MetalVelvetTM).
3.3. Reflectance standards
The spectra obtained for the 10% and 50% reflectance standards by the HIMS and the field spectroradiometer were compared with the respective spectra provided by the producer (Fig. 3).
The average deviation of the reflectance spectra between the HIMS spectra and the calibrated spectra provided by Labsphere, over the whole spectral range, was small for both reflectance standards (1.2%, for the 10% standard and 3.2% for the 50% standard). This deviation represents the heterogeneity of the standard, visible in Figure 2, on the microscopic scale and not the uncertainty of the HIMS. In contrast to the 10% reflectance standard, the 50% reflectance spectrum obtained with the HIMS shows a wavelength dependent deviation. For the 400–830 nm range reflectance is overestimated by the HIMS, while it is underestimated for the 900–1000 nm range. The field spectroradiometer is not sensitive to the microscopic inhomogeneity of the reflectance standards; accordingly, the deviation values between the spectrum provided by the producer and the one measured with the field spectroradiometer is even smaller (0.8% for the 10% standard and 0.6% for the 50% standard).
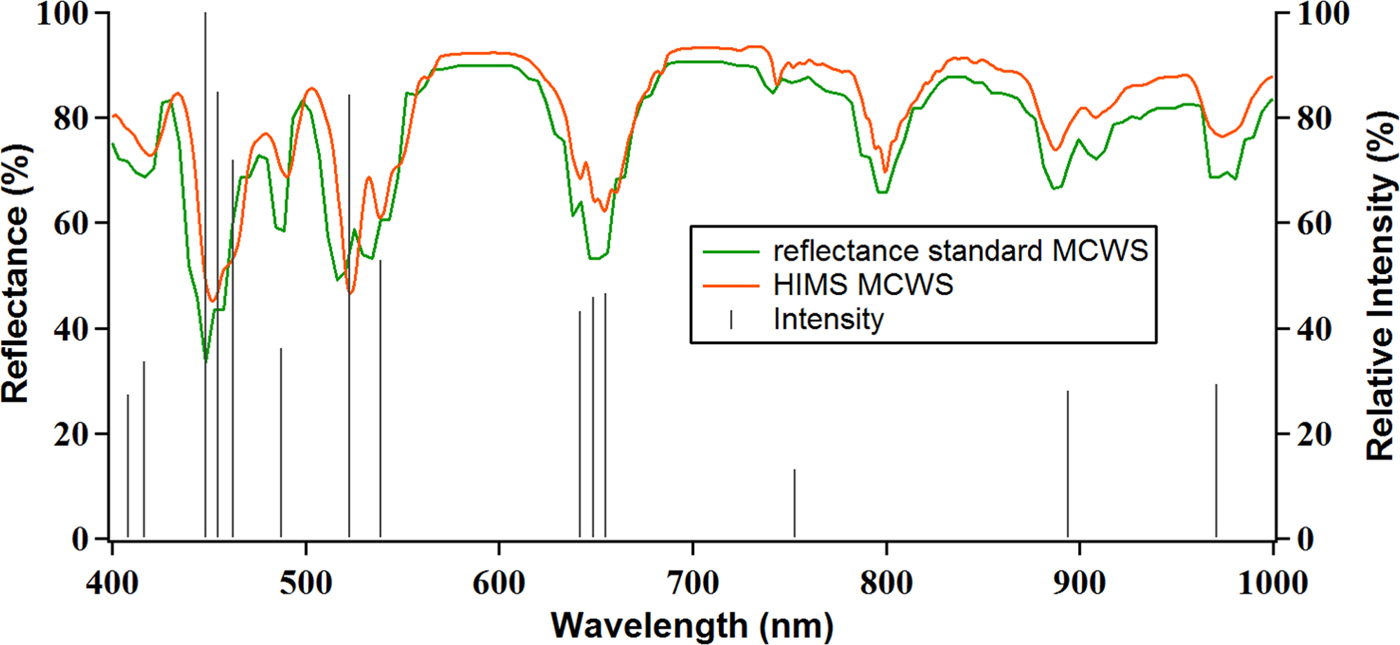
The MCWS reflectance standard has 14 characteristic peaks in the spectral region between 400 and 1000 nm (Fig. 7). The average deviation of the peak wavelengths between the spectra provided by the MCWS standard and the measured HIMS spectra is 1.1 nm, which is below the 2.5 nm spectral resolution given by the HIMS producer. This measurement shows that the spectral resolution given by the instrument's producer is valid also in the case of reflectance measurements.
Reflectance spectra of the MCWS reflectance standard provided by the producer (green) and measured with the HIMS (orange) with characteristic peaks, and the relative intensity (Apeak/Amax; Amax being the maximum intensity of the 448.6 nm peak and Apeak the intensity of all other peaks) reported by the company (grey lines).
3.4. Influence of particle orientation on the reflectance
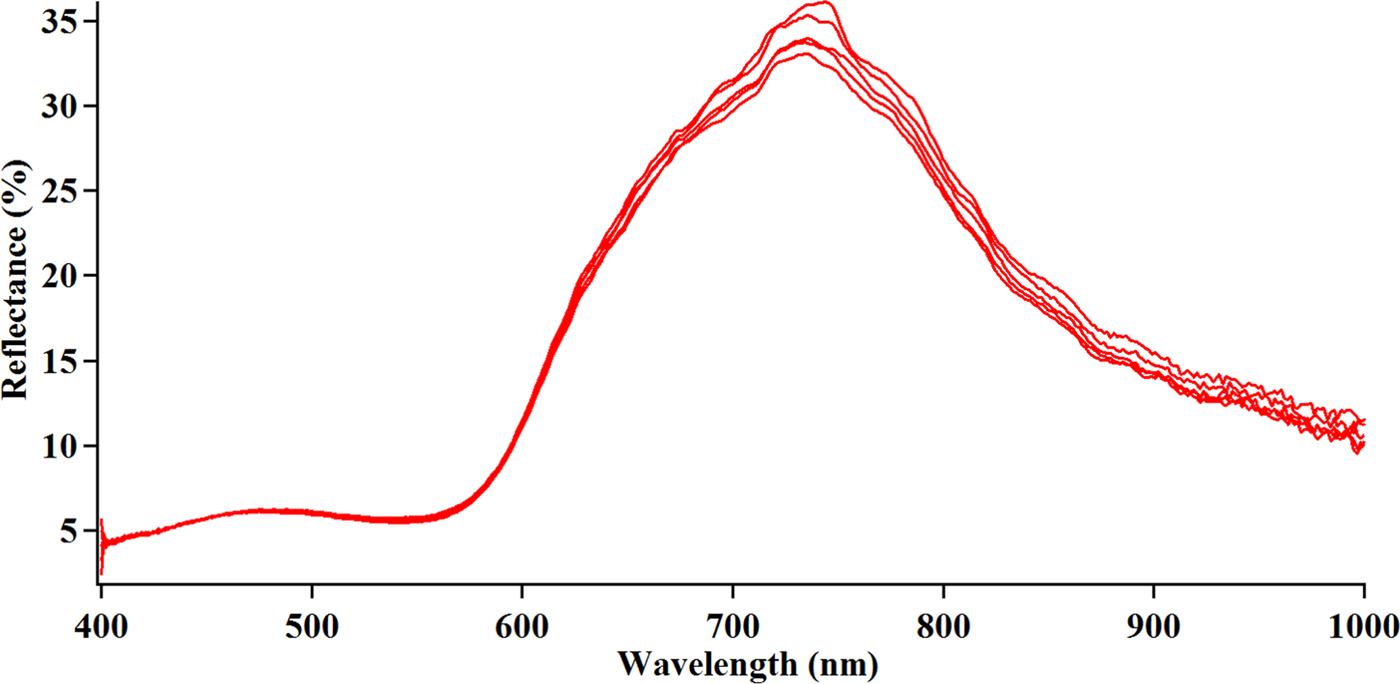
The five spectra obtained by rotating a single hematite particle (visible in Fig. 4a) are shown in Figure 8. The influence of orientation is negligible for wavelengths between 400 and 700 nm (average deviation of 0.2%) but is measurable in the 700–1000 nm range (average deviation 4.3%). This suggests that in order to acquire representative spectra several measurements with varying orientations should be averaged. The larger deviation at longer wavelengths might be due to the fact that when particle size and wavelength become more comparable in size, the orientation of the particle plays a bigger role.
Five reflectance spectra of one hematite particle rotated 72° on the horizontal plane between each measurement.
3.5. Diesel soot, mineral and organic standards
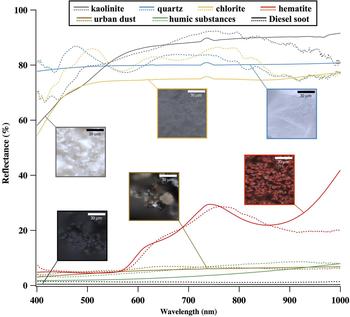
Reflectance spectra of the standard materials Diesel soot, minerals and humic substances measured with the HIMS and the field spectroradiometer are shown in Figure 9. The comparison demonstrates that microscopic and macroscopic measurements yield comparable results, especially in the case of low reflecting materials. The absolute deviation between the corresponding spectra (R%), obtained by averaging over the entire wavelength range (400–1000 nm), are 6.79, 3.10, 6.06, 3.74, 0.86, 0.96 and 1.16 for chlorite, quartz, kaolinite, hematite, Diesel soot, urban dust and humic substances, respectively. The standard deviations obtained from the average of the 10–15 HIMS measurements shown in Figure 9 are the following for chlorite, quartz, kaolinite, hematite, Diesel soot, urban dust and humic substances, respectively: 79.95 ± 1.79, 80.2 ± 3.28, 83.74 ± 1.77, 15.51 ± 0.59, 1.26 ± 0.13, 5.87 ± 0.42 and 5.81 ± 1.86. It was found that average 10–15 measurements was enough to obtain a precise average. The small differences encountered with the particle scale measurements are intrinsic to the measurement and are due to the nature of microscopic spectrometry. Recordings from particles measured at the microscopic scale can include substrate reflections, which are not included in bulk measurements, which allow all natural re-emission of penetrating light to be picked up. The more reflective minerals (particularly quartz and chlorite) display in the HIMS spectra an interference pattern that is due to the interaction between the incoming radiation and the various semi-transparent layers of the minerals. This interference effect is likely to result in a larger deviation between the HIMS and field spectroradiometer spectra. The small feature that appears at 743 nm in chlorite, quartz and kaolinite in all the field spectroradiometer spectra could be a hematite impurity since it is not present in the other spectra of darker materials.
Reflectance spectra of the different standard materials (Diesel soot, minerals and humic substances). Dotted lines: HIMS measurements at the particle scale, solid lines: field spectroradiometer measurement of bulk samples. The images represent examples of the measured standards; the colours of the frames correspond to the spectra (humic substances are not present).
3.6. Environmental sample
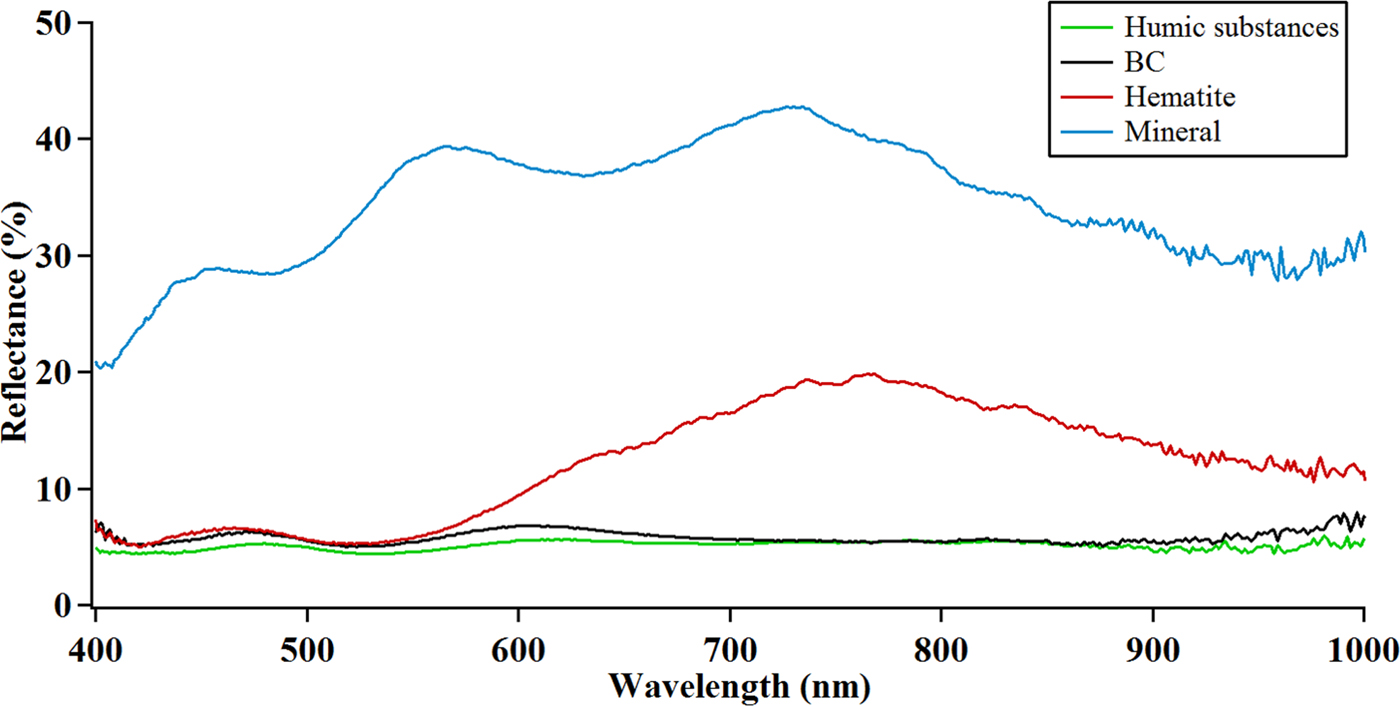
The reflectance spectra of the different LAI classes contained in the environmental sample collected with the HIMS are shown in Figure 10. The spectra were obtained from a single particle for each LAI class to be able to relate the respective spectrum to the corresponding ROI in the hyperspectral image as shown in Figure 4. To retrieve a representative spectrum of each LAI class measurements of 10–15 different particles should be averaged. The spectra collected belong to different individual particles within the mixture of LAI in the environmental sample and differ from the spectra shown in Figure 9 for the respective Diesel soot, mineral and humic substances standards; which were used to demonstrate the suitability of the method. This difference is expected since emission sources and atmospheric history affect the optical properties. This finding underlines the value of the HIMS technique, which is able to collect a characteristic signal of the LAI in a heterogeneous environmental sample, rather than relying on the optical properties of standard materials.
Individual measurements of the spectral reflectance of a BC particle, a bright mineral particle, a hematite particle, and the humic substances matrix of a cryoconite granule, all originating from the Plaine Morte glacier environmental sample. The measured ROI for each reflectance measurement is shown in the images in Figure 4.
4. CONCLUSION
A new method using a HIMS was developed to measure the reflectivity of different types of LAI (mineral, BC and humic substances) at the submicron scale, and the method was validated by measuring the same materials at the bulk scale with a commonly used spectroradiometer. The new method yields reliable spectra for all substances, but for semi-transparent minerals interferences, it might result in a larger uncertainty. Studies on the morphology and composition of cryoconite granules could be carried out with this technique, shedding light on their formation. This new method also advances our ability to constrain the relative importance of the different LAI by allowing the reflectance of the specific LAI in a sample to be characterized as opposed to past approaches that used generic optical properties from literature. The specific optical behaviour, along with the relative abundances of LAI types can deliver a complete picture of the effect of these impurities. As a future prospective the characteristic spectra collected could serve as endmembers for interpreting field spectra collected from the ice or snow surfaces either with in situ techniques or with remote sensing. The contribution of each endmember would be determined through nonlinear spectral un-mixing as cryoconite in snow and ice constitutes an intimate mixture. The various possible applications in this research field make this a very promising method, which can pave the way to improve the understanding of the role of LAI in the surface albedo of ice and snow.
ACKNOWLEDGEMENTS
We acknowledge Michael Plözte at the Department of Civil, Environmental and Geomatic Engineering of ETHZ for providing the mineral standards; Sven Avak, Dimitri Osmond, Loic Schmidely and Johannes Schindler for the help in sampling on Plaine Morte glacier. Kaspari's time was supported by a Swiss National Science Foundation short visit (IZK0Z2_160953), the Oeschger Center for Climate Change Research and a Hans Sigrist Supplementary Grant.
COMPETING INTEREST
The authors declare that they have no conflict of interest.


 Open access