


Introduction
Carrot (Daucus carota L.) is an economically and nutritionally important cool-season root crop belongs to family Apiaceae (Rolbiecki et al., Reference Rolbiecki, Jagosz, Rolbiecki and Kuśmierek-Tomaszewska2025). Carrots are native to Central Asia, with Afghanistan as its Centre of origin, cultivated widely across temperate and tropical regions including the mid-hills of NW Himalayas (Philippe et al., Reference Philippe, Dominique, Sophie, Maxime, Franck, Jacques and François2018). Its high content of antioxidants, minerals, vitamins and dietary fibre contributes to its dietary significance and increasing consumer demand (Boadi et al., Reference Boadi, Badu, Kortei, Saah, Annor, Mensah, Okyere and Fiebor2021). Carrot consumption is associated with improved immunity and reduced risk of chronic diseases such as hypertension, atherosclerosis and cardiovascular disorders (Razzaq et al., Reference Razzaq, Akram, Ashraf, Naz and Al-Qurainy2017). Ensuring yields and quality under resource-limited environments is therefore an important production objective.
Carrot growth is highly sensitive to soil moisture, aeration and nutrient availability, making irrigation management a critical factor influencing root development, productivity and quality (Harasim et al., Reference Harasim, Kwiatkowski and Buczek2025). Both deficit and excessive irrigation can constrain physiological processes, limit nutrient uptake and reduce water productivity (Schiattone et al., Reference Schiattone, Vigiani, Venere, Cantore, Todorovic, Perniola and Candido2018; Sharma et al., Reference Sharma, Sharma, Shukla, Verma, Singh, Spehia, Sharma, Gautam, Dogra, Tecimen, Kumar and Kumar2023). Water deficiency significantly disrupts physiological processes in plants, including food accumulation, photosynthesis, carbohydrate and protein metabolism and the oxidative defensive system (Mankotia et al., Reference Mankotia, Sharma and Verma2024). Precise irrigation scheduling is thus essential to balance water use with crop requirements and to minimise nutrient losses from leaching (Elshamly and Nassar, Reference Elshamly and Nassar2023).
Sowing method also plays a significant role in determining seedling establishment, soil-root interaction and resource use efficiency (Prikxit et al., Reference Prikxit, Mahajan and Sharma2025). Planting layouts such as flat-beds, ridges and furrows differ markedly in their effects on soil aeration, drainage, moisture distribution and nutrient assimilation (Solanki et al., Reference Solanki, Kaswala, Dubey and Italiya2020). These factors are particularly important in the mid-hill agroecosystems of NW Himalayas, where slope terrain, limited arable land and erratic rainfall create inherent production constraints. Selecting an appropriate sowing method may therefore enhance soil conditions, reduce erosion risk and improve overall crop performance (Singh et al., Reference Singh, Meena, Kumar, Kumar, Meena, Hingonia and Singh2017).
Although irrigation and sowing methods are individually well recognised as determinants of root crop productivity, their combined influence on soil chemical properties, microbial activity, water productivity and carrot yield under mid-hill conditions has not been adequately examined. Therefore, the objectives of this study were to evaluate (i) the effects of IW/CPE-based irrigation regime and sowing method on soil chemical properties, microbial activity and water productivity and (ii) the subsequent influence on the productivity and quality of carrot (Daucus carota L.). In line with these objectives, it was hypothesised that ridge sowing, under optimal irrigation regime, would improve soil nutrient availability and microbial activity, thereby improving water productivity as well as the yield and quality of carrot under mid hill conditions.
Materials and methods
Experimental site and soil type description
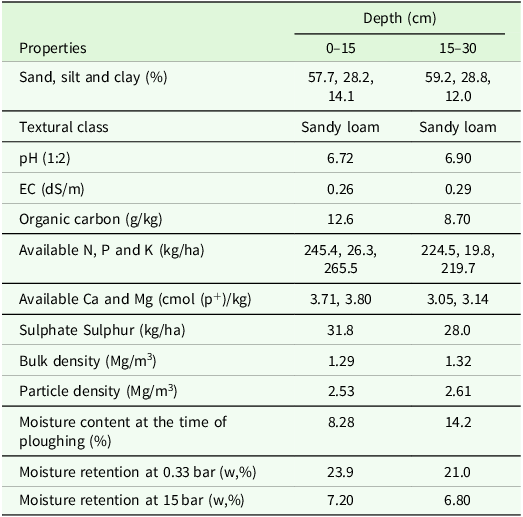
The study was conducted at the experimental farm of Department of Soil Science and Water Management Dr. YS Parmar University of Horticulture and Forestry, Nauni, India during 2021–22 and 2022–23. The experimental site is located at 30° 52′ N and 77° 11′ E, 1175 m above mean sea level with an average slope of 7–8%. The average annual precipitation in this region is 1100 mm with an annual moisture deficit of around 420 mm and considering an annual PET of 1520 mm. According to USDA soil taxonomy classification, the study area belongs to the Typic Haplustepts subgroup. The initial soil characteristics of the experimental site during course of investigation are provided in Table 1. The surface and subsurface soil of experimental site was sandy loam in texture, neutral in soil pH, higher to medium in organic carbon content, low in available nitrogen, higher to medium in available phosphorus and medium in available potassium, respectively. Available calcium and magnesium were moderate and sulphate sulphur content was adequate in both the depths.
Analysis of soil properties before conducting the experiment

EC, electrical conductivity; N, nitrogen; P, phosphorus; K, potassium; ca, calcium; Mg, magnesium.
Experimental setup
The present investigation was carried out during the month of November to February for consecutive two years with eight treatments comprised two sowing methods: Flat-bed (S1) and Ridge (S2), along with four irrigation schedules: I1, I2, I3 and I4 (0.6, 0.8, 1.0 and 1.2 IW/CPE ratios, respectively) replicated three times in Factorial Randomised Block Design. Irrigation scheduling was based on IW/CPE approach, where irrigation water depth (IW) was maintained 30 mm for each irrigation. The cumulative pan evaporation (CPE) was measured by summarising daily observed evaporation from USWB Class A open pan evaporimeter located 0.5 km away from the experimental site. The irrigation interval was determined when the ratio of IW to CPE reached the prescribed level of 0.6, 0.8, 1.0 and 1.2. Accordingly, irrigation was scheduled when the CPE reached 50, 37.5, 30 and 25 mm for the 0.6, 0.8, 1.0 and 1.2 IW/CPE ratios, respectively. Surface irrigation was applied using measured amounts of water through 2-inch PVC pipes equipped with a water flow metre.
Cultivation practices
The investigation was carried out with Pusa Yamdagni variety of carrot (Daucus carota L.) in 3 m × 2 m plots with 30 cm × 10 cm spacing. There was 1 m and 3 m buffer zone between plots and replications, respectively. The recommended doses of FYM (10 t/ha), N (50 kg/ha), P2O5 (50 kg/ha) and K2O (40 kg/ha) nutrients were applied as per the package of practices for vegetable crops (Anonymous, 2014). The full dose of P and K fertilisers were applied at the time of field preparation. The nitrogen was applied into three split doses viz. half as basal and rest in two splits at one month interval. After sowing, a light irrigation was given at alternate days until proper germination of seeds. Before the execution of irrigation schedule, 30 mm irrigation was applied in all plots. Then subsequent irrigations were applied as per schedules of irrigation.
Soil analysis
Representative soil samples of each treatment were collected from 0–15 and 15–30 cm depths at the time of harvesting during both years of the study. After collection, samples were dried in shade and ground with the help of pestle, passed through 2 mm sieve and then analysed for soil available N, P, K, Ca, Mg and sulphate sulphur. Available nitrogen (N) was determined by alkaline potassium permanganate method (Subbiah and Asija, Reference Subbiah and Asija1956). Available phosphorus (P) was examined by bicarbonate extraction method (Olsen et al., Reference Olsen, Cole, Watnabe and Deam1954). Available potassium (K), calcium (Ca) and magnesium (Mg) were measured by ammonium acetate extraction method (Merwin and Peech, Reference Merwin and Peech1951). Sulphate sulphur (SO4 2− S) was determined by turbidimetric method (Williams and Steinbergs, Reference Williams and Steinbergs1959).
Total microbial count
Microbial populations (Bacteria, fungi and actinomycetes) were assessed using the serial dilution technique of Salle (Reference Salle1973). One gram of soil was mixed with 10 ml sterile water to prepare the initial dilution, followed by a series of tenfold dilution up to 10−6. Aliquots of 0.1 ml from 10−6, 10−5 and 10−4 dilutions were plated for bacteria, actinomycetes and fungi, respectively. Plating was carried out on nutrient agar (bacteria), kenknight and munaier’s medium (actinomycetes) and potato dextrose agar (fungi). The inoculum was evenly spread using a sterile spreader, and plates were incubated at 30°C for 2–5 days. Microbial populations were calculated as per Equation (1) and expressed as cfu/g soil (colony-forming units per gram of soil). ${\rm Viable\ cell\ per\ }{\rm g}{\rm \ of\ dry\ soil}={Mean\,\textit{plate}\,\textit{count}\,\times \textit{dilution}\,\textit{factor} \over Dry\,\textit{weight}\,of\,soil}$
Water use indices
Profile water use was estimated by moisture deficit in the root zone before and after irrigation at different depths and water requirement was determined by the total amount of water applied at each schedule and effective rainfall (Waqas et al., Reference Waqas, Cheema, Hussain, Ullah and Iqbal2021). Reference evapotranspiration (ETo) and effective rainfall was calculated by FAO CROPWAT 8.0 software. Crop evapotranspiration (ETc) was calculated by multiplying reference evapotranspiration (ETo) by crop coefficient (Kc) Equation (2). Crop coefficients were different for different growth stages and these were obtained from FAO (Allen et al., Reference Allen, Pereira, Raes and Smith1998). $\rm ET_c = ET_o \times K_c$
Water productivity
Water productivity is a measure of how much agricultural production is achieved for each unit of water consumed. Crop water productivity (CWP) is a measure of water productivity expressed in terms of yield per unit amount of water consumed by the crop during evapotranspiration. CWP was calculated as per Equation (3): $CWP\,\left(kg/ha/mm\right)={\textit{Yield}(kg/ha) \over ET_{c}(mm)}$
Total water productivity (TWP) is also a measure of water productivity stated in terms of yield per unit of total water supplied (TWS) including irrigation and rainfall (Biswas et al., Reference Biswas, Mailapalli and Raghuwanshi2021). TWP was calculated as per Equation (4) $TWP\,\left(kg/ha/mm\right)={\textit{Yield}\,(kg/ha) \over \textit{Total}\,\textit{water}\,\textit{supplied}\,\left(mm\right)}$
Profile water use
Profile water use (PWU) was estimated based on the depletion of soil moisture from the crop root zone between two successive sampling dates. Soil samples were collected from different depths within the effective root zone, and soil moisture content was determined by the gravimetric method (Allen et al., Reference Allen, Pereira, Raes and Smith1998). The profile water use was calculated using the following Equation (5): $PWU= \mathop{\sum }\limits_{n=1}^{\infty }\left( {M1-M2 \over 100}\times BD\times D\right)$
Where,
PWU = Profile water use (mm)
M1 = Soil moisture content (%) at the first sampling
M2 = Soil moisture content (%) at the second sampling
BD = Bulk density of soil (Mg/m3)
D = Depth of soil layer (mm)
Harvest index (HI)
Economic yield (kg/ha) was determined by taking the fresh weight of the roots. Fresh leaf and root weights were used to estimate biological yield (kg/ha). Harvest index (%) was determined from below listed in Equation (6). $\textit{Harvest}\,\textit{index}\,\left(\% \right)={\textit{Economic}\,\textit{yield}\, \over \textit{Biological}\,\textit{yield}\,}\times 100$
Analysis of data
The experimental data were analysed using factorial randomised block design and three-way analysis of variance (ANOVA) as described by OPSTAT. Treatments means were compared using the critical difference (CD) at 5% significance level. ANOVA of recorded parameters are presented in Table S1–S12.
Results
Available NPK
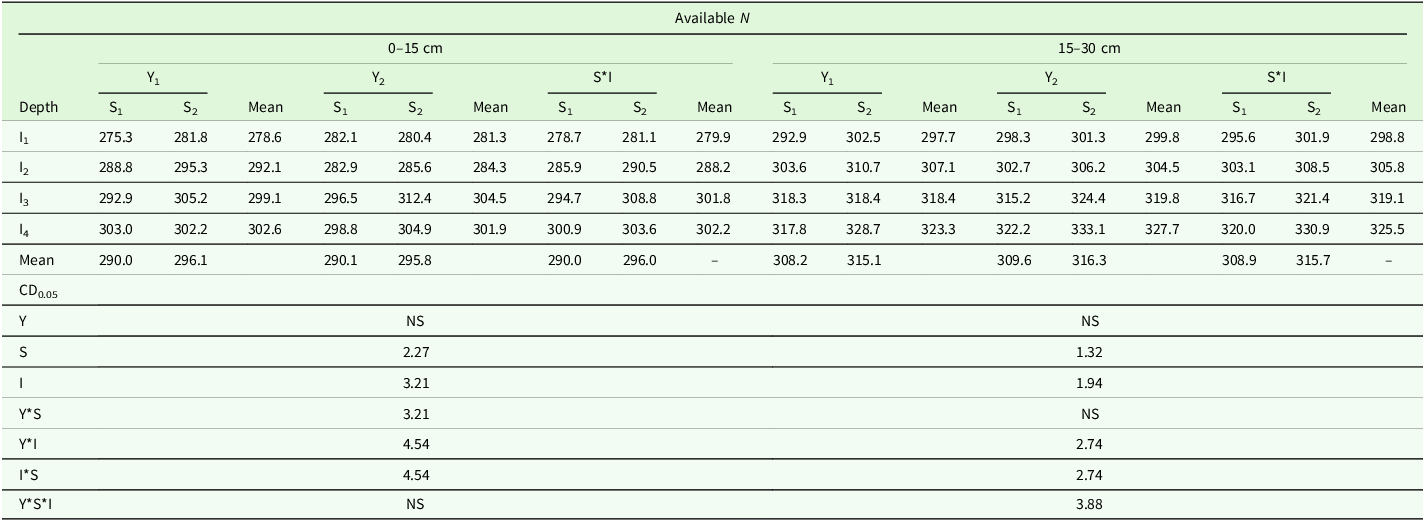
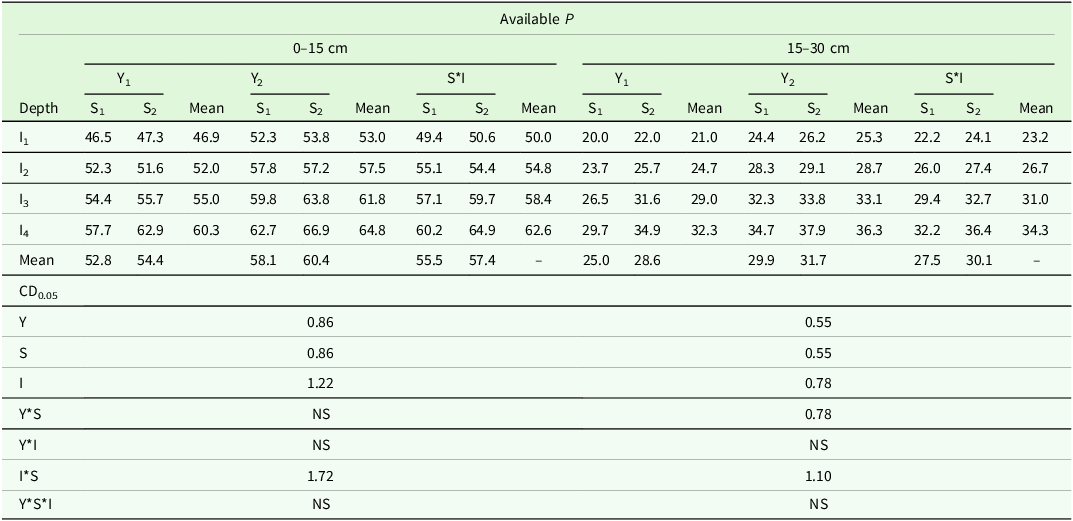
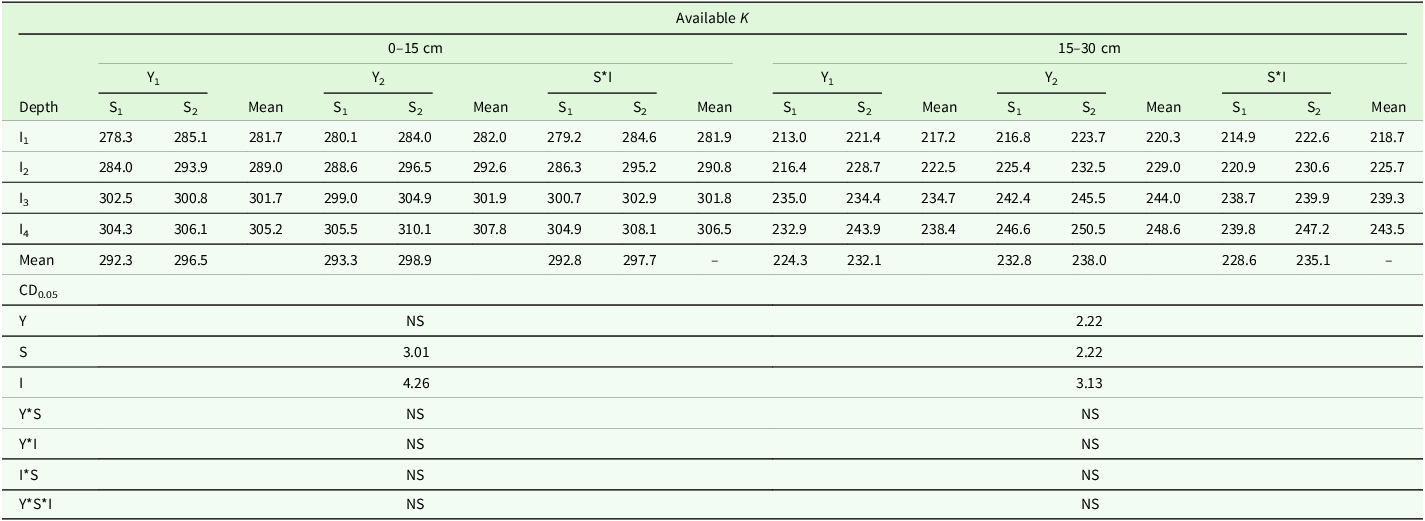
Available NPK at 0–15 and 15–30 cm soil depths during the 2021–22 and 2022–23 growing seasons are presented in Tables 2–4. Pooled data across both seasons on soil nutrient status (NPK) revealed a significant effect of irrigation regimes and sowing methods on nutrient availability, with notable trends at 0–15 and 15–30 cm soil depths (Tables 2–4). Nutrient availability decreased with increasing soil depth, except for available N, which showed higher concentrations in 15–30 cm as compared to 0–15 cm depth.
Effect of different irrigation regimes and sowing methods on available N (kg/ha) at 0–15 cm and 15–30 cm soil depths (Pooled data)

Y1- 2021–22, Y1- 2022–23, S1- Flat bed, S2- Ridge, I1 -IW/CPE 0.6, I2 -IW/CPE 0.8, I3 -IW/CPE 1.0, I4 -IW/CPE 1.2, CD-critical difference, NS-Non-significant.
Effect of different irrigation regimes and sowing methods on available P (kg/ha) at 0–15 cm and 15–30 cm soil depths (Pooled data)

Y1- 2021–22, Y1- 2022–23, S1- Flat bed, S2- Ridge, I1 -IW/CPE 0.6, I2 -IW/CPE 0.8, I3 -IW/CPE 1.0, I4 -IW/CPE 1.2, CD-critical difference, NS-Non-significant.
Effect of different irrigation regimes and sowing methods on available K (kg/ha) at 0–15 cm and 15–30 cm soil depths (Pooled data)

Y1- 2021–22, Y1- 2022–23, S1- Flat bed, S2- Ridge, I1 -IW/CPE 0.6, I2 -IW/CPE 0.8, I3 -IW/CPE 1.0, I4 -IW/CPE 1.2, CD-critical difference, NS-Non-significant.
Across irrigation regimes, NPK was consistently higher under higher IW/CPE ratio of 1.0 and 1.2. However, among sowing methods ridge sowing recorded significantly higher NPK than flat-bed sowing at both depths. Among irrigation schedules, maximum available N (302.2 and 325.5 kg/ha), P (62.6 and 34.3 kg/ha) and K (306.5 and 243.4 kg/ha) were observed under I4, while the lowest was under I1 at 0–15 and 15–30 cm, respectively. Among sowing methods, ridge sowing method outperformed the flat-bed method, recording maximum available N (296.0 and 315.7 kg/ha), P (57.4 and 30.1 kg/ha) and K (297.7 and 235.1 kg/ha) at 0–15 and 15–30 cm, respectively.
The interaction S×I showed a consistent pattern across primary available nutrients, with ridge sowing combined with higher irrigation levels (IW/CPE ratio of 1.0 and 1.2) resulting in maximum available N, P and K at both depths. The interaction was significant for available N and P at both soil depths and for available K at 15–30 cm. Contrarily at 0–15 cm, the interaction for K exhibited statistically equivalence. Furthermore, flat-bed sowing under IW/CPE ratio of 0.6 recorded minimum nutrient availability. Year had a non-significant effect on available N whereas, significant effect was observed for available P at 0–15 cm and 15–30 cm depths. Year found to be non-significant for available K at 0–15 cm and non-significant at 15–30 cm soil depth.
Available Ca, Mg and SO4 2− S
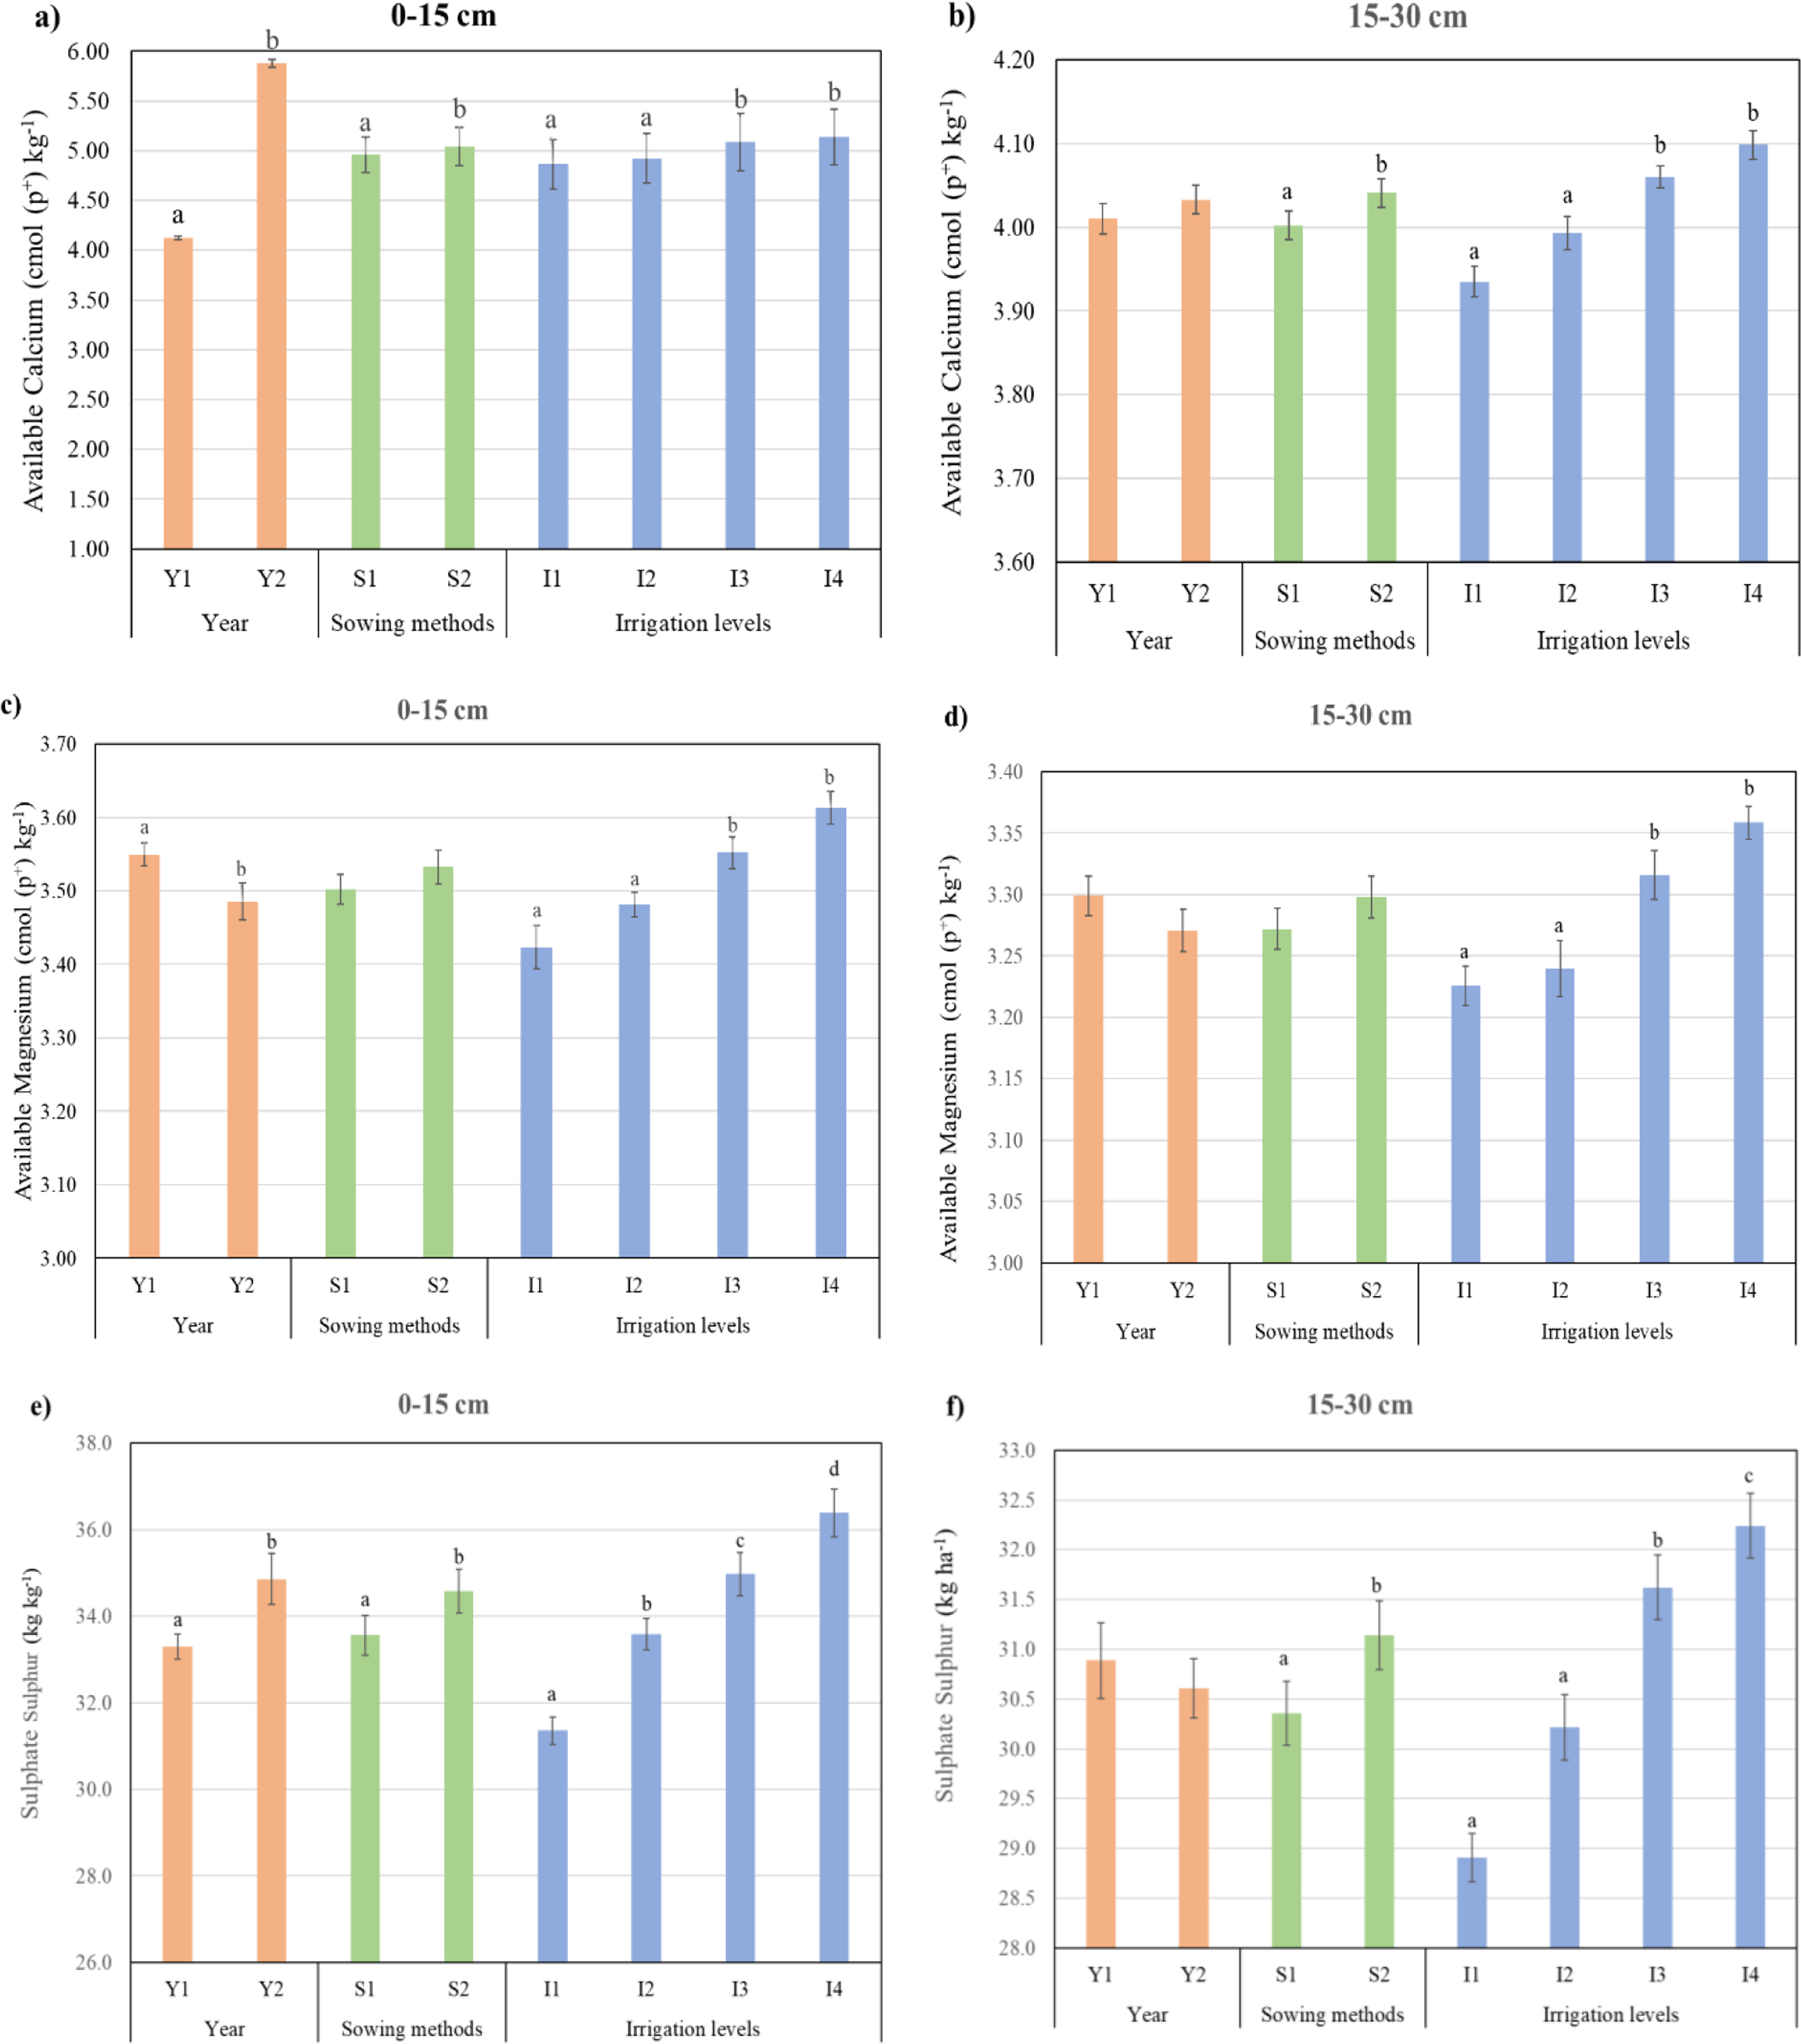
Data on Secondary nutrient availability (Ca, Mg, SO4 2−) at the 0–15 cm & 15–30 cm is summarised in Tables S4-a, S5-a and S6-a, respectively. The pooled analysis revealed that year, sowing methods and irrigation regimes had a significant effect on the availability of available Ca (Figure 1a,b), Mg (Figure 1c,d) and SO4 2−S (Figure 1e,f) at 0–15 cm soil depth except for available Mg, where sowing method had a non -significant effect at both the depths. Among irrigation regimes, I4 recorded the highest available Ca, measuring 5.14 cmol (p+)/kg at 0–15 cm depth and 4.10 cmol (p+)/kg at 15–30 cm. Magnesium availability was also maximised under I4, with 3.61 cmol (p+)/kg and 3.36 cmol (p+)/kg at 0–15 and 15–30 cm, respectively, these values being statistically at par with I3. Similarly, SO4 2−S was substantially higher under I4, recording 36.4 kg/ha at 0–15 cm and 32.3 kg/ha at 15–30 cm, the latter being statistical at par with I3.
Effect of years, sowing methods and irrigation regimes on (a and b) available Ca cmol (p+)/kg), (c and d) available Mg (cmol (p+)/kg and (e and f) sulphate sulphur (kg/ha) at 0–15 and 15–30 cm depth, respectively. Error bars indicate the standard error of mean (SEM), and different uppercase and lowercase letters above bars denote significant differences among sowing methods and irrigation regimes, respectively (p < 0.05) (Mean data). Bars without letters indicate non-significant differences among treatments.

Sowing methods significantly influenced Ca and SO4 2−S at both depths (0–15 and 15–30 cm), whereas, their effect on Mg at both depths and Ca at 15–30 cm was non-significant. Among sowing methods, ridge sowing resulted in notably higher available Ca (5.04 and 4.04 cmol (p+)/kg) and higher SO4 2− S at both depths (34.6 and 31.2 kg/ha). However, sowing method effects on Mg at both depths, as well as the interaction effects between year, sowing methods and irrigation regimes, were not statistically significant for available Ca, Mg and SO4 2−S.
Microbial count, yield and HI
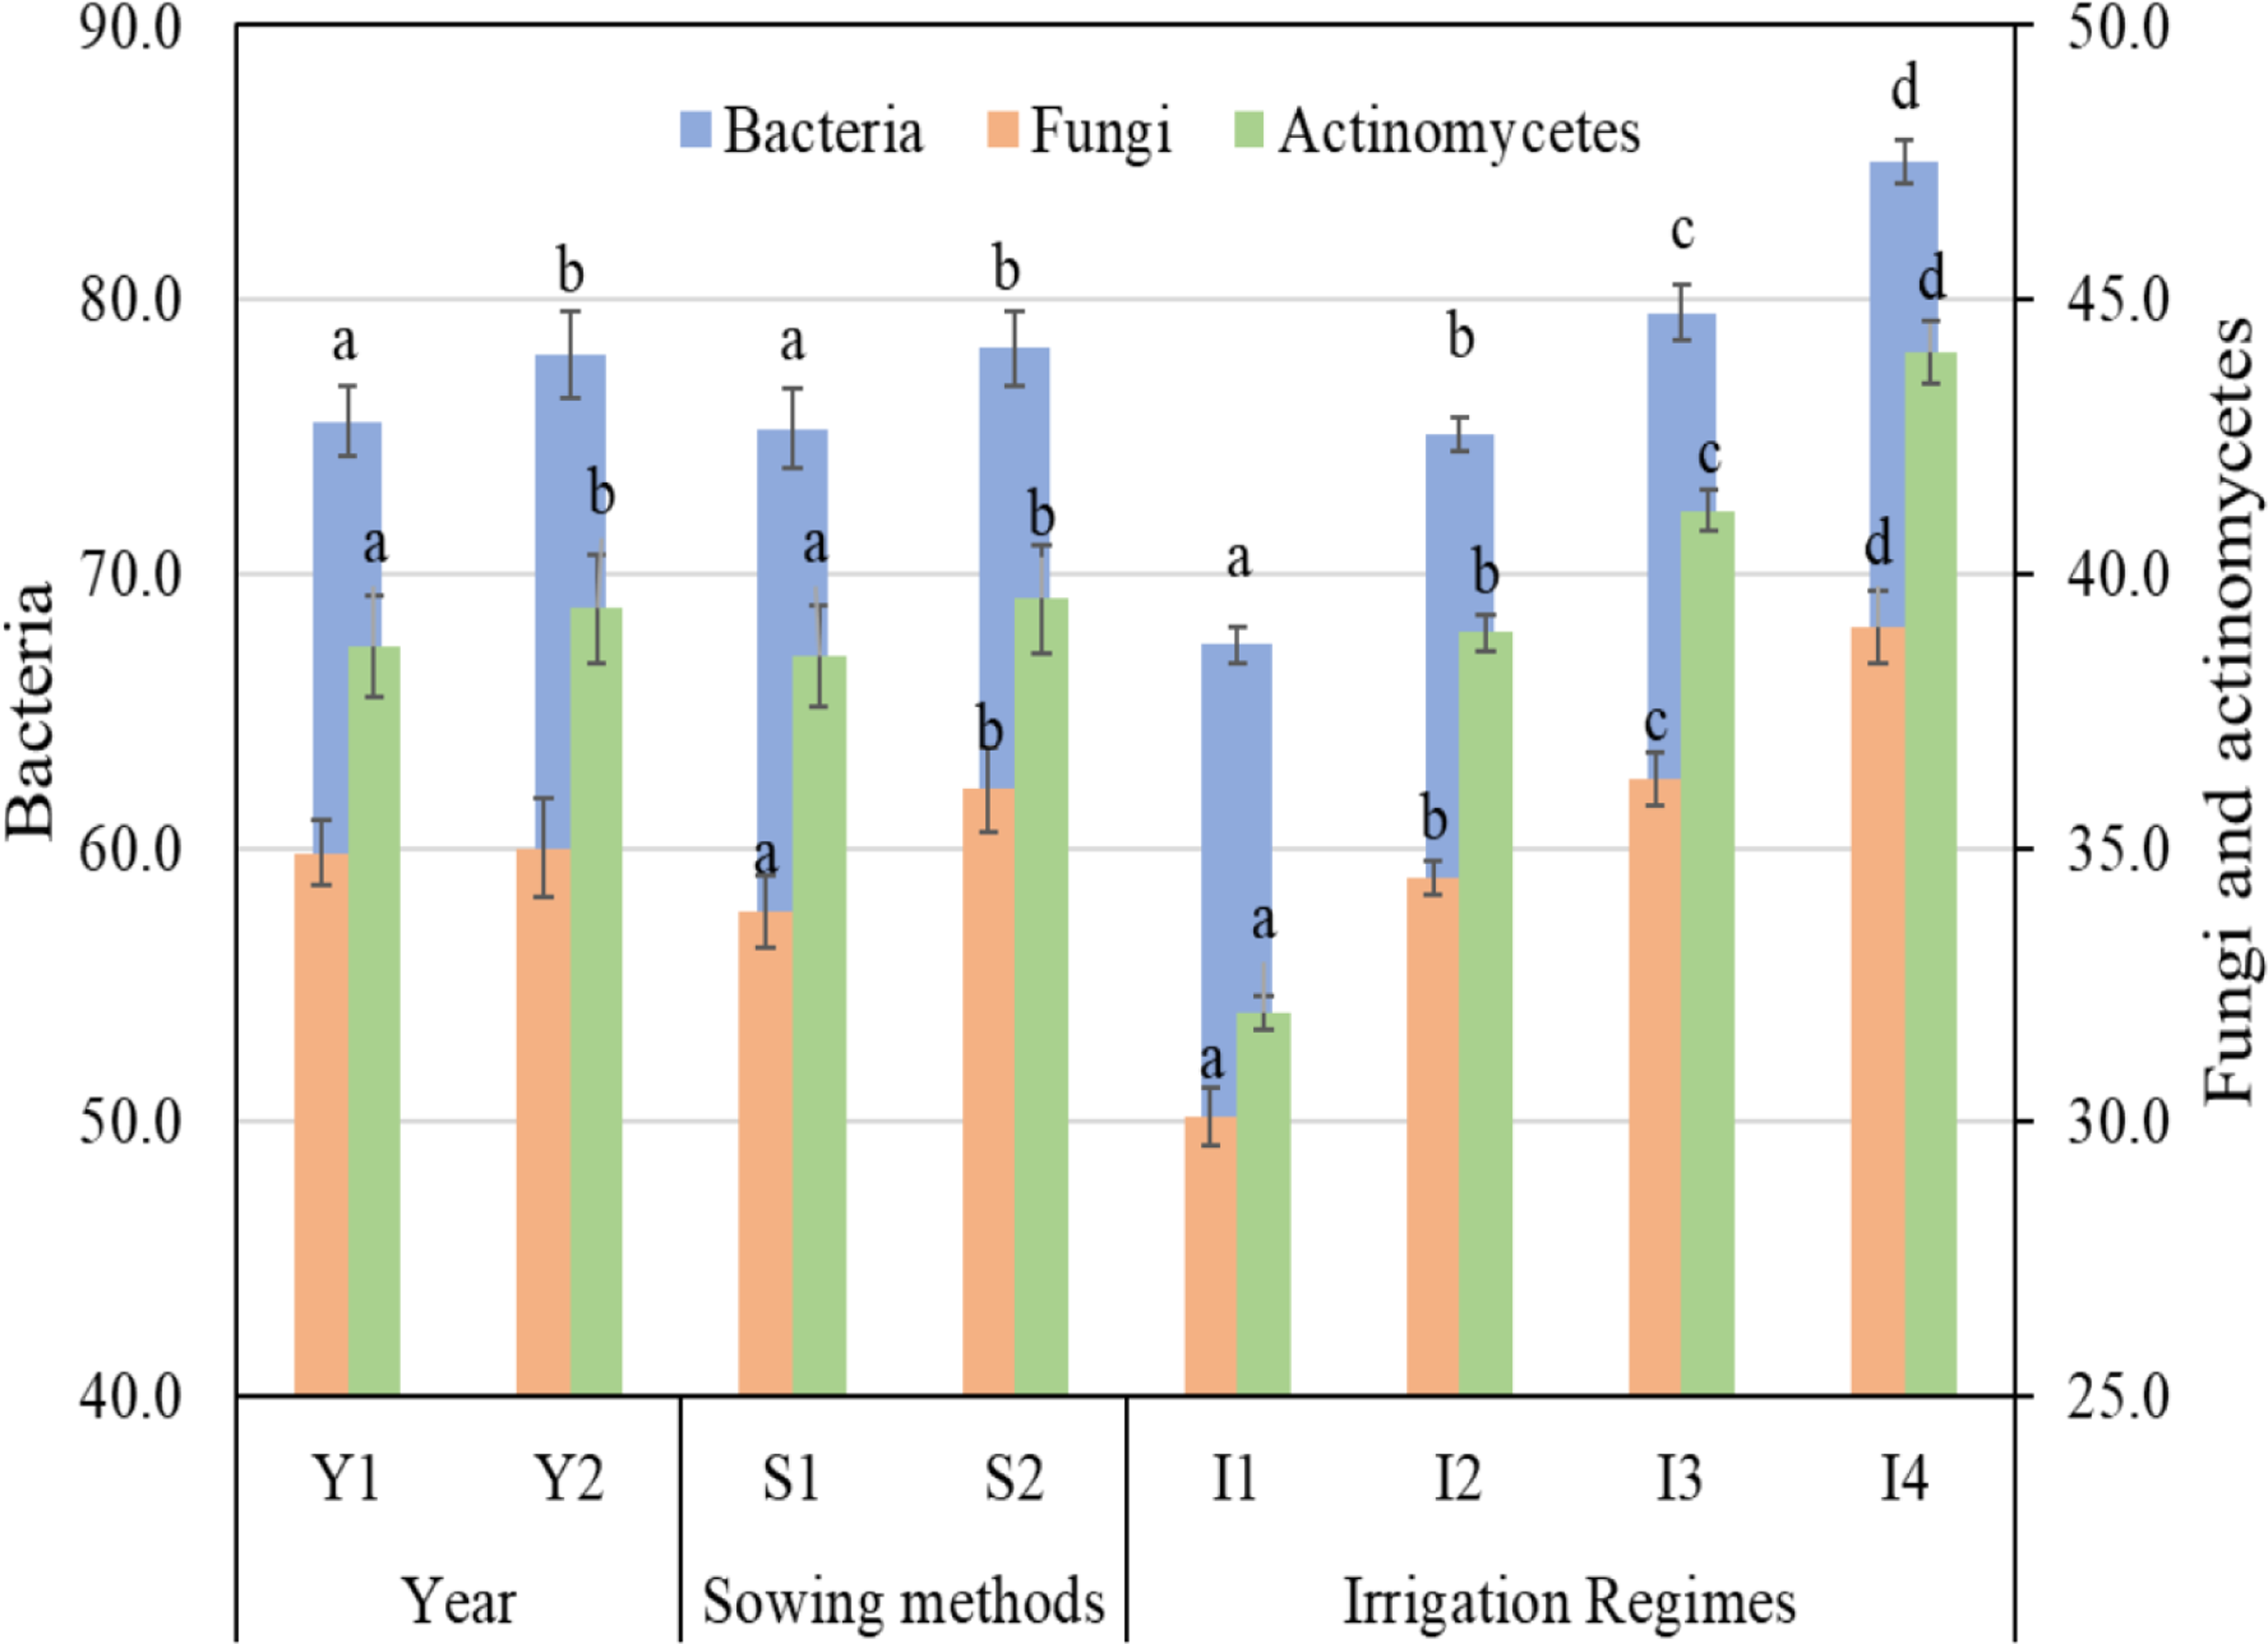
Microbial count under different irrigation regimes and sowing methods across the 2021–22 and 2022–23 seasons are summarised in Supplementary Table S7-a, S8-a & S9-a. The pooled analysis (Figure 2) revealed that soil microbial populations (bacteria and actinomycetes) were significantly influenced by year, sowing methods and irrigation regimes, showing a trend similar to that observed for soil-available nutrients. The highest microbial counts were recorded under the I4 irrigation regime, with bacteria at 85.0 × 10⁶ cfu/g soil, actinomycetes at 44.0 × 10⁵ cfu/g soil and fungi at 39.0 × 10⁴ cfu/g soil. Among sowing methods, ridge sowing supported significantly greater population of bacteria (78.2 × 10⁶ cfu/g soil), actinomycetes (39.6 × 10⁵ cfu/g soil) and fungi (36.0 × 10⁴ cfu/g soil. Microbial count was found to be higher during 2022–23. However, the interaction effect between year, sowing methods and irrigation regimes (Y*S*I) was statistically non-significant.
Effect of years, sowing methods and irrigation regimes on total microbial count- Bacteria (106 cfu/g soil), Fungi (104 cfu/g soil) and Actinomycetes (105 cfu/g soil). Error bars indicate the standard error of mean (SEM), and different uppercase and lowercase letters above bars denote significant differences among sowing methods and irrigation regimes, respectively.

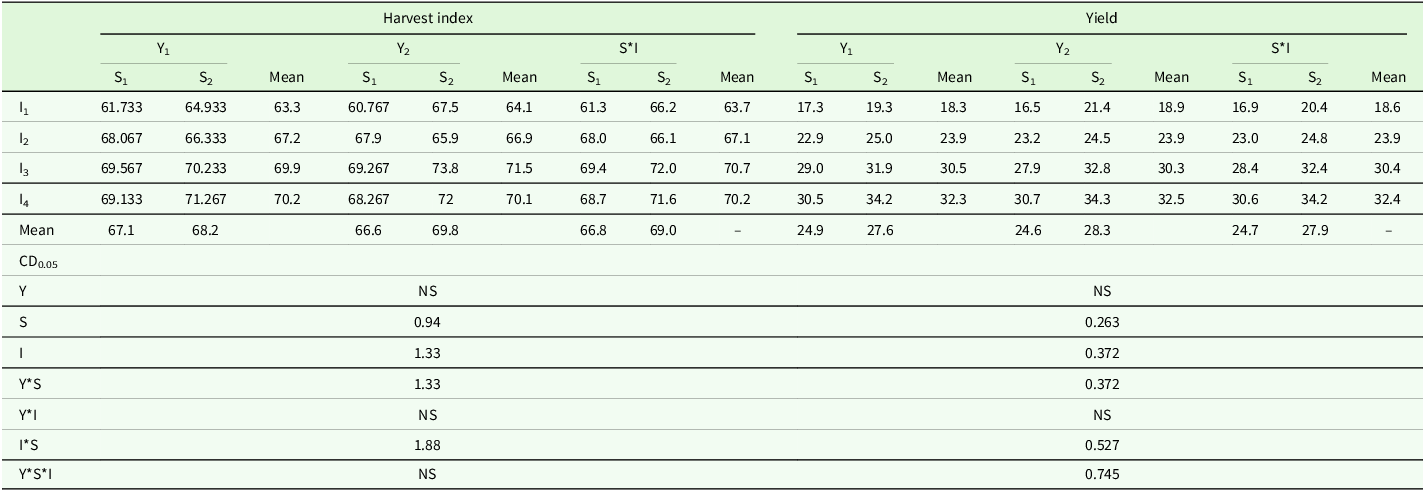
Harvest index and crop yield under varying irrigation and sowing methods during the 2021–22 and 2022–23 seasons are detailed in Table 5. Pooled analysis of harvest index and yield data showed significant variation across irrigation regimes and sowing methods (Table 5). Year had a non-significant effect on harvest index and yield. Irrigation regimes, sowing methods and their interaction also had a significant effect on HI (Table 5). Among irrigation regimes, maximum HI (70.7%) was observed under I3, which was statistically at par with I4 (70.2%), while the lowest HI occurred in I1. Among sowing methods, ridge (S2) demonstrated superior performance with the highest HI (69.0%). The interactions of treatments revealed that combination of S2I3 resulted maximum HI (72.0%), which was statistically at par with S2I4. Interaction effect among year, sowing methods and irrigation regimes found to be non-significant.
Effect of sowing methods and irrigation regimes on harvest index (%) and yield of carrot (t/ha) (Pooled data)

Y1- 2021–22, Y1- 2022–23, S1- Flat bed, S2- Ridge, I1 -IW/CPE 0.6, I2 -IW/CPE 0.8, I3 -IW/CPE 1.0, I4 -IW/CPE 1.2, CD-critical difference.
The maximum yield (32.4 t/ha) was achieved under I4 irrigation regime, which was 74.2% higher than the yield obtained under I1. Among sowing methods, ridge sowing method exhibited superior efficacy for achieving considerably higher yield (27.9 t/ha), corresponding to 13.0% increase over flat-bed sowing. The interaction between sowing method and irrigation regime was also significant, with S2I4 achieving the highest yield (34.2 t/ha), 103.1% higher than the lowest yielding S1I1. Similarly, S2I3 (32.4 t/ha) produced 92.0% more yield than S1I1, highlighting the synergistic benefits of higher irrigation coupled with ridge sowing. Year had a non-significant effect on yield of crop, while interaction effect found to be significant among year, sowing methods and irrigation methods.
Water use indices
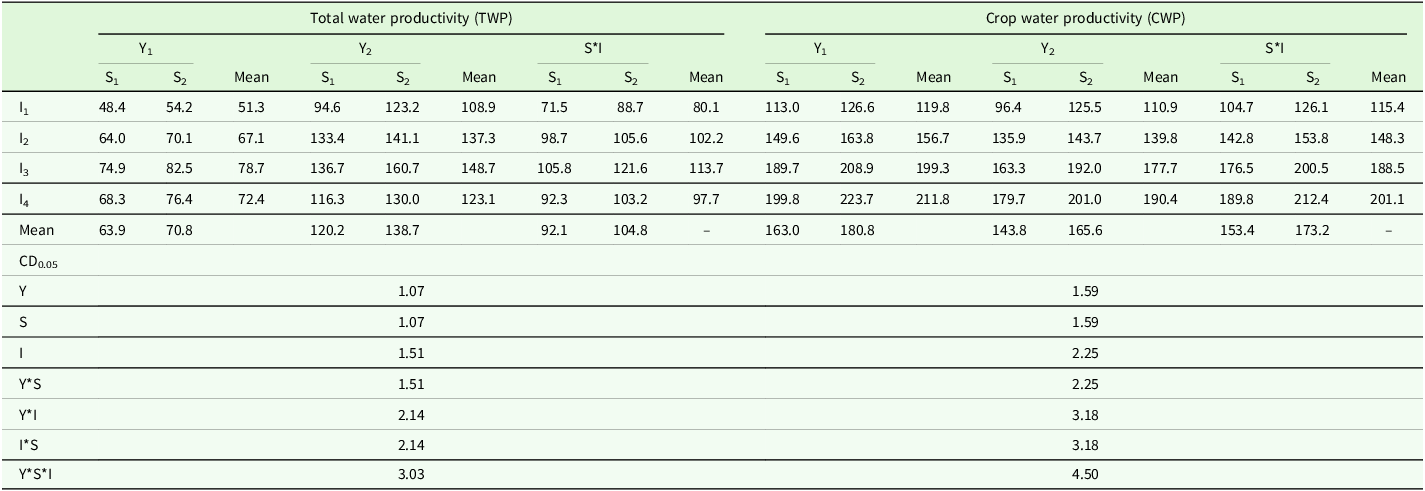
Crop water productivity and total water productivity data under varying irrigation and sowing methods during the 2021–22 and 2022–23 seasons are detailed in Table 6. Pooled data presented in Table 6 indicated that TWP and CWP was significantly influenced by different year, sowing methods and irrigation regimes. Among irrigation regimes, maximum TWP was recorded under I3 (113.7 kg/ha/mm), which was higher than I4 (97.7 kg/ha/mm), indicating that I3 achieved approximately 14.1% water saving compared to highest irrigation level. However, the maximum CWP was recorded under I4 (201.1 kg/ha/mm) followed by I3 (188.5 kg/ha/mm). Interactions among sowing methods and irrigation regimes revealed that highest TWP and CWP was under S2I3 (121.6 kg/ha/mm) and S2I4 (212.3 kg/ha/mm), respectively.
Effect of sowing methods and irrigation regimes on total water productivity (kg/ha/mm) and crop water productivity (kg/ha/mm) (Pooled data)

Y1- 2021–22, Y1- 2022–23, S1- Flat bed, S2- Ridge, I1 -IW/CPE 0.6, I2 -IW/CPE 0.8, I3 -IW/CPE 1.0, I4 -IW/CPE 1.2, CD-critical difference.
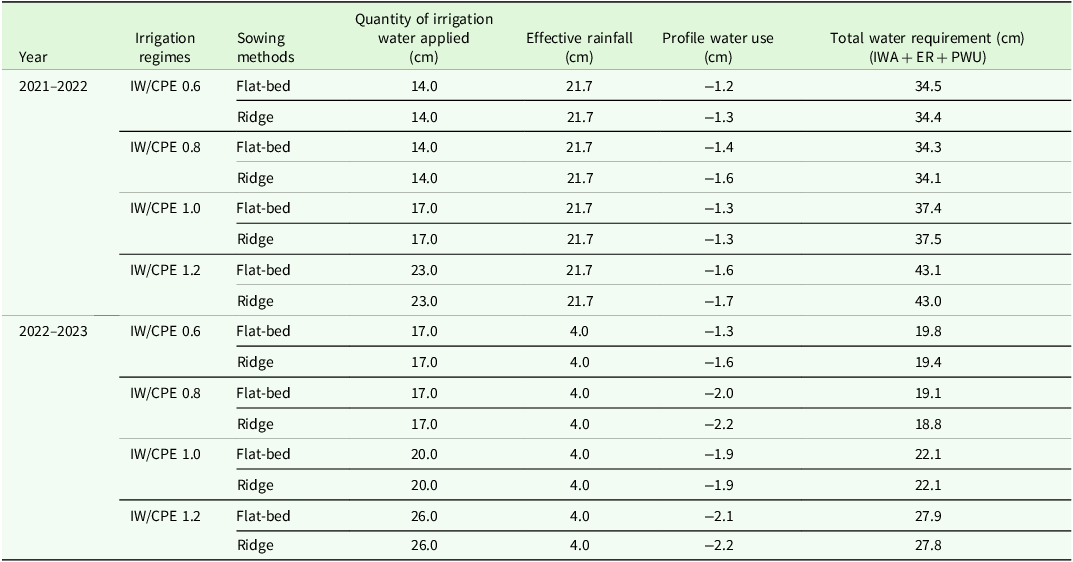
Detailed data on irrigation water inputs under different IW/CPE regimes during the 2021–22 and 2022–23 growing seasons are provided in Supplementary Table S12. Data pertaining to the total amount of water applied, profile water use and total water requirement are described in Table 7. Data indicated that maximum amount of water applied (23 and 26 cm) was under I4 irrigation regime during 2021–22 and 2022–23, respectively, resulting in maximum profile water use under S2I4 being negative (−1.69 and −2.19 cm), which reflects high amount of water applied under I4, which exceeds the crop requirement. Our study revealed that total water requirement was higher during 1st season because there was more effective rainfall (21.70 cm) in 2021–22 as compared to 2022–23 (4 cm).
Effect of sowing methods and irrigation regimes on water balance components and total water requirement

IWA, Irrigation water applied; ER, Effective rainfall; PWU, Profile water use; IW/CPE, Irrigation water/Cumulative pan evaporation.
Discussion
Soil nutrient availability
This study highlights the combined efficacy of optimal irrigation scheduling and an appropriate sowing method in enhancing nutrient availability and soil health, offering valuable insights for sustainable crop production. Water movement and distribution showed a strong correlation with nitrogen (N) dynamics, consistent with previous findings (Santos et al., Reference Santos, Sousa and Smith1997). Maximum available N was observed in the sub-surface layer (15–30 cm), likely due to less frequent but heavier irrigation events that induced a higher hydraulic gradient (Singh et al., Reference Singh, Tomar, Singh and Yadav2018). This gradient increased soil moisture content, facilitating the downward movement of applied N into deeper layer (Xu et al., Reference Xu, Cai, Wang, Ma, Liu, Ding, Wang, Chen, Wang and Saddique2020). The high mobility of nitrate-N (NO3 -N) allowed it to move readily with percolating water and accumulating at lower depths (Thakur, Reference Thakur2020; Wang et al., Reference Wang, Hu, Liu, Ahmad and Zhou2021).
Higher available P under I4 regime was attributed to increased activity of specific P-solubilising microbes, enhanced mineralisation of organic matter and greater conversion of fixed P in available forms under adequate moisture (Singh et al., Reference Singh, Hari Ram and Sonkar2008). The distribution of available K is primarily influenced by diffusion and adsorption onto the soil exchange complex, resulting in higher K accumulation in the surface layer (0–15 cm). Lower values of available P and K in sub surfaces (15–30 cm) may be due to restricted movement and fixation in soil (Badr, Reference Badr2007). Optimal moisture and aeration also promote mineralisation of organic fractions and thereby increasing nutrient availability (Sharma et al., Reference Sharma, Sharma, Shukla, Verma, Singh, Spehia, Sharma, Gautam, Dogra, Tecimen, Kumar and Kumar2023).
Among sowing methods, ridge sowing method showed superior nutrient retention due to reduced leaching and denitrification losses under better controlled irrigation. Increased nutrient availability under ridge sowing was linked to improved soil moisture, which stimulated microbial activity and accelerated nutrient mineralisation and transformation processes (Elshamly and Nassar, Reference Elshamly and Nassar2023).
Yield and water use indices
Higher irrigation frequency reduces soil strength in the root zone and improves nutrient availability, thereby creating conducive conditions for growth and development of carrot (Ciza et al., Reference Ciza, Silungwe and Kihupi2022). Carrot yield increased with higher irrigation regimes, likely due to greater photosynthetic activity and improved assimilate partitioning under uniformly supplied soil moisture (Alam et al., Reference Alam, Malik, Costa and Alam2010; Sarkar et al., Reference Sarkar, Akter, Bakhashwain, Mousa and Ibrahim2024). Compared with flat-bed sowing, ridge sowing provides better temperature regulation, aeration and drainage, ensuring optimal oxygen availability in the root zone (Carvalho et al., Reference Carvalho, Silva, Guedes, Pereira, Martins and Magalhães2023). It also facilitates the maintenance of balanced soil moisture-nutrient environment throughout the growing season, thereby promoting improved root and shoot growth (Anozie and Baiyeri, Reference Anozie and Baiyeri2022; Solanki et al., Reference Solanki, Kaswala, Dubey and Italiya2020).
Seasonal variability in water requirements was evident, with higher demands in 2021–22 due to greater effective rainfall, emphasising the dynamic relationship between rainfall and irrigation. Yield and the amount of irrigation are key determinants of water productivity (Patel et al., Reference Patel, Patel, Patel, Patel and Tikka2005; Tlig et al., Reference Tlig, Mokh, Autovino, Iovino and Nagaz2023). The improved TWP under the I3 regime with ridge validates that optimised irrigation regime provides maximum production per unit of water use by maintaining adequate water availability, while minimising excess water and evaporative losses (Pal et al., Reference Pal, Kumar, Pravesh, Singh and Gangwar2020).
CWP directly associated with yield and ETc, as it excludes effective rainfall and reflects the crop water demand required to produce one unit yield under different irrigation regimes. Highest yield or per unit production was achieved under I4 irrigation level, which consequently resulted in the maximum in CWP (Maida et al., Reference Maida, Bisen and Dhakad2020 and Singh et al., Reference Singh, Verma, Kumar, Lothe, Kumar, Chauhdhary, Kaur, Singh, Singh, Kumar, Anandakumar and Singh2021). However, these findings are more specific to mid hill conditions and based on two growing seasons, therefore multi location and long-term studies are needed to validate and generalise the recommendations.
Conclusions
This study demonstrated that conjoint use of ridge sowing and IW/CPE ratio of 1.0 (I3) emerged as the most effective strategy for improving carrot yield, soil quality and increasing water use efficiency under mid-hill conditions. The optimal irrigation schedule (I3) saved 15% more water than I4, while producing comparable yields, highlighting its superior efficiency in optimising water use under water limited environment. This confirmed it as the most sustainable and viable option, thus, validating the research hypothesis that optimal irrigation scheduling combined with ridge sowing improves yield and water use efficiency without compromising soil health. Hence, based on results it can be recommended as a practical approach for carrot cultivation under similar agro-ecological conditions. To strengthen adoption and refine recommendation, future research should incorporate multi-locational trials, economic evaluation and comparison with micro-irrigation system across diverse environments.
Supplementary material
The supplementary material for this article can be found at https://doi.org/10.1017/S0021859626100707.
Acknowledgements
The authors are thankful to the Department of Soil Science and Water Management, Dr. Yashwant Singh Parmar, University of Horticulture and Forestry, Nauni, Solan, H.P, India for providing necessary facilities to conduct this work.
Author contributions
Prikxit and JC Sharma conceived and designed the study. Prikxit, JC Sharma conducted the research experiment and recorded the data. Prikxit and Archna Sharma performed statistical analyses. Prikxit, JC Sharma, Bhawna Babal and Archna Sharma wrote the article.
Funding statement
The authors have not taken any assistance from any funding agency.
Competing interests
The authors declare that they have no known competing financial interest or personal relationships that could have appeared to influence the work reported in this paper.
Ethical standards
Not applicable.