


1 Motivation
Social scientists routinely represent entities as vectors in high-dimensional spaces where the elements of those vectors have been estimated (e.g., Kraft and Klemmensen Reference Kraft and Klemmensen2024; Mozer et al. Reference Mozer, Miratrix, Kaufman and Jason Anastasopoulos2020; Nyarko and Sanga Reference Nyarko and Sanga2022; Rodriguez et al. Reference Rodriguez, Spirling and Stewart2023; Rossiter Reference Rossiter2022; van Loon et al. Reference van Loon, Giorgi, Willer and Eichstaedt2022). For instance, they might represent documents in terms of the modeled topic proportions they contain, or Members of Congress in terms of their estimated positions in several dimensions of ideological space. From these representations, researchers draw conclusions about the (dis)similarity, between the documents or actors in question. They do this via measured distances between the vectors. This calculation is typically trivial: for example, it takes very little computational effort to compare two word embedding vectors in terms of their Euclidean distance from one another. But this simple “plugin” estimator can be misleading in practice. This is because the elements of the vector are estimated with error, yet this uncertainty is not properly incorporated into the distance calculation. The result is an upward bias in the measurement of that distance; and this bias is worse when the vectors are more poorly estimated. This problem has been observed in several fields, but the remedies are not well known or implemented (e.g., Gentzkow et al. Reference Gentzkow, Shapiro and Taddy2019; Logan et al. Reference Logan, Foster, Ke and Li.2018; Walther et al. Reference Walther, Nili, Ejaz, Alink, Kriegeskorte and Diedrichsen2016; Weir et al. Reference Weir, Wheatcroft and Price.2012).Footnote 1 Thus our treatment below.
We explain the problem and show that statistical bias can be large and consequential, especially in comparisons where one group-wise distance has been estimated with greater uncertainty than another distance. This might be due to different sample sizes. Less intuitively, it might be due to sample sizes that are imbalanced across comparisons: e.g., a (very imbalanced) majority v minority group vector distance versus a (balanced) 50:50 group distance. This is in contrast with bias in (balanced) pairwise distances of non-averaged vectors Kraft and Klemmensen (Reference Kraft and Klemmensen2024); Mozer et al. (Reference Mozer, Miratrix, Kaufman and Jason Anastasopoulos2020); Rossiter (Reference Rossiter2022), where a) researchers intend for distances to capture levels of measurement error (and not a document’s expected value) or b) such bias may have more limited effects on later inferences – since researchers might plausibly assume more or less equal measurement error across studied pairs.
We derive an estimator that does not suffer from this bias, and we show that it performs well in a variety of settings. Finally, we provide solutions to practical issues that arise in the embedding regression setting (e.g., statistical testing and inference) and incorporate the solution into the conText package in R.
2 Why Uncertainty in Position Leads to Bias
To fix ideas, suppose one had a relatively short vector—of length 2—representing a word embedding. For the word “immigration” (say) that embedding is estimated (e.g., because it is based on a sample of speech) to be $\widehat {v_D} = (-0.1 , 1.2)$
for Democrats in Congress. The inferential task is to compare it with some other embedding vector which, for now, we will assume is known (not estimated) and is
$\widehat {v_D} = (-0.1 , 1.2)$
for Democrats in Congress. The inferential task is to compare it with some other embedding vector which, for now, we will assume is known (not estimated) and is $v_R= (0,1)$
(the noiseless, expected value of the “immigration” embedding for Republicans in Congress). The Euclidean distance between
$v_R= (0,1)$
(the noiseless, expected value of the “immigration” embedding for Republicans in Congress). The Euclidean distance between $\widehat {v_D}$
and
$\widehat {v_D}$
and $v_R$
is 0.224. The cosine similarity between them is 0.997. We might ask: is the (true) Euclidean distance plausibly zero, and is the cosine similarity plausibly 1?
$v_R$
is 0.224. The cosine similarity between them is 0.997. We might ask: is the (true) Euclidean distance plausibly zero, and is the cosine similarity plausibly 1?
To see the problem, suppose our estimate of $v_D$
is noisy. This might be because we do not have many Democrats in our sample, and thus there is more uncertainty over each (averaged) element in the
$v_D$
is noisy. This might be because we do not have many Democrats in our sample, and thus there is more uncertainty over each (averaged) element in the $\widehat {v_D}$
vector. If we increase the noise in the estimated
$\widehat {v_D}$
vector. If we increase the noise in the estimated $\widehat {v_D}$
when there is no (true) difference between
$\widehat {v_D}$
when there is no (true) difference between $v_D$
and
$v_D$
and $v_R$
, we always move it further from
$v_R$
, we always move it further from $(0,1)$
. But this bias also applies in expectation when there is some (true) difference between
$(0,1)$
. But this bias also applies in expectation when there is some (true) difference between $v_D$
and
$v_D$
and $v_R$
. For instance suppose that across samples or noisy measurements, the values that we estimate for
$v_R$
. For instance suppose that across samples or noisy measurements, the values that we estimate for $v_D$
(the unobserved sampling distribution of
$v_D$
(the unobserved sampling distribution of $\widehat {v_D}$
) are sometimes greater than corresponding elements in the
$\widehat {v_D}$
) are sometimes greater than corresponding elements in the $v_R$
vector and sometimes less. Then our element distances are nonetheless always positive; thus in expectation, the estimated distance is greater than the true distance. We illustrate this effect in SI Figure C.1, and also there expand our bias explanation.
$v_R$
vector and sometimes less. Then our element distances are nonetheless always positive; thus in expectation, the estimated distance is greater than the true distance. We illustrate this effect in SI Figure C.1, and also there expand our bias explanation.
To characterize the bias more fully and precisely, consider measuring the Euclidean distance between two (estimated) length-K vectors $\hat {\theta }$
and
$\hat {\theta }$
and $\hat {\phi }$
—of which our word embeddings vectors above were just specific examples. This is, by definition, the
$\hat {\phi }$
—of which our word embeddings vectors above were just specific examples. This is, by definition, the $L_2$
norm of the difference between those vectors,
$L_2$
norm of the difference between those vectors, $\lVert \hat {\theta } - \hat {\phi }\rVert _2 =\sqrt {\sum _{k=1}^K(\hat {\theta }_k - \hat {\phi }_k)^2} $
. Now, for presentation reasons (though, as noted below, this will also be our preferred norm), suppose we square that norm. That is, we are working with
$\lVert \hat {\theta } - \hat {\phi }\rVert _2 =\sqrt {\sum _{k=1}^K(\hat {\theta }_k - \hat {\phi }_k)^2} $
. Now, for presentation reasons (though, as noted below, this will also be our preferred norm), suppose we square that norm. That is, we are working with $\lVert \hat {\theta } - \hat {\phi }\rVert ^2_2 = \sum _{k=1}^K(\hat {\theta }_k - \hat {\phi }_k)^2$
. Taking expectations on both sides we have
$\lVert \hat {\theta } - \hat {\phi }\rVert ^2_2 = \sum _{k=1}^K(\hat {\theta }_k - \hat {\phi }_k)^2$
. Taking expectations on both sides we have
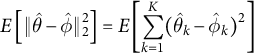 $$ \begin{align} E \left[\lVert\hat{\theta} - \hat{\phi}\rVert^2_2\right] &= E\left[\sum_{k=1}^K(\hat{\theta}_k - \hat{\phi}_k)^2\right]\qquad\qquad\qquad\qquad\quad \ \ \end{align} $$
 $$ \begin{align} &= \sum_{k=1}^K E[(\hat{\theta}_k - \hat{\phi}_k)]^2 + V[\hat{\theta}_k - \hat{\phi}_k] \end{align} $$
 $$ \begin{align} &= \lVert \theta - \phi \rVert^2_2 + \underbrace{\sum_{k=1}^K V[\hat{\theta}_k-\hat{\phi}_k]}_{\text{Bias}} \qquad\end{align} $$
where line 2 follows because $E[X^2] = E[X]^2 + V[X]$
for a random variable X. Importantly, variance here is the variance of the (unobserved) distribution of the estimator (i.e., the squared standard error). The point is that the bias (for the squared norm) is the (sum of the) variances of the differences between the vectors’ elements. And those variances result from uncertainty in estimation of
$E[X^2] = E[X]^2 + V[X]$
for a random variable X. Importantly, variance here is the variance of the (unobserved) distribution of the estimator (i.e., the squared standard error). The point is that the bias (for the squared norm) is the (sum of the) variances of the differences between the vectors’ elements. And those variances result from uncertainty in estimation of $\phi $
and
$\phi $
and $\theta $
. Only if the elements of those vectors are estimated without error is there no bias. To be clear, there is no obligation to use the squared Euclidean norm—one can use the unsquared version (as in Rodriguez et al. Reference Rodriguez, Spirling and Stewart2023, where this version is used but uncorrected), cosine similarity, or some other metric. But some version of the bias will remain—and the form of the bias is not straightforward to write down or fully correct (see SI Sections C.2 and C.2.1).
$\theta $
. Only if the elements of those vectors are estimated without error is there no bias. To be clear, there is no obligation to use the squared Euclidean norm—one can use the unsquared version (as in Rodriguez et al. Reference Rodriguez, Spirling and Stewart2023, where this version is used but uncorrected), cosine similarity, or some other metric. But some version of the bias will remain—and the form of the bias is not straightforward to write down or fully correct (see SI Sections C.2 and C.2.1).
Linking this back to our initial motivating example, we need to subtract the variances (i.e., the squared standard errors) of $\widehat {v_{D1}} v_{R1}$
and
$\widehat {v_{D1}} v_{R1}$
and $\widehat {v_{D2}} v_{R2}$
from
$\widehat {v_{D2}} v_{R2}$
from $0.224^2$
(
$0.224^2$
( $(\widehat {v_{D1}} v_{R1})^2 + (\widehat {v_{D2}} v_{R2})^2$
) for an unbiased estimate of the squared Euclidean distance between
$(\widehat {v_{D1}} v_{R1})^2 + (\widehat {v_{D2}} v_{R2})^2$
) for an unbiased estimate of the squared Euclidean distance between $v_D$
and
$v_D$
and $v_R$
.
$v_R$
.
3 Why this Matters, Even in Large Samples
Inspecting Equation (2.3), when could we realistically expect the absolute bias to be small or zero? It is when we have a very large amount of data such that our estimates of the (elements of the) vectors are close to their true population values. And, for descriptive relative comparisons such as “the difference between Democrat women and men on this issue is larger than for Republican women and men” we must describe the distances correctly if measurement or sampling error may be unequal across these comparisons. But to clarify, the issue is not that small samples make claims about whether one vector is statistically significantly different to another harder to assess; they do, but that is a separate matter. The issue is that the claimed (point) difference between the vectors is reported as being larger than it really is irrespective of hypothesis test concerns.
Of course, it is hard to know in advance whether one has “enough” data or not. However, the problem will remain in absolute terms when the dimension of the vector is high relative to the uncertainty. And, below, we show that it can remain in relative terms when two compared group-wise differences are relatively imbalanced.
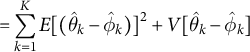
To illustrate absolute versus relative bias, we use a 10% sample of the Twitter voter panel described in Hughes et al. (Reference Hughes, McCabe, Hobbs, Remy, Shah and Lazer2021) and compare random groups (where the true difference must be zero by construction) of varying relative sizes and for the same overall sample size—for example, in more practical terms, a 50–50 party affiliation comparison based on 1000 total observations versus a 90–10 majority–minority racial group comparison based on 1,000 total observations. Specifically, we compare these groups by estimating embeddings of the word children (derived by the methods in Rodriguez et al. Reference Rodriguez, Spirling and Stewart2023) for them, restricting our analysis to a single tweet each from a random sample of users and only tweets containing a single use of the word children—we address more complex designs later in this paper. We then calculate the squared Euclidean norm of the difference between (the average) embedding vector of children for the 50–50 comparison (e.g., gender or U.S. political party) versus 90–10 (e.g., majority–minority race or religion). In this, increasing group imbalance leads to increased estimate uncertainty.
Figure 1 shows the squared Euclidean norm (with jackknifed confidence interval) for both the balanced and imbalanced random groups. While the size of the estimated difference—note the y-axis scale is much smaller as we move across the page—is decreasing as the sample size grows (from 200 to 400 and upwards to 10,000 instantiations of the term), the difference between the balanced and unbalanced case remains essentially the same in relative terms. This issue matters because the absolute size of the norm often has no clear interpretation and scholars use the relative scale of the differences to benchmark their results. Simply put, for practical reasons of interpretation, large sample sizes will not fix this issue.
Smaller sample sizes and larger group imbalance both lead to increased estimate uncertainty, and so artificially inflate distance estimates. This can exaggerate majority-minority group differences relative to equally sized group differences.
4 A Correction Based on Variance Estimation
Below, we derive a correction for both simple (a two-group comparison) and complex designs (e.g., non-independent observations and controls). Our applied setting is embedding regression though it will work in other settings too.
Consider the generic case where the model on our latent vectors is parameterized by a vector $\beta $
. In the context of two groups’ embeddings this would just be the difference between their average vectors (
$\beta $
. In the context of two groups’ embeddings this would just be the difference between their average vectors ( $\beta =\theta - \phi $
) but we can think of it as a more general regression parameter. If our summary of this vector is the squared Euclidean norm, this would lead to the estimator,
$\beta =\theta - \phi $
) but we can think of it as a more general regression parameter. If our summary of this vector is the squared Euclidean norm, this would lead to the estimator,
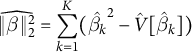 $$ \begin{align} \widehat{\lVert\beta\rVert^2_2}= \sum_{k=1}^K (\hat{\beta_k}^2 - \hat{V}[\hat{\beta}_k] ) \end{align} $$
which is unbiased given an unbiased estimator of the variance $\hat {V}[\cdot ]$
(and an unbiased estimator for
$\hat {V}[\cdot ]$
(and an unbiased estimator for $\beta $
).Footnote 2
$\beta $
).Footnote 2
For the (non-squared) Euclidean norm, because the corrected value can be negative, we can take the square root of the absolute value $\widehat {\lVert \beta \rVert ^2_2}$
and then apply the sign of the estimate. Let that sign of
$\widehat {\lVert \beta \rVert ^2_2}$
and then apply the sign of the estimate. Let that sign of $\widehat {\lVert \beta \rVert ^2_2}$
—i.e., literally whether the quantity
$\widehat {\lVert \beta \rVert ^2_2}$
—i.e., literally whether the quantity $\sum _{k=1}^K \hat {\beta _k}^2 - \sum _{k=1}^K \hat {V}[\hat {\beta }_k]$
is positive or negative—be denoted as
$\sum _{k=1}^K \hat {\beta _k}^2 - \sum _{k=1}^K \hat {V}[\hat {\beta }_k]$
is positive or negative—be denoted as $\text {sgn}$
. Then we have the estimator,
$\text {sgn}$
. Then we have the estimator, $\widehat {\lVert \beta \rVert } = \text {sgn}\sqrt {\text {abs}\left (\sum _{k=1}^K \hat {\beta _k}^2 - \sum _{k=1}^K \hat {V}[\hat {\beta }_k]\right )}$
. However, this estimator is no longer unbiased, as we will show. And, unlike the squared version, it is strongly bimodal. We illustrate this bimodality and potential interpretation problems in SI Figures C.3 and C.4. Nonetheless, it does provide an estimate closer to a null of no difference, and with bias far smaller than for the uncorrected norm. Further, in this form, the quantity can be used to (mostly) correct bias that arises in cosine similarity measures (which itself arises due to bias in the Euclidean distance denominator of those measures; see SI Section C.7). While we think it is reasonable for some researchers to prefer the ordinary Euclidean distance (and cosine similarity), authors who use these corrected distance measures should be careful to fully explain to readers their bimodal distributions and correspondingly skewed confidence intervals around 0.
$\widehat {\lVert \beta \rVert } = \text {sgn}\sqrt {\text {abs}\left (\sum _{k=1}^K \hat {\beta _k}^2 - \sum _{k=1}^K \hat {V}[\hat {\beta }_k]\right )}$
. However, this estimator is no longer unbiased, as we will show. And, unlike the squared version, it is strongly bimodal. We illustrate this bimodality and potential interpretation problems in SI Figures C.3 and C.4. Nonetheless, it does provide an estimate closer to a null of no difference, and with bias far smaller than for the uncorrected norm. Further, in this form, the quantity can be used to (mostly) correct bias that arises in cosine similarity measures (which itself arises due to bias in the Euclidean distance denominator of those measures; see SI Section C.7). While we think it is reasonable for some researchers to prefer the ordinary Euclidean distance (and cosine similarity), authors who use these corrected distance measures should be careful to fully explain to readers their bimodal distributions and correspondingly skewed confidence intervals around 0.
These estimators rely on a way of estimating the variance of the estimator for $\beta $
. For the simplest case, for comparing embeddings of dimensions K, one can run K separate (linear) regressions, each with n observations corresponding to the number of instantiations of the term in question. One then has immediate access to the relevant
$\beta $
. For the simplest case, for comparing embeddings of dimensions K, one can run K separate (linear) regressions, each with n observations corresponding to the number of instantiations of the term in question. One then has immediate access to the relevant $\hat {\beta }$
s and the standard errors (and thus variances) of the same. We illustrate this debiasing using R’s lm function (R’s main linear regression function) in SI section A, where the de-biasing step is simply estimate
$\hat {\beta }$
s and the standard errors (and thus variances) of the same. We illustrate this debiasing using R’s lm function (R’s main linear regression function) in SI section A, where the de-biasing step is simply estimate $^2$
- std.error
$^2$
- std.error $^2$
.
$^2$
.
To demonstrate the efficacy of the correction, using variances estimated from the K linear regressions method above, we simulate differences in means by sampling vectors from a multivariate normal and comparing the corrected and uncorrected norms for different group imbalances (50%–50% or 10%–90%). In this, we sample $k=50$
“embedding” dimensions, for varying sample sizes. Across these 50 dimensions, the locations of the two groups are offset by a value of
$k=50$
“embedding” dimensions, for varying sample sizes. Across these 50 dimensions, the locations of the two groups are offset by a value of $\pm c$
, where c is a small or large number, on half (25) of the dimensions. The variance of each dimension is selected by a random draw from a non-central (specifically
$\pm c$
, where c is a small or large number, on half (25) of the dimensions. The variance of each dimension is selected by a random draw from a non-central (specifically $\lambda =1$
)
$\lambda =1$
) $\chi ^2$
distribution with one degree of freedom, meaning that variance is not equal across dimensions. Figure 2 displays the uncorrected plugin estimator for the squared Euclidean norm. It shows that whatever the group imbalance, the corrected estimator is unbiased: on average, it recovers the true distance.
$\chi ^2$
distribution with one degree of freedom, meaning that variance is not equal across dimensions. Figure 2 displays the uncorrected plugin estimator for the squared Euclidean norm. It shows that whatever the group imbalance, the corrected estimator is unbiased: on average, it recovers the true distance.
This figure shows simulation results for the squared Euclidean norm divided by the number of dimensions (i.e., the square of the true $\beta $
’s). The horizontal black lines represent the true Euclidean norm squared, divided by the number of dimensions (50). Points represent the averages of the simulations and intervals are the
$\beta $
’s). The horizontal black lines represent the true Euclidean norm squared, divided by the number of dimensions (50). Points represent the averages of the simulations and intervals are the $2.5\%$
to
$2.5\%$
to $97.5\%$
quantiles of the sampling distributions. Small sample size and greater group imbalance increase estimation uncertainty (i.e., the standard error/variance of
$97.5\%$
quantiles of the sampling distributions. Small sample size and greater group imbalance increase estimation uncertainty (i.e., the standard error/variance of $\hat {\beta }$
). The effect of greater k can be determined by multiplying the y-axis scale by k.
$\hat {\beta }$
). The effect of greater k can be determined by multiplying the y-axis scale by k.
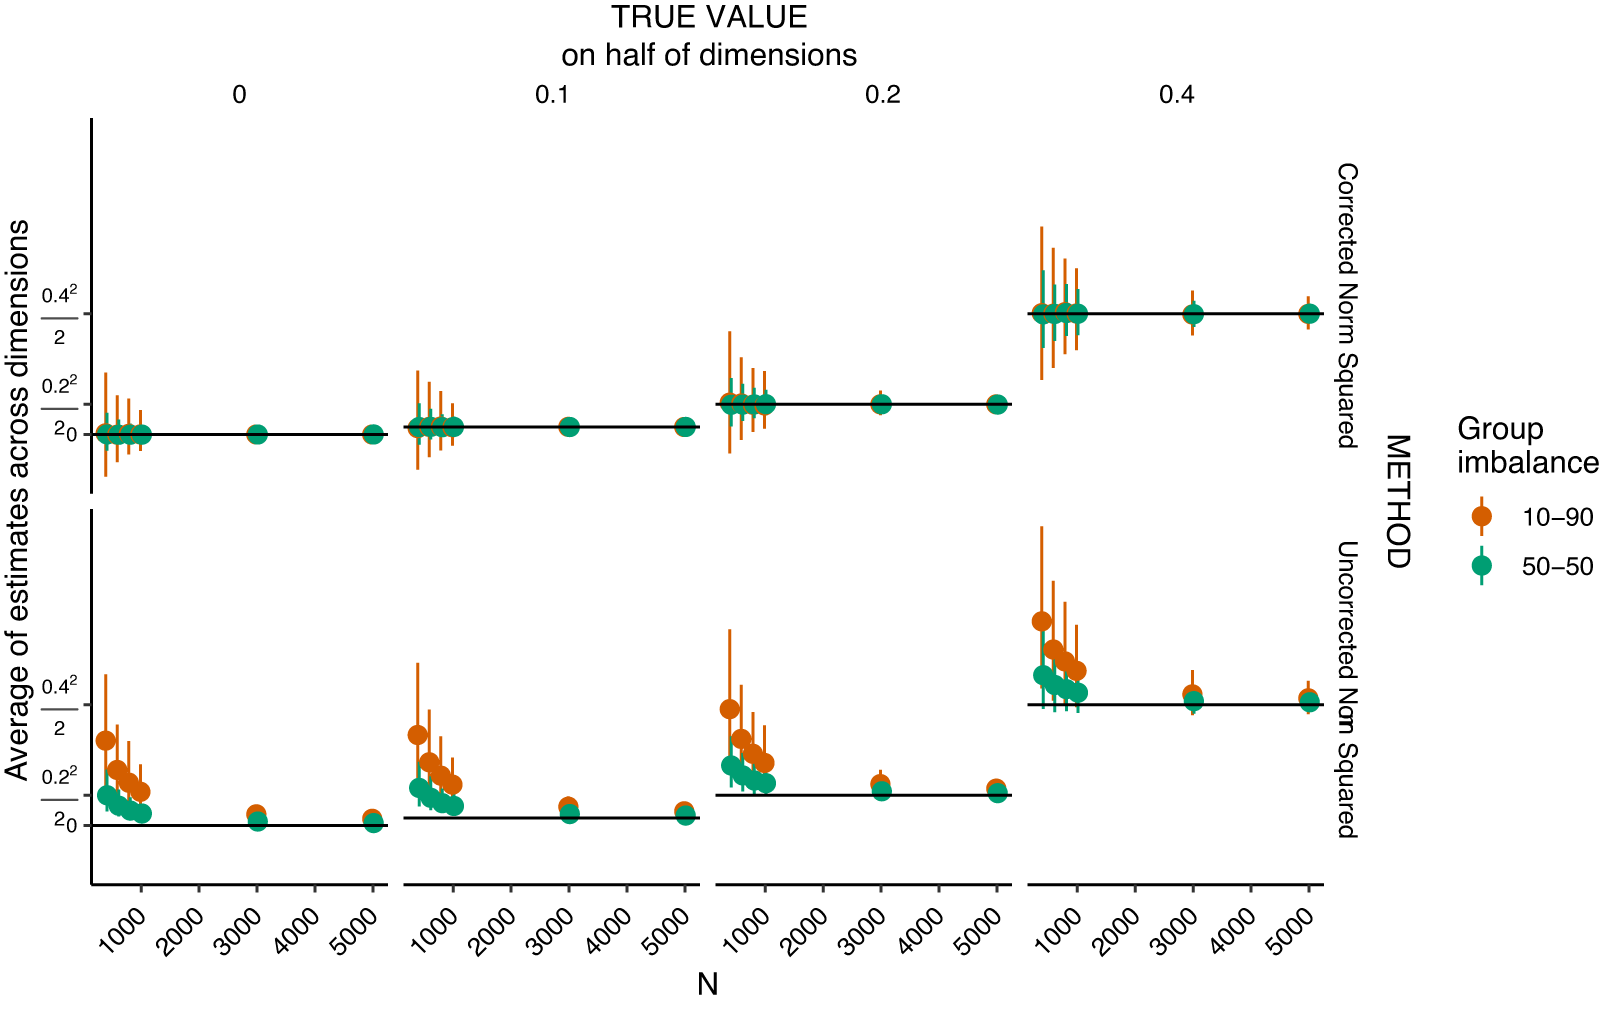
Figure 2 in the SI is the same analysis for the non-squared (i.e., the usual) Euclidean norm. This corrected estimator has a small negative bias, but it still substantially outperforms the plug-in estimator.
4.1 Clustering and Complex Sampling Designs
In some cases, such as embedding regression, observations are not independent. This can cause a naive estimator to underestimate the variance of the difference and permutation tests to be inaccurate.Footnote 3 In the SI, we provide and validate through simulation straightforward solutions to these problems, demonstrating that a) we can use sandwich-style standard errors to estimate the variance under clustering and other complex designs when computing our debiased estimator, b) clustered permutation appropriately controls Type I error under clustering (see SI Section C.6, and C.6.2), and c) residual permutation controls Type I error with control variables (see SI Sections C.6, and C.6.2).
We illustrate performance under a realistic setting with clustering and covariates in Figure 3. For this, we use a Twitter data set linked to voter records and voter demographics, described in Hughes et al. (Reference Hughes, McCabe, Hobbs, Remy, Shah and Lazer2021). In a 10% sample (approximately 150,000 users out of 1.5 million), we analyzed tweets between January 2019 and February 2023 that contained the word “people” (specifically 72,389 users, who posted 5.5 million tweets containing “people”). To simulate sampling distributions with this ‘population’, we then created sub-samples of users for varying sample sizes (n), taking 500 samples for each n. For these sub-samples (and on the full sample/“population”), we ran embedding regression with covariates—party (Republican or Democrat), age group, gender, and race—and with each user weighted equally in the models (rather than by tweet frequency). In the figure, the points indicate the mean of the squared Euclidean norm for party, with intervals for the 2.5% to 97.5% quantiles of the sampling distribution.
Estimator performance on sub-samples of Twitter data set.
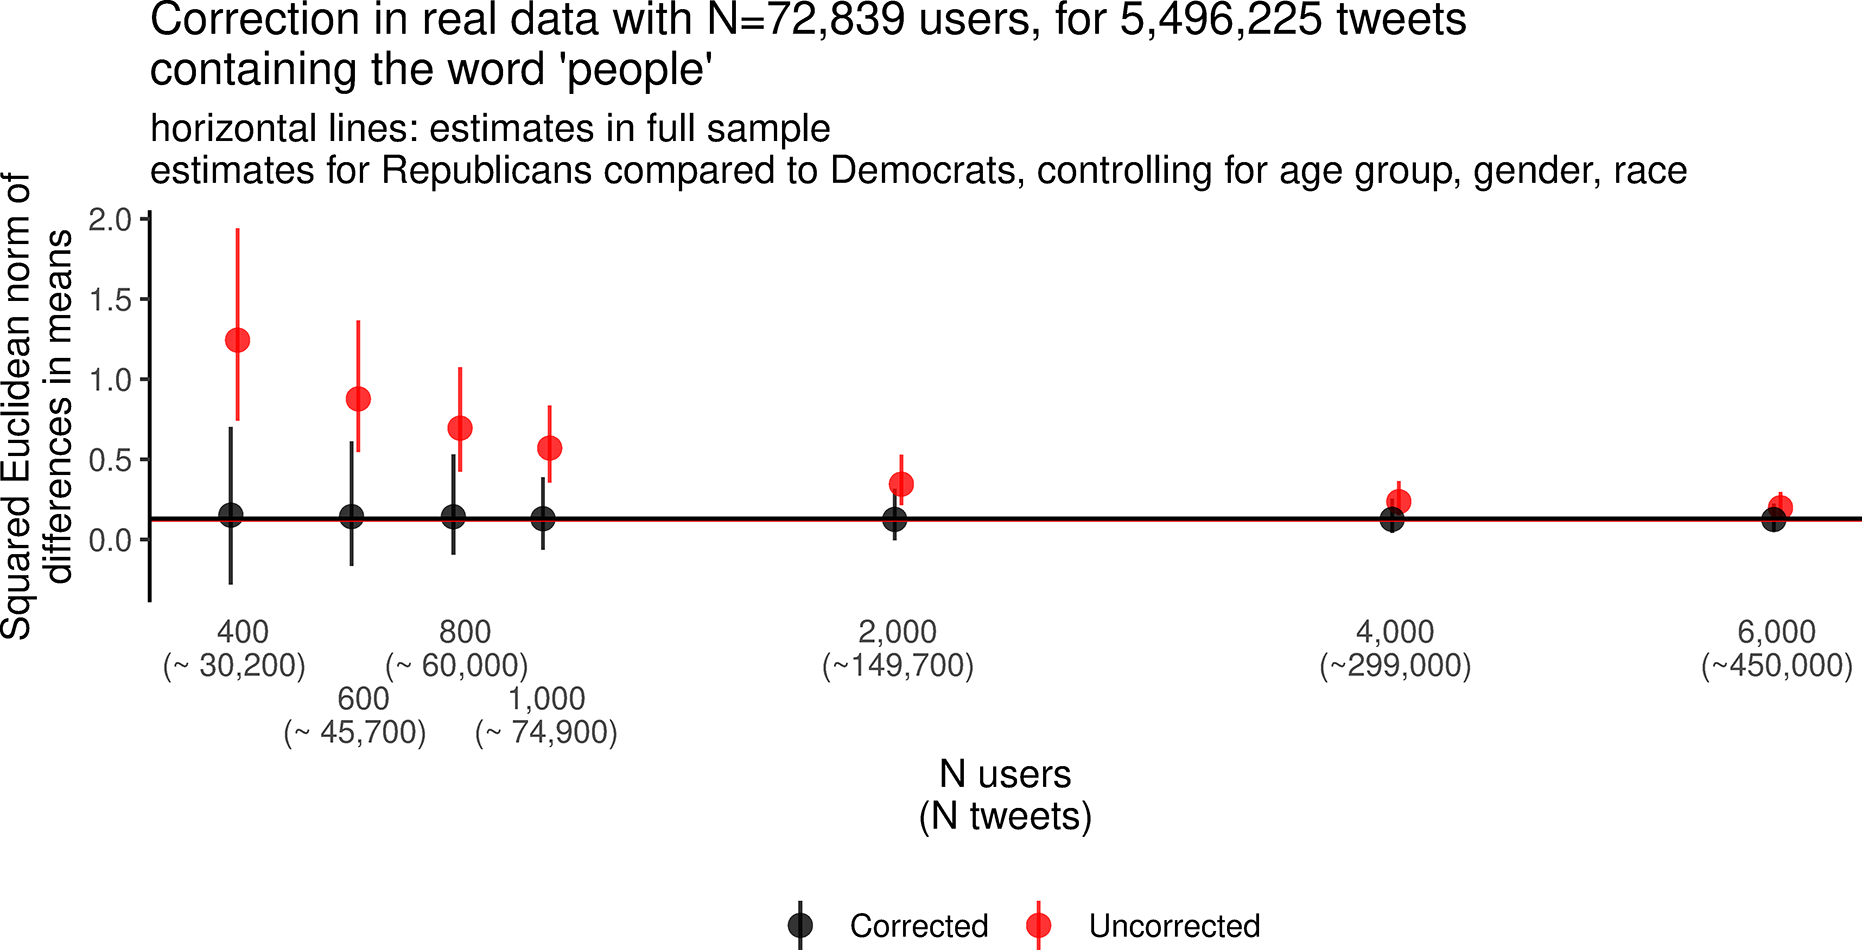
Here, in real data and with many repeat documents for authors, the correction accurately measures distance for small sample sizes. However, we also see a wide sampling distribution, suggesting that relatively large sample sizes and/or large effect sizes are likely to be needed to reliably measure differences between groups.
4.2 Constructing Confidence Intervals is Difficult
Despite the feasibility of the debiased estimator and the accuracy of related permutation tests (i.e., accurate calculations of the distribution of a null), the construction of confidence intervals with proper coverage at all values of the latent distance—and for complex designs in particular—is challenging. While the natural impulse is to use resampling methods with the debiased estimator, this is unfortunately an understood failure case for the bootstrap (Dodd and Korn Reference Dodd and Korn2007), which we illustrate in SI Section C.4. Bootstrapped confidence intervals tend to contain more than nominal coverage, meaning that a 95% CI will have greater than 95% coverage, especially for small effect sizes. We instead recommend the jackknife which outperforms the bootstrap (see, again, SI Section C.4), but does still over-cover when the true distance is small.
5 Discussion
When social scientists compute distance between vectors the risk of bias is considerable. We studied this bias and suggested ways to mitigate it. These methods work in real and simulated settings, and will be implemented in free statistical software.
Data Availability Statement
Replication code for this article has been published in Code Ocean, a computational reproducibility platform that enables users to run the code, and can be viewed interactively at https://doi.org/10.24433/CO.1397436.v1 Green et al. (Reference Green, Hobbs, Avila, Rodriguez, Spirling and Stewart2024a). A preservation copy of the same code and data can also be accessed via Dataverse at https://doi.org/10.7910/DVN/YDNVSN Green et al. (Reference Green, Hobbs, Avila, Rodriguez, Spirling and Stewart2024b).
The social media data are publicly viewable but, due to new API access restrictions, the text of shareable tweet ID’s can no longer be downloaded in bulk through Twitter’s academic API. We are unable to share raw text data to reproduce analyses, except as aggregated model output.
Competing Interests
The authors have no competing interests to report.
Research with Human Subjects
Analysis of Twitter data linked to voter records was approved by the Cornell University Institutional Review Board (IRB #143475, exempt).
Funding
None.
Supplementary Material
For supplementary material accompanying this paper, please visit https://doi.org/10.1017/pan.2024.22.


 Open access