


Introduction
Haemorrhagic fever with renal syndrome (HFRS) is a rodent-borne viral disease caused by different hantaviruses (HV). It is characterised by a headache, back pain, abdominal pain, fever, haemorrhage manifestations and acute renal dysfunction [Reference Li1–Reference Zhang3]. Hantaviruses, also called HFRS virus, are rodent-borne members of the family Bunyaviridae [Reference Ma4]. Various small rodents are their natural hosts, serve as sources of infection. In China, the causative agents of HFRS are predominantly Hantaan virus (HTNV) and Seoul virus (SEOV), which have co-evolved with their distinct rodent hosts and result in case fatality rates of approximately 10% and 1%, respectively [Reference Cui5]. Characterised by acute onset, rapid progress and high mortality, HFRS is an epidemic widely natural source disease causing great harm for the humans. HFRS occurs worldwide, but China is the most severe endemic country, where reported cases account for more than 90% of the total cases worldwide [Reference Cui5]. As one of the most serious epidemic areas of HFRS among affected provinces of China, Shandong Province ranks near the top in recent years and accounts for 1/3 of the national total according to historical data [Reference Kang6, Reference Fang7]. Despite prevention and control measures, HFRS incidence cases remain high with extending endemic areas and occasional outbreaks. Hence HFRS is a serious public health problem that threatens people's health and livelihoods [Reference Ke8].
As the source of infection and hosts, rodents are closely associated with characteristics of seasonal variation and regionality of HFRS [Reference Zhang2]. Meteorological and geographic factors and human activities are considered to influence the abundance and distribution of rodents. Hence they may have potential important effects on HFRS infection rates. Previous studies have indicated the importance of mean temperature, relative humidity(RH) and precipitation on the incidence of HFRS [Reference Wang9–Reference Luo12]. The normalised difference vegetation index (NDVI), multivariate El Niño Southern Oscillation index (MEI) and the average density of rodents also have been linked to incidence of HFRS [Reference Li13–Reference Zhang15]. However, research results are not entirely consistent in different regions. For example, no significant correlation was found between mean temperature, precipitation and sunshine duration and the incidence of HFRS in Hebei Province [Reference Li13], while sunshine duration was negatively associated with this disease in Ju'nan [Reference Li16]. A local study on occasiation between meteorological factors and HFRS is in need. Diurnal temperature range (DTR), an important temperature parameter, can reflect the variability of extreme temperature and human activities. e.g. urbanisation and the heat island effect [Reference Gao17, Reference Wang18]. We assume the DTR may influence the growth, reproduction and range of motion of host animals and virus, even farm work of humans. To our knowledge, no study about the potential association between DTR and HFRS has been carried out in China and further, no studies have examined lag effects which may be critical given the incubation period of HFRS.
In the current study, a distributed lag non-linear model (DLNM) was applied to assess the effects of the daily mean temperature and DTR on the risk of HFRS in Shandong Province, China. According to the reason that males are high-risk patients for HFRS and the female patients would be sicker, we would make models by gender to explore respective risk factors. Understanding such relationships will contribute to the evidence base on which to design and implement control and prevention measures for HFRS.
Materials and methods
Study area
Our study area covers the whole Shandong Province, a northernmost coastal province in Eastern China, located between latitude 34°23′ and 38°24′N and longitude 114°47′ and 112°42′E. The province consists of 137 counties belonging to 17 cities with a total land area of 156 700 square kilometers and a permanent resident population of approximate 99.73 million at the end of 2013. Shandong has a warm temperate monsoon climate with characters of concentrated rainfall, rain and heat over the same period, short springs and autumns and long summers and winters. The inland areas of Shandong include the central and south hilly region and the fertile agricultural area in the north and west, while the Shandong Peninsula extends eastward into the sea.
Data sources
The daily reported data of HFRS from 1 January 2007 to 31 December 2012 were obtained from the National Notifiable Disease Surveillance System in Center for Disease Control and Prevention of Shandong Province. Information included age, gender, career and onset date of symptoms. The infectious disease reporting cards were completed by professional doctors and submitted to health agencies within 24 h. The diagnosis of HFRS was based on the clinical criteria established in the ‘HFRS Control and Prevention Guide’ published by the Chinese Ministry of Health (http://www.moh.gov.cn/zwgkzt/s9491/200802/39043.shtml). The diagnostic standard for HFRS remained consistent during the study period.
All the data of daily meteorological variables for the same period, including temperature variables (°C) (the min, max and mean temperature), relative humidity (%), air pressure (hPa), precipitation (mm), wind speed (m/s) and sunshine duration (h), were collected from the China Meteorological Data Sharing Service System (http://www.escience.gov.cn/metdata/page/index.html).
Statistical analysis
We first used descriptive epidemiology methods to depict time and population distribution of HFRS, including the incidence cases, gender ratio, highest-incidence age group and occupations of HFRS cases. Meanwhile, correlation analysis was conducted to assess the associations between meteorological variables and the HFRS cases. Generally, variables with correlation coefficient over 0.8 were not included in the analysis simultaneously to avoid the multicollinearity in multivariate analysis [Reference Li19].
Distributed lag non-linear model (DLNM) combined with a quasi-Poisson generalised linear regression model is a time-series modelling framework. This methodology rests on the definition of a crossbasis, a bi-dimensional space of functions describing the dependency along the space of the predictor and along lags. Therefore, DLNM can simultaneously investigate the non-linear exposure-response relationships and delayed effects in a flexible way and it has been widely used to examine the relationships and delayed effects of meteorological variables on human health [Reference Gasparrini20, Reference Yang21] and has been widely used in various diseases [Reference Huang22–Reference Lin28]. Also the quasi-Poisson generalised linear regression, as a link function, was used to try to avoid the overdispersion problems of data. In the current study, the DLNM was applied to assess the effects of the daily mean temperature and DTR on the risk of HFRS in Shandong Province, respectively. The general model is shown below:
 $$\eqalign{g[E(y_t)] = &\alpha + \beta \,{\rm Tem}{\rm p}_{t,l} + {\rm NS}({\rm Hu}{\rm m}_t,{\rm df}) \cr &+ {\rm NS}({\rm Pre}{\rm c}_t,{\rm df}) + \gamma {\rm Strat}{\rm a}_t + j\,{\rm DO}{\rm W}_t}$$
Where y t represents the number of daily HFRS cases on day t(t = 1,2,3,4, …, 2557) and E(y t) is the expected number on a corresponding day; α is the model intercept; Tempt,l is the crossbasis function of the daily mean temperature and HFRS cases over the current day to lag l days to model non-linear and lag effects and β is the coefficient. The natural cubic spline NS, a flexible and effective technique for adjustment for nonlinear confounding effects of weather variables, was used to adjust for the RH (Hum) with the degree of freedom (df = 3) and precipitation (Prec) with the degree of freedom (df = 3) in the model. Meanwhile, Stratat is a categorical parameter to control seasonality and long-term trends; the day of week (DOWt) was used to adjust weekly confounding in the model.
HFRS have a incubation period about 2 weeks, we assumed a longer lag 30 days between the meteorological exposure and HFRS in order to completely capture their association. We used the median of daily mean temperature and DTR as the reference to report the relative risk (RR, with 95% confidence intervals (CIs)) on HFRS along lag days, respectively. We obtained the RR through the whole range of temperatures on different lag days, as well as the cumulative effects on HFRS during whole lag periods (lag 0–30 days). In our study, degrees of freedom of meteorological variables were chosen by minimising the Quasi-Akaike information criterion (Q-AIC) [Reference Gasparrini20]. What is more, subgroup analyses for males and females were carried out to confirm the susceptible groups and respective sensitive factors and then present more targeted public health interventions.
We performed sensitivity analyses by changing different stratified methods, season (spring, summer, autumn and winter) and month (1–12) and changing the df for meteorological variables from 3 to 5. All statistical analyses were performed by using R software (version 3.3.1) with the ‘dlnm’ package to fit the models. All statistical tests were two-tailed and values of P < 0.05 were considered statistically significant.
Results
Descriptive analysis
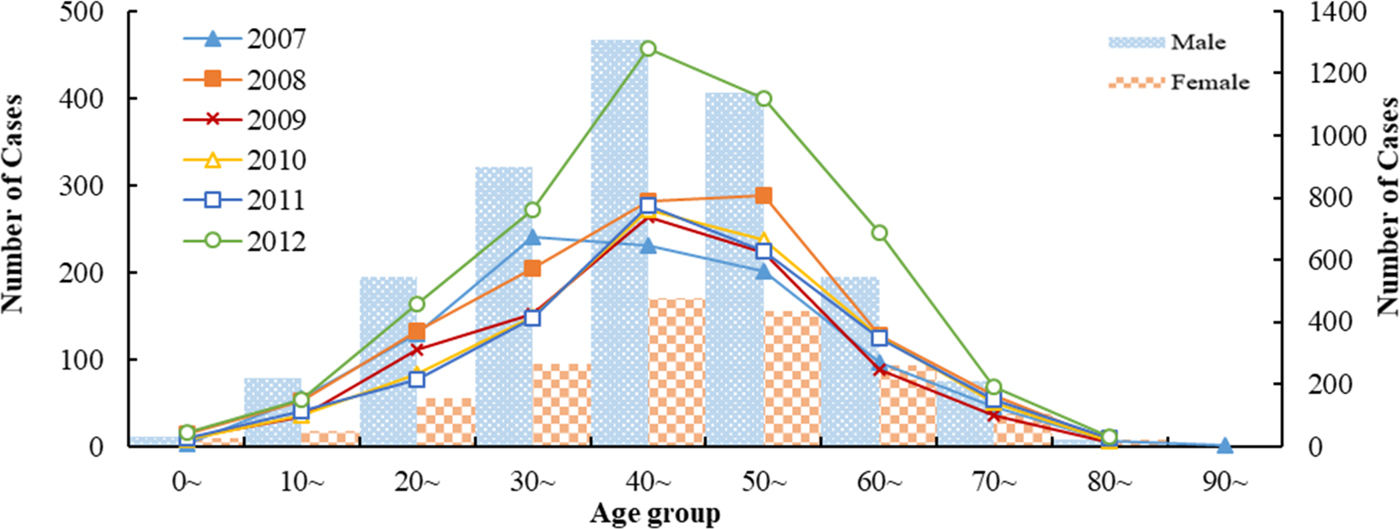
There were 6707 HFRS cases were reported in Shandong Province from 2007 to 2012. Among them, males were more likely than females to acquire the infection and the male-to-female ratio was 2.74:1(4916:1791). HFRS occurred across all ages during the study period, with the 30–60 years age group accounting for 67.44% of all reported HFRS cases (Fig. 1). The highest percentage of HFRS was found in farmers (89.83%, n = 5563), followed by the workers and students.
Age and gender distribution of HFRS cases in Shandong, 2007–2012.
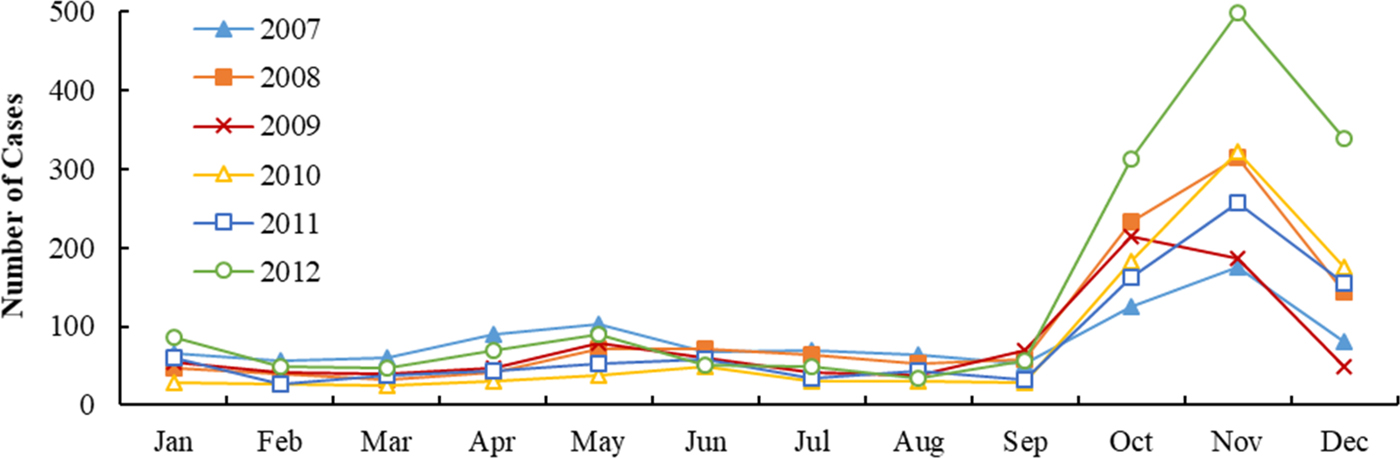
Figures 2 and 3 show the monthly distribution and sequence diagram of HFRS cases and meteorological variables from 2007 to 2012. During the study period, HFRS incidence was levelling off except for the rising incidence in 2012 and exhibited significant seasonal epidemic characteristics and periodicity. The peak periods of HFRS were recorded from March to June and from October to December, with the latter peak more prominent. Similarly, mean temperature and DTR also demonstrated obvious seasonal and periodic features. The maximum values of mean temperature and DTR were in the summer and autumn, respectively. Characteristics of the daily meteorological variables and HFRS cases over the study period are shown in Table 1. The median of mean temperature and DTR was 14.83 °C and 8.62 °C, respectively.
Monthly distribution of HFRS incidence in Shandong, 2007–2012.
The sequence diagram of daily HFRS cases and meteorological variables (daily mean temperature, DTR (Diurnal temperature range)) in Shandong, 2007–2012.

Summary statistics for daily HFRS cases and meteorological variables in Shandong, 2007–2012 (n = 6707)

s.d., standard deviation; P x, interquartile range.
Spearman's correlation analysis
Table 2 shows the Spearman correlation coefficients for meteorological variables and HFRS cases. The maximum temperature, minimum temperature, mean temperature, precipitation and RH were negatively correlated with the number of HFRS cases (r = −0.14, −0.15, −0.14, −0.13, −0.08). DTR and air pressure were positively correlated with the number of cases (r = 0.07, 0.20). There was no statistical association between HFRS incidence and wind speed, sunshine duration. As the three temperature measures were strongly correlated with each other (r > 0.8), mean temperature was chosen in the model because of its better representation for temperature.
Spearman's correlation coefficients between meteorological factors and daily HFRS cases in Shandong, 2007–2012 (r s)

Temp, temperature.
*P < 0.05.
DLNM analysis
According to the Q-AIC minimum principle, the final DLNM model was a natural cubic spline of daily mean temperature or DTR with 4 df and a natural cubic spline with 4 df for lag days after adjusting for RH, precipitation, weekly effects, seasonality and long-term trends. A categorical variable of the month was used to control for seasonality and long-term trends and there are a total of 12 × 6 = 72 strata. Tables S1 and S2 show the results of sensitivity analyses and QAIC. Air pressure was not incorporated into the model due to a strong connection between air pressure and mean temperature.
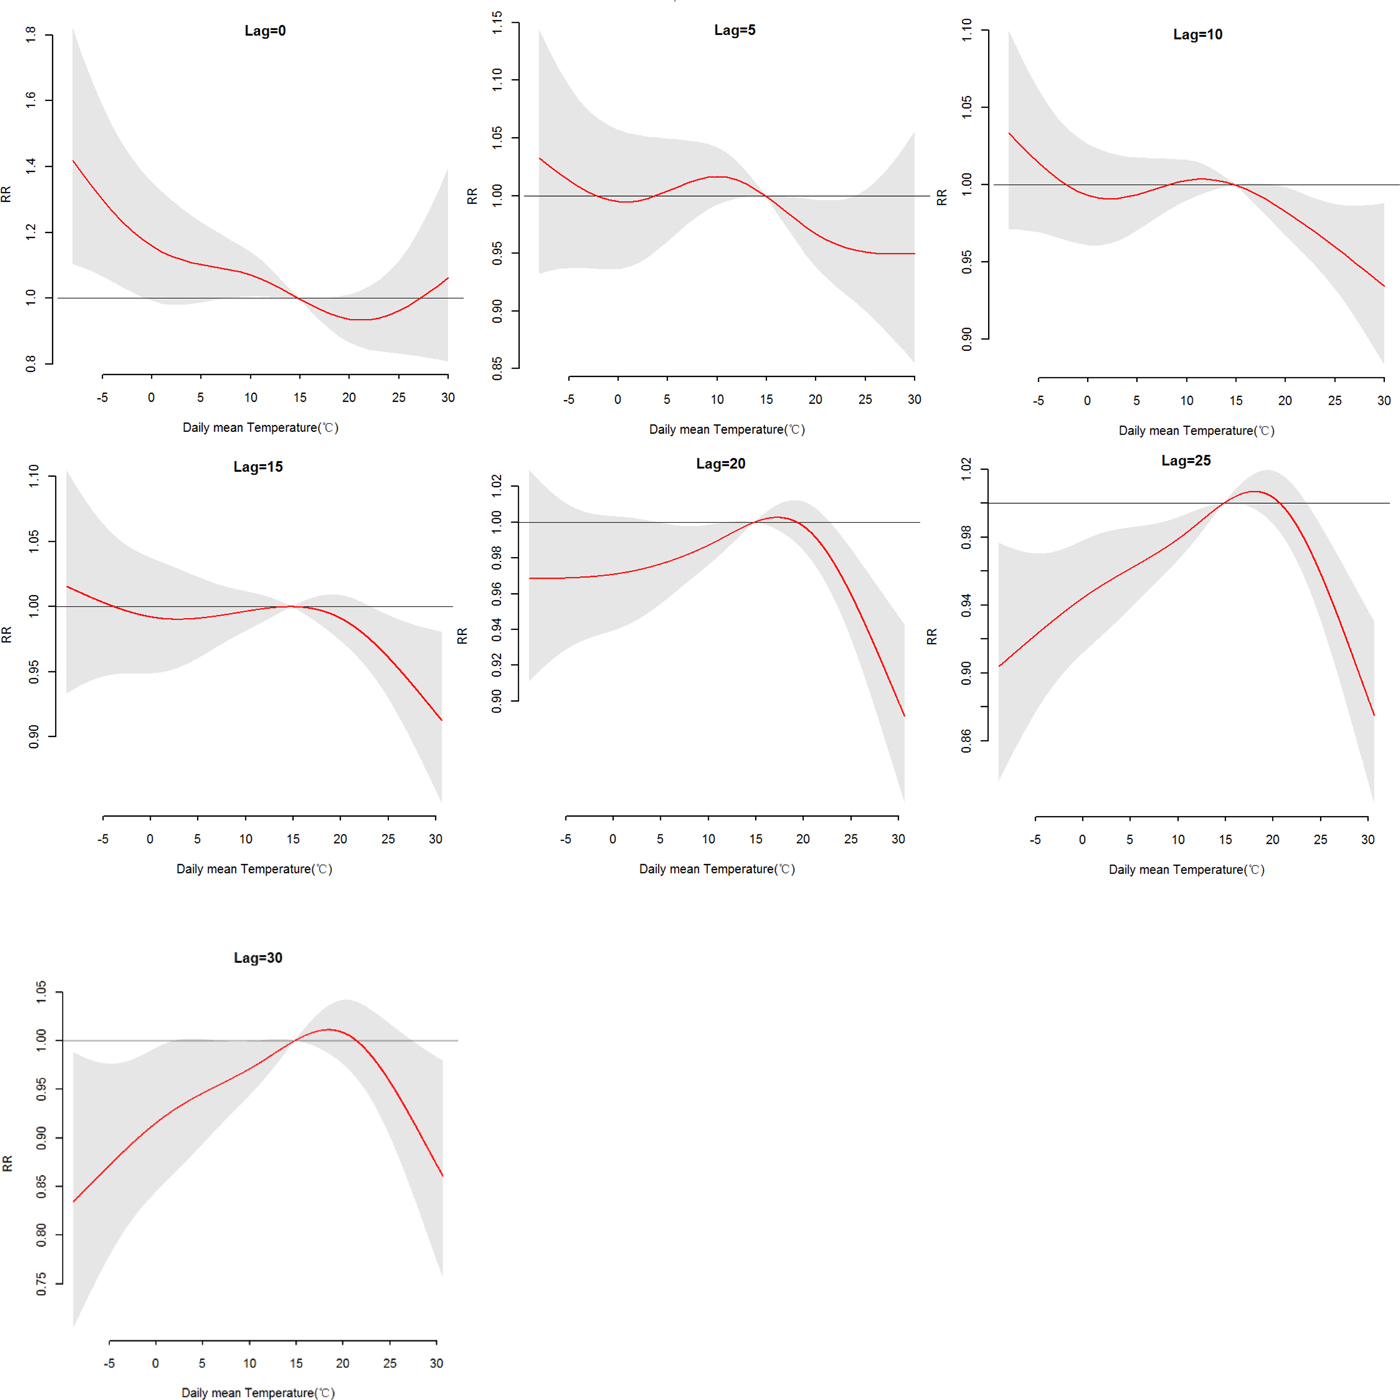
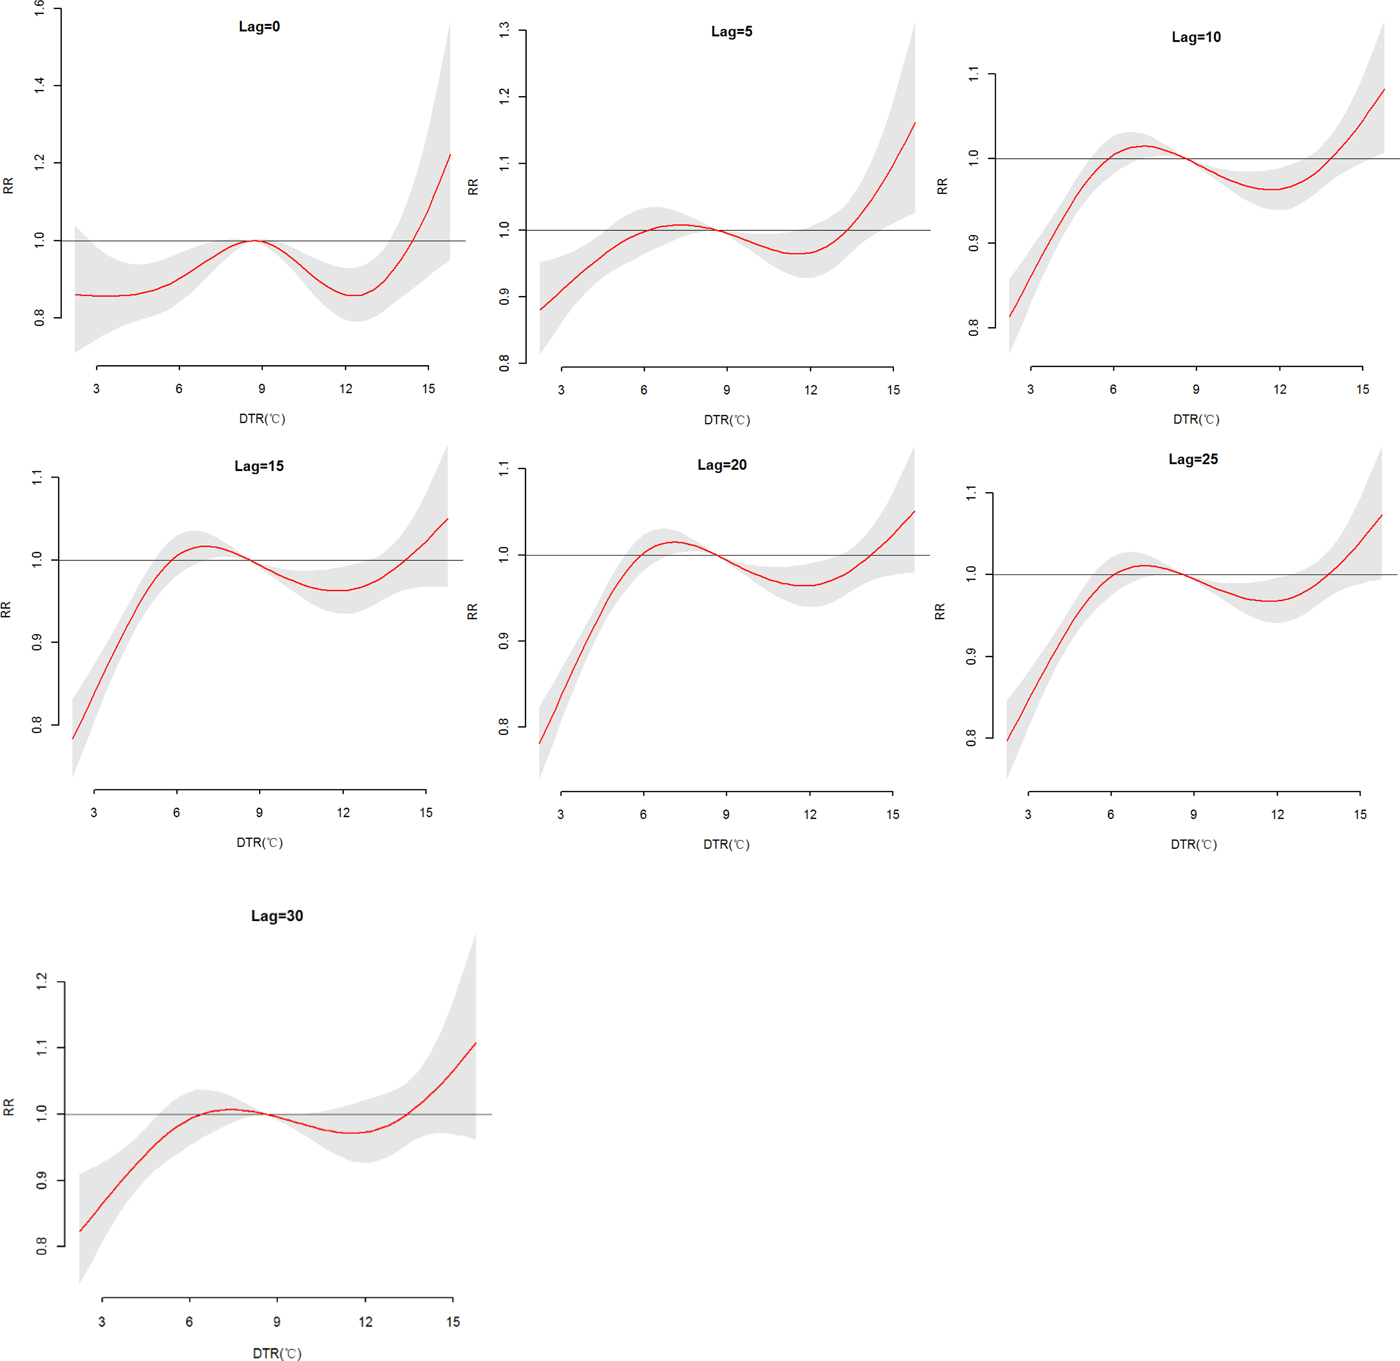
The effects of daily mean temperature and DTR on HFRS were illustrated by Figure 4, which showed the three-dimensional plots of the relationships between meteorological variables (daily mean temperature and DTR) and the total, male and female HFRS cases along lags of 30 days in models. The plots showed the estimated effects of mean temperature and DTR on HFRS were non-linear. Detailed lag structures for mean temperature and DTR effects at a specific lag day (0, 5, 10, 15, 20, 25 and 30 day) were shown in Figures 5 and 6 for the total cases, Figures S1 and S2 for the male and female cases. For mean temperature, an immediate and strong effect was observed with the lowest temperature at a lag of 0 days and then declined sharply as the lag days increased. The effects lasted no more than 5 days. The largest RRs were 1.46 (95% CI 1.11–1.90) for total cases, 1.33 (95% CI 1.00–1.78) for male cases and 1.76 (95% CI 1.12–2.79) for the female case, with the reference at 14.83 °C. The highest DTR was associated with much largest RRs, showed the strong and immediate effect. We observed the much larger RR at highest DTR and the effects could last 10 days, while low DTR had a negative connection with HFRS. However, the effect of DTR on HFRS for female cases would be up to 20 days and different from total and male cases (Figures S1 and S2). The largest RRs were calculated with the highest temperature, 1.26 (95% CI 0.96–1.64) for total cases at lag 0 days, 1.22 (95% CI 1.05–1.41) for male cases at lag 5 days and 1.52 (95% CI 0.97–2.38) for female case at lag 0 days, with the reference at 8.62 °C.
Three-D plots of relative risk (RR) for HFRS along daily mean temperature and lags with reference at 14.83 °C for the total cases (a), male cases (b) and female cases (c) and DTR (Diurnal temperature range) with reference at 8.62 °C for the total cases (d), male cases (e) and female cases (f) by DLNM models.

The relative risk (RR) of HFRS by the daily mean temperature at a specific lag day (0, 5, 10, 15, 20, 25 and 30 days) for total cases, controlling for relative humidity, precipitation, weekly effects and seasonality and long trends. The maximum likelihood estimate of RRs is shown as smooth red lines and the pointwise 95% confidence intervals are shown in the gray regions.
The relative risk (RR) of HFRS by DTR at a specific lag day (0, 5, 10, 15, 20, 25 and 30 days) for total cases, controlling for relative humidity, precipitation, sunshine duration, weekend effects, seasonality and long trends. The maximum likelihood estimate of RRs is shown as smooth red lines and the pointwise 95% confidence intervals are shown in the gray regions.
More specifically, Table S3 showed the RRs on HFRS at different lag days (0, 5, 10, 15, 20, 25 and 30 days) for the mean temperature (1th, 5th, 25th, 75th, 95th and 99th percentiles) and the overall effect over the whole lag period with reference at 14.83 °C. For total cases, we found a strong adverse effect with −5.52 °C, RR = 1.32 (95% CI 1.07–1.62) and −3.18 °C, RR = 1.24 (95% CI 1.04–1.48), at lag 0 days. A negative association was also found with a lag of 20, 25–30 days at −3.18 °C, −5.52 °C and 4.08 °C. And there was no statistically significant positive effect between the high temperature (P 75, P95 and P 99) and HFRS. For a male, there was no statistically significant positive effect between mean temperature and HFRS. For females, a stronger adverse effect with −5.52 °C and −3.18 °C at lag 0 days than total and male cases, RR = 1.54 (95% CI 1.08–2.19), 1.41 (95% CI 1.04–1.92), respectively. The cumulative effects of mean temperature were negative, a strong protective effect with high temperature, RR = 0.12 (95% CI 0.06–0.21) for total cases, 0.15 (95% CI 0.07–0.28) for male cases and 0.06 (95% CI 0.02–0.17) for the female.
Table S4 described the RRs on HFRS at different lag days (0, 5, 10, 15, 20, 25 and 30 days) for the DTR (1th, 5th, 25th, 75th, 95th and 99th percentiles) and the overall effect over the whole lag period with reference at 8.62 °C. The statistically significant positive associations were observed with 6.69 °C at lag 10, 15 and 20 days for total cases, while at lag 15 days for females. And the low DTR (P 1, P 5 and P 25) was not positive associated with HFRS for male cases. For the high DTR, a positive association on lag 5 days at 14.53 °C was described for total and male cases, while on lag 15 and 20 days for the female. On the whole, female cases were more sensitive to high DTR than the male, cumulative RRs were 2.37 (95% CI 1.14–4.94), 1.96 (95% CI 0.87–4.38) and 3.73 (95% CI 1.12–12.42), respectively. And cumulative effects of low DTR were protective, particularly, extremely low DTR (RR = 0.02).
In summary, we could conclude from these analyses that mean temperature and short-term temperature variability (DTR) have an important influence on the incidence of HFRS. Results of sensitivity analyses indicate the modules are stable and reliable (Table S1).
Discussion
Since the first HFRS case was reported in northeastern China in the 1920s and 1930s, the disease has spread across many other provinces and is now reported in all 31 provinces of China [Reference Wang29]. HFRS has been a serious public health concern for many decades in Shandong [Reference Fang7, Reference Huang30]. Data indicate that for the study years examined in this research 2007–2012, a generally constant number of annual cases of HFRS, with the exception of 2012 when case numbers increased. Any variabilities may be a result of varying vaccination, rodent control or regularity of epidemic of the disease [Reference Zhang3]. We found that HFRS was more prevalent among males than females, with male accounting for more than 70% of cases; and the incidence of HFRS was greatest in those between 30 and 60 years (67.44%) and in farmers (89.83%). These results were consistent with those reported in other literature in China [Reference Kang6, Reference Huang30]. These high figures in farmers and males suggest that young adult men have more access to the host animal through occupations or other channels increasing their susceptibility to infection [Reference Li31]. These results provide some direction for more targeted HFRS prevention and control programs.
HFRS is transmitted from rodents to humans, which is believed to occur mainly by contact with excreta, saliva and urine of infected rodent animals contaminated by virus [Reference Ma4]. Climate variability is an important predictor of HFRS transmission by influence on growth and reproduction of rodents. As an important indicator of temperature variation, DTR has been gradually used to estimate the effects on human health (e.g. schizophrenia [Reference Zhao24], malaria [Reference Murdock32] and mortality [Reference Ding33]) and has attracted increasing attention. In the study, we identified some associations between meteorological variables (the maximum temperature, minimum temperature mean temperature, DTR, precipitation, RH and air pressure) and HFRS. In contrast, temperature and precipitation were not statistically associated with HFRS in Hebei [Reference Li13], which could reflect differences in rodent species and climate regions. These provincial differences suggest that prevention and control measures should be taken in line with local conditions.
The DLNM was used to control for the effects of precipitation, RH, weekly and long-term trends and consider lag effects and non-linear dose effects of mean temperature and DTR on HFRS. A strong and immediate effect of extremely cold temperatures was found at a lag of 0 day and the effect declined sharply as the lag days and mean temperature increased. That might because the host rodents would move into humans habitation or workplace due to lack of foods in outdoors, thereby increasing the exposure of people to sources of infection. In general, it did tend to affect male and female equally. But the positive association at low temperature on female cases was more susceptive compared with the male cases. It may be a result of the poorer resistance in the cold weather, particularly for women. For DTR, high DTR showed an immediate and great effect at different lag days by sex, while no such strong effects were observed in low DTR. Nevertheless, an adverse effect was found at 6.69 °C except for the male cases. As far as the overall effect was concerned, we found the larger RRs at high DTR, which means the greater the onset risk of HFRS. These results were consistent with the seasonal distribution, which onset peak in autumn and spring. Therefore, pertinent precaution measures should be taken to different groups of HFRS cases in different temperature conditions. On the whole, though the influencing mechanism of temperatures on HFRS remains not completely clear, effects of daily mean temperature and DTR are generated possibly by influencing several survival and growth activities of the rodent hosts, such as pregnancy rate, birth rate and survival rate and the vitality, infectivity and stability of HV [Reference Wang9, Reference Xiao11, Reference Li34, Reference Liu35].
To our knowledge, this is the first study to explore the effects of temperature variation (both mean temperature and DTR) on HFRS at a long time scale by the novel method in Shandong province. What is more, controlled for some meteorological variables and confoundings, thus our results were relatively reliable and can be applied to other regions with similar meteorological parameters. Significantly, the lag effects of meteorological variables on HFRS can help with public health preparedness activities including formulating plans, disseminating warnings and implementing public health interventions, such as vaccinating high-risk populations, catching and killing the rodent hosts and strengthening environments for the prevention and control of the disease.
Some study limitations require mentioning. Firstly, the reported onset date of HFRS in the study was not necessarily the actual date because of the memory biases. But there is difference owing to the timely and effective reporting system. Secondly, we could only adjust for a few important meteorological parameters in the model. Many other important risk factors for HFRS were unavailable, such as rat density, human activities, population immunisation and vaccination as well as other environmental factors. Thirdly, meteorological parameters based on fixed monitoring sites, are not a completely accurate exposure of every individual.
Therefore, more accurate data and more diverse influence factors of HFRS could be adjusted in the models to confirm their relationships and mechanism in an environment of the high incidence of the disease and continuing climate change.
Conclusion
Our findings identified statistically significant relationships between temperature variables (mean temperature and DTR) and HFRS in Shandong using DLNM methods. The relationships were non-linear and lagging. The effects of low mean temperature on HFRS were immediate and strong. For DTR, effects grew stronger as DTR increased. Effects of temperature variables were slightly different for the sexes. These results suggest that there is an important link between HFRS and temperature and that such knowledge could be considered in the design of early warning systems to assist with HFRS prevention and control programs.
Supplementary material
The supplementary material for this article can be found at https://doi.org/10.1017/S095026881800184X.
Acknowledgements
This work was supported by the National Natural Science Foundation of China (NSFC) (No. 81673238) and the Natural Science Foundation of Shandong Province (No. ZR2016HM75). The authors thank the Shandong Center for Disease Control and Prevention, China Meteorological Data Sharing Service System for kindly providing the data.
Conflict of interest
There are no competing interests among all authors of this study.


