

Recent interest in the role that copy number variation (CNV) plays in common diseases has generated a remarkable increase in research using a variety of tissue types to explore the etiopathology of CNVs. Large-scale epidemiologic research projects of common phenotypes in children may benefit from being able to use buccal samples as a source of deoxyribonucleic acid (DNA) for genome-wide association (GWA) studies of single nucleotide polymorphisms (SNPs) and CNVs. One obvious benefit of using buccal samples in young children is the lack of the need to use painful needle sticks (Dlugos et al., Reference Dlugos, Scattergood, Ferraro, Berrettinni and Buono2005). Other advantages include cost and the ability to collect samples via a variety of methods, for example, through the mail. However, although there is little debate about the utility of buccal DNA for SNP analyses, there has been some uncertainty about the use of buccal DNA for CNV research. Concerns focus on measurement error, bacterial contamination, and other sources of variance that may be introduced into analyses because of the environment in which the buccal cell exists (e.g., oral flora and fauna). Efforts to address these concerns about measurement error and technical repeatability focused on genotype estimation (e.g., Meulenbelt et al., Reference Meulenbelt, Droog, Trommelen, Boomsma and Slagboom1995; Min et al., Reference Min, Lakenberg, Bakker-Verweij, Suchiman, Boomsma, Slagboom and Meulenbelt2006; Woo et al., Reference Woo, Sun, Haverbusch, Indugula, Martin, Broderick, Deka and Woo2007) or have been conducted on non-human populations (Rincon et al., Reference Rincon, Tengvall, Belanger, Lagoutte, Medrano, André, Thomas, Lawley, Hansen, Lindblad-Toh and Oberbauer2011). For CNVs, much less is known about the effect of source material (Dellinger, Reference Dellinger, Saw, Goh, Seielstad, Young and Li2010). Multiple algorithms have emerged for the detection of CNV, and performance of these algorithms has been compared (Pinto et al., Reference Pinto, Darvishi, Shi, Rajan, Rigler, Fitzgerald, Lionel, Thiruvahindrapuram, Macdonald, Mills, Prasad, Noonan, Gribble, Prigmore, Donahoe, Smith, Park, Hurles, Carter, Lee, Scherer and Feuk2011), but comparisons have not included an assessment across tissue.
In this study, we analyzed DNA from longitudinal blood and buccal sources from a large sample (710 individuals; 335 male and 375 female) of individuals, including 43 monozygotic (MZ; 23 female) and 75 dizygotic (DZ; 26 both female and 23 both male) twin pairs, their parents and siblings (see TABLE 1). The participants are registered with the Netherlands Twin Register (NTR; Bartels et al., Reference Bartels, van Beijsterveldt, Derks, Stroet, Polderman, Hudziak and Boomsma2007; Boomsma et al., Reference Boomsma, de Geus, Vink, Stubbe, Distel, Hottenga, Posthuma, van Beijsterveldt, Hudziak, Bartels and Willemsen2006) and DNA samples have been collected in multiple projects, both from blood and buccal material. Previously, the longitudinal samples were used to study the across-tissue and the temporal stability of DNA methylation (Talens et al., Reference Talens, Boomsma, Tobi, Kremer, Jukema, Willemsen, Putter, Slagboom and Heijmans2010). In this article, we use the availability of the longitudinal samples from the same and from different tissues to obtain a technical evaluation and confirmation of CN inference from the Affymetrix 6.0 DNA micro-array technology with CN calls made using Birdsuite v.2 (Korn et al., Reference Korn, Kuruvilla, McCarroll, Wysoker, Nemesh, Cawley, Hubbell, Veitch, Collins, Darvishi, Lee, Nizzari, Gabriel, Purcell, Daly and Altshuler2008). Finally, we evaluate whether blood is an acceptable DNA source in studies that include twins, as the utility of blood samples that come from twins has been questioned because genomic DNA from MZ as well as DZ twins (e.g., see van Dijk et al., Reference van Dijk, Boomsma and de Man1996) derived from blood samples may reflect a shared circulation prenatally (Erlich, Reference Erlich2011).
Descriptive Participant Characteristics for Tissue and Temporal Contrasts
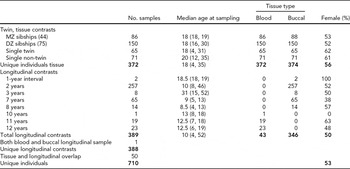
The total number of individuals involved in this study is broken down by assessments of consistency across tissue type as well as longitudinal. Median age at sampling is reported (with range given in parentheses). Fifty individuals had samples that were used in both groups of contrasts; thus, the total number of unique individuals is less than the sums of the individuals involved in the tissue and longitudinal assessments.
Biological materials were collected over a period of 20 years in different NTR projects, but SNP and CN data were generated in a single laboratory, as laboratory settings have also been implicated as a source of variation (Pinto et al., Reference Pinto, Darvishi, Shi, Rajan, Rigler, Fitzgerald, Lionel, Thiruvahindrapuram, Macdonald, Mills, Prasad, Noonan, Gribble, Prigmore, Donahoe, Smith, Park, Hurles, Carter, Lee, Scherer and Feuk2011). All DNA samples collected from different tissues and time points of the same individual, and all DNA from related individuals were run on the same plate.
To assess the consistency of CN inference across DNA source material, blood- and buccal-derived samples from the same individuals were compared (within-individual, between tissue) and from different members of the same MZ pair (between co-twins, within tissue and between co-twins, between tissue). The consistency between and within DZ pairs was also examined. To assess the consistency of CN inference over time, longitudinal samples of the same tissue type (within-individual, between time points) and between MZ co-twins were compared (between co-twins, within time and between co-twins, between time points).
For a concordance metric, we applied the squared Pearson correlation (R 2), a commonly used summary for imputation quality. This statistic has the advantage of being relatively sensitive to important differences in genotype, regardless of minor allele frequency (Huang et al., Reference Huang, Li, Singleton, Hardy, Abecasis, Rosenberg and Scheet2009), especially compared with a simple concordance of values. Studies of CN inference often assume particular criteria for designating putative CN segments as ‘real’ for analysis (e.g., two segments may require 50% overlap of one of the segments; some regions of duplications of differing copy number, such as 3 and 4, may be considered identical). These criteria are arbitrary in nature. The choice to evaluate consistency between two samples with R 2 across calls at all probes, and across copy number, effectively integrates over choices for rules of sufficient segmentation overlap as well as CN-based categorization of duplication and deletion event identity. The result of this procedure should render our results more generalizable, and the ordering of accuracies more robust to assumptions.
Materials and Methods
Sample
This study consisted of 1,472 samples from 710 individuals collected from the NTR (Boomsma et al., Reference Boomsma, de Geus, Vink, Stubbe, Distel, Hottenga, Posthuma, van Beijsterveldt, Hudziak, Bartels and Willemsen2006). Subjects had their blood drawn at ages 4–31 years (see TABLE 1 for more details). The longitudinal samples from the same individual were collected at 1–12-year intervals. Zygosity was confirmed by concordance through interviews and the genome-wide Affymetrix 6.0 data, using an identical-by-descent (IBD) measure from PLINK and applying 1.8 as a cut-off for zygosity determination.
Ethics
The study was approved by the Central Ethics Committee on Research involving human subjects of the VU University Medical Centre, Amsterdam, an institutional review board certified by the U.S. Office of Human Research Protections (IRB number IRB-2991 under Federal-wide Assurance-3703; IRB/institute codes, NTR 03-180).
DNA Collection
Buccal
Participants provided buccal swabs for DNA extraction, collected at ages 4–52 (see TABLE 1). Methods for buccal swab collection and genomic DNA extraction have been described previously (Meulenbelt et al., Reference Meulenbelt, Droog, Trommelen, Boomsma and Slagboom1995; Willemsen et al., Reference Willemsen, de Geus, Bartels, van Beijsterveldt, Brooks, Estourgie-van Burk, Fugman, Hoekstra, Hottenga, Kluft, Meijer, Montgomery, Rizzu, Sondervan, Smit, Spijker, Suchiman, Tischfield, Lehner, Slagboom and Boomsma2010). In brief, 16 cotton mouth swabs were individually rubbed against the inside of the cheek by the participants and placed in four separate 15 mL conical tubes (four swabs in each tube) containing 0.5 mL STE buffer (100 mM Sodium Chloride, 10 mM Tris Hydrochloride [pH 8.0], and 10 mM Ethylenediaminetetraacetic acid) with proteinase K (0.1 mg/mL) and Sodium Dodecyl Sulfate (SDS) (0.5%) per swab. Individuals were asked to refrain from eating or drinking 1 hour prior to sampling. High molecular weight genomic DNA was extracted from the swabs using a high salt (KAc) precipitation followed by a standard chloroform/isoamyl alcohol (24:1) extraction. The DNA samples were quantified using absorbance at 260 nm with a Nanodrop ND-1000 (Nanodrop Technologies, Wilmington, DE, USA).
Whole Blood
Blood samples were derived from two projects that took place around 1995 (van Dijk et al., Reference van Dijk, Boomsma and de Man1996) and around 1997–98 (Estourgie-van Burk et al., Reference Estourgie-van Burk, Bartels, Boomsma and Delemarre-van de Waal2010). DNA samples from buffy coats were extracted from the first study and DNA samples from EDTA tubes in the second project (see Boomsma et al., Reference Boomsma, Willemsen, Sullivan, Heutink, Meijer, Sondervan, Kluft, Smit, Nolen, Zitman, Smit, Hoogendijk, van Dyck, de Geus and Penninx2008; Willemsen et al., Reference Willemsen, de Geus, Bartels, van Beijsterveldt, Brooks, Estourgie-van Burk, Fugman, Hoekstra, Hottenga, Kluft, Meijer, Montgomery, Rizzu, Sondervan, Smit, Spijker, Suchiman, Tischfield, Lehner, Slagboom and Boomsma2010, for description of DNA isolation). High molecular weight genomic DNA from whole blood and buffy coats was extracted using the QIAamp DNA Blood Maxi kit (QIAGEN; Dusseldorf, Germany). The DNA concentrations were normalized using absorbance at 260 nm.
Genotyping and Quality Control
SNP and CNV data were generated from each DNA sample using high-density SNP 6.0 micro-arrays (Affymetrix; Santa Clara, CA, USA). This array represents 1.8 million markers evenly distributed across the whole genome, including more than 906,600 markers to detect SNPs and another 946,000 non-polymorphic probes for the detection of CNVs. Sample preparation and micro-array processing were performed according to standard protocols. Per sample data quality metrics were gauged using a single analysis suite, Genotyping Console v4.0 (Affymetrix; Santa Clara, CA, USA), which includes a high-resolution reference map and a CN polymorphism calling algorithm. Samples were plated according to our own family-based plating approach. All twins, siblings, and parent samples were included on same plate without exception. Blood and buccal samples from the same individual were also on the same plate. Several internal controls were included on each plate to assist in measuring data quality. Each plate of genotyped samples included five internal controls. The Affymetrix control (Ref103) was included on each plate, which represents genomic DNA from a male sample generated from a stable cell line. In addition, on each plate, a well-characterized female and male buccal-derived genomic DNA sample was included. On alternating plates, a blood-derived genomic DNA from either the same female or male sample used as the buccal-derived genomic DNA control was included. Lastly, on alternating plates, a within-plate or between-plate control was included as well.
Affymetrix Genotyping Console (GTC) 4.0 was used to calculate Contrast Quality Control (CQC) and Median of the Absolute values of all Pairwise Differences (MAPD) metrics for a measure of per sample quality control (QC). CQC is a metric for how well the allele intensities separate into clusters, with lower CQC values indicating a higher difficulty for the algorithm in distinguishing homozygotic genotypes from heterozygotic genotypes. MAPD is an estimate of variability or standard deviation, where increased variability decreases the quality of CN calls. Samples with a CQC < 0.4 or an MAPD > 0.35 were excluded for analyses of genotypes. The data set is considered problematic if more than 10% of the samples do not pass the CQC cut-off of 0.4 or when the mean CQC is smaller than 1.70, which was not observed in our plates.
Genotype Calling
Genotypes from the Affymetrix 6.0 CEL files were generated using Canary of Birdsuite v.2 (Korn et al., Reference Korn, Kuruvilla, McCarroll, Wysoker, Nemesh, Cawley, Hubbell, Veitch, Collins, Darvishi, Lee, Nizzari, Gabriel, Purcell, Daly and Altshuler2008). We also used the GTC v.4 software, but found only negligible differences between calls from the same samples (data not shown). Genotypes were called at each SNP (marginally).
Copy Number Inference
We applied the following two methods for CN inference: Birdsuite v.2 and PennCNV (Wang et al., Reference Wang, Li, Hadley, Liu, Glessner, Grant, Hakonarson and Bucan2007). For tissue-specific and longitudinal comparisons, we used results from Birdseed, excluding calls for which the ‘logarithm (base 10) of odds (LOD) scores’ were less than 10. For R 2 calculations, we converted all CN calls to probewise sample-specific CN designations. To facilitate comparisons between samples, where a program failed to make a non-copy-neutral call, a value of ‘2’ (copy neutral) was inserted. The ‘log R measure’ is the log2 ratio of the probe intensity to the median probe intensity across samples on the same plate.
Statistical Quality Control
We applied statistical QC filters to the 1,471 samples in this study based on criteria established using 4,801 samples. We first calculated per-sample missing data rates. Next, using all samples from individuals in the same family, we performed ‘identity-by-descent’ and identity-by-state calculations (using PLINK; Purcell et al., Reference Purcell, Neale, Todd-Brown, Thomas, Ferreira, Bender, Maller, Sklar, de Bakker, Daly and Sham2007) on all pairwise combinations of samples. Then, excluding further individuals, we suspected of being involved in any type of sample mix up (based on the genome-wide data), we calculated a series of per-SNP QC steps to derive a final data set by requiring a marker to pass all of the following criteria: (1) genotype no-call rate <5%; (2) Hardy–Weinberg equilibrium p value > 10−5; (3) total Mendelian inconsistencies < 27 (across 291 families); (4) genotype discordance between sample duplicates <5%; and (5) minor allele frequency (MAF) > 0.00141 (corresponding to at least two minor alleles among unrelated individuals). After applying these filters, we retained 827,983 (of 882,242 or approximately 94%) SNPs.
Comparisons of CNV Inference and SNP Genotyping Across Samples
We calculated R 2, the square of the Pearson correlation coefficient, between CN and genotype calls between two samples. To compare two groups of samples, each containing individual genotype and CN calls, we reported the median R 2 value among all pairs in each contrast.
Statistical Analysis
For several comparisons, we stated statistical significance between two distributions of R 2 values. These were conducted with non-parametric Wilcoxon rank-sum tests, using two-sided alternative hypotheses. Where appropriate, a paired test was applied (sign-rank test); and when possible (no ties), an exact test of significance was obtained. When evaluating genotype concordance for ‘Raw’ (unfiltered) genotypes, comparing blood–blood concordances against two other groups, we obtained a permutation-based p value from 10,000 shuffles of the pairwise R 2 values among tissue types within a unit (pair of individuals); in all permutations the difference in R 2 between the largest and next-largest median values was less than 0.004, the observed difference. To test for differences in allelic intensities (i.e., in FIGURE 1), we applied a t test.
Average differences in log2 intensities from blood and buccal DNA sources. Differences are computed as the log2 ratio of total intensity from blood samples to intensity from buccal. Left: differences averaged over probes (372 values in histogram). Right: differences averaged over individuals (1.7M values plotted). The mean shift is 0.0012 (p < .0001).

Results
Our results show CN calls from blood and buccal tissues from the same individual to be highly concordant. TABLE 2 contains results on a complete set of comparisons between tissues (blood and buccal) across probe types. As it is helpful to make overall comparisons on the same sets of individuals, we focus on MZ pairs. This generates both blood and buccal replicates from a priori genetically identical units, facilitating across-tissue comparisons where it is desirable to compare the same sets of individuals. For example, the blood–buccal consistency within MZ pairs is on the order of that for blood–blood and buccal–buccal contrasts, especially for deletions. However, there is a slight decrease (0.03–0.04 absolute difference in R 2) in between-tissue concordance (blood–buccal is lower than buccal–buccal and blood–blood for ‘All CNVs’; p = .005).
Concordance of CNVs and Genotypes Across Blood and Buccal DNA Sources
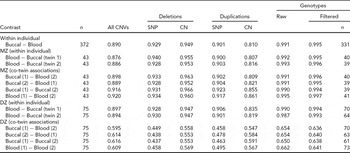
Sample R 2 is calculated for all contrasts, either from the same individual or twin sibship, and is reported as the median among comparison groups. Siblings within a twin pair are arbitrarily labeled ‘1’ and ‘2’. ‘All CNVs’ summarizes concordance across all CN states (0–6 for Birdsuite). For the breakdown of CNV probe types (SNP for ‘S-labeled’ probes and CN for ‘C-labeled’), we grouped all duplication (respectively, deletion) states into a single category of duplication (deletion). All blood and buccal samples from the same individuals or twin pair were plated together. When evaluating deletions, the presence of duplications was ignored (effectively treated as copy-neutral); likewise, deletions were ignored when evaluating duplications. Genotype concordance was calculated for all SNPs (‘Raw’) using all available samples, as well as for a set of post-QC SNPs (‘Filtered’) on a subset of individuals that passed preliminary per-sample QC metrics, that is, CQC (<0.4) and MAPD (>0.35) criteria. The number of subjects in comparisons is the same within rows, except for the ‘Filtered’ genotypes, which varies by contrast due to some subjects being excluded. Sample sizes for these contrasts are listed in the last column.
We test the assumption of genetic identity of MZ co-twins separately. The ‘MZ within-individual’ results in TABLE 2 show the within-individual variation to be indistinguishable from comparisons between MZ co-twins, suggesting that this analysis is suitable for the purposes of testing consistency of CN inference from blood and buccal sources. In fact, the observed difference is in the direction of less concordance within individuals (88–89% within and 89–90% between). Of course, we do expect some CN differences in CNVs between MZ co-twins, due to post-twinning, somatic changes in copy number. (We have investigated the effects of such phenomena on behavioral changes in Ehli et al., Reference Ehli, Abdellaoui, Hu, Hottenga, Kattenberg, van Beijsterveldt, Bartels, Althoff, Xiao, Scheet, de Geus, Hudziak, Boomsma and Davies2012.) The within-person concordances of the DZ pairs are approximately the same as for the MZ pairs. As expected, the between DZ-twin comparisons, including those of the same tissue, are lower, due to the fact that these twins should have the genetic similarity of full siblings.
For comparisons within the same individual or between MZ co-twins, there is a slight decrease in the concordance for duplications when compared with deletions, indicating the duplications are either more difficult to reliably infer or more likely to demonstrate somatic mutation. We also note a difference in the direction of effect for the probe type between the CN classes. Specifically, CN probes show higher consistency at deletions (by ~2%, absolute) and SNP probes show higher consistency at duplications (by ~8%), possibly indicating that the bivariate allelic signal at SNP arrays is more informative for correlating or calling duplications than deletions.
We note that the ranks of probe classes (SNP vs. CN), based on median R 2 values, change based on the specific combinations of CN variation (deletion vs. duplication) and the zygosity of individual comparisons. For example, the between DZ co-twin contrasts show greater consistency for CN probes than for SNP probes (~56% vs. ~46%). This can be explained by the correlation induced by population variation at regions of the genome where none of the chromosomes are IBD. Indeed, unrelated individuals exhibit increased variation at the CN probes, where the loci have been identified based on population studies of CN polymorphism. The rare CNVs picked up with SNP probes will tend to be more rare and thus are less likely to be shared ‘by chance’ between unrelated individuals (or regions where zero chromosomes are IBD in full siblings or DZ twins; see TABLE S1 of the Supplementary Material for additional evidence of this effect). This phenomenon does not occur for comparisons of samples from the same individual or from MZ co-twins, as for these sample comparisons, similarities and differences can be ascribed to one source of variation only (i.e., measurement error).
Importantly for GWA studies, genotype accuracies are generally high between the two tissue types, with R 2 values above 99% (TABLE 2). There appeared a slightly higher concordance for blood–blood comparisons than for buccal–buccal or buccal–blood comparisons (0.995 vs. 0.990 and 0.991).
CN events were also determined by making a non-neutral CN call if and only if the same call (i.e., deletion or duplication) was called by two algorithms, namely Birdsuite and PennCNV (Wang et al., Reference Wang, Li, Hadley, Liu, Glessner, Grant, Hakonarson and Bucan2007). This resulted in an increased concordance of CN calls of about 7% in absolute terms (TABLE S3). Our conclusion of no consistent difference in CN inference from different tissue sources remained.
Because these CN calling algorithms rely on micro-array intensities, individual probe intensities were also evaluated directly. We used the ‘log R measure’, which is normalized by plate. FIGURE 1 shows distributions of differences between blood and buccal intensities. No evidence of systematic differences between tissue types in terms of raw intensities was seen, consistent with our conclusions of robustness of CNV inference. These conclusions hold if we first excluded inferred deletions, because intensity ratios in these segments may be more variable.
In 388 unique individuals in the NTR study who had DNA collected at multiple time points, we assessed stability across time. At least 3 years separated 130 sample pairs (from same individual), and 122 sample pairs were separated by at an interval of at least 7 years. Twenty-three sample pairs were separated by 12 years, the largest interval (see TABLE 3). We regressed CNV concordance by time interval and considered dichotomous groupings of time (e.g., at least 7 years vs. less than 7 years). No greater differences in concordance of estimated CNVs among individuals whose two samples were obtained at larger time intervals were found. (Plate effects were statistically adjusted for, as well.)
Concordance of CNVs for Longitudinal Samples

Top: R 2 values were calculated for each pair of samples from the same individual and median values (and standard deviations) reported by time interval; for example, 257 individuals had samples taken at a 2-year interval and so on. Bottom: Forty-four MZ twin pairs had samples measured at two time points. There are six possible two-way comparisons among the sample pairs; each comparison generates a total time contrast (either from multiple samples of the same individual or from two MZ co-twins separated by their combined ages). Each contrast generated a R 2 value of concordance among CNVs and a time contrast. The mean slope is an average among the slopes obtained from individual linear regressions of R 2 on time contrast.
In addition, we examined concordance in MZ co-twins of different ages, that is, at approximately 9 or 18 years of age, across two time points. Twice the age of the twins represents the number of cumulative years for somatic variation to accumulate since the zygote was formed, and the two time points provide an additional contrast. We combined all possible contrasts (different ages, between twins; different time points, same individual; across both individuals and time) and regressed R 2 against time or years since zygotic stage, calculating coefficients (‘slopes’). The distributions of these slopes center at zero (0.0007; TABLE 3), consistent with no systematic temporal effect.
To identify a possible ‘positive control’ where buccal- and blood-derived DNA would be expected to exhibit differences, we analyzed 779 probes, from regions on chromosomes 7 and 14, coding T-cell receptors (α, β, γ, δ) (TABLE S2 in the Supplementary Material). We compared probe intensities, CNV calls, and genotypes between MZ co-twins using blood and buccal DNA sources. As variable regions of T-cell receptors are known to rearrange in lymphocytes, a source for blood-derived DNA, we examined whether differences existed in inferred CN between blood samples (as they are rearranging due to immune response), but did not exist between buccal samples (as they are genetically identical by germline DNA). To assess this, we extracted normalized intensities (‘log R measure’; from PennCNV), as well as CN and genotype calls (from Birdsuite), and then examined the differences between co-twins, summarized by tissue source for DNA. TABLE 4 contains average differences between MZ pairs for blood- and buccal-derived DNA. CN variation between co-twins was consistent with the hypothesis of greater similarity between DNA derived from buccal tissue than from blood (p = .004). Analyzing a subset of the markers within highly variable ‘VDJ’ regions, we obtained a slightly more significant result (p = .0005). We do observe marginal significance as well for the log R measure, but in the opposite direction (buccal-derived samples are less consistent); however, these average correlations are much lower and may reflect considerable noise.
Genomic Consistency at T-Cell Receptors Across Tissue Types
We assessed genomic features at T-cell receptor loci and summarized the differences between MZ co-twins using DNA derived from blood and buccal. Average (median) R 2 values were computed across 43 MZ pairs (individual R 2 values calculated within MZ sibships, across probes). *P values were obtained from a Wilcoxon rank-sum test for differences in the distributions of R 2.
A shift in CQC was seen toward smaller values for buccal samples (mean difference 0.46; p < .0001). As for these samples blood and buccal DNA were collected at the same time, we ruled out an ‘age effect’ for this phenomenon. Rather, this effect may be hypothesized as due to interference of human DNA hybridization from bacterial DNA. This shift did not appear to explain the subtle but statistically significant difference in R 2 values between same and different tissue types, because when comparisons were stratified by CQC values, this effect remained.
Accuracy of CN or genotype calls was not directly compared. Rather, we focused on concordance, or consistency, of calls, evaluating variance in estimates, instead of bias. However, due to study design (making comparisons across MZ twins and DNA sources) we can rule out situations that would mask differential accuracies. The focus of our study was on the appropriateness of the use of different tissue types and samples from twins for GWA studies, rather than a thorough attempt to catalog all evidence for somatic variation. Indeed, such phenomena have been characterized recently, with somatic variation detected between MZ twins (Forsberg et al., Reference Forsberg, Rasi, Razzaghian, Pakalapati, Waite, Thilbeault, Ronowicz, Wineinger, Tiwari, Boomsma, Westerman, Harris, Lyle, Essand, Eriksson, Assimes, Iribarren, Strachan, O'Hanlon, Rider, Miller, Giedraitis, Lannfelt, Ingelsson, Piotrowski, Pedersen, Absher and Dumanski2012) and within individuals (Laurie et al., Reference Laurie, Laurie, Rice, Doheny, Zelnick, McHugh, Ling, Hetrick, Pugh, Amos, Wei, Wang, Lee, Barnes, Hansel, Mathias, Daley, Beaty, Scott, Ruczinski, Scharpf, Bierut, Hartz, Landi, Freedman, Goldin, Ginsburg, Li, Desch, Strom, Blot, Signorello, Ingles, Chanock, Berndt, Le Marchand, Henderson, Monroe, Heit, de Andrade, Armasu, Regnier, Lowe, Hayes, Marazita, Feingold, Murray, Melbye, Feenstra, Kang, Wiggs, Jarvik, McDavid, Seshan, Mirel, Crenshaw, Sharopova, Wise, Shen, Crosslin, Levine, Zheng, Udren, Bennett, Nelson, Gogarten, Conomos, Heagerty, Manolio, Pasquale, Haiman, Caporaso and Weir2012) at older ages, but a minimal or negligible effect in younger individuals. Our data set consists of samples from younger individuals. For example, the comparisons across MZ twins involved samples at a median age of 18 years, and individuals of the longitudinal comparisons had a median age at sampling of 10 years.
Finally, we examined consistency for SNP genotype and CNV inference across tissue types and twin pairs in a complementary manner. We calculated R 2 at each probe by examining pairs of samples (e.g., from the same individual, across tissue types, or between MZ twins). In TABLE S5, we report various quantiles of these values among markers at which there existed some variation (so that a correlation could be calculated). For all comparisons involving MZ twins, the first quartile (more than three-quarters of sites) R 2 was above 90%. One subset of comparison (372 pairs of blood–buccal samples from the same individuals) showed a first quartile R 2 of 85%.
Discussion
The results across the tissue and longitudinal replicates demonstrated that buccal-derived DNA samples are suitable for GWA studies of SNP and CNV, ruling out any substantial effect on CN inference due to bacterial contamination from buccal sources. Current and emerging technologies, such as massively parallel DNA sequencing, may provide sufficient sensitivity to detect subtle phenomena, and studies that may use these technologies will require appropriate planning based on relevant experiments that explore this issue. In light of our data and results, it is acceptable, and indeed potentially cost effective, to conduct a micro-array-based GWA study of genotypes and CN using buccal-derived DNA for efforts to map genetic variants predisposing to disease and behaviors. Buccal swabs can be easier to collect from young (or very old) participants for whom requiring a blood draw for participation could be a barrier, and for individuals who have had bone marrow transplants or are undergoing chemotherapy and hence have low white blood cell counts. However, as there exists a subtle but consistent differential in concordance across tissue types, caution is advised when combining sources into a single analysis. Finally, our study confirms that collections of blood-derived DNA from large twin registries offer a valuable resource for mapping and characterizing complex diseases, given their unique contribution to partitioning environmental and genetic effects and the stability of genomic features across samples and time.
Acknowledgments
This research was supported by ARRA project RC2 2MH08995 and by the following additional sources: Spinozapremie (NWO/SPI 56-464-14192); CMSB (NWO Center for Medical Systems Biology); Twin-family database for behavior genetics and genomics studies (NWO 480-04-004); Genetic and Family Influences on Adolescent Psychopathology and Wellness (NWO 463-06-001); NBIC Bioassist (NWO-NBIC/BioAssist/RK/2008.024); Biobanking and Biomolecular Resources Research Infrastructure (NWO 184.021.007); Parental psychopathology in children with psychiatric symptoms (ZonMW 91210020); NCA (Neuroscience Campus Amsterdam); and Genetics of Mental Illness (European Research Council; ERC-230374). We thank the participants in the Netherlands Twin Register.


