


1.0 INTRODUCTION
Hypersonic air-breathing engines, such as scramjets, have the potential to reduce cost and increase flexibility of low earth orbit (LEO) and sun synchronous orbit (SSO) satellite placement missions. By intaking atmospheric air, scramjet engines remove the requirement of carrying oxidiser. Therefore, scramjets have a theoretically higher specific impulse, efficiency, and payload mass fraction than rocket propulsion(Reference Smart and Tetlow1,Reference Cook and Hueter2) . Although scramjet technology has been proven operational through experimental programmes such as the X-43 and X-51 flight demonstrators(Reference Marshall, Bahm, Corpening and Sherrill3–Reference Hank, Murphy and Mutzman5), the high Mach numbers required for access to space greatly increase the difficulty of thrust production and heat management. Mixing efficiency is one of the key parameters that requires improvement to increase engine performance. Technologies using strong vortices to enhance mixing, such as strut injection and hypermixers, provide substantial improvement in mixing efficiency. Simple struts have been used to successfully increase fuel plume penetration(Reference Vishwakarma and Vaidyanathan6,Reference Aguilera and Yu7) . Addition of vortex generating shapes to the struts also produces a substantial increase in mixing rate(Reference Aravind and Kumar8,Reference Fureby, Nordin-Bates, Petterson, Bresson and Sabelnikov9) . As an example, the work by Aravind(Reference Aravind and Kumar8) shows a lobbed strut reduces the distance to 95% mixing efficiency by about half at the cost of an increase in about 30% in total pressure over a simple strut at Mach 2.0. Ramps have shown improvement in penetration and mixing by producing vortical structures that interact with the injected fuel. Delta wing ramps of a size similar to the boundary layer showed improved mixing, reducing distance to 95% mixing efficienty by more than halve, only inducing total pressure losses of about 34%, albeit at Mach 3.75(Reference Li, Huang, Yan, Zhao and Liao10,Reference Li, Huang and Yan11) . The mixing improvement generated by these elements is linked to the generation of streamwise vorticity, with the ramps producing higher losses as mixing enhancement is improved(Reference Li, Huang, Fang, Shi, Li and Peng12). These methods have shown very promising improvements in mixing rate. Nonetheless, these studies are focused on lower Mach number ranges. Indeed, for high Mach numbers such as those experienced in a scramjet flight path, between Mach 6 to up to Mach 12, the increase in drag and local heat loads(Reference Fureby, Nordin-Bates, Petterson, Bresson and Sabelnikov9,Reference Fuller, Wu, Nejad and Schetz13) they would produce makes them unsuitable for this particular application.
A different approach more suitable to the high Mach numbers experienced in a scramjet flight path, from Mach 6 to up to Mach 12, is to utilize vortices already present in the flow-field. The use of scramjet inlet generated vortices for mixing enhancement takes advantage of features intrinsic to the flowfield. Although the intensity of the vortices naturally generated by scramjet inlets is relatively low compared to those generated by struts or ramps/hypermixers, these are intrinsically present in the flowfield. Therefore, the gains obtained in mixing efficiency by exploiting these vortices comes at zero or negligible additional losses and heat loads. Research focused on the effect of these vortices is scarce. However, Malo-Molina et al.(Reference Malo-Molina, Gaitonde, Ebrahini and Ruffin14) incidentally observed the beneficial effect of these naturally occurring vortices when comparing the performance of two different scramjet inlet shapes. Barth et al.(Reference James, Barth, Wise, Wheatley and Smart15) also explored tailoring injector placement to take advantage of regions of intrinsically high vorticity in a scramjet combustor, finding faster mixing in regions with high streamwise vorticity.
A particularly interesting area to exploit vortices for mixing is the scramjet inlet. Inlet injection has been extensively utilized in order to gain available length for mixing purposes(Reference James, Barth, Wise, Wheatley and Smart15,Reference Gardner, Paull and McIntyre16) . Achieving high levels of mixing for the portion of the fueling performed at the inlet can reduce combustion delay of the mixture further downstream when it reaches the combustor. Inlet vortices are generated in most non-axysimmetric scramjet inlets. These are particularly characteristic in rectangular inlets, where vortices are formed at the corners through shock-wave boundary-layer interactions(Reference Alvi and Settles17). Rectangular inlets are present in many scramjet designs thanks to their benefits for airframe-integration(Reference Smart18–Reference Barth, Wheatley, Smart, Petty and Basore20).
This work utilises computational fluid dynamics (CFD) to study the effect of streamwise vortices as generated by a scramjet inlet on a porthole fuel plume and its ability to improve fuel mixing rate. A simplified inlet-like geometry is used, consisting of a flat plate and compression fin. Two separate studies are performed. The first one provides an overview of the vortex flowfield (without injection). This allows quantifying the potential of this flowfield to affect the fuel plume shape. Although this implies severe simplifications, it highlights the importance of injector placement within the vortex. Moreover, it provides a simplified method to identify the preferred regions for injector placement. The second study incorporates injection, providing insight and data to quantify the benefit of the vortex-injection interaction and also assess the limitations of the first, simplified study. In this case the flat plate incorporates a porthole injector through which hydrogen fuel is injected into the streamwise vortex. The vortex-injection interaction is analysed to characterise the fuel plume shape, the improvement in mixing efficiency produced, and the effect on losses. A number of porthole injector locations, injection-to-freestream injection momentum ratios, and vortex intensities are studied.
2.0 METHODOLOGY
2.1 Vortex generation
Rectangular scramjet inlets generate streamwise vortices due to shock-shock and shock-viscous interactions. To isolate the effect of the streamwise vortex from other features present in the complex flowfield of a scramjet inlet, a simplified canonical geometry is used. This consists of a flat plate and compression wall (see Fig. 1), which produces a single and controlled streamwise vortex(17,21,22) . Such a geometry generates vortices representative of those appearing in real screamjet inlet flows(Reference Llobet, Barth and Jahn23). The vortex is generated by the interaction of the swept fin shock with the flat plate boundary layer, as depicted in Fig. 1. The swept shock induces the separation of the flat plate boundary layer, which interacts with the incoming freestream to roll up and form the streamwise vortex. Moreover, the streamwise velocity gradient within the flat plate boundary layer produces a gradient in pressure ratio across the fin shock. This generates a secondary flow in the vertical direction moving downwards and outwards, away from the fin, feeding the vortex. This secondary flow is depicted in Fig. 1(b) as “Jet”. This flowfield exhibits a quasi-conical behaviour about the fin leading edge(Reference Kubota and Stollery22). This means the flowfield at any axial plane is defined by the flowfield in conical coordinates Y/X and Z/X as in Fig. 1(b).
Test geometry and vortex flowfield structure depiction. Adapted from.(Reference Llobet, Jahn and Gollan24)

2.2 Flow conditions
The flow conditions for the current study have been selected to match a MACH 12 scramjet flight condition on a 50 kPa constant dynamic pressure trajectory(Reference Barth, Wheatley, Smart, Petty and Basore20), which has previously been used for ground testing at the University of Queensland.
The REST inlet was first developed by Smart et al.(Reference Smart18,Reference Smart and Trexler19) . This inlet presents a rectangular-like capture area that transitions to an elliptical cross-section for the isolator and combustor. This profits from the the structural and aerodynamic efficiency of a rounded cross-section combustor as well as from the easy airframe integration of a rectangular inlet(Reference Smart18). The corners of the shape transition inlet generate several characteristic vortices that can be exploited to enhance mixing.
Barth et al.(Reference Barth, Wheatley, Smart, Petty and Basore20) present a complete investigation of the flowfield within the REST engine at Mach 12 flight conditions. After accounting for a 6° angle of attack forebody compression, the freestream conditions in the vicinity of the inlet ramp injectors (Inj. reg.), obtained from full engine simulations conducted by Barth et al.(Reference Barth, Wheatley, Smart, Petty and Basore20), are given in Table 1. These are the conditions used for the inflow in the current study.
Free stream and bulk flow near the REST inlet porthole injectors flow conditions(Reference Barth, Wheatley, Smart, Petty and Basore20,Reference Llobet, Jahn and Gollan21)

2.3 Configurations tested
Two main different typologies are used: the first one, consisting of the flat plate and fin, is used for the vortex flowfield study; the second one is identical but incorporating the injector on the flat plate, and is used to study the fuel plume interaction with the incoming vortex.
Flat plate and fin:
In the flat plat plus fin geometry, the fin angle (α fin) controls vortex intensity. Three different fin angles are used: 5°, 10°, and 15°. To assess the intensity and size of the vortices the Q-criterion is used (zones of positive second invariant of ∇u)(Reference Hunt, Wray and Moin25). The intensity of the vortex is defined as the maximum value of the Q-criterion (occurring at vortex core), and the size is defined as the area enclosing the region with Q-criterion values above 50% of the vortex intensity. The lowest angle, α fin = 5°, produces a vortex intensity representative of vortices found in scramjet inlets with low flow non-uniformities. The α fin = 10° case produces vortices similar to those found in 2-D inlets with relatively strong corner vortices. The α fin = 15° generates a vortex intensity in excess of any corner vortex expected in typical scramjet inlets, and is included for completeness(Reference Llobet, Barth and Jahn23). Vortex sizes and intensities for each case are presented in Table 2. For comparison, the REST inlet engine(Reference Barth, Wheatley, Smart, Petty and Basore20), which is designed for developing a highly homogeneous flow, generates a corner vortex with approximate intensity and area of 0.12 and 20 × 10−6 m2 at equivalent conditions. A conventional 2-D engine geometry tested at the University of Queesland (UQ)(Reference McGilvray26,Reference Sancho27) develops a vortex with approximate intensity and area of 0.5 and 65 × 10−6 m2 at the injector location.
Vortex characteristics 100mm downstream of fin leading edge.

Injection cases:
Alongside the three different fin angles, the injection-vortex interaction part of the study uses three different injector locations. These locations are based on the location of the vortex separation line and the location of the vortex core, with the following nomenclature:
• Core injector (C.i.): At the normal projection of the vortex core onto the flat plat.
• Separation Injector (S.i.): At the separation line of the swept separation.
• Intermediate Injector (I.i.): At the half-way point between the C.i and S.i.
To complement these cases, the baseline case of injection with no vortex (effectively α fin = 0°) is used as reference.
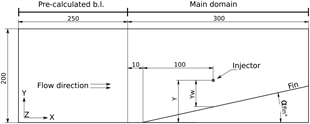
The porthole injector has a 1.0mm diameter (d inj) and is inclined 45° with respect to the axial direction. As depicted in Fig. 2, the porthole injector is always located 100mm downstream of the fin leading edge. The distance to the fin wall (Y. to wall) of the portholes varies for each case, and is measured as the spanwise distance from the centre of the porthole to the fin wall as depicted in Fig. 2. Table 3 shows the coordinates of the porthole injectors relative to the fin leading edge.
Geometry sketch. Dimensions in mm. Y and Y w values listed in Table 3.

Spanwise coordinate, and distance to fin wall for the porthole injectors, (Y) and (Y w) respectively in Figure 2.

In addition, two different injection (inj) to free stream (∞) momentum ratios (J = (ρu 2)inj/(ρu 2)∞) are tested: J = 1 and J = 3. These J values are obtained with the injection conditions summarised in Table 4.
Injection conditions

2.4 Numerical approach
The CFD solver used for the simulations is US3D, developed at the University of Minnesota(Reference Nompelis, Drayna and Candler28). Steady state RANS simulations using non-reacting flow and the SST turbulence model with a Schmidt number (Sc) of 0.7 are performed. The typical near-wall cell size is 2 µm, keeping the y + values below 1 for the whole domain, except for the first few cells adjacent to the fin leading edge. The Steger-Warming flux vector splitting method is used for the convective fluxes. In regions of strong shocks, the MUSCL scheme with pressure limiter is used. The implicit time integration uses the DPLR method(Reference Wright, Candler and Bose29). Although CFL value has not been observed to have a significant effect on the final solution, this has been routinely set to 50 towards the end of the simulations.
The numerical domain consists of a 300mm long, 200mm wide flat plate and a fin 100mm high with an infinitely sharp leading edge starting 10mm downstream of the inflow and extending to the end of the domain. The domain is sized to avoid any influence of the boundary conditions on the vortex flowfield. Figure 2 shows a sketch of the geometry.
The inflow represents a boundary layer developed over 250mm long flat plate positioned upstream of the domain (marked as ‘Pre-calculated b.l.’ in Fig. 2). This inflow profile was obtained in a separate simulation producing the velocity and density profiles shown in Fig 3. The fin and flat plate are constant temperature walls set to 300 K, and the back, upper, and opposite side to the fin are set as supersonic outflows.
Inflow velocity and density profiles.

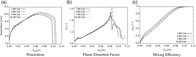
A grid independence analysis was performed based on the most relevant parameters to be extracted from the simulations, such as mixing efficiency, penetration, and fuel plume shape. The presented results are obtained for the case with fin angle α fin = 10°, Intermediate Injector (I.i.), and injection to freestream momentum ratio J = 1. The results for four different levels of mesh refinement are presented in Fig. 4. The 3.8 million cell mesh was selected for this study. In this mesh, the cell size in the vicinity of the injector is approximately 0.05mm, expanding up to 1mm in the region of uniform flow, far from the vortex-injection interaction. This mesh captures the most relevant aspects of the flowfield satisfactorily. The initial penetration shows no variation between meshes, and the selected mesh only provides a slight underprediction of the maximum penetration compared to the finest mesh. The plume shape parameter D (defined later on) in Fig. 4(b) shows very similar values to the finest mesh for the region between the injector (X inj = 0.0) and where the plume splits in two (~ X = 0.08) and the definition of D fails. Similarly, mixing efficiency is retrieved satisfactorily, only showing a small overprediction just downstream of the injector compared to the finest mesh. To further quantify the quality of the 3.8 million cell mesh, the Grid Convergence Index or GCI(Reference Roache30) for mixing efficiency at two different locations, and for maximum penetration is calculated using the three finest meshes. GCI 1−2 and GCI 2−3 are presented in Table 5 based on the coarse mesh (i.e., GCI 1−2 based on the 7.6M cells mesh and GCI 2−3 based on the 3.8M cells mesh), assuming a 2nd order level of convergence and using a safety factor of 1.25. The GCI 2−3 values are the relevant for the 3.8M cells mesh. The GCI values based on mixing efficiency near injector (η mix |x=0.05) show relatively poor values due to the large concentration gradients in this region. Nonetheless, the GCI value improves further downstream, where the most relevant data is extracted.
Comparison of mixing parameters for four different levels of mesh refinement.

GCI for mixing efficiency and maximum penetration

A closely related work(Reference Llobet, Basore, Gollan and Jahn31) employing the same methodology on an equivalent geometry and very similar freestream conditions shows good agreement between numerical and experimental heat transfer data. Moreover, Barth et al.(Reference James, Barth, Wise, Wheatley and Smart15) used US3D to simulate the full REST engine, which included several injectors into the scramjet internal flow generating a similar interaction to the one described in this paper. The work by Barth presents a more complex flowfield, making simulations more challenging. Despite this, comparison between the numerical and experimental data yielded very satisfactory results. This further increases confidence in the capability of the presented methodology to obtain accurate results.
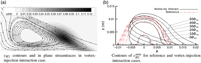
2.5 Fuel plume elongation quantification
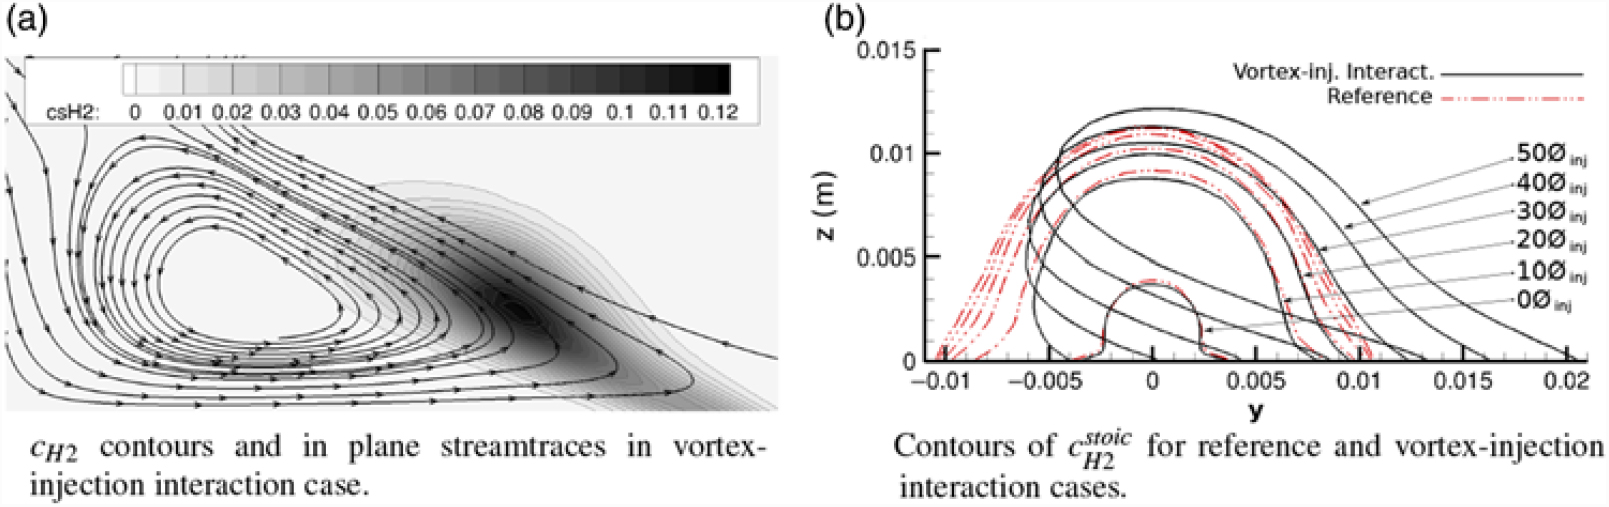
Figure 5 shows the interaction of a fuel plume injected within a vortex. This figure clearly depicts the severe change in shape as the fuel plume is convected within the vortex. By interacting with a streamwise vortex, the fuel plume is stretched. This effect can be observed in Fig. 6(a), which depicts an axial slice with in-plane streamlines and contours of fuel mass fraction (cs H2) for a porthole injection case with vortex-injection interaction. The region of the plume adjacent to the flat plate is subject to an intense crosswise flow, as can be seen in Fig. 6(a). Therefore, this region is strongly convected in the spanwise direction. However, the effect of the vortex on the upper region of the plume is much smaller, and this region follows the velocity of the flow processed by the shock. This velocity gradient causes a shear effect on the plume, elongating it in the spanwise direction. Figure 6(b) shows the evolution of the plume shape at different distances from the injector for cases with and without vortex interaction, clearly showing the stretching caused by the vortex. This elongation results in an increased effective area for mass transfer between the high and low mass fraction regions, hence, increasing mixing rate. A similar mechanism of mixing enhancement was observed in the work by Peterson et al.(Reference Peterson, Boyce and Wheatley32).
Contours of hydrogen mass fraction depicting fuel plume shape evolution. From separation line injection, J = 1, α fin = 10 case.

Elongation of the fuel plume(Reference Llobet, Jahn and Gollan21). As per description in section 2.3, reference case is: J= 3, α fin = 0°; vortex-injection interaction case is: Separation injection, J = 3, α fin = 10°.
To evaluate the suitability of the plume shape for mixing purposes, a dimensionless parameter is proposed. This parameter is based on the ratio of lenth (L) of the stoichiometric mass fraction iso-line length to area (A) of the plume on an axial plane. Higher values of L/A indicate higher effective surface for mixing for a given plume cross-sectional area. As perimeter grows linearly and area grows quadratically, the same plume shape provides different L/A values depending on its characteristic size. In order to avoid this dependency, the L/A value is normalised by the perimeter to area ratio of a circle of the same area (L/A)c. This is presented in Equation 1. Henceforth, this non-dimensional parameter representative of plume shape will be referred to as D.
 $$D = {{{L \over A}} \over {\left( {{L \over A}} \right)_c }} = {{{L \over A}} \over {\sqrt {{{4\pi } \over A}} }} = {L \over {\sqrt {4\pi A} }}$$
The velocity field varies substantially within the vortex region from the vortex core to the separation line, as visible in Figures 1(b) and 6(a). For this reason, injector location plays a major role in the vortex-injection interaction and the degree of fuel plume elongation produced.
3.0 VORTEX FLOWFIELD PLUME ELONGATION POTENTIAL
This section contains the first part of the study, analyzing the vortex flowfield and quantifying its ability to produce fuel plume stretching. This is performed without fuel injection, and is meant to provide insight in the vortex flowfield and indentify the preferred location to place the injector.
To estimate the elongation potential in different regions of the vortex, the flowfield generated by the test geometry with a fin angle of α fin = 10° is analysed prior to injection. The potential effect of the flowfield on plume shape is studied evaluating the initial and final shape of a streamtube. For this, a number of circles of zero mass are placed on a plane normal to the axial direction, as presented in Fig. 7(a). These are equivalent to a ring of zero-mass particles, which are convected with the flow. Following the trajectories of each particle, the final shape is obtained. To simplify the calculation of the trajectories, the conical nature of the flowfield is exploited. Tracking of each particle is achieved by an iterative two-step process. First, each particle is transported in the direction of the local flow velocity. Second, the new velocity is obtained by re-mapping the new particle location onto the original plane in polar coordinates. Each particle is “tracked” in this fashion until they cross the selected end plane, where the D factor for the new shape is calculated.
Zero-mass cirles elongation. Minimum distance to flat plate is 0.5mm.

3.1 Results
The effect of the flowfield on the final shapes is presented in Fig. 7(a), where the streamtubes are initially placed in the α fin = 10° flowfield at an axial plane 100mm downstream of the fin leading edge. This is the location of the injector in the second part of the study, which in the injector reference system is x inj = 0. The streamtube is convected for 40mm up to x inj = 40.
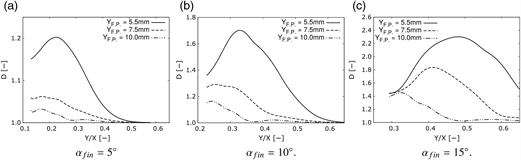
By tracking multiple streamtubes, the elongation potential for different spanwise positions is obtained. In Fig. 7, the effect of circle diameter (ϕ c) is explored while keeping the minimum distance between the circles and the flat plate (Y min) at 0.5mm. In Fig. 8 the diameters of the circles are kept constant (ϕ c = 10mm), while varying the distance between circle centres (Y F.P.) and flat plate.
D factor after 40mm.ϕ c = 10mm, centres at different distances from the plate (Y F.P.).

Figures 7(b) to 7(d) present the non-dimensinalized perimeter to area ratio D of the final shapes as a function of the starting location of the circle centres in conical coordinates Y/X for three different fin angles. On the plots, the location of the vortex core (C), separation line (S), as well as the Intermediate location between these (I) are also indicated, referencing the location of the injectors used in the second part of this study. These figures shows the importance of vortex intensity and injector location on the potential for fuel plume elongation. The α fin = 15° case induces a maximum D value 1.35 times larger than the α fin = 10° case, and 1.9 times larger than the α fin = 5° case. The size of the circle also plays an important effect. This size can be regarded as the fuel plume size and penetration, controlled by the injector diameter and injection to freestream pressure, with larger diameters corresponding to larger plumes. Smaller circles sit well within the region of highest intensity of the vortex crossflow (Fig. 6(b)), where the velocity gradients are large and produce an intense elongation. As the size of the ring increases, the upper region occupies a zone of lower velocity gradient, reducing the overall elongation induced to the circle.
The spanwise location of maximum elongation is constant for the different ring sizes. This location sits at around Y/X = 0.22 for the α fin = 5° case, Y/X = 0.33 for the α fin = 10° case, and Y/X = 0.49 for the α fin = 15° case. These values are consistently at 1/4 of the distance between the vortex core and the separation line.
The effect of circle distance to the flat plate, Y F.P. is presented in Fig. 8. Zero-mass circles with 10mm diameter and centres at 5.5mm, 7.5mm, and 10mm from the flat plate evolving for 40mm are analysed. Increasing distance to the flat plate can be regarded as equivalent to increasing penetration while keeping plume size relatively constant. The elongation of the circles reduces with increasing distance from the flat plate. Moreover, increasing this distance moves the location of the maximum elongation towards the fin (lower Y/X coordinate). As the circles are moved upwards, the interaction with the high velocity gradient crossflow adjacent to the flat plate reduces, decreasing the overall final elongation. Near the fin, the vortex is slightly thicker, as can be seen in Fig. 6(a). This produces certain level of plume elongation to the circles near the fin even at distances relatively far from the flat plate, shifting the location of maximum elongation towards the fin.
This preliminary study indicates that the best injection strategy to enhance mixing rate using inlet vortices involves the use of injectors producing fuel plumes with a size of the order of the boundary layer thickness (thickness of the intense crossflow region within the vortex). This is a suitable strategy for inlet injection as it can generate well mixed regions near the high temperature flow at the walls, initiating the production of radicals, creating regions very suitable to initiate combustion further downstream.
4.0 VORTEX-INJECTION INTERACTION
The zero-mass study is a simple and inexpensive method to evaluate the most suitable injection region and strategy to improve plume elongation. To obtain reliable data on the mixing process in the vortex-injection interaction numerical simulations including the injected gas are required. This is addressed in this section, which presents the vortex-injection interaction cases. The effects of this interaction on fuel plume shape and mixing efficiency are quantified. Moreover, the data is used to highlight the limitations of the “zero-mass” study.
4.1 Plume shape results
Firstly, the vortex-injection interaction is analysed qualitatively. The evolution of the fuel plume shape for the S.i, J = 1, α fin = 10° case is depicted in Fig. 5. The fuel plume is gradually stretched as it moves in the streamwise direction by the action of the vortex velocity field. To observe this effect in more detail, and how injector placement affects this interaction, the spanwise velocity for the α fin = 10° case on a plane 10mm downstream of the injector (at X inj = 10mm) is presented in Fig. 9. In this figure, the equivalence ratio lines (Fr) show the location and shape of the fuel plume in the extraction plane. These show that the spanwise velocity gradient in the direction normal to the flat plate is the main driver of the plume elongation.
Contours of spanwise velocity and lines of equivalence ratio (Fr) on slices normal to the fin at X inj = 10mm. (Positive velocities are from right to left).

Depending on injector placement, the fuel plume interacts with a different part of the vortex, which induces different levels of stretching. The Intermediate injector is located adjacent to the high intensity crossflow. This allows the high velocity crossflow to interact with the plume immediately after injection, making the plume span across a region of high velocity gradient. This produces an intense elongation of the plume shape starting immediately after injection. In the Separation injection case, the injector is located further from the high crosswise velocity region. As the vortex and plume grow, these interact similarly to the Intermediate injection case. Nonetheless, the increased distance between the jet and the high crossflow region produces a delay in the elongation compared with the Intermediate location case. For the Core injection case, the bulk of the plume is kept within a region of strong cross-flow velocity, but with little velocity gradient across the plume in the direction normal to the flat plate. This reduces the level of elongation of the plume compared to the other two injector locations.
To quantify this effect and the evolution of the fuel plume shape as it moves downstream, the plume shape is analysed on multiple axial planes. For this, the plume edge is defined as the region enclosed by an iso-line of equivalence ratio ϕ = 1. Figure 10 compares the nondimensionalised perimeter to area ratio D for all the test cases in this study. Note a circle is the geometric shape with the smallest possible value of L/A. Therefore, closed perimeter lengths should always return a value of D > 1. However, the part of the perimeter adjacent to the flat plate surface is not effective for mixing (no mixing can occur over this length). After removing this section of the perimeter, values less than one (D < 1) are possible. Also, note the curves are only plotted up to the region where the fuel plume splits in two or more regions.
Non-dimensionalised perimeter-to-area ratio D.

On each plot, the evolution of the plume with no vortex interaction (flat plate injection, FP.i.) is included for comparison. For flat plate injection with both J = 1 and J = 3 the D values rapidly decrease and plateau as the plume reaches a constant quasi semi-circular shape (see Fig. 6(b)). On the contrary, in the cases where the plume interacts with the vortex, the perimeter to area ratio rises with increasing axial distance.
For a given injector location, the values of the non-dimensional parameter D increase with α fin angles due to the higher intensity of the vortex, which induces a higher crossflow velocity. This produces a stronger crosswise elongation of the plume, increasing the nondimensionalized perimeter to area ratio. Comparing different injector locations, the Core injection plume is limited to significantly lower values of D than the Intermediate and Separation injection plumes. This is due to the reduced velocity gradient across the plume as observed in Fig. 9. The Intermediate and Separation injection cases show very similar results, with slightly higher values in the Intermediate case. Comparing the Intermediate and Separation cases in Fig. 10, it can be observed that most of the difference in elongation occurs shortly downstream of the injector. As previously stated, the Intermediate location delivers the fuel into an optimal region, as it interacts with the vortex crossflow just after injection. The Separation injection case, however, takes longer to fully interact with the high velocity crossflow, producing a delay and slower stretching of the plume near the injector.
4.2 Differences with the streamtube study
The fuel plume generated at the presented flow conditions for the flat plate (no fin) injection case has an approximate diameter of 10mm in the J = 3 case, and 7mm in the J = 1 case. Moreover, this fuel plume is attached to the flat plate, as can be seen in Fig. 6(b). Therefore, the most similar study case using the streamtubes (or zero-mass particles circles) is the ø c = 10mm case. The results of this case are shown in Fig. 7. From this figure, in the α fin = 10° case the injector location for maximum plume elongation sits between the Core and Intermediate injector locations. However, the injection case show a clear advantage of the Intermediate location. This discrepancy is due to the momentum of the injected hydrogen. The fuel is injected through an injector tilted at 45° in the axial direction. The resulting axial velocity component causes the plume to move in the positive X direction immediately downstream of the injector. In the conical coordinates system, this displaces the bulk of the plume towards lower X/Y values (closer to the fin), moving the effective location of the injectors as seen in Fig. 7 to the left. This moves the effective injector location for the Intermediate and Separation injector to potentially higher D values, and the Core injection location to potentially lower D values.
Moreover, disturbance to the vortex flowfield caused by the injection process is also neglected in the zero-mass circle analysis. This has an important effect, altering the vortex crossflow velocity contours, which are the main driver of fuel plume elongation. This is specially visible in the Core injection case in Figs 9(a) and 9(d), in which the region of high crosswise velocity is thickened by injection. This causes an interesting difference between the Core injection cases, and the other two injection locations: the opposite trend of the parameter D with increasing injection pressure. In the Core injection cases, D values are higher for the high injection pressure cases. On the contrary, in the Intermediate and Separation injection cases, the opposite can be observed. Due to the thickening of the high crosswise velocity region, the Core injection case requires a higher injection momentum to penetrate further and produce a fuel plume spanning across the vortex velocity field. At low injection momentum, the Core injection case produces a plume that stays within a relatively constant spanwise velocity, limiting plume shape stretching. On the contrary, increasing the injection-to-freestream momentum flux ratio in the Intermediate and Separation cases places the bulk of the fuel plume further from the flat plate. In this cases, having the bulk of the flow further from the flat plate leaves a smaller portion of the plume to interact with the high crossflow velocity region near the flat plate, producing a drop in plume elongation.
4.3 Mixing efficiency results
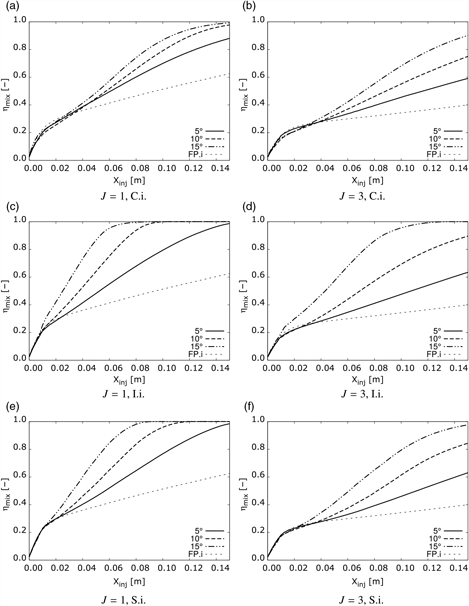
To evaluate the effect of the vortex-injection interaction on mixing, the evolution of mixing efficiency (η mix) is analysed for each test case. For this, the flow is interrogated in a number of planes normal to the axial direction. On each plane, the mixing efficiency is calculated using Equation 2(Reference Lee33), where ρ, u, and  $c_{H2}^{stoic} $ are the density, axial velocity, and stoichiometric H 2 mass fraction (0.0234). This provides the mixing efficiency value as a function of the axial distance from the injector, X inj. The values obtained for all configurations are plotted in Fig. 11. In addition, the flat plate injection case is presented as a reference.
 $$\eta _{mix} = {{\int \int c_{H2}^r \cdot \rho \cdot u \cdot dydz} \over {\int \int c_{H2} \cdot \rho \cdot u \cdot dydz}}{\kern 1pt} \;\quad \;\quad \;{\rm where}\;\quad \;\quad \;{\kern 1pt} c_{H2}^r = \left( {\matrix{{c_{H2} } & {c_{H2} \le c_{H2}^{stoic} } \cr {{{1 - c_{H2} } \over {1 - c_{H2}^{stoic} }}} & {c_{H2} > c_{H2}^{stoic} } \cr } } \right.$$
Mixing efficiency in streamwise direction for various injector locations and momentum ratios.
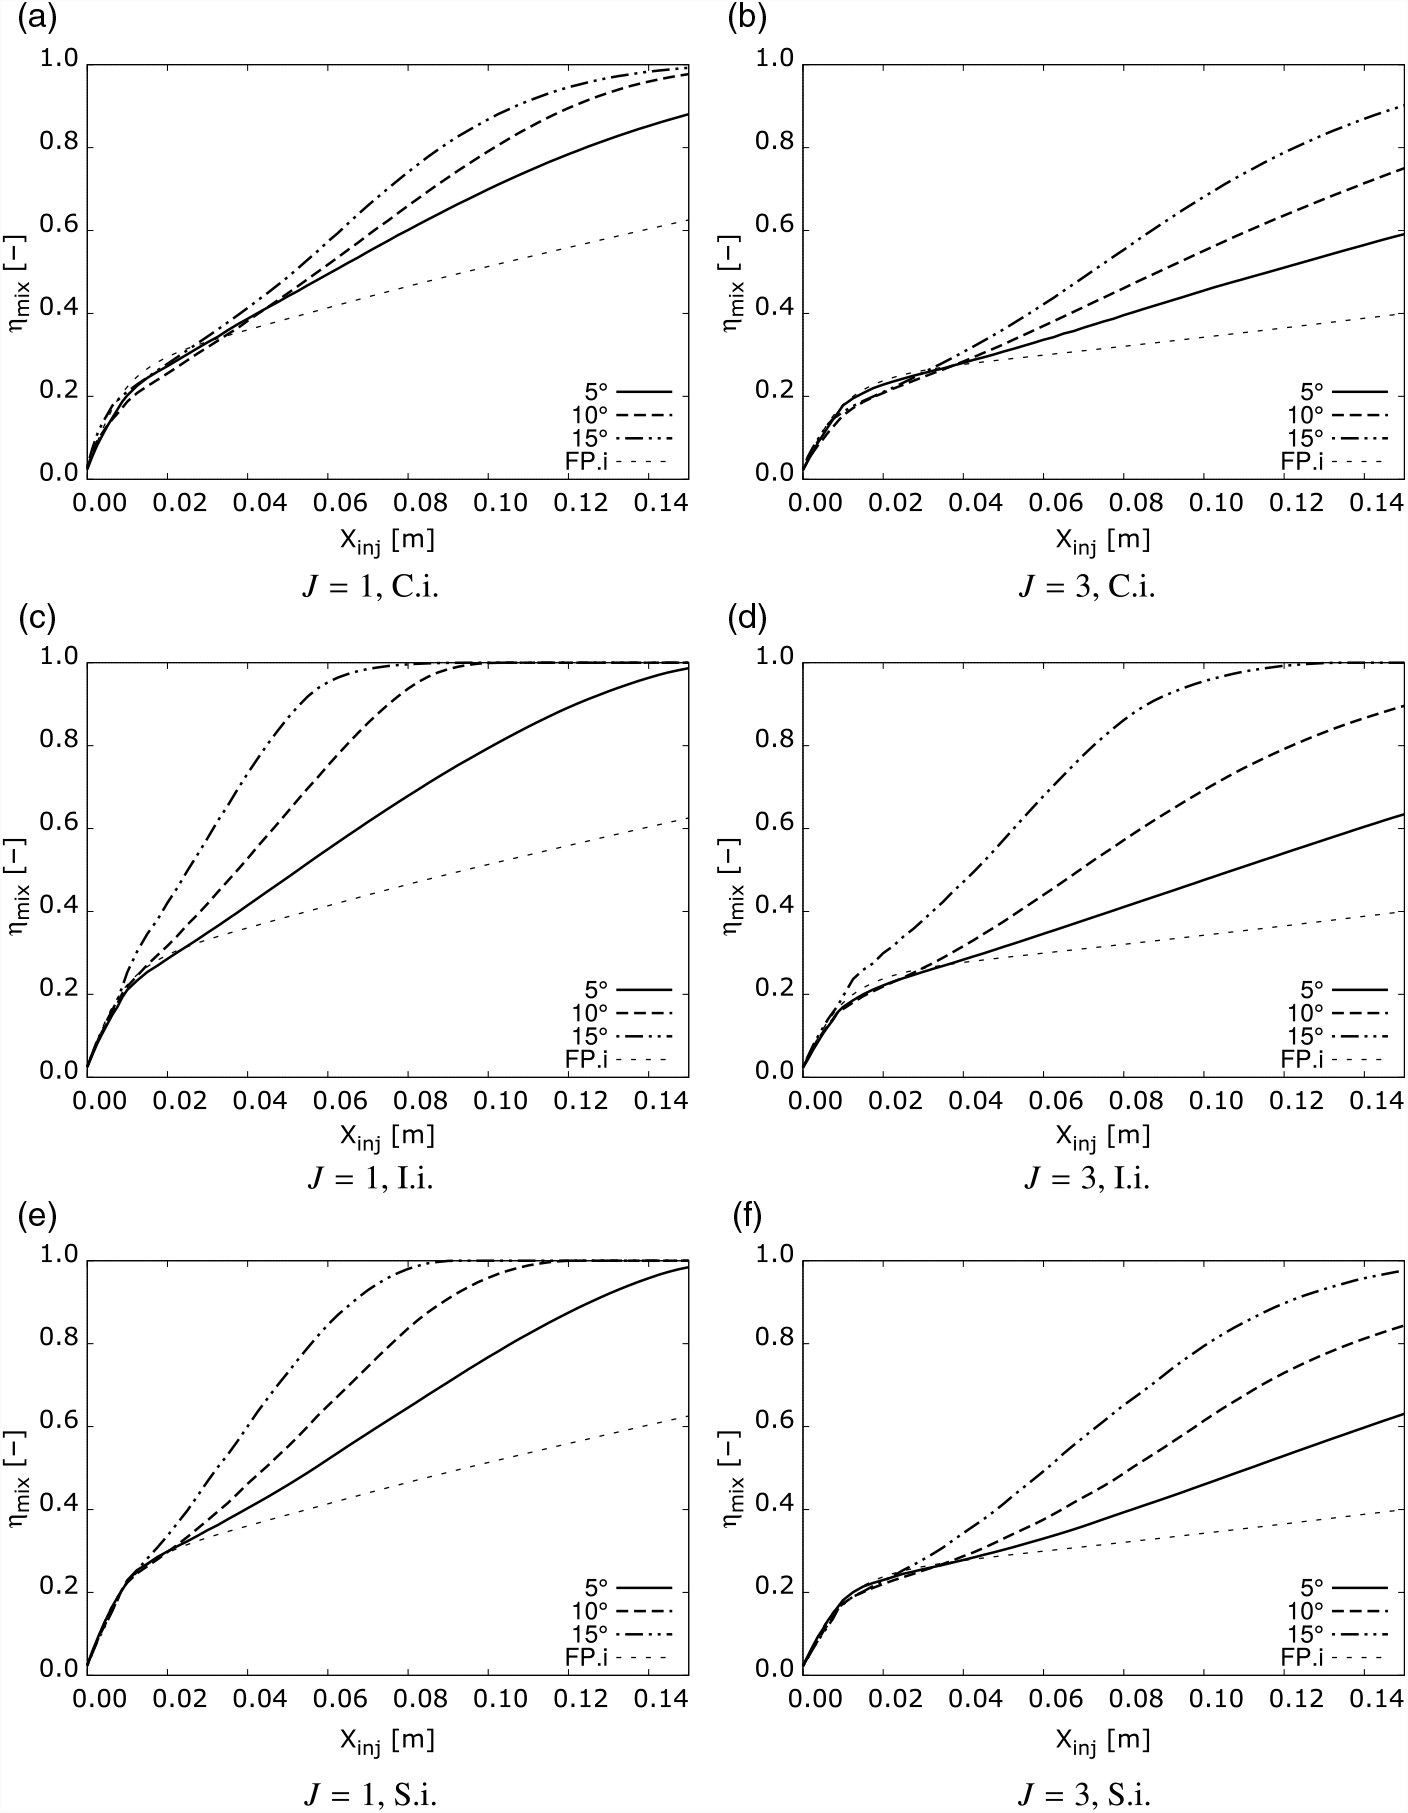
Figure 11 shows the impact of the vortex interaction on mixing rate. Mixing efficiency is highly increased by the vortex interaction. Higher fin angles, which produce stronger vortices, increase mixing rate, reducing distance to η mix = 100%. Comparison between the cases with different injection momentum shows that the J = 3 cases have lower mixing efficiency along the whole mixing region. Comparing the different injector locations, the Intermediate location shows the highest performance for all fin angles and injection momentum ratios. The Separation injection location cases come second, with the Core injection cases showing the lowest values. This is coincident with the trends observed for the effective mixing area, indicating the relevance of this parameter in mixing rate. The Intermediate injection cases can have local mixing efficiencies up to 1.8 times higher than in the Core injection case and 1.2 times higher than the Separation injection case. Moreover the distance to fully mixing is reduced substantially in the Intermediate injection cases. These results show the strong link between effective mixing surface and mixing efficiency, as well as the potential gains in mixing rate achievable by appropriately injecting within the naturally formed streamwise vortices in scramjets.
It is worth noting that the averaged nature of the RANS solution eliminates the effect of vortex instabilities and vortex meandering, which may create a fluctuating relative location between vortex Core and injector. These could be detrimental in that they limit the time this relative location is optimal, or beneficial in that the vortex fluctuation could disperse the fuel more effectively across the combustor. Different fuels could also have a slightly different behaviour when interacting with the incoming vortex, as different relative densities would generate different baroclinic torque that would affect the fuel-vortex interaction and fuel transport.
4.4 Mixing efficiency and plume shape
To highlight the correlation between non-dimensionalised fuel plume perimeter-to-area ratio, D and improvement in mixing efficiency, Figs 12 and 13 show both quantities normalized by the corresponding Core injection case data.
Mixing efficiency normalized by the corresponding Core injection case.

Non-dimensionalised perimeter-to-area ratio D normalized by the corresponding Core injection case.

These two quantities can only be compared close to the injector, as mixing efficiency asymptotes to one as fully mixed conditions are approached. Focusing on the region between X inj = 0 to X inj = 0.06, the normalized values of mixing efficiency in Fig. 12 rise very rapidly just downstream of the injector, and then continue growing with a lower gradient. For the J = 1 cases, the normalized Intermediate injection cases (I.i./C.i.) rapidly reach about 1.4, 1.2 and 1.0 in the 15°, 10° and 5° fin angles respectively. The rapid increase in normalised D parameter for the same cases in Fig. 13 reach very similar values. Moreover, the subsequent slower rise in normalized mixing efficiency and D parameter up to X inj = 0.06 also follows very similar trends for both parameters before normalized mixing efficiency curves start asymptotically going to one. This similarity is also visible for the Separation injection cases as well as the J = 3 cases comparing Figs 12 and 13. This similar behavior for both parameters: mixing efficiency and D parameter, strengthens the link between plume shape and mixing efficiency rate, showing the relevance of the fuel plume shape for mixing enhancement.
4.5 Losses and Entropy generation
Generation of losses is another relevant parameter when selecting the best fueling strategy for overall performance. To quantify this effect in the vortex-injection interaction the entropy in the flowfield is calculated at each cell using equation 3, where the reference values P ∞ and ρ ∞ are the freestream inflow conditions.
 $$S = c_v {\kern 1pt} {\rm ln}\left( {{P \over {P_\infty }}} \right){\kern 1pt} + {\kern 1pt} c_p {\kern 1pt} {\rm ln}\left( {{{\rho _\infty } \over \rho }} \right)$$
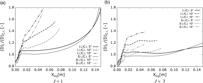
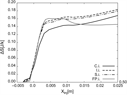
Figure 14 shows the evolution of entropy from the fin leading edge to the end of the domain evaluated at multiple axial planes. Entropy shows a steady increase from the fin leading edge (X inj = −0.10) due to the presence of the fin shock wave. Moreover, this shock produces higher entropy for higher fin angles. In the vicinity of the injector, a steep rise in entropy is produced due to the injection process. For all fin angle and injection momentum ratio cases the Intermediate injection location generates the most severe increase in entropy in the injector vicinity, followed by the Separation injector location. However, the entropy values tend to reach very similar levels shortly downstream of the injector. Although the Core injector generated the lowest increase in entropy in the injector vicinity, further downstream entropy levels for this injector location tend to surpass the other injector locations. This is specially visible in the J = 3 cases in Fig. 14(b).
Entropy evolution from fin leading edge to end of domain.

The vortex-injection cases and the case without vortex (flat plate injection, FP.i.) cannot be compared directly due to the lack of a fin shock in the later. However, to compare the effect on entropy of injecting within the vortex, the entropy rise (ΔS) from the injector location is presented if Fig 15 for the α = 5° cases and the flat plate injection case with J = 1. This figure shows that the initial rise in entropy due to the injection process is very similar for all presented cases. Interestingly, a slightly higher entropy rise in the flat plate injection case exists. In this case injection takes place into the undisturbed freestream, with a higher Mach number. Hence the loses in the injection bow shock are increased. As the injector is moved towards the vortex core, the loses are slightly reduced thanks to the reduced Mach number within the vortex. The same is true for the J = 3 cases. This result further supports the fact that utilising existing vortices produces none or negligible increase in loses. Indeed, in this case entropy related to the injection process is slightly reduced.
Entropy rise at injector location for α = 5° and FP.i. J = 1 cases.

Shortly downstream of the injector, the flat plate injection case curve diverges from the others due to the lack of a fin shock in this case. The region of entropy decrease in the FP.i. case is due to the high temperature of the gas near the flat plate wall caused by the injection bow shock, which produces a high amount of heat lost to the constant temperature wall.
Due to the minimal differences in entropy generation for the different injector locations, especially as the values reach almost equal levels a short distance downstream of the injector, there is no preference fora a particular injector location with respect to loss generation. Moreover the entropy generated by injecting within the vortex is slightly lower than the baseline case of injecting in the freestream, as shown in Fig. 15. This confirms that for the conditions investigated, by injecting into the vortex, better mixing is attained without causing increased losses.
5.0 CONCLUSIONS
A simplified geometry generating vortices equivalent to those found in scramjet inlets was used to study the effect of streamwise vortices on porthole injected fuel plume shape and mixing rate. Three different vortex intensities, three injector locations, and two injection-to-freestream momentum flux ratios were analysed. To evaluate the quality of a fuel plume shape for mixing purposes parameter D, a non-dimensional measure of plane perimeter to plume cross-sectional area, is proposed. A study to assess the potential of the vortex flowfield to produce fuel plume elongation was performed using rings of zero-mass particles. The results identify the regions of the vortex flowfield with highest potential for fuel plume elongation for different vortex intensities and fuel plume sizes and locations. Moreover, it is shown that the region adjacent to the flat plate is the largest contributor to elongation. The actual fuel-vortex interaction was studied by injecting H 2 fuel at three different spanwise locations within the vortex. The Intermediate injector location produced the highest plume elongation followed by the Separation injector, while the Core injector clearly underperformed compared to the former. For the Intermediate injector case a maximum increase of up to 2.4 times in effective area for mixing, compared to the case with no vortex interaction is achieved. Mixing efficiency shows very similar trends to the D parameter curves, highlighting the importance of fuel plume elongation on mixing rate. Very substantial gains in mixing rate are obtained thanks to the interaction between vortex and fuel jet. This substantially reduces the distance between injection and location where 100% mixing efficiency is obtained. This improvement is most significant for the Intermediate injection location. Moreover, the consistently higher improvement on fuel mixing rate using the Intermediate injector location suggests that this is the case for a wide range of vortex intensities, ranging from the weak naturally occurring vortices in a shape-transition inlet to the strong vortices formed in typical 2D scramjet inlets. Analysis of the entropy generation both in the injector proximity and far downstream shows that injection strategy does not create losses higher than a flat plate injection. Therefore, this work shows the possibility of substantially improving mixing rate while incurring no increase in losses by using the appropriate injection strategy that exploits the presence of scramjet inlet generated vortices. These features of mixing enhancement without losses or increased heat loads are critical for high Mach number access to space Scramjets.
ACKNOWLEDGEMENTS
This research was supported under Australian Research Council’s Discovery Projects funding scheme (Project DP130102617-The science of scramjet propulsion). This research was undertaken with the assistance of resources from the National Computational Infrastructure (NCI), which is supported by the Australian Government, and by resources provided by The Pawsey Supercomputing Centre with funding from the Australian Government and the Government of Western Australia. The author would also like to thank the School of Mechanical and Mining Engineering at UQ for the financial support.












 Open access

