

Attributions at Work
Heider (Reference Heider1958) defined attributions as an individual’s explanations of the reasons and causes behind events or behaviors (e.g., successes or failures experienced). Individuals have a natural inclination to perceive the causes of major events in a certain way, and these attributions can contribute to subsequent specific affective reactions, emotions, and behaviors (Heider, Reference Heider1958; Weiner, Reference Weiner1986). The literature agrees that attributions are characterized by some dimensions. The most studied ones have been locus of causality, stability, and locus of control (Weiner, Reference Weiner2018). Moreover, combining these dimensions, different attributional styles emerge as patterns of reactions to major events. At this point, attributional styles could be defined as a stable inclination “to make certain types of attribution that affect behavior across situations” (Martinko et al., Reference Martinko, Harvey and Dasborough2011, p. 145).
These dimensions and attributional styles have also been applied in the organizational field. In their meta-analysis, Harvey et al. (Reference Harvey, Madison, Martinko, Crook and Crook2014) found significant relationships between attributional dimensions and affect, performance, leader–member exchange, and punishment/reward intentions, concluding that “attribution theory has significant predictive power that is similar or equal to other theories that attempt to predict and explain workplace phenomena” (p. 135). Despite recognition of its potential explanatory power in organizational sciences, authors like Martinko et al. (Reference Martinko, Harvey and Dasborough2011) assure that attribution theory remains underutilized in this field. This claim might be considered unfair if we take into account, for instance, the extensive tradition of applying attribution theory to the study of leadership as an attributional phenomenon (e.g., Lord & Maher, Reference Lord and Maher1991). However, it is true that in other topics such as motivation or affect, where dimensions and attributional styles would clearly be relevant according to the original theories (e.g., Weiner, Reference Weiner1986), the applications of attribution theory are less frequent.
In this article, we argue that one of the main reasons for this underuse of self-attributions is related to the different deficiencies shown by existing measurement tools. Among the few existing measurement tools, the most popular ones are primarily rooted in clinical psychology, with a focus on understanding phenomena like learned helplessness (e.g., the Attributional Style Questionnaire [ASQ], Peterson et al., Reference Peterson, Semmel, von Baeyer, Abramson, Metalsky and Seligman1982). Moreover, the psychometric properties of these tools have also been questioned (e.g., Proudfoot et al., Reference Proudfoot, Corr, Guest and Gray2001). Additionally, most of these instruments have considered hypothetical situations without assessing their relevance (Peterson et al., Reference Peterson, Semmel, von Baeyer, Abramson, Metalsky and Seligman1982; Proudfoot et al., Reference Proudfoot, Corr, Guest and Gray2001). This situation limits the extent to which the elicited attributions truly reflect individuals’ typical explanatory patterns in contexts that matter to them. However, attribution as a cognitive process only makes sense in front of relevant situations (Kelley & Michela, Reference Kelley and Michela1980; Weiner, Reference Weiner1986). Specifically, attributions are activated in three well-established situations: when individuals face novel events, when they experience negative outcomes, and when outcomes diverge from expectations (Wong & Weiner, Reference Wong and Weiner1981). Finally, a last concern is about the predominant use of student samples. Although common in early validation studies, reliance on student participants limits the generalizability of findings to broader working populations since students may differ from employees in age, work experience, exposure to organizational contexts, and the types of events that elicit attributional processes. For all these reasons, the main goal of this article is to develop a new tool to measure attributional styles at work that (1) is focused on attributions at work, (2) is based on real, relevant and frequent situations and events that workers experience in their daily life, and (3) reaches the standard requirement of psychometric properties.
Attributional Dimensions and Styles: Definition and Measurement
Locus of causality, stability, and controllability are the three core attributional dimensions identified in the classical literature (Weiner, Reference Weiner2018). Although additional dimensions have been proposed (e.g., globality, intentionality), these three have predominated in empirical research, partly because other dimensions tend to overlap conceptually with them. The locus of causality refers to whether the perceived cause of an outcome is considered internal (i.e., due to the person) or external (i.e., due to others or to circumstances). Locus of causality is a consistently assessed form of individuals’ perceptions of whether an event or an outcome is due to themselves or due to the situation. Stability refers to the perception of variability over time of the causes of an outcome. In other words, it captures the extent to which the outcome is seen as something that can recur across different situations or circumstances. Controllability refers to whether the causes of an outcome are perceived as being under the control of the person. For example, the amount of effort put into a task can be deemed controllable, while luck is not (Harvey et al., Reference Harvey, Madison, Martinko, Crook and Crook2014; Weiner, Reference Weiner1986). Review research has found a clear overlap between locus of causality and controllability, suggesting the use of only one of these dimensions, usually in favor of the first (e.g., Harvey et al., Reference Harvey, Madison, Martinko, Crook and Crook2014).
Combining these dimensions, different attributional styles have been proposed. Attributional styles can be defined as general tendencies to consistently explain positive and negative outcomes with a specific type of cause (e.g., internal or external, stable or unstable; Harvey & Martinko, Reference Harvey, Martinko and Borkowski2009). The two most common types are optimistic and pessimistic attributional styles. The optimistic style refers to the tendency to attribute positive outcomes to internal-stable factors and, at the same time, to attribute negative outcomes to external-unstable factors. Conversely, the pessimistic style refers to the opposite tendency: to attribute positive outcomes to external-unstable factors and to attribute negative outcomes to internal-stable factors (e.g., Harvey & Martinko, Reference Harvey, Martinko and Borkowski2009). Similarly, Seligman (Reference Seligman1998) defines optimism as a mental process that combines positive expectations and an attributional style that favors internal, stable, and global attributions for positive outcomes and external, unstable, and specific attributions for negative outcomes.
Different tools have been proposed to measure attributions at work. These tools have facilitated progress in attribution research—particularly the ASQ, which will be discussed shortly—by making significant contributions to the operationalization of attributional dimensions and styles, thereby stimulating further research in the field. However, as we will detail, these instruments also present important limitations. The most widely used is the ASQ developed by Peterson et al. (Reference Peterson, Semmel, von Baeyer, Abramson, Metalsky and Seligman1982) in its original version, or in enhanced versions (e.g., Peterson & Villanova, Reference Peterson and Villanova1988; Travers et al., Reference Travers, Creed and Morrissey2015). The ASQ presents 12 hypothetical situations, six positives (e.g., “You become rich”) and six negatives (e.g., “A friend comes to you with a problem and you don’t try to help”), for which responses must be given regarding the degree of internality (locus of causality), stability, and globality. However, the ASQ presents several measurement problems. First, its psychometric results are not always good (e.g., reliability values range .46–.88; see details in Supplementary Table S1). Second, the situations considered are hypothetical and may not necessarily be relevant to employees (e.g., “You give an important talk in front of a group and the audience reacts negatively”). And third, the ASQ is based on the learned helplessness model, having a clinical origin, which diminishes its interest in contexts like the workplace. At the workplace, for example, the predominant situations are about achievement–tasks (e.g., Martinko et al., Reference Martinko, Douglas and Harvey2006). Hence, measurement tools that consider attributions in specific domains (e.g., the workplace in our case), and are based on real relevant events, would be more useful for advancing research and applying this knowledge in organizational sciences (Ashforth & Fugate, Reference Ashforth and Fugate2006).
To address some of these limitations, new tools have been proposed. Specifically, to our knowledge, three tools have been designed for workplace contexts: the Occupational Attributional Style Questionnaire (OASQ), the Organizational Attributional Style (OAS), and the Work Attributional Style Questionnaire (WASQ). The OASQ (Furnham et al., Reference Furnham, Sadka and Brewin1992), presents 10 hypothetical situations, five positive (e.g., “Imagine that you apply for promotion and get it”) and five negative (e.g., “Imagine that you are turned down at a job interview”), asking about up to nine different attribution dimensions (i.e., internality, stability, probability, externality, chance, personal control, colleague control, foreseeability, and importance) that the exploratory factor analysis (EFA) suggests to reduce to three. A revised version has been presented (Furnham et al., Reference Furnham, Brewin and O’Kelly1994), which features five dimensions, but continues to have significant shortcomings in terms of the scale’s psychometric properties (e.g., alpha values lower than .70). Meanwhile, the OAS (Kent & Martinko, Reference Kent, Martinko and Martinko1995) presents 16 hypothetical situations, all negative (e.g., “You are involved in a serious accident at work”), exploring six attribution dimensions (i.e., controllability, stability, intentionality, internality, externality, and globality), which the EFA reduces to the first three, but which subsequent analyses have not confirmed. An additional limitation is that OAS has only been applied, to the best of our knowledge, to student samples. Finally, the WASQ (Ashforth & Fugate Reference Ashforth and Fugate2006) proposes 12 positive events (e.g., “You meet the deadline on a vital assignment”) and their 12 negative counterparts (e.g., “You miss the deadline on a vital assignment”) to explore four dimensions (i.e., internality, stability, controllability, and globality), which the EFA reduces to two (i.e., internality–controllability and stability–globality), though subsequent studies are not conducted to confirm this solution. A strength of the WASQ is that it relies on actual events proposed by workers. More details about these tools can be found in Supplementary Table S1.
OASQ, OAS, and WASQ would be the most useful tools available to assess attributions at work. However, they present important limitations. First, the choice of situations proposed as stimuli to trigger attributions should be justified in order to guarantee content validity. While it seems obvious that the situations proposed in both the OASQ and the OAS are relevant for any worker, it would be advisable to substantiate the selection of these situations. The hypothetical situations should account for events relevant to elicit an affective reaction in the employee (Basch & Fisher, Reference Basch, Fisher, Ashkanasy, Härtel and Zerbe2000; Morgeson et al., Reference Morgeson, Mitchell and Liu2015; Ohly & Schmitt, Reference Ohly and Schmitt2015) necessary to activate attribution mechanisms. In other words, of the many routine working events that occur daily, not all are salient and strong enough to generate subsequent affective reactions, especially if these events are not necessarily relevant to the employee. This weakness has been partially addressed in the WASQ by proposing real events. However, these events were suggested by a sample of university students with limited work experience. Second, the underlying dimensionality of these tools, resulting from the EFAs conducted in all cases, should be replicated. It appears that many of the dimensions (four-to-nine range) are not necessary to measure attributions at work. Two or three dimensions seem to be sufficient according to empirical analyses and considering the theoretical discussions. Specifically, there is the most agreement on the dimensions of intentionality (or locus of causality), stability, and controllability (see Supplementary Table S1). However, these could even be reduced to two, given the repeatedly found overlap between locus of causality and controllability (see meta-analysis by Harvey et al., Reference Harvey, Madison, Martinko, Crook and Crook2014). Third, these tools address different dimensions of attributions, but have not proposed, in accordance with these dimensions, a measure of different attributional styles (e.g., optimistic vs. pessimistic) that could be easily derived by the dimensions. The WASQ takes a step in this direction by proposing positive and negative attributional styles, through the simple aggregation of positive and negative events. However, it is paradoxical that in this instrument, where positive situations and their negative counterparts are explicitly created (e.g., “You surpass your sales quota” and “You do not meet your sales quota”), these scores are not integrated in some way when it seems evident that they measure the same events.
All the earlier leads us to significantly value the knowledge already achieved after decades of research on attribution theory in workplace contexts. However, to advance the field and address the underutilization of attributions in organizational research, we believe it would be necessary to develop a measurement tool that, first, meets contemporary psychometric standards; second, assesses the two attributional dimensions that prior studies have identified as pivotal (i.e., locus of causality and stability); third, derives attributional styles directly from response patterns on these dimensions, as theoretically proposed (e.g., Harvey & Martinko, Reference Harvey, Martinko and Borkowski2009); fourth, embeds items in clearly relevant, ecologically valid work scenarios; and fifth, is validated with samples of employed adults. In addition, we are also interested in studying the relationships among attributional styles and other dispositions such as affectivity, personality traits, and motivation. As we have noted, if we consider attributional styles as general tendencies (e.g., Harvey & Martinko, Reference Harvey, Martinko and Borkowski2009), it will be of interest to explore the relationships between these tendencies and other personal dispositions. This would also be a way to encourage the use of attributions in the study of organizational behavior, similarly to how dispositions such as personality or affectivity are already utilized. These are the research objectives pursued in this study.
Aims of the Study and Hypothesis Formation
As we have argued, the field of attribution studies in workplace contexts needs measurement tools that focus on relevant work-related situations that trigger attribution mechanisms and meet the usual psychometric standards. To address this need, this work will first present a study in which a systematic review yields a list of work-related trigger events for attribution mechanisms, thereby laying the foundation for, and directly supporting, the content validity of the questionnaire that will subsequently be developed. These events or situations will then be reformulated to generate an initial bank of items to be used in a subsequent questionnaire. Second, various studies with various employee samples will be presented to study the reliability and internal validity of the scores proposed by the tool created.
We consider the classic distinction between optimism and pessimism for the attributional styles. Considering only the main dimensions of locus of causality and stability means that optimism can be defined as internal-stable attributions for positive outcomes and external-unstable for negative outcomes. Conversely, pessimism would be external-unstable attributions for positive outcomes and internal-stable for negative outcomes.
Within the study of the validity of the new tool, we propose that attributional styles are related to other individual dispositions, as a way to study criterion-related validity. Given that attribution styles are individual dispositions that exhibit behavioral and emotional patterns, it becomes of interest for organizational psychologists to investigate the affective reactions that optimists and pessimists display. Considering these styles, it has been proposed that negative affectivity is likely to influence on the frequency with which people perceive negative outcomes and exhibit pessimistic attributions (Martinko et al., Reference Martinko, Gundlach and Douglas2002). These authors claim that individuals with high negative affectivity tend to focus on the negative aspects of their environment and themselves, often blaming stable factors (either internal or external) for negative events. Similarly, considering the way both attributional styles and affectivity are measured, as in the PANAS (Watson, Clark, & Tellegen, Reference Watson, Clark and Tellegen1988) for example, we could argue that optimistic workers will experience more positive affect. Taking into account these arguments, we propose the following hypotheses:
H1: Pessimistic attributional style will be positively related to negative affectivity.
H2: Optimistic attributional style will be positively related to positive affectivity.
Similarly, we can expect relationships between attribution styles and personality traits. Researchers such as Eysenck and Derakshan (Reference Eysenck and Derakshan2011) have suggested that individuals with high neuroticism may exhibit a negative attentional bias. Pessimism, characterized by a negative view of the environment and the interpretation of adverse events as stable and difficult to change, could be linked to the high emotional reactivity associated with neuroticism (Costa & McCrae, Reference Costa, McCrae, Boyle, Matthews and Saklofske2008). On the other hand, optimistic attribution styles might reflect greater sociability and enjoyment of social interactions, traits commonly associated with extraversion, as proposed by Carver and Scheier (Reference Carver and Scheier2014). These relationships between pessimism–neuroticism and optimism–extraversion have already been observed, though primarily in student samples (e.g., Cheng & Furnham, Reference Cheng and Furnham2001). Therefore, we hypothesize that:
H3: Pessimistic attributional style will be positively related to neuroticism.
H4: Optimistic attributional style will be positively related to extraversion.
Additionally, attributional styles can also be related to work motivation. According to self-determination theory (Deci & Ryan, Reference Deci, Ryan and Ryan2012), motivation varies along a continuum of perceived autonomy, from amotivation to intrinsic motivation. Attribution theory (Weiner, Reference Weiner2018) similarly emphasizes the role of perceived control in shaping behavioral persistence and effort. When individuals explain success through internal and stable causes—hallmarks of optimistic attributional style—they are likely to perceive higher personal agency and, consequently, display more self-determined motivation (e.g., Turban et al., Reference Turban, Tan, Brown and Sheldon2007). Conversely, individuals with a pessimistic attributional style—tending to interpret failures as caused by internal and stable factors and successes as external and unstable—are likely to experience diminished perceptions of control and competence. Such external or uncontrollable attributions undermine the sense of autonomy central to self-determination theory, thereby fostering amotivation or learned helplessness responses (Deci & Ryan, Reference Deci, Ryan and Ryan2012; Martinko & Gardner, Reference Martinko and Gardner1982). This pattern of relationships leads to the following hypotheses:
H5: Pessimistic attributional style will be positively related to amotivation.
H6: Optimistic attributional style will be positively related to extrinsic and intrinsic forms of motivation.
Finally, previous research indicates gender differences in attributional dimensions and styles. From classic studies like Deaux and Farris (Reference Deaux and Farris1977) to more recent works such as Martinko et al. (Reference Martinko, Douglas and Harvey2006), consistent findings suggest subtle differences in how men and women evaluate their performance. Women often attribute their successes to external factors more than men do, which suggests that self-serving attributional bias may be stronger in men. Taking this argument into account, we propose a final hypothesis:
H7: Women will have lower optimism scores compared to men; consequently, women will have higher pessimism scores compared to men.
Study 1: Content Validity: Development of the Attributional Styles at Work Questionnaire (ASWQ)
Method
A Systematic Review about Relevant Events at Work for Activating Attributions
With the aim of addressing the content validity of the new questionnaire we propose, we started by conducting a systematic literature search to identify existing studies that examined categories of work-related events susceptible to activating attribution processes (i.e., relevant events that produce an affective reaction). The inclusion criteria were (1) that the investigations specifically developed categories of work events and (2) that these same categories were treated as affective events, that is, they were in some form, theoretically or empirically, related to the workers’ emotional experience. We conducted our search using the PsycINFO, PsycARTICLES, and PsyCRITIQUES databases. The used keywords consisted of a combination of “work events,” “daily events,” “categories of events,” and “affective events.” In the search, we combined these constructs with “categorization” and “work.”
The search process found 31 references of potentially relevant studies. After duplicates were removed and the titles were reviewed for relevance, the abstracts and full documents were assessed. Twelve studies were excluded because they did not meet the inclusion criteria (e.g., the categories of events were not treated as affective events), leaving 19 studies eligible for full text retrieval (see Table 1 and Supplementary Material—PRISMA flowchart).
Categories of events proposed by the literature and their transformation into items to generate the Attribution Styles at Work Questionnaire (ASWQ)
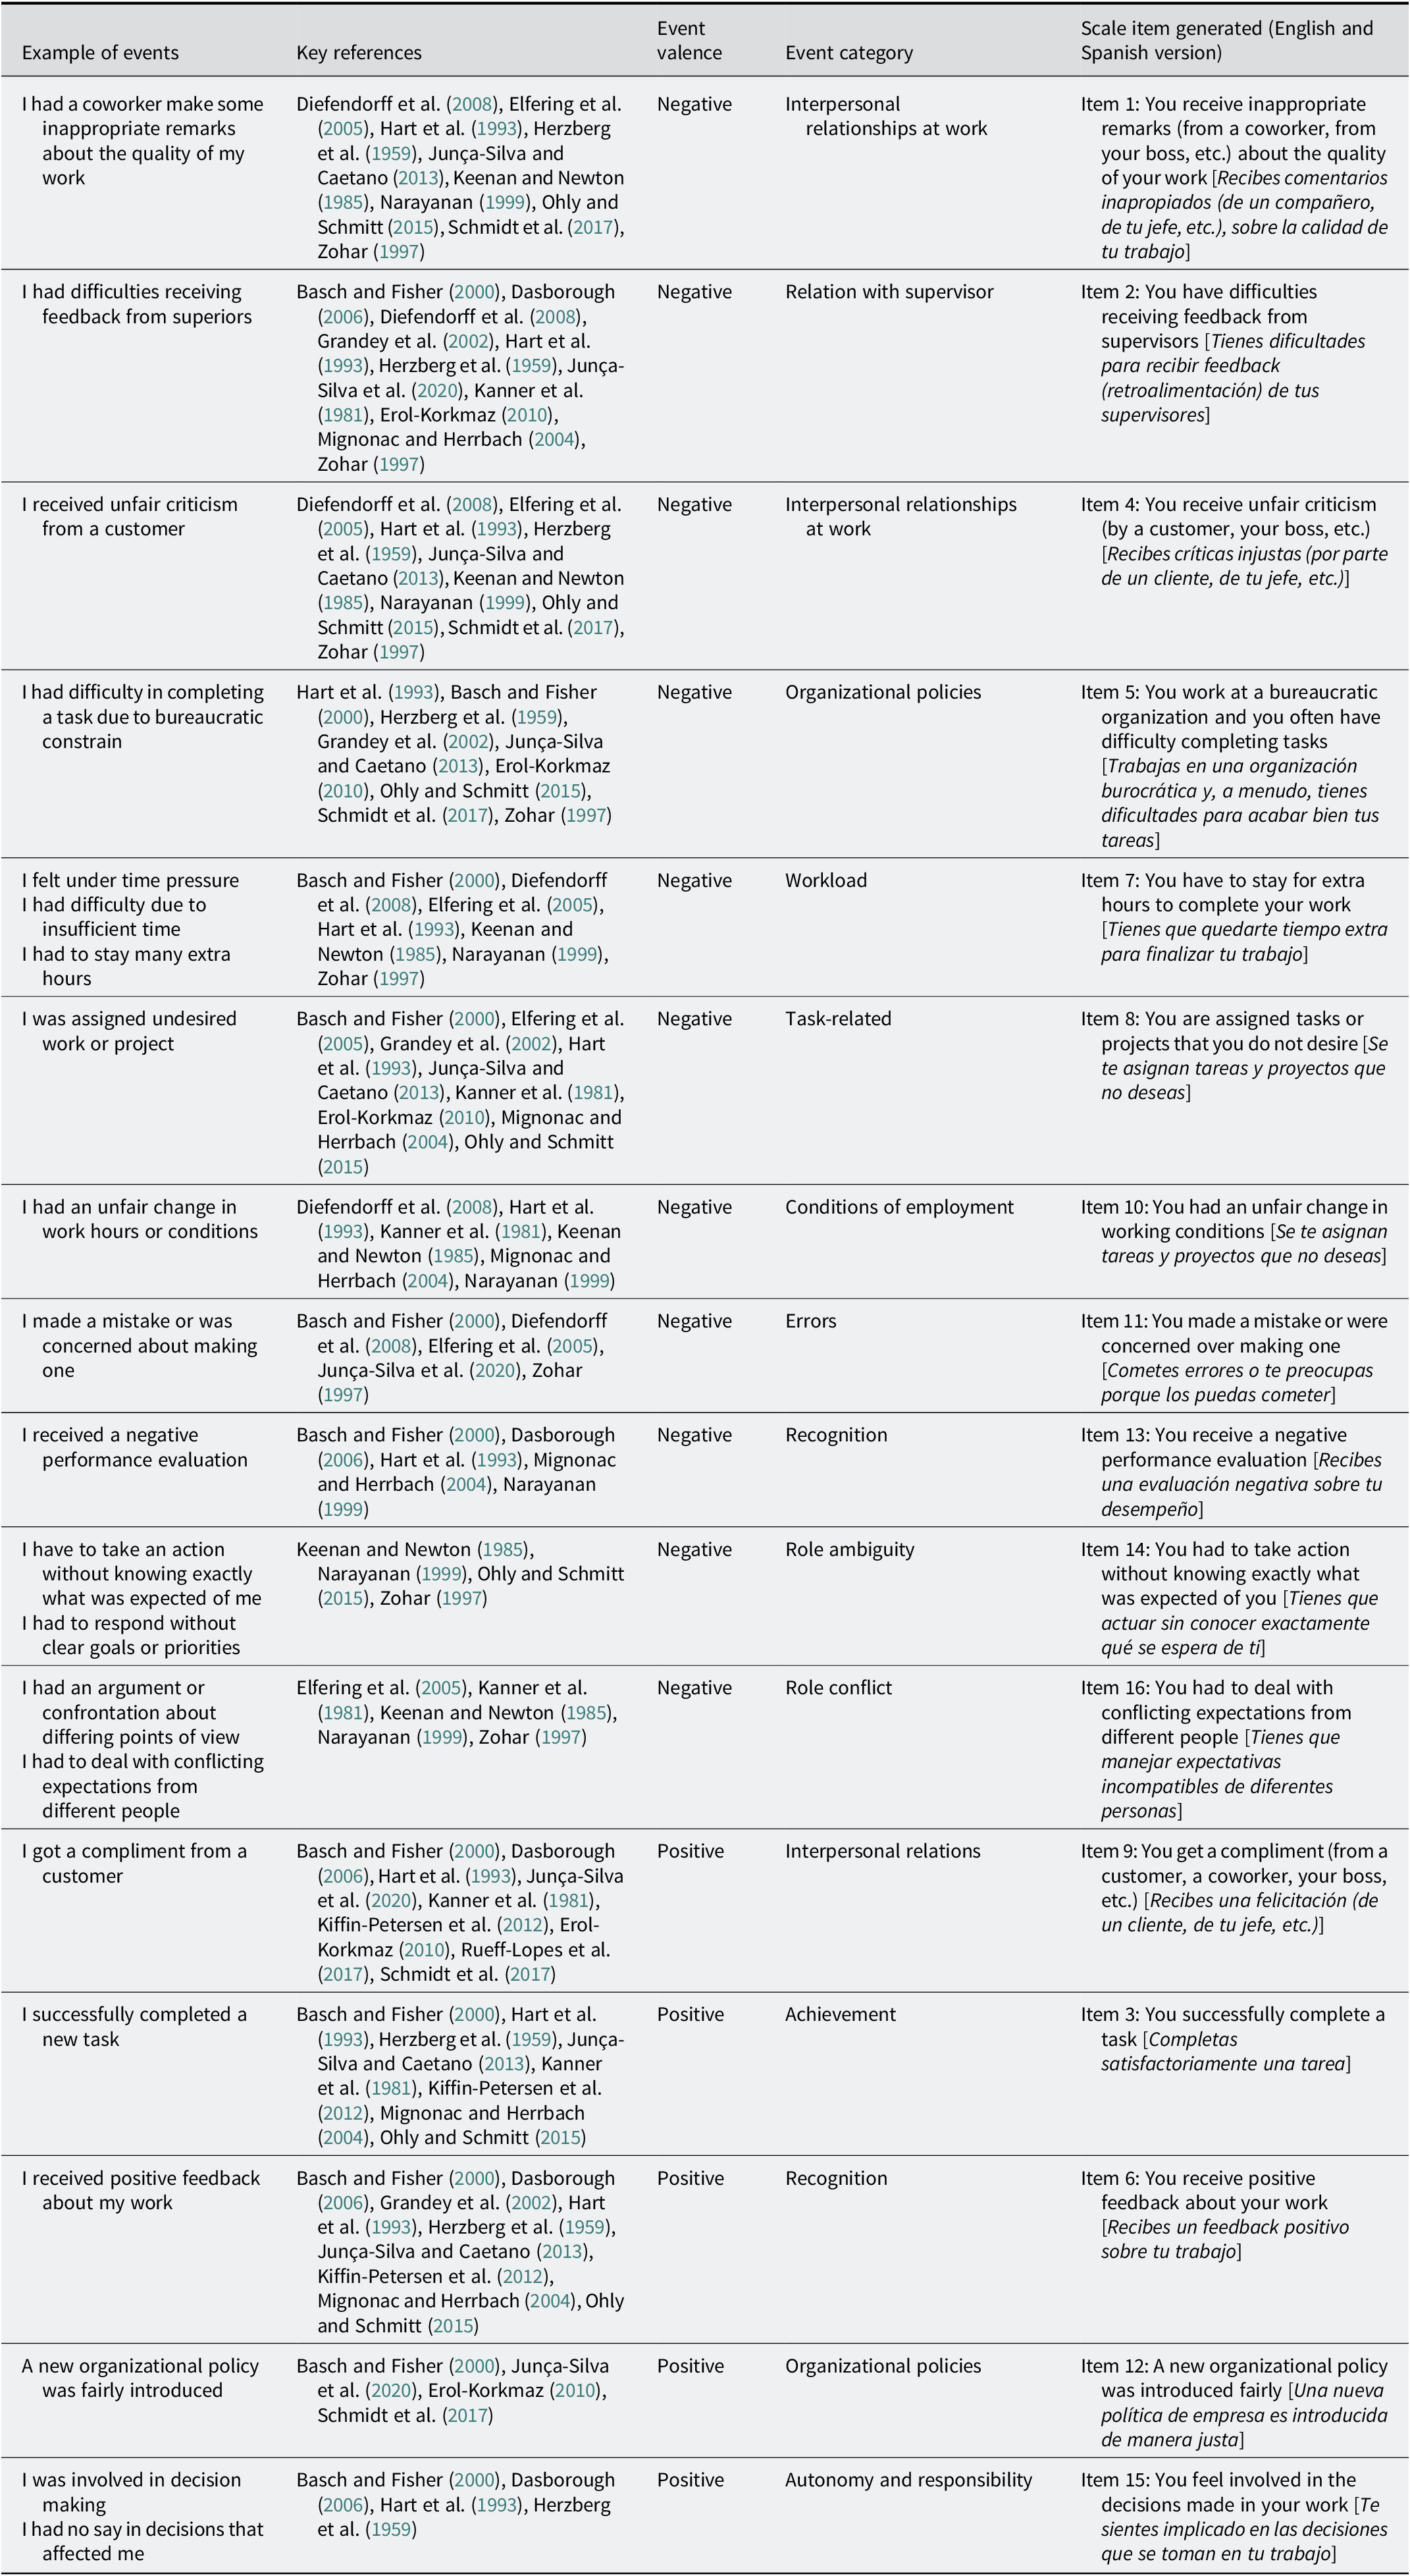
Table 1. Long description
The table contains five columns. From left to right, columns are: Example of events, Key references, Event valence, Event category, and Scale item generated (English and Spanish version). Each row details a specific work event. The first row describes receiving inappropriate remarks about work quality, with references including Diefendorff et al. 2008 and others, valence marked as Negative, category as Interpersonal relationships at work, and the scale item ‘You receive inappropriate remarks (from a coworker, from your boss, etc.) about the quality of your work’ with the Spanish translation. The second row covers difficulties receiving feedback from superiors, with references, Negative valence, Relation with supervisor category, and the corresponding scale item in both languages. Subsequent rows follow the same structure, covering events such as receiving unfair criticism from a customer, difficulty completing tasks due to bureaucracy, time pressure and extra hours, being assigned undesired work, unfair changes in work conditions, making mistakes, receiving negative performance evaluations, acting without clear expectations, dealing with conflicting expectations, receiving compliments, successfully completing tasks, receiving positive feedback, fair introduction of new policies, and involvement in decision making. Each event is paired with relevant literature references, its positive or negative valence, categorized type, and the generated scale item in English and Spanish. The table footnote notes that some events were discarded due to lack of connection with attribution mechanisms, listing examples such as personal problems interfering with work and technical difficulties.
Two of the authors of this manuscript independently analyzed the proposed events and then reached an agreement on the final list of potential events to be considered, examining overlaps. A total of 22 events were agreed upon. From this list, we excluded the following events, as no consensus was reached on whether they clearly represent situations that require the activation of explanatory attributional mechanisms: “Personal problems interfered in my work,” “I experienced technical difficulties problems with work tools or equipment,” “I performed challenging (or interested) tasks,” “The collaboration with colleagues went well,” “Someone was friendly towards me,” and “I felt inspired/motivated by my supervisor.”
As a result of this process, we finally proposed 16 frequent and relevant situations at work to be considered to assess attributional styles (see Table 1). The valence of the events (i.e., positive or negative) was also analyzed, and a simple categorization system was proposed to classify these events accordingly. There is a clear predominance of negative situations, according to the main idea that attribution mechanisms are easier to activate in these unfavorable circumstances. Additionally, it is also remarkable how these situations or events are related to some great categories such as interpersonal relations, achievement, or recognition.
Once the list of events were extracted, items were formulated and translated to Spanish following the back-translation procedure (see last column in Table 1). Two bilingual experts participated in this procedure until they reached a final agreement.
In summary, the systematic review identified the work-related events most frequently associated with the activation of attributions; each ASWQ item was derived from these events, ensuring that the instrument adequately samples the universe of attributionally relevant situations.
Study 2: Internal Validity of the ASWQ
Method
Participants
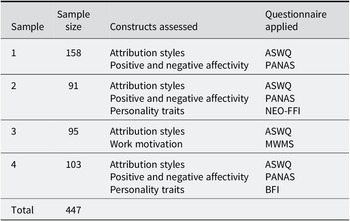
To obtain a large sample, we planned data collection in different waves (see Table 2). Snowball sampling was conducted starting from initial researchers’ contacts, through face-to-face interactions, and utilizing professional social networks. Informed consent was obtained from all participants included in the study. All procedures were performed in accordance with the ethical standards of the Institutional Review Board (University of Barcelona) reference IRB00003099. A total of 447 workers in Spain participated in this second study. In all, 57.5% were women (0.7% preferred not to indicate and 0.2% indicated “others”), with an average age of 31.07 years (SD = 13.01). On average, they worked 29.37 hours per week (SD = 16.09) and belonged to different sectors, such as service and retail workers (26.8%), medium-level technicians and professionals (15.5%), scientific and intellectual professionals (9.3%), or administrative support staff (4.4%) to mention the most frequent (the 23.3% did not report this information).
Samples of participants collected and constructs assessed (Studies 2 and 4)

Table 2. Long description
Column headers from left to right are Sample, Sample size, Constructs assessed, and Questionnaire applied. Row 1 shows sample 1 with 158 participants, constructs assessed are Attribution styles and Positive and negative affectivity, questionnaires are ASWQ and PANAS. Row 2 lists sample 2 with 91 participants, constructs are Attribution styles, Positive and negative affectivity, and Personality traits, questionnaires are ASWQ, PANAS, and NEO-FFI. Row 3 details sample 3 with 95 participants, constructs are Attribution styles and Work motivation, questionnaires are ASWQ and MWMS. Row 4 presents sample 4 with 103 participants, constructs are Attribution styles, Positive and negative affectivity, and Personality traits, questionnaires are ASWQ, PANAS, and BFI. The final row totals 447 participants. Each construct and questionnaire is listed exactly as labeled in the table.
Measures
The questionnaire consisting of 16 Spanish items, previously developed in Study 1, was applied. It is included in the Appendix. The work situations included in the ASWQ are used as standardized eliciting contexts. The construct being measured is attributional style, defined as the stable tendencies with which individuals explain different work-related outcomes. Participants were asked to rate their perceptions (5-point Likert scale) of locus of causality over each situation (from internal to external locus), stability (from unstable to stable), and relevance (from not relevant to highly relevant). In other words, for each work event participants provided two independent ratings: one for locus of causality (internal–external) and one for stability (stable–unstable). These responses constitute separate variables, and all factor analyses were conducted independently for each attributional dimension.
The questionnaire would provide different measures of interest: internal causality in negative and positive situations (reversing the original items scores), stability of negative and positive situations, and optimistic and pessimistic attributional styles. The optimistic attributional style means the perception of positive events as being internal and stable, while negative events are considered as external and unstable. On the contrary, the pessimistic attributional style would mean to perceive positive events as external and unstable, while negative events are perceived as internal and stable.
Data Analysis
Descriptive and correlational analyses were applied. Following usual practices at this point (e.g., Kline, Reference Kline2016), we randomly divided the sample into two to apply EFA with the first subsample (n = 223) and confirmatory factor analysis (CFA) with the second subsample (n = 224). In both cases, the sample sizes are adequate for applying factorial procedures (see Muñiz & Fonseca-Pedrero, Reference Muñiz and Fonseca-Pedrero2019). Applying the EFA, we followed the recommendations of Revelle (Reference Revelle2024) using minimum residual as the extraction method, based on polychoric correlations and parallel analysis. Considering the theoretical dimensions of locus of causality and stability jointly with the fact that these dimensions could refer to positive or negative situations, we also explore a two-factor solution, for positive and negative situations, in each of the theoretical dimensions that can be related (Oblimin rotation method). All analyses were performed using R (2023) by means of different packages (e.g., psych, lavaan; at the repository https://osf.io/dzhmj/?view_only=7d3b6076ece8421796b7c6725aee7848 can be found the dataset and script used in the analysis reported in this article).
Results
All the 16 situations were considered relevant to the participants (M = 3.90, range = 3.51–4.35). This single result is important because, as mentioned earlier, attributions occur when events are considered pertinent. Consequently, this constitutes evidence on the suitability of the events derived from the conducted systematic review. Thus, the situations proposed in the questionnaire are relevant for activating attribution mechanisms among employees.
A simple exploratory data analysis suggests removing item 10 (“You had an unfair change in working conditions”) with respect to causality due to its small variability (Md = 5, mad = 0). The full table of correlations among all items can be seen in the Supplementary Material. The pattern of correlations also suggests removing items 12 and 15 due to anomalous expected behavior (i.e., they do not positively correlate with the items 3, 6, and 9 about positive situations). This decision of removing three items was based on empirical diagnostics (lack of variability and inconsistent inter-item correlations) and aimed to ensure that all retained items represented coherent and discriminative indicators of the intended constructs.
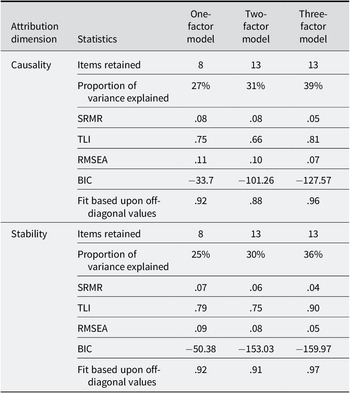
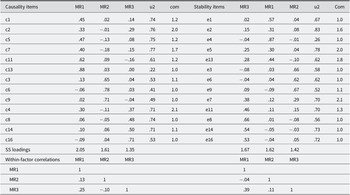
Table 3 shows the comparison of the different factorial models studied once they have been refined (i.e., removing items with factor loadings <.30). The one-factor model considers a one-factor solution. The two-factor model is the model proposed theoretically, distinguishing between positive and negative situations. The three-factor model is proposed empirically following the parallel analysis. For example, for causality, the three-factor model keeps the positive situations (items 3, 6, and 9) in one factor and divides into two the negative ones: the first regarding negative achievement/recognition (items 13, 11, 5, 1, and 7), and the second about negative role/task assignments (items 16, 14, 8, and 4). Considering the different statistical criteria, the three-factor model shows the best fit. This final three-factor solution can be found in Table 4. This solution suggests that we should distinguish between responses to positive situations (e.g., item 3: “You successfully complete a task”) and responses to negative situations regarding achievement/recognition (e.g., item 13: “You receive a negative performance evaluation”) and regarding role/task assignment (e.g. item 16: “You had to deal with conflicting expectations from different people”). A three-factor solution can also be found as the best in the case of stability items. In this case, the distinction is once again related to positive (factor 2) and negative situations (factors 1 and 3), with factor 1 related to achievement/recognition and factor 3 with role/tasks. Furthermore, the relationship between the extracted factors suggests a positive relationship between factors 1 and 3 (r = .25 and .39 for causality and stability, respectively), both of which consider negative situations.
EFA: Comparison of different models (Study 2)

Table 3. Long description
The table has two main sections, causality and stability, each with seven statistical rows. For causality, the one-factor model retains 8 items, explains 27 percent variance, S R M R is point zero eight, T L I is point seven five, R M S E A is point one one, B I C is negative thirty-three point seven, and fit based on off-diagonal values is point nine two. The two-factor model retains 13 items, explains 31 percent variance, S R M R is point zero eight, T L I is point six six, R M S E A is point one zero, B I C is negative one hundred one point two six, and fit is point eight eight. The three-factor model retains 13 items, explains 39 percent variance, S R M R is point zero five, T L I is point eight one, R M S E A is point zero seven, B I C is negative one hundred twenty-seven point five seven, and fit is point nine six. For stability, the one-factor model retains 8 items, explains 25 percent variance, S R M R is point zero seven, T L I is point seven nine, R M S E A is point zero nine, B I C is negative fifty point three eight, and fit is point nine two. The two-factor model retains 13 items, explains 30 percent variance, S R M R is point zero six, T L I is point seven five, R M S E A is point zero eight, B I C is negative one hundred fifty-three point zero three, and fit is point nine one. The three-factor model retains 13 items, explains 36 percent variance, S R M R is point zero four, T L I is point nine zero, R M S E A is point zero five, B I C is negative one hundred fifty-nine point nine seven, and fit is point nine seven. Sample size N equals two hundred twenty-three.
Note: N = 223.
Final solution of three-factor for causality and stability (Study 2)

Table 4. Long description
The table is divided into two main sections: causality items on the left and stability items on the right. For causality, each row lists an item (c1, c2, c5, c7, c11, c13, c3, c6, c9, c4, c8, c14, c16) with columns for MR1, MR2, MR3, u2, and com. For example, c1 has MR1 0.45, MR2 0.02, MR3 0.14, u2 0.74, com 1.2. Stability items (e1, e2, e4, e5, e13, e3, e6, e9, e7, e11, e8, e14, e16) are paired in the same row, with columns MR3, MR1, MR2, u2, and Com. For example, e1 has MR3 0.02, MR1 0.57, MR2 0.04, u2 0.67, Com 1.0. At the bottom, SS loadings are given for each factor: causality MR1 2.05, MR2 1.61, MR3 1.35; stability MR3 1.67, MR1 1.62, MR2 1.42. The final rows show within-factor correlations for MR1, MR2, and MR3, with values such as causality MR1 to MR2 0.13, MR1 to MR3 0.25, MR2 to MR3 -0.10; stability MR1 to MR2 -0.04, MR1 to MR3 0.39, MR2 to MR3 0.11. The table note states N equals 224, MR1, MR2, and MR3 are factor loadings, u2 are unicities, and com are complexities.
Note: N = 224; MR1, MR2, and MR3 show the factor loadings; u2 show unicities; com show complexities.
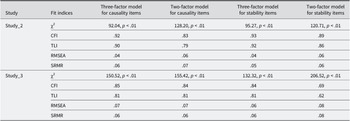
The CFA results with the second subsample (n = 224) can be found in Table 5 (upper section). The three-factor model shows better fit indices, in both cases of causality and stability items. These results would support the idea of retaining it as the best model. Path diagram representations of this model can be found in Supplementary Figures S1 and S2.
CFA fit indices with models of three- and two-factor (Studies 2 and 3)

Table 5. Long description
The table has two main sections for Study 2 and Study 3. Each section lists fit indices vertically: chi-squared, C F I, T L I, R M S E A, and S R M R. Columns from left to right are: three-factor model for causality items, two-factor model for causality items, three-factor model for stability items, and two-factor model for stability items. For Study 2: chi-squared values are 92.04, p less than .01; 128.20, p less than .01; 95.27, p less than .01; 120.71, p less than .01. C F I values are .92, .83, .93, .89. T L I values are .90, .79, .92, .86. R M S E A values are .04, .06, .04, .06. S R M R values are .06, .07, .05, .06. For Study 3: chi-squared values are 150.52, p less than .01; 155.42, p less than .01; 132.32, p less than .01; 206.52, p less than .01. C F I values are .85, .84, .84, .69. T L I values are .81, .81, .81, .62. R M S E A values are .07, .07, .06, .08. S R M R values are .06, .06, .06, .08. Sample sizes are N equals 224 and 341.
Note: N = 224 and 341.
Considering the multidimensional structure identified in previous factorial procedures, reliability was calculated using the omega statistic. This statistic represents a clear advantage in comparison with the classic alpha under these conditions of item multidimensionality (Revelle, Reference Revelle2024). The results were satisfactory in both cases: 0.73 for causality and 0.77 for stability, indicating that the scores proposed by ASWQ would be reliable.
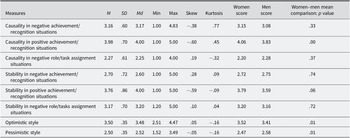
In Table 6, we present descriptive results of the scores obtained from ASWQ. We also examined possible gender differences. Results showed that women displayed slightly higher internal causality in positive situations and higher optimism scores than men. These effects, however, were opposite to our expectations (H7) and small in magnitude.
Descriptives of the main measures of ASWQ (Study 2)

Table 6. Long description
The table contains nine rows for ASWQ measures: Causality in negative achievement/recognition situations, Causality in positive achievement/recognition situations, Causality in negative role/task assignment situations, Stability in negative achievement/recognition situations, Stability in positive achievement/recognition situations, Stability in negative role/tasks assignment situations, Optimistic style, and Pessimistic style. Columns, from left to right, are: Measures, M (mean), S D (standard deviation), M d (median), Min (minimum), Max (maximum), Skew, Kurtosis, Women score, Men score, and Women–men mean comparison p value. For example, for Causality in negative achievement/recognition situations, M is 3.16, S D is 0.60, M d is 3.17, Min is 1.00, Max is 4.83, Skew is minus 0.38, Kurtosis is 0.77, Women score is 3.15, Men score is 3.08, and p value is 0.33. For Causality in positive achievement/recognition situations, M is 3.98, S D is 0.70, M d is 4.00, Min is 1.00, Max is 5.00, Skew is minus 0.60, Kurtosis is 0.45, Women score is 4.06, Men score is 3.83, and p value is 0.00. For Causality in negative role/task assignment situations, M is 2.27, S D is 0.61, M d is 2.25, Min is 1.00, Max is 4.00, Skew is 0.19, Kurtosis is minus 0.32, Women score is 2.20, Men score is 2.28, and p value is 0.37. For Stability in negative achievement/recognition situations, M is 2.70, S D is 0.72, M d is 2.60, Min is 1.00, Max is 5.00, Skew is 0.28, Kurtosis is 0.09, Women score is 2.72, Men score is 2.75, and p value is 0.74. For Stability in positive achievement/recognition situations, M is 3.76, S D is 0.86, M d is 4.00, Min is 1.00, Max is 5.00, Skew is minus 0.59, Kurtosis is minus 0.09, Women score is 3.79, Men score is 3.59, and p value is 0.06. For Stability in negative role/tasks assignment situations, M is 3.17, S D is 0.70, M d is 3.20, Min is 1.20, Max is 5.00, Skew is 0.10, Kurtosis is 0.04, Women score is 3.20, Men score is 3.16, and p value is 0.72. For Optimistic style, M is 3.50, S D is 0.35, M d is 3.48, Min is 2.51, Max is 4.47, Skew is 0.05, Kurtosis is minus 0.16, Women score is 3.52, Men score is 3.41, and p value is 0.01. For Pessimistic style, M is 2.50, S D is 0.35, M d is 2.52, Min is 1.52, Max is 3.49, Skew is minus 0.05, Kurtosis is minus 0.16, Women score is 2.47, Men score is 2.58, and p value is 0.01. The sample size is N equals 447.
Note: N = 447.
Study 3: Replication in an Italian Sample
Method
Participants
In this study, 342 workers in Italy participated. Snowball sampling was again used. In all, 64% were women (0.6% preferred not to indicate gender), with an average age of 37 years (SD = 13.28) and 39.97 hours worked a week on average (SD = 28.74). Participants belonged to sectors such as medium-level technicians and professionals (15.6%), administrative support staff (14.4%), scientific and intellectual professionals (11.9%), or craftsmen, skilled workers, and other trades (7.3%), to mention the most frequent (the 4.1% did not report this information).
Measures
The ASWQ was translated to Italian after the back-translation process with two native Spanish and Italian speakers following the International Test Commission guidelines. The original 16-item ASWQ was utilized. Given the existing similarity between the Spanish and Italian languages, agreement was easily reached between translators without significant discrepancies.
Data Analysis
Descriptive and correlational procedures were applied. CFA was also applied comparing 3-factor and 2-factor solutions discussed in Study 2.
Results
All items were rated as relevant (M = 3.68, range = 3.41–4.04). The full correlation matrix among causality and stability items can be found in the Supplementary Material. The CFA results are shown in Table 5 (lower section). Again, the three-factor solution presents the best fit indices. In addition, we conducted a multigroup CFA to examine measurement invariance across the Spanish and Italian samples. These analyses supported configural and metric invariance, and partial scalar invariance after freeing a small set of intercepts (see Supplementary Material, Section 3.7), indicating that the internal structure of the ASWQ is largely comparable across these two countries. Model comparisons followed widely recommended cutoff criteria (i.e., ΔCFI ≤.010, ΔRMSEA ≤.015, and ΔSRMR ≤.030 for metric invariance and ≤.010 for scalar invariance), suggesting that increasingly constrained models did not present a meaningful deterioration in fit.
The reliability of the causality and stability scores were 0.75 and 0.70, respectively. In this sample, no significant gender differences were observed in ASWQ dimensions or in overall attributional styles. Taken together with previous results in Study 2, these findings suggest that gender effects were inconsistent across samples and should be interpreted with caution.
Study 4: Criterion-Related Validity: Attributional Styles at Work and Other Dispositions
Method
Participants
The sample is the same as previously presented in Study 2. As indicated in Table 2, in the different waves that make up the full sample of participants, we applied other tools to measure other dispositions potentially related to attributions.
Measures
Attributional styles. The ASWQ developed in Study 1 was used. It comprises 16 items that measure the locus of causality and stability across various positive and negative situations, thus providing a measure of optimism and pessimism as attributional styles.
Positive and negative affectivity. The PANAS (Watson et al., Reference Watson, Clark and Tellegen1988) was considered in samples 1, 2, and 4 (see Table 2). The Spanish version by López-Gómez et al. (Reference López-Gómez, Hervás and Vázquez2015) was applied. As in the original, it has the heading “How have you felt in the last month, including today?” and 20 items (e.g., “Interested in things,” “Distressed”) with a 5-point Likert scale from “not at all or very slightly” to “a lot.” The scores obtained showed adequate reliability values considering the three different samples: omega values equal to 0.85, 0.92, and 0.91 for positive affectivity and 0.86, 0.88, and 0.86 for negative affectivity.
Personality traits. NEO-FFI (Costa & McCrae, Reference Costa, McCrae, Boyle, Matthews and Saklofske2008) was applied in its Spanish version (Cordero et al., Reference Cordero, Pamos and Seisdedos2008) to measure the big-five factor of personality in sample 2 (see Table 2). It counts 60 items with a 5-point option from “completely disagree” to “completely agree.” The scores obtained showed adequate reliability values: neuroticism (ω = .89), extraversion (ω = .84), openness (ω = .83), agreeableness (ω = .67), and conscientiousness (ω = .85).
Additionally, we used the BFI-2 (Gallardo-Pujol et al., Reference Gallardo-Pujol, Rouco, Cortijos-Bernabeu, Oceja, Soto and John2022) in sample 4 considering that it is shorter than NEO-FFI and both assess the same traits. It has 30-items with a 5-point option from “completely disagree” to “completely agree” and has shown consistently its concurrent validity with the NEO-FFI (see Gallardo-Pujol et al., Reference Gallardo-Pujol, Rouco, Cortijos-Bernabeu, Oceja, Soto and John2022). Again, the scores obtained showed adequate reliability values: neuroticism (ω = .80), extraversion (ω = .77), openness (ω = .75), agreeableness (ω = .62), and conscientiousness (ω = .78).
Work motivation. The Multidimensional Work Motivation Scale (MWMS; Gagné et al., Reference Gagné, Forest, Vansteenkiste, Crevier-Braud, Van den Broeck, Aspeli, Bellerose, Benabou, Chemolli, Güntert, Halvari, Indiyastuti, Johnson, Molstad, Naudin, Ndao, Olafsen, Roussel, Wang and Westbye2015) was applied in sample 3 (see Table 2) to measure different types of motivation in a Spanish version (Navarro, Reference Navarro2024) created ad hoc for this research and following the traditional procedure (i.e., back-translation). With the heading “Why do you make an effort or would you make an effort in your current job?,” it has 19 items with a 5-point option from “completely disagree” to “completely agree.” The scores obtained showed adequate reliability values: amotivation (ω = .90), extrinsic social regulation (ω = .85), extrinsic material regulation (ω = .66), introjected regulation (ω = .82), identified regulation (ω = .85), and intrinsic motivation (ω = .91).
Data Analysis
Correlational procedures were applied to study the association among all measures. To assess potential common method bias arising from the use of self-report measures, we conducted additional analyses (see Supplementary Material, Section 3.15). Both a Harman’s single-factor test and a comparison between single-factor and theoretical CFA models indicated that common method variance was not a major concern.
Results
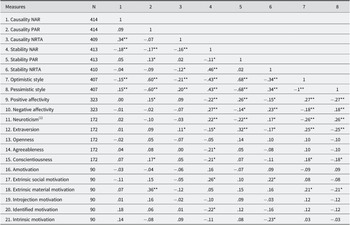
Correlations among the different ASWQ scores and the rest of the measures are presented in Table 7. In the Supplementary Material, we present the full matrix correlations among all the measures. Although the correlations between ASWQ dimensions and the rest of the measures were of weak-to-moderate magnitude, this pattern aligns with meta-analytic evidence showing that effect sizes of this range are typical for associations among dispositional traits and affective–motivational constructs (Gignac & Szodorai, Reference Gignac and Szodorai2016).
Correlations among ASWQ scores and the rest of the measures (Study 4)

Table 7. Long description
The table lists 21 measures in the leftmost column, including Causality NAR, Causality PAR, Causality NRTA, Stability NAR, Stability PAR, Stability NRTA, Optimistic style, Pessimistic style, Positive affectivity, Negative affectivity, Neuroticism, Extraversion, Openness, Agreeableness, Conscientiousness, Amotivation, Extrinsic social motivation, Extrinsic material motivation, Introjection motivation, Identified motivation, and Intrinsic motivation. Each row begins with the measure name and sample size, followed by correlation coefficients with other measures, arranged left to right. Diagonal cells are all 1. Significant correlations are marked with a single asterisk for p less than .05 and double asterisks for p less than .01. For example, Causality NAR and Causality NRTA have a correlation of .34 double asterisk, indicating a strong positive relationship at p less than .01. Optimistic style and Pessimistic style show a strong negative correlation of minus .60 double asterisk. Stability NAR and Stability NRTA have a correlation of .46 double asterisk. Positive affectivity and Negative affectivity are negatively correlated at minus .27 double asterisk. Personality traits such as Neuroticism, Extraversion, Openness, Agreeableness, and Conscientiousness are included, with their respective correlations to other variables. Motivation measures are listed last, with generally weaker correlations. The table footnote explains abbreviations: NAR, PAR, and NRTA refer to negative achievement/recognition, positive achievement/recognition, and negative role/task assignments. Asterisks indicate significance levels.
Note: N = 447; NAR, PAR, and NRTA reflect the factorial dimensions obtained in the study, referring to “negative achievement/recognition situations,” “positive achievement/recognition situations,” and “negative role/task assignments”; *p < .05; **p < .01. (1)As personality measures were collected using two different measurement tools, NEO-FFI and BFI, we present in the Supplementary Material the correlation analysis separately for each sample founding equivalent results.
Importantly, the direction and theoretical coherence of these relationships provide meaningful support for the construct validity of the ASWQ. As we initially expected, optimistic style is related to positive affectivity (r = .27, p < .01), extraversion (r = .25, p < .01), and some forms of motivation (extrinsic-material, r = .21), to mention the most relevant associations. Similarly, pessimistic style is related to negative affectivity (r = .18, p < .01) and neuroticism (r = .26, p < .01), among the most notable findings. This correlation analysis reveals other interesting results that warrant emphasis. Specifically, regarding the dimensions used to construct measures of attributional styles (i.e., causality and stability), it is observed that causality in positive achievement/recognition situations is clearly associated with extrinsic-material motivation (r = .36, p < .01) and stability in negative achievement/recognition situations is related with some forms of motivation (extrinsic-social motivation, r = .26, p < .05; and identified motivation, r = −.22, p < .05) and negatively with other personality traits (agreeableness, r = −.21, p < .05; and conscientiousness, r = −.21, p < .05).
Discussion
The present research aimed to develop and validate a new measure of attributional styles in the workplace, the ASWQ, which addresses limitations of existing tools and expands our understanding of how attributions relate to other individual dispositions. Our findings provide strong support for the reliability and validity of the ASWQ scores in different samples and offer insight into the structure of work-related attributions and their nomological network.
Structure of Work-Related Attributions
One of the most notable findings in this research is the emergence of a three-factor structure for both causality and stability dimensions of attributions, which was consistently supported by EFA and CFA in two culturally distinct samples (Spain and Italy). This structure distinguishes between attributions related to positive achievement/recognition situations, negative achievement/recognition situations, and negative role/task assignments. Such differentiation advances our theoretical understanding of attributions by suggesting that workers do not simply dichotomize events as positive or negative, but also distinguish between different domains of negative experiences. Although the three-factor solution was empirically derived, the factors map onto theoretically meaningful distinctions: a domain of positive outcomes, and two conceptually distinct domains of negative events—one more interpersonal/role-oriented and another more performance or competence oriented. Prior attribution research (e.g., Harvey & Martinko, Reference Harvey, Martinko and Borkowski2009) has shown that attributional tendencies vary by event valence and domain, which is consistent with this structure. This differentiation also supports the well-known negativity bias hypothesis (e.g., Baumeister et al., Reference Baumeister, Bratslavsky, Finkenauer and Vohs2001) in attribution processes, according to which these explanatory mechanisms are more easily activated in response to negative situations compared to positive ones.
The separation of negative achievement/recognition from negative role/task assignments is particularly intriguing. It implies that how individuals explain unfavorable outcomes may depend on whether those outcomes pertain to their performance and its evaluation (e.g., making a mistake, receiving criticism) or to the nature and expectations of their working role (e.g., undesired assignments, conflicting demands). This nuance could have important implications for interventions aimed at fostering more adaptive attributional styles, as strategies may need to be tailored to specific types of workplace challenges.
Furthermore, the moderate correlations found between factors related to negative situations (for both causality and stability) suggest some commonality in how individuals attribute different types of adverse events. However, the lack of strong correlations indicates that these attributions are not interchangeable, further supporting the value of a multidimensional conceptualization of work-related attributions.
Attributional Styles and Individual Dispositions
Our investigation of the nomological network of attributional styles yielded several noteworthy findings. In line with our hypotheses, we found that the optimistic attributional style was positively related to positive affectivity (H2) and extraversion (H4), while the pessimistic attributional style was positively associated with negative affectivity (H1) and neuroticism (H3). These results are consistent with previous research linking attributional styles to affective dispositions and personality traits (Cheng & Furnham, Reference Cheng and Furnham2001; Martinko et al., Reference Martinko, Douglas and Harvey2006), which extends such findings to the specific context of work-related attributions.
The observed relationships provide construct validity for the ASWQ and suggest that attributional styles may be part of broader tendencies in how individuals experience and react to their working environment. For instance, the association between optimism and extraversion could reflect a general orientation toward engaging with work in a positive, approach-oriented manner. Similarly, the link between pessimism and neuroticism may indicate a pervasive sensitivity to negative stimuli that manifests in both emotional reactivity and cognitive interpretations of working events. From a pragmatic perspective, the ASWQ may have potential value for human resource practices such as personnel selection and development. However, its applied usefulness remains to be tested empirically. Future studies should examine whether attributional styles assessed with the ASWQ add incremental value in real organizational decisions.
Regarding motivation, these findings should be interpreted with caution because this analysis was conducted on the smallest subsample of the study (N = 95), which limits the statistical power to detect effects of small-to-moderate magnitude. With this caveat in mind, the results only partially supported our hypotheses. We did not find the expected positive association between pessimistic style and amotivation (H5); instead, pessimism showed a negative correlation with extrinsic material motivation. One possible explanation is that individuals who interpret positive outcomes as externally caused and unstable, and negative outcomes as internally caused and difficult to change, may feel less agency over externally controlled rewards and, therefore, show reduced extrinsic motivation. Conversely, the optimistic style was associated only with extrinsic material motivation and not with more autonomous forms of motivation, contrary to H6. This pattern suggests that the links between attributional tendencies and motivational orientations may be more nuanced than originally anticipated. Future research using larger samples could clarify under which conditions optimistic and pessimistic styles relate to different motivational drivers and whether contextual factors moderate these associations.
Gender Differences in Attributional Styles
Although some gender differences emerged in Study 2, they were small, and not replicated in Study 3. This inconsistency suggests that gender-related effects on attributional styles may be sample specific or moderated by contextual factors such as culture or occupational composition. Therefore, conclusions regarding gender should remain tentative until supported by replication in larger, cross-cultural studies. Moreover, our results from Study 2 contradicts our hypothesis (H7) and challenges some previous literature suggesting that women may have a weaker self-serving attributional bias than men (Martinko et al., Reference Martinko, Douglas and Harvey2006). Several factors could contribute to this discrepancy. For example, the higher optimism observed among women could also reflect broader social changes in recent years, such as increased awareness of gender biases and efforts to empower women in the workplace. Given the current context of egalitarian practices in several organizations, more research is needed to understand the robustness and underlying mechanisms of these gender differences in work-related attributional styles.
Advantages of the ASWQ
The development and validation of the ASWQ address several limitations of existing measures and offer distinct advantages for assessing attributions in organizational contexts. We will focus on the main issues. First, the ASWQ has a work-specific focus. Unlike tools with clinical origins (e.g., ASQ) or those using generic hypothetical scenarios (e.g., ASQ, OASQ), the ASWQ items are grounded in common, relevant work situations identified through a systematic review and highly rated by employees in our samples. This enhances the ecological validity of the measure and its relevance for understanding workplace behavior. This also addresses critiques of previous measures that included situations without assessing their significance to respondents (Peterson et al., Reference Peterson, Semmel, von Baeyer, Abramson, Metalsky and Seligman1982; Proudfoot et al., Reference Proudfoot, Corr, Guest and Gray2001). Second, the ASWQ has shown parsimonious dimensionality. Considering previous studies (e.g., Harvey et al., Reference Harvey, Madison, Martinko, Crook and Crook2014), we have focused on causality and stability as the basic dimensions for assessing attributional styles. Additionally, while capturing nuanced differences in types of work situations, the ASWQ retains a manageable number of factors (three each for causality and stability). This balance between comprehensiveness and parsimony facilitates both practical use and theoretical interpretation. Third, the ASWQ integrates positive and negative events. By incorporating favorable and unfavorable situations, the ASWQ enables the evaluation of optimistic and pessimistic styles covering the full range of workplace experiences. This integrated approach may provide a more holistic view of an individual’s attributional tendencies than examining positive and negative events in isolation. Fourth, the ASWQ has shown psychometric properties meeting established psychometric standards. Across multiple samples and two cultural contexts, the ASWQ scores demonstrated good reliability in their scores and a stable factor structure. And fifth, the ASWQ provides dispositional dimensions linked to well-established constructs. The observed relationships between the ASWQ scores and measures of affectivity and personality support the instrument’s construct validity and situate attributional styles within the broader network of individual differences relevant to organizational behavior.
Limitations and Future Directions
Despite its contributions, this research also has limitations. First, while we sampled workers from various sectors in Spain and Italy, the sample was obtained through a nonprobabilistic (i.e., snowball sampling) procedure, which limits the generalizability of the results despite the heterogeneity achieved in terms of gender, job experience, and occupational sectors. Future studies should replicate these findings using random or stratified organizational samples to strengthen external validity. Moreover, because the Spanish and Italian subsamples were not collected with the aim of conducting formal cross-cultural validation, we did not test measurement invariance across countries. As a result, the present findings cannot be taken as evidence of cross-cultural equivalence. Future research with larger and more balanced cross-national samples should examine configural, metric, and scalar invariance to determine whether the ASWQ operates similarly across cultural contexts. Finally, cross-validation of the ASWQ in other countries and cultural contexts is necessary to further establish its generalizability. Second, a further limitation concerns the absence of test–retest reliability evidence. Although attributional styles are theoretically conceptualized as relatively stable dispositions, we did not evaluate their temporal consistency in the present studies. Prior research on attributional measures suggests only moderate levels of stability across time (e.g., Peterson et al., Reference Peterson, Semmel, von Baeyer, Abramson, Metalsky and Seligman1982), and empirical data on long-term consistency—particularly in organizational settings—remain limited. Consequently, the extent to which the ASWQ captures stable individual tendencies versus context-sensitive attributions cannot be fully determined based on the current data. Future research should therefore incorporate repeated assessments to directly examine the test–retest reliability and temporal invariance of the ASWQ. Third, although we assessed several theoretically relevant constructs, we did not examine behavioral outcomes such as job performance or turnover intentions. Future research should investigate the ASWQ relationship with these variables to establish its criterion-related validity and practical significance for organizations. Exploring how attributional styles influence motivation and, consequently, performance would be particularly valuable, given that motivation is a key determinant of work outcomes. Fourth, while the ASWQ offers an improvement over the use of hypothetical scenarios, it still relies on generalized work situations rather than specific idiographic events for each respondent. Experience sampling or critical incident techniques could complement the ASWQ. Fifth, another limitation of our study is the absence of a direct incremental validity analysis comparing our new instrument with existing scales. Although resource constraints and concerns about participant fatigue led us to opt for a more focused design, future research should rigorously test whether our measure provides additional explanatory power beyond that of existing measures when predicting key work-related outcomes. Moreover, the present version of the ASWQ operationalized only two attributional dimensions—locus and stability—which we selected because prior evidence indicates they are the most salient and predictive in work settings. Future research should examine whether incorporating the remaining classical dimensions, controllability and globality, enhances explanatory scope or captures additional variance in affective and motivational processes. Sixth and finally, our unexpected findings regarding gender and attribution highlight the need for more nuanced theoretical models of how attributional styles operate in the workplace that incorporate a gender lens. Qualitative research exploring how men and women narratively construct the causes of their successes and failures could enrich our understanding of attributional content beyond the dimensions assessed by the ASWQ.
Conclusion
The present research introduces the ASWQ as a reliable tool for assessing how individuals explain workplace events. Importantly, the ASWQ was developed following standardized procedures and provides evidence of content validity (i.e., through a systematic review), internal validity (i.e., via standard factorial analyses), and criterion validity (i.e., through associations with other personal dispositions). Our results support the ASWQ’s scores reliability and validity, advancing attribution theory by revealing a more nuanced structure of work-related attributions. The distinct relationships between attributional styles and affective, personality, and motivational traits highlight the importance of studying attributions to understand employee behavior. These attributions can influence on other individual behaviors such as experienced emotions or work motivation, as originally proposed by attribution theories. Understanding how workers interpret their experiences is critical as organizations face complex environments. Beyond the objective conditions of work, attribution theory reminds us of the importance of the meaning that workers create about these conditions, something that the ASWQ helps us to understand.
Supplementary material
To view supplementary material for this article, please visit http://doi.org/10.1017/SJP.2026.10030.
Data availability statement
Open data, analysis code, and Supplementary Materials: The information needed to reproduce all the reported results and Supplementary Materials are available at OSF: https://osf.io/dzhmj/?view_only=7d3b6076ece8421796b7c6725aee7848.
Acknowledgement
We thank Eric Rosa and Carlos Le Sausse for their help in collecting part of the samples in Study 2, and to Alessandra Poiatti for her data collection in Study 3.
Author contribution
Conceptualization, Funding acquisition, Project administration: J.N., R.R.L.; Data curation, Formal analysis, Software: J.N., R.E., F.V.; Investigation, Resources, Writing—review and editing: J.N., R.R.L., R.E., F.V.; Methodology, Validation, Writing—original draft: J.N.; Visualization: J.N., R.E.
Funding statement
J.N. and R.R.L. received financial support from the Spanish Ministerio de Ciencia e Innovación (PID2020-120148GB-I00/AEI/10.13039/501100011033).
Competing interests
The authors declare none.
Appendix: Attribution Style at Work Questionnaire (ASWQ)
Spanish Version
Imagina la siguiente situación …
*1. Recibes comentarios inapropiados (de un compañero, de tu jefe, etc.), sobre la calidad de tu trabajo.
*2. Tienes dificultades para recibir feedback (retroalimentación) de tus supervisores.
*3. Completas satisfactoriamente una tarea.
*4. Recibes críticas injustas (por parte de un cliente, de tu jefe, etc.)
*5. Trabajas en una organización burocrática y, a menudo, tienes dificultades para acabar bien tus tareas.
*6. Recibes un feedback positivo sobre tu trabajo.
*7. Tienes que quedarte tiempo extra para finalizar tu trabajo.
*8. Se te asignan tareas y proyectos que no deseas.
*9. Recibes una felicitación (de un cliente, de tu jefe, etc.)
10. Tienes cambios injustos en las condiciones laborales.
*11. Cometes errores o te preocupas porque los puedas cometer.
12. Una nueva política de empresa es introducida de manera justa.
*13. Recibes una evaluación negativa sobre tu desempeño.
*14. Tienes que actuar sin conocer exactamente qué se espera de ti.
15. Te sientes implicado en las decisiones que se toman en tu trabajo.
*16. Tienes que manejar expectativas incompatibles de diferentes personas.
¿A qué consideras que podría deberse dicha situación?
(1) Totalmente debida a mí (5) Totalmente debida a otras personas o circunstancias
Esta situación, ¿es frecuente y probable que se repita en el futuro?
(1) Nada probable que se repita 5) Muy probable que se repita
¿Cuán relevante consideras, en general, esta situación?
(1) Nada relevante en mi trabajo (5) Muy relevante en mi trabajo
*Items recogidos en la versión final del cuestionario.
Attribution Style at Work Questionnaire (ASWQ)
English Version
Imagine the following situation …
*1. You receive inappropriate feedback (from a coworker, from your boss, etc.) about the quality of your work.
*2. You have difficulty receiving feedback from your supervisors.
*3. You successfully complete a task.
*4. You receive unfair criticism (by a customer, your boss, etc.).
*5. You work at a bureaucratic organization and you often have difficulty completing tasks.
*6. You receive positive feedback about your work.
*7. You have to stay for extra hours to complete your work.
*8. You are assigned tasks or projects that you do not desire.
*9. You get a compliment (from a customer, a coworker, your boss, etc.).
10. You had an unfair change in working conditions.
*11. You made a mistake or were concerned over making one.
12. A new company policy is introduced fairly.
*13. You receive a negative performance evaluation.
*14. You had to take action without knowing exactly what was expected of you.
15. You feel involved in the decisions made in your work.
*16. You had to deal with conflicting expectations from different people.
What do you consider might be the cause of this situation?
(1) Entirely due to me (5) Entirely due to other people or circumstances
How likely is it that this situation will occur again in the future?
(1) Not likely to happen again (5) Very likely to happen again
How relevant do you consider this situation to be in general?
(1) Not relevant at all in my work (5) Highly relevant in my work
*Items included in the final version of the questionnaire.
Attribution Style at Work Questionnaire (ASWQ)
Italian Version
Immagina ciascuna delle situazioni e rispondi a due brevi domande su di esse.
*1. Ricevi commenti inappropriati (da colleghi, dal capo,…) sulla qualità del tuo.
lavoro.
*2. Hai difficoltà a ricevere feedback dai tuoi supervisori.
*3. Completi in modo soddisfacente un compito.
*4. Ricevi critiche ingiuste (da un cliente, dal capo,…).
*5. Lavori in una organizzazione burocratica e spesso hai difficoltà a completare.
bene il tuo lavoro.
*6. Ricevi un feedback positivo sul tuo lavoro.
*7. Devi trattenerti oltre l’orario previsto per completare il tuo lavoro.
*8. Ti vengono assegnati compiti e progetti che non desideri.
*9. Ricevi delle congratulazioni (da un cliente, dal capo,…).
10. Hai subito una modifica ingiusta nelle condizioni lavorative.
*11. Commetti errori e ti preoccupi di poterli commettere.
12. Una nuova politica aziendale è stata introdotta in modo equo.
*13. Ricevi feedback negativi sulla tua performance lavorativa.
*14. Devi agire senza sapere esattamente cosa si aspettano da te.
15. Ti senti coinvolto nelle decisioni che si prendono nel tuo lavoro.
*16. Devi gestire aspettative incompatibili di diverse persone.
A cosa pensi possa essere dovuta tale situazione?
(1) Totalmente dovuta a me (5) Totalmente dovuta ad altre persone o circostanze
Questa situazione è frequente e probabile che si ripeta nel futuro?
(1) Molto improbabile che si ripeta (5) Molto probabile che si ripeta
Quanto consideri rilevante, in generale, questa situazione?
(1) Per niente rilevante nel mio lavoro (5) Molto rilevante nel mio lavoro
*Items raccolti nella versione finale del questionario.
Appendix: R code for the computation of the different attributional dimensions and styles of the ASWQ
InCaus_NAR <- 6-((c13 + c11 + c5 + c1 + c7 + c2)/6).
InCaus_PAR <- 6-((c3 + c6 + c9)/3).
InCaus_NRTA <- 6-((c16 + c14 + c8 + c4)/4).
Stability_NAR <- (e4 + e1 + e13 + e2 + e5)/5.
Stability_PAR <- (e3 + e6 + e9)/3.
Stability_NRTA <- (e8 + e14 + e16 + e11 + e7)/5.
InCaus_Negative_Situations <− 6-((c13 + c11 + c5 + c1 + c7 + c2 + c16 + c14 + c8 + c4)/ 10).
InCaus_Positive_Situations <− 6-((c3 + c6 + c9)/3).
Stability_Negative_Situations <− (e13 + e11 + e5 + e1 + e7 + e2 + e16 + e14 + e8 + e4)/10.
Stability_Positive_Situations <− (e3 + e6 + e9)/3.
Optimistic_style <− (InCaus_Positive_Situations + Stability_Positive_Situations +.
InCaus_Negative_Situations) + (6-Stability_Negative_Situations))/4
Pessimistic_style <− ((6-InCaus_Positive_Situations) + (6-Stability_Positive_Situations) +.
InCaus_Negative_Situations + Stability_Negative_Situations)/4


 Open access

