


Impact Statement
Current high-performance engineering alloys commonly suffer from issues when processed using additive manufacturing methods. These include cracking, porosity, elemental segregation, and anisotropy. The computational method reported here enables the identification of new alloy compositions that have the highest likelihood of simultaneously satisfying a range of target properties, including criteria specific to additive manufacturing. The efficacy of this method is demonstrated with the design of a new alloy more amenable to laser-blown-powder direct-energy-deposition. The method may be readily extended to the optimization of other alloy types and process methods.
1. Introduction
Due to their excellent high-temperature properties, Ni-based superalloys are used extensively in gas-turbine engines (Reed, Reference Reed2006). Through continual development over the last half-a-century, the composition and microstructure of these alloys have been optimized to deliver impressive mechanical and environmental performance at high temperatures (Reed, Tao, & Warnken, Reference Reed, Tao and Warnken2009). As their microstructures intimately control alloy properties (Durand-Charre, Reference Durand-Charre1997; Reed, Reference Reed2006), parallel developments in alloy processing technologies, such as casting and forging, have been made to deliver reliable and reproducible manufacturing routes (DuPont, Lippold, & Kiser, Reference DuPont, Lippold and Kiser2009; Reed, Reference Reed2006). In recent years additive manufacturing (AM) methods have gained increasing interest as they offer potential advantages over contemporary methods (Graybill et al., Reference Graybill, Li, Malawey, Ma, Alvarado-Orozco and Martinez-Franco2018). Specifically, fabrication via AM eliminates the need for fasteners and joiners, reducing component weight. Additionally, these techniques offer greater design freedom and may generate less waste through near-net-shape production of components (Babu et al., Reference Babu, Raghavan, Raplee, Foster, Frederick, Haines, Dinwiddie, Kirka, Plotkowski, Lee and Dehoff2018). This is particularly attractive to the aerospace sector, which is striving for greater efficiency and reduced carbon footprints. AM techniques can also be utilized for component repair applications (Babu et al., Reference Babu, Raghavan, Raplee, Foster, Frederick, Haines, Dinwiddie, Kirka, Plotkowski, Lee and Dehoff2018; Jones et al., Reference Jones, Whittaker, Buckingham, Johnston, Bache and Clark2017; Kumar & Nair, Reference Kumar and Nair2017; Markanday et al., Reference Markanday, Carpenter, Jones, Thompson, Rhodes, Heason and Stone2021; Zhu, Reference Zhu2009) and the uptake of these technologies has been rapid, though numerous challenges have been encountered (Babu et al., Reference Babu, Raghavan, Raplee, Foster, Frederick, Haines, Dinwiddie, Kirka, Plotkowski, Lee and Dehoff2018; Shamsaei, Yadollahi, Bian, & Thompson, Reference Shamsaei, Yadollahi, Bian and Thompson2015; Thompson, Bian, Shamsaei, & Yadollahi, Reference Thompson, Bian, Shamsaei and Yadollahi2015). To address these challenges and help realize commercial applications, extensive research has been carried out into the utilization of AM techniques for the fabrication of Ni-based superalloys (Attallah, Jennings, Wang, & Carter, Reference Attallah, Jennings, Wang and Carter2016; Babu et al., Reference Babu, Raghavan, Raplee, Foster, Frederick, Haines, Dinwiddie, Kirka, Plotkowski, Lee and Dehoff2018; Basak, Acharya, & Das, Reference Basak, Acharya and Das2016; Kappes, Moorthy, Drake, Geerlings, & Stebner, Reference Kappes, Moorthy, Drake, Geerlings and Stebner2018).
The deposition of Ni-based superalloys using additive methods is associated with particular complications (Attallah et al., Reference Attallah, Jennings, Wang and Carter2016; Babu et al., Reference Babu, Raghavan, Raplee, Foster, Frederick, Haines, Dinwiddie, Kirka, Plotkowski, Lee and Dehoff2018; Thompson et al., Reference Thompson, Bian, Shamsaei and Yadollahi2015). These include severe microstructural segregation, which can deteriorate the in-service performance (Attallah et al., Reference Attallah, Jennings, Wang and Carter2016; Thompson et al., Reference Thompson, Bian, Shamsaei and Yadollahi2015). It has been shown that some of these complications can be mitigated through process parameter control and/or post-processing (Babu et al., Reference Babu, Raghavan, Raplee, Foster, Frederick, Haines, Dinwiddie, Kirka, Plotkowski, Lee and Dehoff2018; Helmer, Körner, & Singer, Reference Helmer, Körner and Singer2014; Markanday et al., Reference Markanday, Carpenter, Jones, Thompson, Rhodes, Heason and Stone2021; Messé, Muñoz-Moreno, Illston, Baker, & Stone, Reference Messé, Muñoz-Moreno, Illston, Baker and Stone2018; Sames, Medina, Peter, Babu, & Dehoff, Reference Sames, Medina, Peter, Babu and Dehoff2014). To date, great success has been achieved with the more processable Ni-based superalloys, which typically have a low precipitate volume fraction (~20–25 volume % γ′/ γ″) (Attallah et al., Reference Attallah, Jennings, Wang and Carter2016; Tang et al., Reference Tang, Panwisawas, Ghoussoub, Gong, Clark, Németh, McCartney and Reed2021). Some studies have also reported success with depositing high γ′ containing superalloys, such as IN738LC (~ 55 volume % γ′) (Griffiths et al., Reference Griffiths, Ghasemi Tabasi, Ivas, Maeder, De Luca, Zweiacker, Wróbel, Jhabvala, Logé and Leinenbach2020; Wang et al., Reference Wang, Zhang, Wang, Shen, Zhang, Li and Yan2019). However, many of the reported successes rely on tight control of the process parameters and the use of intense post-processing methods, including hot isostatic pressing (HIP) and complicated heat treatments (Ruttert et al., Reference Ruttert, Ramsperger, Mujica Roncery, Lopez-Galilea, Körner and Theisen2016). For certain applications, it is not be feasible to achieve such fine process control or apply certain post-processing steps. This is certainly the case when utilizing AM for some component repair applications where the use of intense post-processing routes is not possible due to the potential for compromising substrate properties through over-aging (Kumar & Nair, Reference Kumar and Nair2017; Markanday et al., Reference Markanday, Carpenter, Jones, Thompson, Rhodes, Heason and Stone2021).
IN718 and ATI 718Plus® (718 Plus) are loosely related alloy systems, sharing similar operating temperatures, mechanical properties, and excellent processability (Kennedy, Reference Kennedy2005; Zhang et al., Reference Zhang, Yang, Lu, Wei, Meng and Gao2020). Indeed, 718Plus was designed as an improved alternative to IN718 with increased γ′ content through altering the element concentrations including Al, Co, and Fe as well as introducing W. This allows 718Plus to operate at temperatures of approximately 700 °C, whilst maintaining a yield strength around 1100 MPa (Kennedy, Reference Kennedy2005). Critically, both IN718 and 718Plus are highly processable alloy systems due to their relatively low fraction of strengthening precipitates (~20–25 volume % γ′/ γ″) (DuPont et al., Reference DuPont, Lippold and Kiser2009; Kennedy, Reference Kennedy2005) and there has been reported success in the fabrication of these alloys using AM techniques (Jones et al., Reference Jones, Whittaker, Buckingham, Johnston, Bache and Clark2017; Oguntuase, Reference Oguntuase2019). Given the success of these alloys, IN718 and 718Plus are considered excellent foundations from which to design new alloys. However, both alloys have exhibited severe segregation of strengthening elements to the interdendritic region and require annealing prior to precipitation heat-treatment to achieve the best performance. Such intensive post-processing may not be possible in a repair application as the properties of the underlying substrate alloy may be compromised (Bi & Gasser, Reference Bi and Gasser2011; Kumar & Nair, Reference Kumar and Nair2017; Markanday et al., Reference Markanday, Carpenter, Jones, Thompson, Rhodes, Heason and Stone2021). Whilst IN718 can be used without an annealing heat treatment, the persistence of the Laves phase within the microstructure following deposition is undesirable. Therefore, an alloy that possesses similar mechanical properties and processability to IN718, with reduced occurrence of undesired phases is required. To achieve this, further alloy design is needed to identify compositions more amenable to AM processing.
The historical successes of alloy design methodologies are well reported and have utilized several modern frameworks (Conduit, Jones, Stone, & Conduit, Reference Conduit, Jones, Stone and Conduit2017; Reed et al., Reference Reed, Tao and Warnken2009; Saha & Olson, Reference Saha and Olson2007). These include the work by Tancret, Bhadeshia, and Mackay (Tancret & Bhadeshia, Reference Tancret and Bhadeshia2003; Tancret, Bhadeshia, & MacKay, Reference Tancret, Bhadeshia and MacKay2003) and Deschamps et al. (Deschamps, Tancret, Benrabah, De Geuser, & Van Landeghem, Reference Deschamps, Tancret, Benrabah, De Geuser and Van Landeghem2018) that employed a two-stage process, first modeling and selecting mechanical properties and then predicting phase and solidification thermodynamics. In these studies, the authors made use of Gaussian processes and large property databases in their modeling efforts. More recently, the Alloys-by-Design approach (Reed et al., Reference Reed, Tao and Warnken2009; Tang et al., Reference Tang, Panwisawas, Ghoussoub, Gong, Clark, Németh, McCartney and Reed2021) and the probabilistic alloy design framework by Conduit et al. (Conduit et al., Reference Conduit, Illston, Baker, Duggappa, Harding, Stone and Conduit2019; Conduit et al., Reference Conduit, Jones, Stone and Conduit2017) have been used to design alloys specifically for additive manufacturing. The Alloys-by-Design framework relies upon a series of selection criteria and models (Reed et al., Reference Reed, Tao and Warnken2009) and was initially used to design a single crystal Ni-based superalloy. The results obtained from their framework are illustrated in property trade-off diagrams that allow for effective visualization of ideal balances between different properties. These diagrams reflect property relationships and can be used to select areas of optimal design space.
Here we adopt the framework designed by the authors, which was successful in designing several alloys for different applications, to optimize selected Ni-based alloy compositions for AM repair applications (Conduit et al., Reference Conduit, Illston, Baker, Duggappa, Harding, Stone and Conduit2019; Conduit et al., Reference Conduit, Jones, Stone and Conduit2017; Conduit, Jones, Stone, & Conduit, Reference Conduit, Jones, Stone and Conduit2018). The framework offers three key advantages: ability to predict all of the material properties, speed of prediction, and exploitation of property–property relationships to impute missing data:
-
1. To design practical commercial materials, it is essential that all of their properties fulfill the required targets. Neural networks are a generic fitting tool so can predict and explore multi-dimensional design space allowing for simultaneous optimization of a range of properties (Conduit et al., Reference Conduit, Illston, Baker, Duggappa, Harding, Stone and Conduit2019; Conduit et al., Reference Conduit, Jones, Stone and Conduit2017, Reference Conduit, Jones, Stone and Conduit2018).
-
2. To be an effective tool for material design it is crucial that material properties are predicted as quickly as possible. The neural network can predict properties in a μs, whereas computational thermodynamic tools including Thermo-Calc™, Precipi-Calc™, and DICTRA (Andersson, Helander, Höglund, Shi, & Sundman, Reference Andersson, Helander, Höglund, Shi and Sundman2002; Tancret, Reference Tancret2007) may take minutes to make a prediction and a laboratory experiment can take days.
-
3. The neural network developed by the authors was able to learn both composition-property and property–property relationships. An example of a composition-property relationship is the addition of Cr to improve oxidation resistance. Similarly, an example of a property–property relationship is that of γ″/γ′ phase content and yield strength. Exploiting this latter example is especially helpful as there are 16,180 datapoints for γ″/γ′ phase content, which can help impute the gaps for the unknown data for the mere 2,340 known datapoints for yield strength, that are proportional to each other. A further example of a property–property relationship is that of freezing range and solidification strain, which are again proportional. This significant advancement allowed the tool to use well-understood properties to impute those with fewer data, thereby enabling the simultaneous optimization of multiple target properties.
To demonstrate the benefits that may be derived from computational alloy design frameworks, with minimal changes from established alloy compositions, the composition of IN718 was used as the foundation for optimization. The allowed compositional ranges of several elements were altered within the machine learning framework. To bring the predicted alloy in line with 718Plus, the element W was also permitted in the alloy composition, and higher limits were allowed on both Al and Co content. The properties of the new alloy were benchmarked against IN718 to demonstrate performance improvement.
The following section will outline the alloy design framework utilized in this study, specifically the neural network tool. The targets for the desired alloy, designated AM718R, will then be specified. This section will also discuss the optimization of an alloy based around IN718. Experimental results for phase stability (defined as the total volume fraction of desired phases γ, γ′, γ″ and MC carbides at 650 °C, rather than any deleterious phases), cracking resistance, hardness, and oxidation resistance will be presented and verify the performance of the alloy. Finally, to confirm the suitability of the alloy for additive manufacturing a laser pass investigation is used as it offers rapid assessment without the need for powder production and deposition (Zhou N., Reference Zhou, Dicus, Forsik, Wang, Colombo and Epler2020).
2. Methodology
The neural network framework used in this study has been described by Conduit et al. (Conduit et al., Reference Conduit, Illston, Baker, Duggappa, Harding, Stone and Conduit2019; Conduit et al., Reference Conduit, Jones, Stone and Conduit2017). This section outlines the key details of this framework and the utilization of this tool during this study. The stated goal of this framework is the optimization of an alloy composition to yield the material most probable to simultaneously fulfill multiple specified targets. For each property considered in the design framework, the tool uses a predictive model. Crucially, this framework can identify and exploit both composition-property and property–property relationships. This allows the framework to use a large amount of data from one property to extrapolate for a second property that has less available data. In addition, the framework calculates the probability that a designed composition will fulfill a target specification. As such, multi-dimensional design space is searched for the composition with the highest probability of successfully fulfilling the specified targets. For this study, the composition of IN718 was used as a foundation for the explored design space. The composition of 718 Plus was also considered, giving rise to the addition of W in the design space and a greater upper bound to Al and Co content. The ranges for several other elements were also altered and the selected space has been given in Table 1. The selected design space was searched using a random walk with a step size comparable to the accuracy with which the composition could be fabricated, 0.1 wt%. Steps were in a randomly chosen direction in composition space within the bounds of Table 1, the use of Ni as the balance element ensured that the elemental concentration always summed to 100%. Steps were accepted if they improved the probability of the alloy fulfilling the target and rejected if not. Convergence was reached when any improvements in the composition were less than the 0.1 wt% manufacturing tolerance. The neural network typically takes ∼ 1 minute to search for an optimal composition from a set of ∼ 10 design variables. Note that due to the intended AM repair application, any designed system would be limited to heat treatment at a maximum of 720 °C. Additionally, we assume the compositions are homogenous and exclude the possibility of microsegregation.
Composition design space selected for this alloy design framework. Elemental concentration ranges are given in wt%.

2.1. Target alloy
The targets set for this new Ni-based superalloy were based around wrought IN718, with a specific focus on phase stability and compatibility with additive manufacturing repair processes, whilst retaining other properties including strength. The target specifications chosen for this alloy have been given in Table 2. The phase stability target was set at >98 wt. %, thereby limiting the fraction of undesired phases such as the Laves to <2.0 wt%. The target for the percent of strengthening phases was set at ≤ 25 wt%. Both the γ′ and γ″ strengthening precipitates were allowed to contribute to the total for the strengthening phases within the γ-matrix. This limit was selected as alloys possessing a greater volume fraction of strengthening phases are often less processable due to cracking susceptibilities (DuPont et al., Reference DuPont, Lippold and Kiser2009). The target solvus temperature for the strengthening precipitates was set at ≥650 °C to ensure the stability of the precipitates at the operating temperature. It was noted for γ″ strengthened systems that the stabilization of δ phase limits the allowable service temperature. For the prediction of the fractions of the thermodynamically stable phases, the framework utilized CALPHAD results calculated with the Thermo-Calc™ TTNI8 database to increase the efficiency and reliability of some calculations (Andersson et al., Reference Andersson, Helander, Höglund, Shi and Sundman2002).
Alloy properties predicted, and the method used for the prediction. The range of data and number of entries used to train the neural network has been provided. The final two columns show the prediction and targets for each property of the designed alloy (wt. % - weight percent).
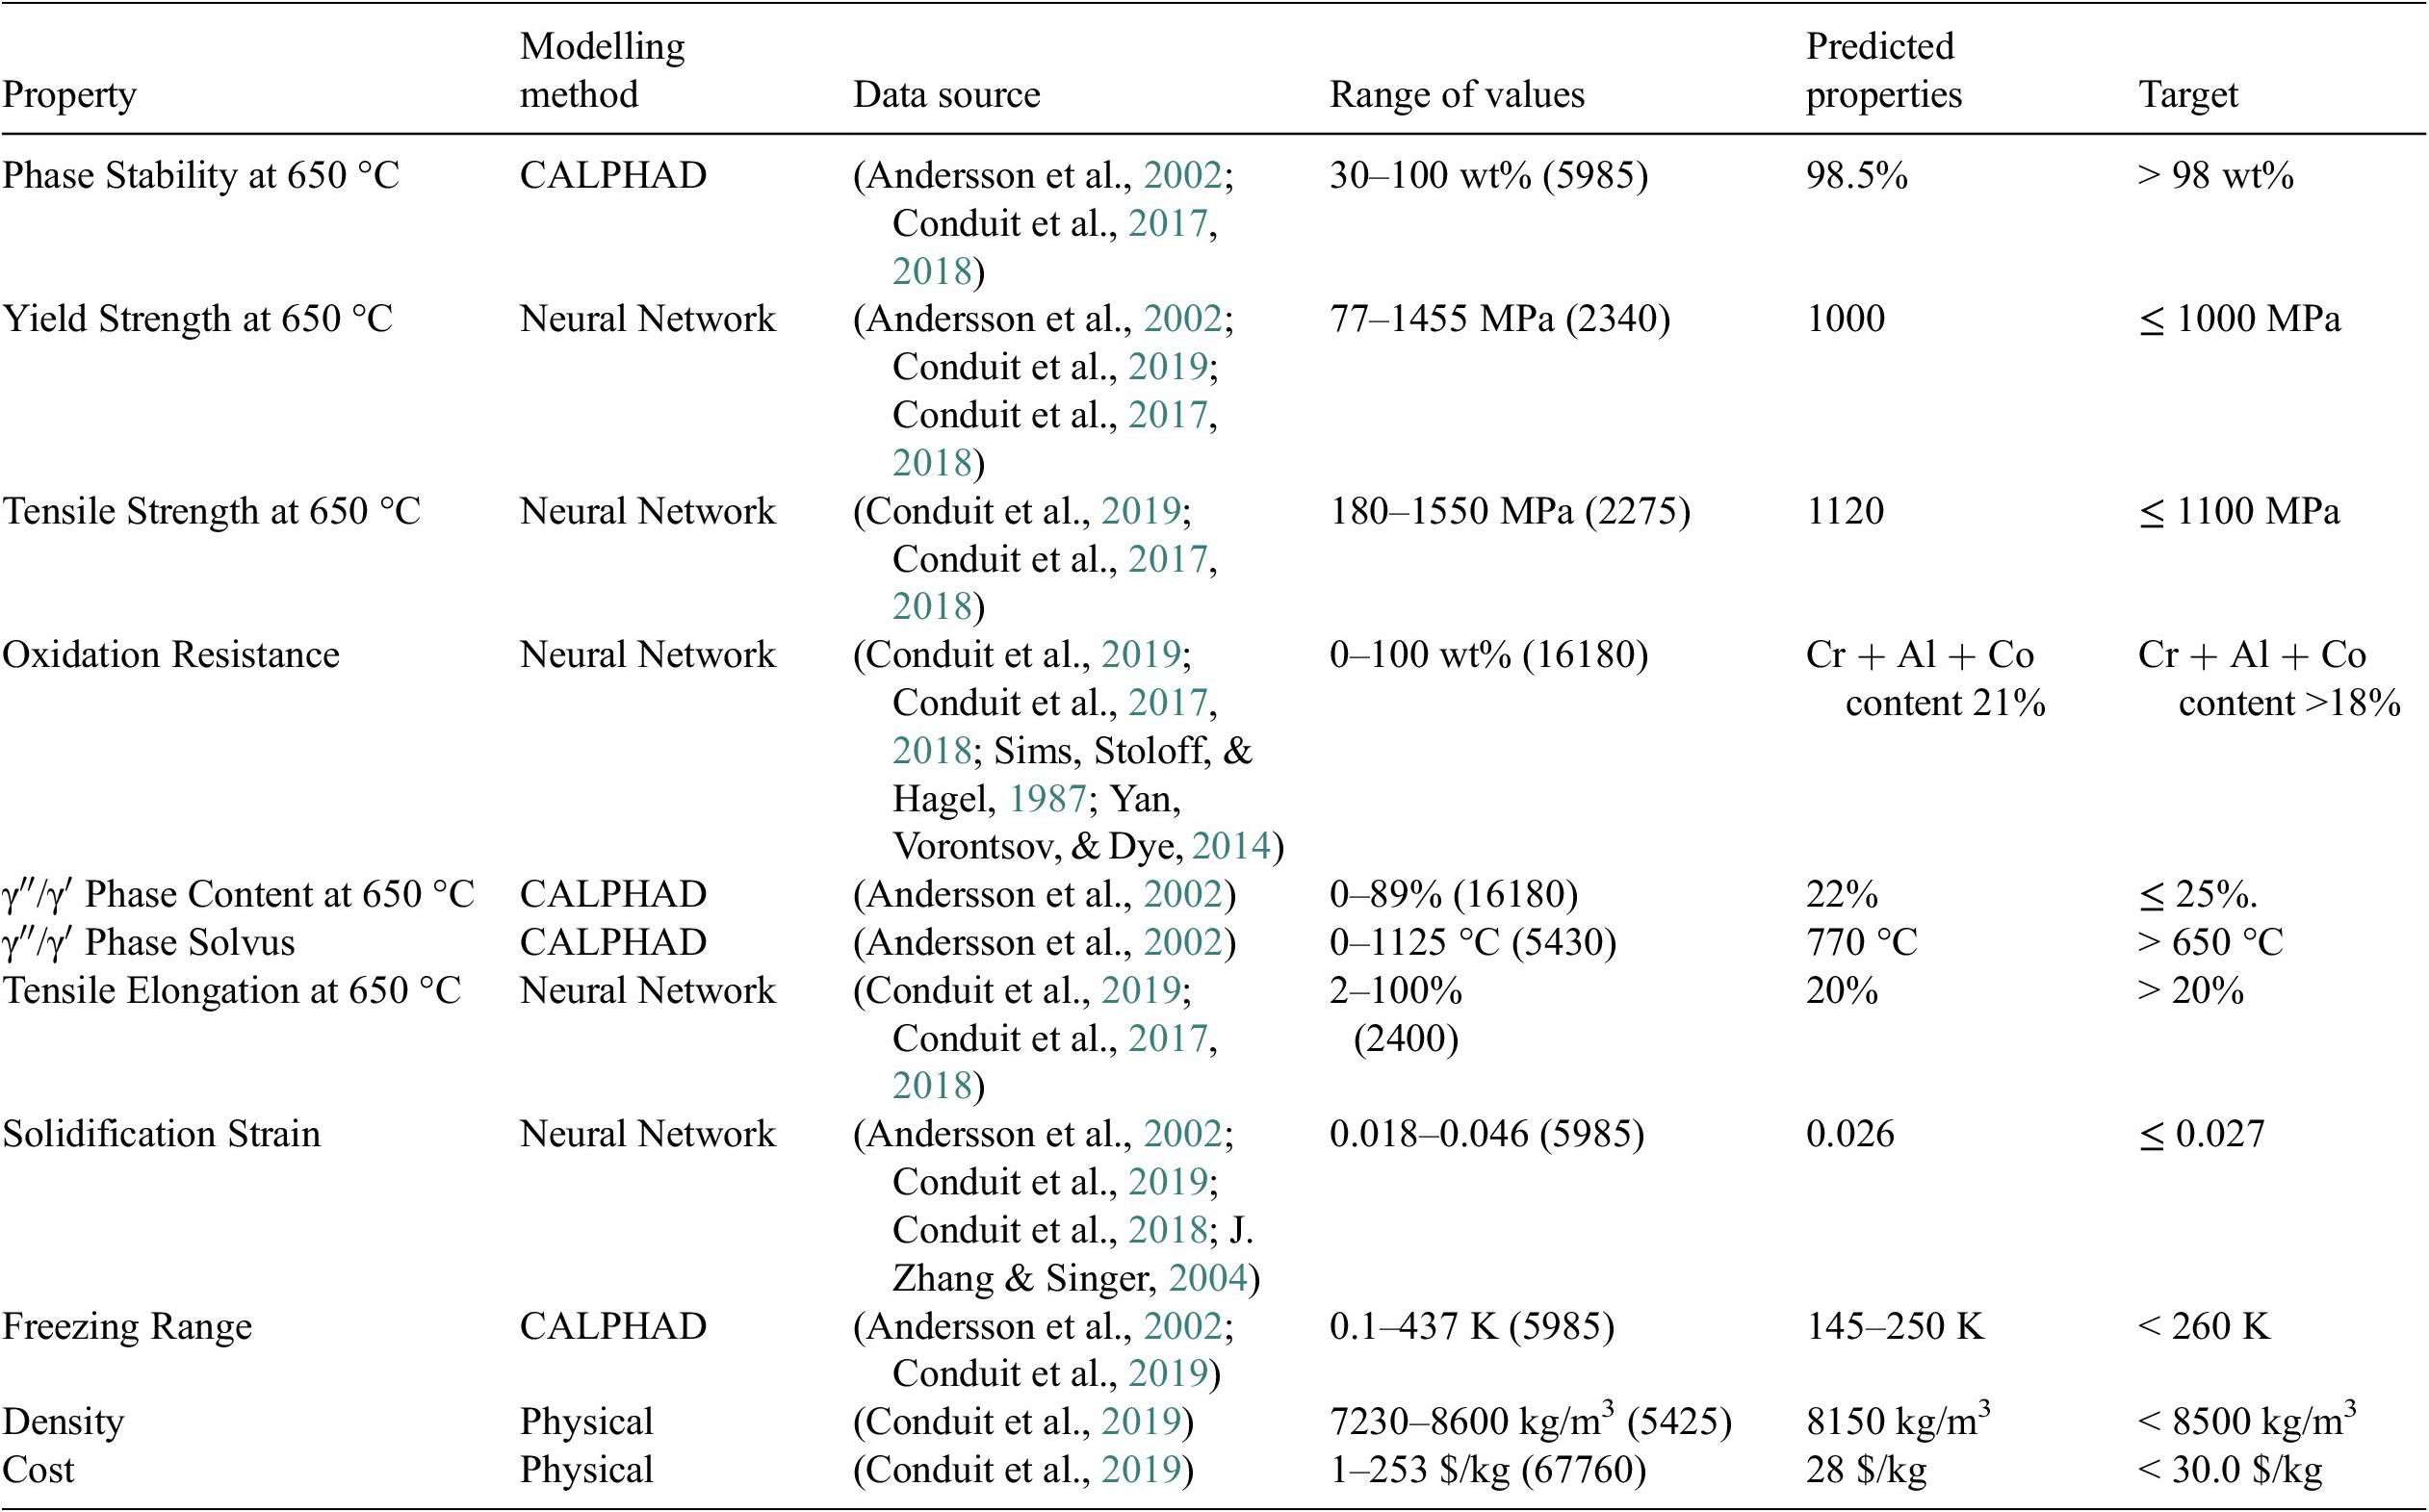
To ensure the designed alloy was processable through additive manufacturing two key targets were set for freezing range and solidification strain. These values serve as measures of the susceptibility of the alloy to cracking and are therefore critical for predicting processability. An equilibrium freezing range of <260 K and a solidification strain of <0.027 were set as targets for these values. Note that the neural network tool used both equilibrium solidification and Scheil model data in the determination of solidus and liquidus temperatures. It has been reported that a lower freezing range contributes to higher resistance to solidification and liquation cracking (Tang et al., Reference Tang, Panwisawas, Ghoussoub, Gong, Clark, Németh, McCartney and Reed2021). However, the contribution of volume shrinkage during solidification is also an important factor. An equation, from the work of Zhang and Singer (Reference Zhang and Singer2002, Reference Zhang and Singer2004), was used to predict solidification strain, E; where α is the thermal expansion coefficient and β is the volume shrinkage coefficient of the liquid. T h and T l represent the boundary temperatures during solidification, both have a corresponding value for the volume fraction of the liquid f l.
 $$ \mathrm{E}\hskip0.35em =\hskip0.70em \unicode{x03B1} ({T}_{\mathrm{h}}-{T}_{\mathrm{l}})+{\unicode{x03B2}}^{(1/3)}({f}_{\mathrm{l}}({T}_{\mathrm{h}})-{f}_{\mathrm{l}}({T}_{\mathrm{l}})) $$
 $$ \unicode{x03B1} \hskip0.35em =\hskip0.35em \frac{1}{V_1}\bullet \frac{V_1-{V}_2}{T_1-{T}_2} $$
 $$ \unicode{x03B2} \hskip0.35em =\hskip0.35em \frac{V_1-{V}_2}{V_1} $$
Values for these coefficients and key temperatures were derived from ThermoCalc™ predictions near the solidus and liquidus points. The volume shrinkage coefficient is proportional to the change in volume upon solidification and, as a result, the solidification strain. The boundary points T h and T l used by Zhang and Singer (Reference Zhang and Singer2004) were the carbide solvus temperature and the gamma prime solvus temperature respectively. For this alloy design framework, these points were altered and now represent the temperature at the points where the molar liquid fractions are 11% and 0.5% respectively. These points describe a common critical temperature range during solidification where Ni-based superalloys are susceptible to hot cracking (DuPont et al., Reference DuPont, Lippold and Kiser2009; Zhang & Singer, Reference Zhang and Singer2002).
The mechanical property targets chosen were similar to the standard values for wrought IN718 and the oxidation resistance target was set as a mass gain of <0.1 mg cm−2 at 650 °C for 100 hours. The relationship between composition and mechanical properties were predicted from a large database of experimental results (Conduit et al., Reference Conduit, Illston, Baker, Duggappa, Harding, Stone and Conduit2019; Reference Conduit, Jones, Stone and Conduit2017). The properties of cost and density were also considered important, as any designed alloy needs to be competitive compared to commercial systems. The prediction for these values were made using the weighted masses and commercial prices for the elements and binary master alloys. To ensure reliable predictions, the accuracy of the model was confirmed through 5-fold cross-validation (see model validation).
The sources and amount of training data used are shown in Table 2. The table shows that tensile strength, because it came from experimental data, had the fewest data points at 2,275. However, because phase content was found using a CALPHAD calculation many more could be performed giving us 16,180 entries. We adopt an array database, simply a two-dimensional grid like a spreadsheet. Each row corresponds to a different material and the first few columns capture the composition of the alloys. The next few columns capture the microstructure from CALPHAD calculations and the final column physical properties. As the design process was targeting a composition for repair applications, only datapoints for physical properties that had little dependence on processing were selected.
2.2. Neural network formalism
The design variables for the neural network were limited to the elements: Al, B, C, Co, Cr, Fe, Mo, Nb, Ti, and W, with a Ni balance reducing the number of variables by one, see Table 1. We adopted a maximum heat-treatment temperature of 720 °C because this is the temperature limit used for the post-processing of repaired IN718 to prevent substate over-aging. Therefore, training data had to correspond to alloy compositions that had been heat-treated at or below this temperature, limiting the mechanical data for certain alloys. However, this neural network is capable of identifying the links between properties, allowing for the large dataset to guide the extrapolation of incomplete data. This feature of the neural network framework has been described and successfully used by Conduit et al. (Conduit et al., Reference Conduit, Illston, Baker, Duggappa, Harding, Stone and Conduit2019; Reference Conduit, Jones, Stone and Conduit2017). Using this strategy, it is possible for the framework to make accurate predictions without the use of detailed models describing the mechanistic origins of physical properties.
2.2.1. Data extrapolation
To handle incomplete data, the neural network tool is able to use the information embedded within property–property relationships. This can allow for extrapolation of predictions for sparsely populated datasets. For example, an accurate model trained on copious phase behavior data can be used to predict sparse mechanical properties. Conventional neural networks deal with properties discretely as inputs or outputs of the network, with outputs requiring all the input values to yield a valid result. However, in the framework used in this study, properties are treated as both input and output variables with material design variables and properties stored together in a vector x. This is input to the neural network, which makes predictions for all properties denoted as the vector function f(x), which is defined in the next section. To account for a missing value an expectation–maximization algorithm is used (Conduit et al., Reference Conduit, Illston, Baker, Duggappa, Harding, Stone and Conduit2019; McLachlan & Krishnan, Reference McLachlan and Krishnan2007). In this algorithm, preliminary predictions are provided for all missing data points. The network then improves the initial guess through an iterative process, see Figure 1.
Algorithm describing the procedure for accounting for missing data entries for the vector x of the design variables and properties. The value is computed recursively using n iterations.

For any unknown properties, the missing values are first set to the average of the values present in the dataset. With estimates for all values of the neural network, the function (4) is iteratively computed returning the converged result following the nth iteration:
 $$ {x}^{n+1}\hskip0.35em =\hskip0.35em {\gamma x}^n+\left(1-\gamma \right)f\left({x}^n\right) $$
A softening parameter 0 ≤ γ ≤ 1 is used. When γ = 0, the initial guess is ignored for unknown values in the vector x. These are then determined by applying the function to the unknown values. Oscillations in the predictions are prevented with γ < 1, here a value of γ = 0.5 was used. Missing values are typically determined over six iterations. The benefits of this method in dealing with incomplete data are demonstrated in the Model Validation section.
2.2.2. Neural network kernel
With a complete dataset available from the Data Extrapolation section described above, we are well-positioned to form a neural network. Several types of neural networks are available including feedforward (Conduit, Reference Conduit2012) deep neural networks that can determine deep data correlations, and recurrent neural networks that are often used in systems involving the evolution of time (Conduit et al., Reference Conduit, Illston, Baker, Duggappa, Harding, Stone and Conduit2019). In this paper, for each property being predicted a standard feedforward neural network is adopted comprising a single layer of hidden nodes, as shown in Figure 2. For a given property, the neural network can input all information, for example to predict the yield strength the neural network can input not only the composition but also the other properties including the γ″/γ′ phase content. This property is strongly correlated to yield strength so is vital to improve the quality of the yield strength prediction. We used a bespoke code implemented in FORTRAN.
Schematic illustration of the neural network framework. The framework illustrates how the predicted properties (outputs) are calculated from the input properties. The input layer is constructed from the property database, this layer is used to calculate the hidden nodes (indicator functions) to give the predicted properties.
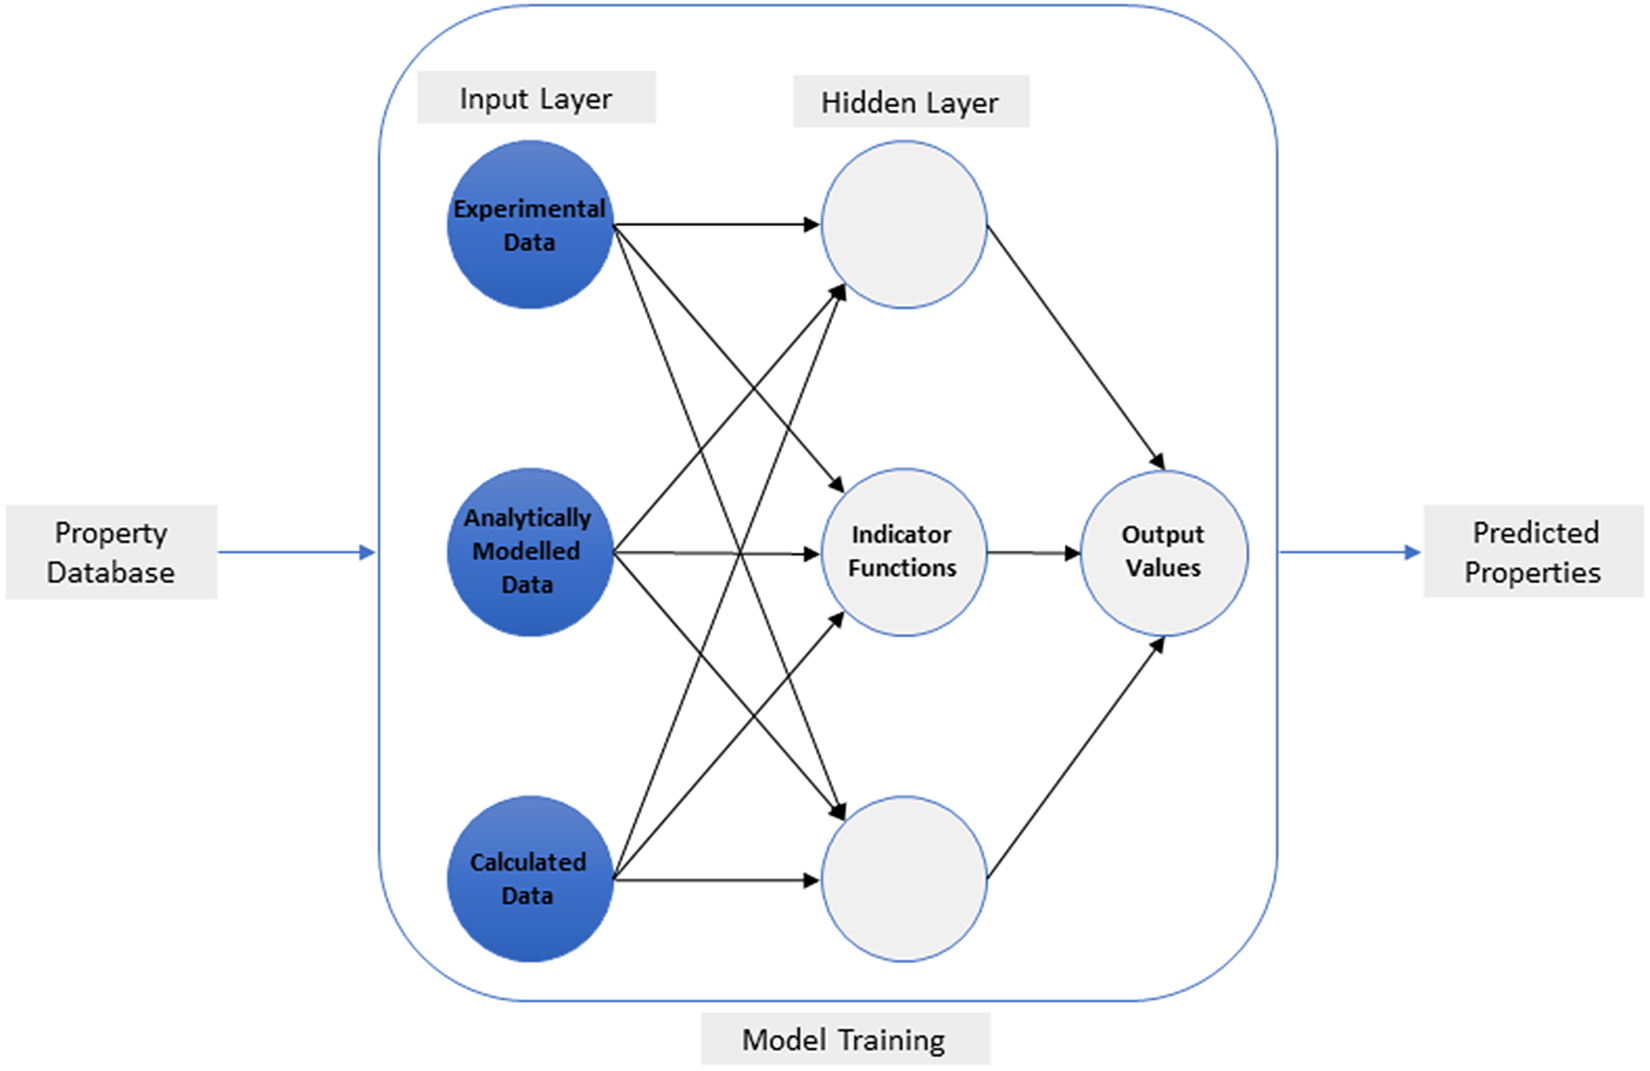
This framework is based upon the formalism designed by Conduit et al. (Conduit et al., Reference Conduit, Illston, Baker, Duggappa, Harding, Stone and Conduit2019; Conduit et al., Reference Conduit, Jones, Stone and Conduit2017, Reference Conduit, Jones, Stone and Conduit2018) but with further advances: the neural network is a linear superposition of hyperbolic tangents (5) and seeks, a function f which satisfies the fixed-point equation f(x) ≡ x as precisely as possible. x = (x1,…, xI) is a vector, here of size I = 24, comprising the individual design variables and properties. The fixed-point equation requires that, for example, the neural network prediction f(x) that inputs the composition (the first few components of the vector x) gives the correct properties (the final few components of the vector x) for that material. We therefore seek the f(x) that is a self-consistent description of the material. The identity operator is the solution to the fixed-point equation. However, this would simply, for example, input a property to predict that same property, which means that the neural network would have no predictive power whatsoever. Therefore, in order to give the machine learning predictive power we construct an f(x) that is orthogonal to the identity operator so it can input, for example, composition to predict the properties. Furthermore, the f(x) could input one property to predict another, which is a mechanism to exploit property–property correlations and necessitates the adoption of a self-consistent fixed-point equation to ensure that both composition and all properties are consistent.
 $$ f:\left({x}_1,\dots, \hskip0.15em ,{x}_i,\dots, {x}_I\right)\hskip0.35em \longmapsto \hskip0.35em \left({y}_1,\dots, {y}_j,\dots, {y}_I\right) $$
with
 $$ {\eta}_{hj}\hskip0.35em =\hskip0.35em \tanh \left({\sum}_{i\hskip0.35em =\hskip0.35em 1}^I{A}_{ihj}{x}_i+{B}_{hj}\right) $$
and
 $$ {y}_j\hskip0.35em =\hskip0.35em {\sum}_{h\hskip0.35em =\hskip0.35em 1}^H{C}_{hj}{\eta}_{hj}+{D}_j $$
Here we note that the repeated subscript j on the right-hand side does not imply summation over that variable. The single layer of hidden nodes $ {\eta}_{hj} $
have parameters
$ {\eta}_{hj} $
have parameters $ \left({A}_{ihj},{B}_{hj},{C}_{hj},{D}_j\right) $
. The individual properties are, defined by
$ \left({A}_{ihj},{B}_{hj},{C}_{hj},{D}_j\right) $
. The individual properties are, defined by $ {y}_j $
where
$ {y}_j $
where $ 1\le j\le I $
, are predicted separately. By setting
$ 1\le j\le I $
, are predicted separately. By setting $ {A}_{jhj}\hskip0.35em =\hskip0.35em 0 $
the value of
$ {A}_{jhj}\hskip0.35em =\hskip0.35em 0 $
the value of $ {y}_j $
can be predicted without information of
$ {y}_j $
can be predicted without information of $ {x}_j $
to ensure orthogonality to the identity. The network can capture non-linear behavior through the use of tanh functions. This is termed an activation function and generally produces predictions of higher quality than similar functions, that is rectified linear logic (Conduit et al., Reference Conduit, Illston, Baker, Duggappa, Harding, Stone and Conduit2019). Model accuracy is assessed by the L2 loss function, but to simultaneously consider multiple properties we recast this as the coefficient of determination described in the next section.
$ {x}_j $
to ensure orthogonality to the identity. The network can capture non-linear behavior through the use of tanh functions. This is termed an activation function and generally produces predictions of higher quality than similar functions, that is rectified linear logic (Conduit et al., Reference Conduit, Illston, Baker, Duggappa, Harding, Stone and Conduit2019). Model accuracy is assessed by the L2 loss function, but to simultaneously consider multiple properties we recast this as the coefficient of determination described in the next section.
We performed a five-fold cross-validation test (Conduit et al., Reference Conduit, Illston, Baker, Duggappa, Harding, Stone and Conduit2019; Faizabadi, Khalaj, Pouraliakbar, & Jandaghi, Reference Faizabadi, Khalaj, Pouraliakbar and Jandaghi2014; Khalaj, Reference Khalaj2013) to identify three hidden nodes as giving the best model. Fewer hidden nodes led to oversimplification and a poor fit, whereas more hidden nodes led to overfitting. Three hidden nodes implies that there are three principal components, that is that the variation of each property can be captured by just three variables. This aligns with physical intuition, for example density is approximately a linear summation of atomic masses of each element multiplied by the concentration, so the lowest order contribution could be captured by just one hidden node. The other two hidden nodes will capture more complex non-linear behavior. Mechanical properties (yield strength and tensile strength) in high temperature nickel alloys are driven generally by just two mechanisms: solid solution strengthening and precipitate strengthening. Solution strengthening is related to the concentration of elements of differing atomic radii, so is a straight-forward weighted sum of elemental concentrations. Precipitate strengthening is directly related to the phase content of the strengthening precipitates, which the machine learning has already predicted and is available through the fixed-point self-consistent cycle. Each mechanism at its lowest order can be described by one hidden node, so the two strengthening mechanisms require at least two hidden nodes. The final hidden node can capture additional non-linear behavior. We also tried two and three-hidden layer neural networks but found that a single hidden layer delivered the best predictions. One hidden layer is sufficient to capture most simple trends in material properties, and more complex trends in material properties are captured by the recursive expectation–maximization algorithm through the property–property relations, which in effect replaces the complexity offered by multiple hidden layers.
The weights $ \left({A}_{ihj},{B}_{hj},{C}_{hj},{D}_j\right) $
were trained with the neural network running sequentially within the expectation–maximization algorithm. A set of weights was proposed, a trial performed with predictions made in the expectation–maximization framework, and the accuracy assessed with cross-validation. The process was repeated multiple times until the weights
$ \left({A}_{ihj},{B}_{hj},{C}_{hj},{D}_j\right) $
were trained with the neural network running sequentially within the expectation–maximization algorithm. A set of weights was proposed, a trial performed with predictions made in the expectation–maximization framework, and the accuracy assessed with cross-validation. The process was repeated multiple times until the weights $ \left({A}_{ihj},{B}_{hj},{C}_{hj},{D}_j\right) $
were found that deliver the best possible predictions.
$ \left({A}_{ihj},{B}_{hj},{C}_{hj},{D}_j\right) $
were found that deliver the best possible predictions.
We trained 96 separate neural network models. Each model was trained on a separate dataset that itself has the same number of rows as the original master dataset and was populated by drawing rows with replacement from the original master dataset. This means that some rows in the original master dataset did not appear in the data for a particular model, some rows will appear once, and a few several times. This is the standard bootstrapping technique, resulting in multiple neural networks each of which will have different weights (Conduit et al., Reference Conduit, Illston, Baker, Duggappa, Harding, Stone and Conduit2019; Reference Conduit, Jones, Stone and Conduit2017, Reference Conduit, Jones, Stone and Conduit2018). The mean of these was taken as the prediction expectation value, and their variance as the uncertainty in the predictions that captures both experimental uncertainty in the underlying data and also in extrapolation (Conduit et al., Reference Conduit, Illston, Baker, Duggappa, Harding, Stone and Conduit2019; Papadopoulos, Edwards, & Murray, Reference Papadopoulos, Edwards and Murray2001).
2.3. Model validation
The accuracy of the neural network was verified using cross-validation. The data was randomly separated, with the network being trained on 80% of the database. The model was then validated against all properties using the remaining 20% of the database. To ensure that there was complete representation of the dataset, cross-validation of the data was performed four additional times on the remaining data, again randomly selected. We measure model accuracy using the coefficient of determination, which is defined as:
 $$ {R}_j^2\hskip0.35em =\hskip0.35em 1-\frac{\sum_{i\hskip0.35em =\hskip0.35em 1}^n{({\boldsymbol{x}}_{i,\hskip0.15em j}-{\boldsymbol{f}}_j({\boldsymbol{x}}_i)\,)}^2}{\sum_{i\hskip0.35em =\hskip0.35em 1}^n{({\boldsymbol{x}}_{i,\hskip0.15em j}-{\overline{\boldsymbol{x}}}_j\hskip2pt )}^2} $$
Where the subscript i denotes each of the n different materials, subscript j represents the j
th material property and $ \overline{\boldsymbol{x}} $
denotes an average over all materials. Finally, we average the individual coefficient of determinations over all m properties to deliver an overall coefficient of determination.
$ \overline{\boldsymbol{x}} $
denotes an average over all materials. Finally, we average the individual coefficient of determinations over all m properties to deliver an overall coefficient of determination.
 $$ {R}^2\hskip0.35em =\hskip0.35em \frac{\sum_{j\hskip0.35em =\hskip0.35em 1}^m{R}_j^2\;}{m} $$
We explored different possible hyperparameters, selecting those that delivered the highest quality model, which had three hidden nodes. This model delivered a coefficient of determination averaged over all properties of R 2 = 0.92. To demonstrate the practical quality of the model, plots of predicted values versus calculated and experimental data are shown in Figure 3.
Cross-validation tests for the properties of phase stability and yield strength. (a) Predicted phase stability at 650 °C against calculated phase stability (CALPHAD). Poor predictions for high Nb and Ta containing compositions have been circled. (b) Predicted yield strength vs experimental yield strength. For both plots error bars have been provided for the predicted values. Additionally, an idealized line has been added as an aid to the eye.

In Figure 3a, the predicted phase stability at 650 °C has been plotted against values calculated using the CALPHAD method with ThermoCalc™ (which had R 2 = 0.94). The plot shows that the predictions closely match the calculated values at high phase stabilities. However, at lower phase stabilities the model is less reliable due to sparse training data in that region. This is reasonable as the vast majority of data used in this neural network were from alloy compositions with phase stabilities of greater than 0.6. The 96 underlying neural network models converge on similar predictions where more data is available. Specifically, the model is poor at predicting the phase stability of compositions containing high concentrations of Nb and Ta (circled), which have a higher predicted value of phase stability than that calculated. To demonstrate the ability of the neural network to predict physical properties a cross-validation plot of predicted yield strength versus the experimentally measured values has been provided in Figure 3b. The results show that the model does a good job of predicting the yield strength as a function of alloy composition, with the most reliable predictions at higher values of yield strength. The three properties with the lowest coefficient of determination were tensile strength with an R 2 = 0.90, γ′ solvus with an R2 = 0.89 and elongation to failure with an R 2 = 0.74. On the other hand, cost and density were both modelled with R 2 > 0.995.
Making good predictions is just the first step, for effective material design understanding the robustness of the predictions is vital. Therefore, for both plots (Figure 3a and 3b) error bars on the predicted values have been provided. Generally, points closer to the line have smaller error bars as these are more reliable predictions from the model. Qualitatively, we compared the standard error predicted by the neural network and the actual difference from unseen validation data, which on average should be unity.
2.4. Optimization routine
For the selection of design variables that optimize the alloy properties, a single merit index $ L\hskip0.35em =\hskip0.35em \Phi \left[{\Sigma}^{-1}\left(\overrightarrow{V}-\overrightarrow{T}\right)\right] $
was calculated from all of the individual properties (Conduit et al., Reference Conduit, Illston, Baker, Duggappa, Harding, Stone and Conduit2019; Reference Conduit, Jones, Stone and Conduit2017). This value describes the probability that the properties
$ L\hskip0.35em =\hskip0.35em \Phi \left[{\Sigma}^{-1}\left(\overrightarrow{V}-\overrightarrow{T}\right)\right] $
was calculated from all of the individual properties (Conduit et al., Reference Conduit, Illston, Baker, Duggappa, Harding, Stone and Conduit2019; Reference Conduit, Jones, Stone and Conduit2017). This value describes the probability that the properties $ \overrightarrow{V} $
of the optimised alloy will satisfy the specified targets
$ \overrightarrow{V} $
of the optimised alloy will satisfy the specified targets $ \overrightarrow{T} $
. The terms
$ \overrightarrow{T} $
. The terms $ \Phi $
and
$ \Phi $
and $ \Sigma $
represent the multivariate cumulative normal distribution function and covariance matrix respectively (Wasserman, Reference Wasserman2004). The covariance matrix is calculated by summing over all 96 predictions from the 96 underlying neural network models, with the covariance component for i, j entry being
$ \Sigma $
represent the multivariate cumulative normal distribution function and covariance matrix respectively (Wasserman, Reference Wasserman2004). The covariance matrix is calculated by summing over all 96 predictions from the 96 underlying neural network models, with the covariance component for i, j entry being $ \frac{1}{96}{\sum}_{k\hskip0.35em =\hskip0.35em 1}^{96}\left({x}_{i,k}-\overline{x_i}\right)\left({x}_{j,k}-\overline{x_j}\right) $
, where i is the ith property, j is the jth property, k indexes the underlying neural networks models, xi,k is the prediction of the ith property by the kth neural network model, and
$ \frac{1}{96}{\sum}_{k\hskip0.35em =\hskip0.35em 1}^{96}\left({x}_{i,k}-\overline{x_i}\right)\left({x}_{j,k}-\overline{x_j}\right) $
, where i is the ith property, j is the jth property, k indexes the underlying neural networks models, xi,k is the prediction of the ith property by the kth neural network model, and $ \overline{x_i}\hskip0.35em =\hskip0.35em \frac{1}{96}{\sum}_{k\hskip0.35em =\hskip0.35em 1}^{96}{x}_{i,k} $
is the expected value of the ith property. The use of a single index allows the individual probabilities for the properties to be summed into one probability describing the likelihood of fulfilling the full specification. Through the maximization of the merit index, the framework can determine the ideal compromises between properties. Other methods such as robust design (Backman et al., Reference Backman, Wei, Whitis, Buczek, Finnigan and Gao2006) and principal component analysis (Toda-Caraballo, Galindo-Nava, & Rivera-Díaz-del-Castillo, Reference Toda-Caraballo, Galindo-Nava and Rivera-Díaz-del-Castillo2013) are unable to make compromises in this effective way. This ability of the network to determine deep property correlations is not possible with the traditional linear regression method synonymous with a principal component analysis.
$ \overline{x_i}\hskip0.35em =\hskip0.35em \frac{1}{96}{\sum}_{k\hskip0.35em =\hskip0.35em 1}^{96}{x}_{i,k} $
is the expected value of the ith property. The use of a single index allows the individual probabilities for the properties to be summed into one probability describing the likelihood of fulfilling the full specification. Through the maximization of the merit index, the framework can determine the ideal compromises between properties. Other methods such as robust design (Backman et al., Reference Backman, Wei, Whitis, Buczek, Finnigan and Gao2006) and principal component analysis (Toda-Caraballo, Galindo-Nava, & Rivera-Díaz-del-Castillo, Reference Toda-Caraballo, Galindo-Nava and Rivera-Díaz-del-Castillo2013) are unable to make compromises in this effective way. This ability of the network to determine deep property correlations is not possible with the traditional linear regression method synonymous with a principal component analysis.
In order to optimize the material properties against the set targets, the framework must vary the design variables. In other alloy design frameworks this process has the highest computational cost. Examples include the selection of a few compositions from thousands of predetermined compositions using trade-off diagrams (Reed et al., Reference Reed, Tao and Warnken2009) or a Pareto set (Greeley, Jaramillo, Bonde, Chorkendorff, & Nørskov, Reference Greeley, Jaramillo, Bonde, Chorkendorff and Nørskov2006; Lejaeghere, Cottenier, & Van-Speybroeck, Reference Lejaeghere, Cottenier and Van-Speybroeck2013). The expense of these methods scales with the number of chosen design variables. A further example is the use of genetic algorithms (Stucke & Crespi, Reference Stucke and Crespi2003), as in the work of Tancret (Reference Tancret2012). However, the performance of these frameworks with high dimensional problems can be poor and such algorithms may not reach the optimal solution (Ingber & Rosen, Reference Ingber and Rosen1992; Mahfoud & Goldberg, Reference Mahfoud and Goldberg1995). For this framework, the logarithm of the probability of success is maximized. As a result, when searching a region of design space that is unlikely to meet the targets the optimization routine generates a constant gradient favoring the least optimized property (Conduit et al., Reference Conduit, Illston, Baker, Duggappa, Harding, Stone and Conduit2019; Reference Conduit, Jones, Stone and Conduit2018).
2.5. Alloy identification
An optimized Ni-based alloy was designed to satisfy the specified targets, with a composition comparable to IN718. The compositional range of this alloy system in weight %, designated AM718R, has been given in Table 3. For this system, the only required post-processing is a two-stage precipitation heat-treatment at 720 °C and 640 °C. The calculated probability that this concentration will satisfy all of the design criteria is 17%. Compared to IN718, there are several noticeable differences in composition. The neural network has attempted to make compromises within the composition. To reduce the likelihood of formation for undesired phases, specifically Laves, the Mo and Nb contents have been decreased and C increased. To compensate for the inevitably reduced strength, the Al concentration has been increased and W has been added to the system. It is also, worth noting that the addition of W might further serve to destabilize the formation of the Laves phase.
The compositional ranges in wt% and recommended post-processing conditions for standard IN718 and AM718R. For the measured composition of AM718R, SEM–EDX was used to assess the composition with a nominal error of 1% for all measurements. The EDX measurements were taken from the laser pass heat-affected zone. Carbon and boron have not been included due to the insensitivity of EDX in measuring light elements.

Such compromises are best visualized through the use of an Ashby plot (Ashby, Reference Ashby1992) of the predicted properties, Figure 4. This serves as a representation of the design space and allows for an understanding of the property trade-offs made during the design process. This plot illustrates the probability of fulfilling a set of target criteria, in this instance phase stability and solidification strain. For a low solidification strain and high phase stability, the probability of fulfilling all of the targets is 0 denoting a physical impossibility of success. The alloy identified in this study is in a region with a relatively high likelihood of success.
Ashby plot showing the probability of an alloy composition satisfying all of the design criteria when the properties of phase stability (y – axis) and solidification strain (x – axis) are varied. The black regions show areas of design space that have a low probability of fulfilling the targets. The lighter shading indicates an increased likelihood of satisfying all of the target criteria. The blue circles show the current alloy IN718 and the designed alloy AM718R.

3. Results and discussion
The physical and thermodynamic properties of the optimized AM718R alloy were assessed using a range of techniques. The results were compared to conventional IN718. The processability of AM718R was assessed using laser pass testing (Zhou, Reference Zhou, Dicus, Forsik, Wang, Colombo and Epler2020).
3.1. Alloy fabrication and laser pass testing
The alloy samples used in this study were manufactured using vacuum arc melting from individual elements and binaries of at least 99.9% purity. The bars were inverted and remelted several times to improve compositional homogeneity. The manufactured cylindrical bars were machined using electro-discharge machining (EDM) into rectangular cuboids of dimensions 20 × 10 × 5 cm. These rectangular samples were used for assessment of physical and thermodynamic properties. In an effort to assess the processability of the designed alloy in comparison to existing alloys, laser pass testing was used. This relatively simple test allows for rapid assessment of the response of an alloy to processing through additive manufacturing (Zhou, Reference Zhou, Dicus, Forsik, Wang, Colombo and Epler2020). Prior to laser pass testing, samples were ground to a finish of 1200gt using standard metallographic techniques.
For the laser pass testing, a laser power of 120 W was used with a scan velocity of 1000 mm s−1 and a hatch spacing of 40 μm on a Aconity3D MINI system. A bilinear raster over an area of 5 × 5 mm was scanned on the face of the samples. Following the laser pass, the samples underwent a standard two-stage precipitation heat treatment for IN718. Prior to heat treatment, samples were encapsulated in argon-backfilled quartz ampoules. The two-stage heat treatment consisted of two 8-hour isothermal holds at 720 °C and 640 °C, with a furnace cool from 720 °C to 640 °C. The samples were heated to temperature in a furnace from room temperature (RT) and were air-cooled to RT following the 640 °C isothermal hold.
The heat-treated laser pass samples were prepared for scanning electron microscopy (SEM) analysis on a Zeiss SEM 450 equipped with an Oxford Instruments X-MaxN 50 detector. Samples were mounted in conductive Bakelite and standard metallographic techniques were used to prepare the samples to a finish of 0.25 μm. A 10-minute chemical polish was applied to the samples with a 1:10 solution of 0.04 μm colloidal silica and water. Post-processing of the data was completed in the Oxford Instruments Aztec software.
Micrographs highlighting the laser pass heat-affected zones (HAZs) in the AM718R and IN718 samples have been given in Figure 5. The average depth of the laser pass HAZ in the samples is 35 ± 7.5 μm, determined using 10 individual measurements across the area. For both samples this zone was inspected for laser induced defects including pores and cracks. In both samples the number defects found in the 5 mm x 35 μm region was negligible, ≤ 1 per 100 μm2. The lack of cracking or porosity is expected for the highly processable IN718 alloy. However, comparable observations of a low defect density is an encouraging result for AM718R. This system was designed to have processability comparable to IN718 and a lower volume fraction of undesired phases. For both samples, image analysis, using thresholding in the ImageJ software, of multiple SEM micrographs was carried out to determine an estimation of the area fraction of eutectic precipitates in the arc-melted area. Though this area does not have an additively manufactured microstructure, the volume fractions will give an indication of eutectic phase content. For IN718 the approximate area fraction of eutectic is 3.4 ± 0.5%. For AM718R the area fraction was found to be 1.7 ± 0.3%. This result indicates that the AM718R alloy might contain a lower volume fraction of eutectic phases, such as the Laves phase, in the additively manufactured condition.
Back-scattered electron images of the laser pass heat-affected zone (HAZ) and arc-melted microstructure of IN718 (a) and AM718R (b) in the precipitation heat-treated condition. For ease of identification the extent of the HAZ has been identified with a yellow line in both micrographs.

3.2. Microstructural and phase analysis
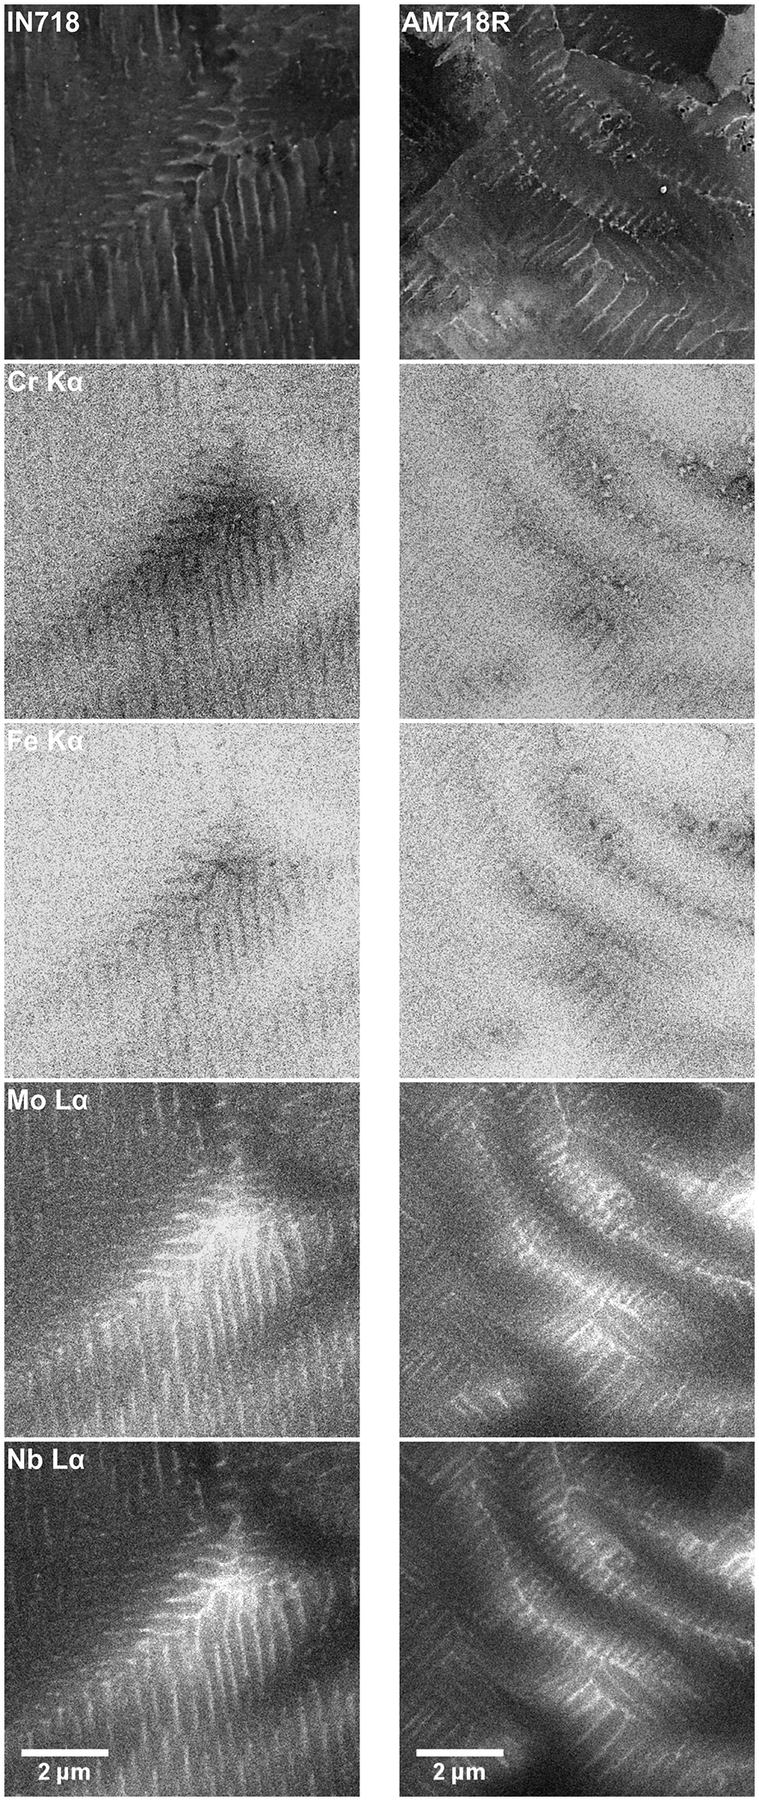
A detailed SEM analysis of the laser-pass HAZ was carried out at a higher magnification for the IN718 and AM718R samples. In Figure 6 secondary electron (SE) micrographs have been provided alongside elemental distribution maps for both samples. In the SE images a fine microstructure of cored dendrites is observed for the two specimens. Such a microstructure is frequently reported for additively manufactured Ni-based alloys (Jones et al., Reference Jones, Whittaker, Buckingham, Johnston, Bache and Clark2017; Markanday et al., Reference Markanday, Carpenter, Jones, Thompson, Rhodes, Heason and Stone2021). Indeed, the observed microstructure for the IN718 sample is similar to that reported for laser-blown-powder directed-energy-deposition (LBP-DED) IN718 in a previous study (Markanday et al., Reference Markanday, Carpenter, Jones, Thompson, Rhodes, Heason and Stone2021). This demonstrates that the laser pass testing might be a viable way of quickly assessing the processability of alloys for AM techniques. However, the dendrite spacing observed in this zone is extremely fine, as this is only a single laser pass. A coarsening of the microstructure would be expected in a larger-scale AM deposition due to the heat retention during fabrication (Babu et al., Reference Babu, Raghavan, Raplee, Foster, Frederick, Haines, Dinwiddie, Kirka, Plotkowski, Lee and Dehoff2018). Despite this, the observed microstructure of the HAZ provides insight into what would be expected. The microstructure of the AM718R samples is more refined than that of the IN718. This is clear in the Mo and Nb elemental distribution maps, where the segregation of these elements has been reduced from 3.6 to 2.7 wt. % and 9.1 to 5.1 wt. % respectively in the AM718R sample. Despite this reduction, interdendritic precipitates are present in the AM718R sample. The Laves phase is expected to be the primary constituent of the interdendritic eutectic phase. The occurrence of the Laves phase in additively manufactured IN718 has been frequently reported in the literature (Markanday et al., Reference Markanday, Carpenter, Jones, Thompson, Rhodes, Heason and Stone2021; Zhong et al., Reference Zhong, Chen, Linnenbrink, Gasser, Sui and Poprawe2016). As the composition of AM718R is comparable to that of IN718, the occurrence of the Laves phase is expected.
SEM analysis of the IN718 and AM718R HAZ. Top, a secondary electron image. Beneath, elemental distribution maps for Cr, Fe, Mo and Nb determined by SEM–EDX.
To determine the area fraction of these phases, image analysis of multiple electron micrographs was performed. A total area of 2 mm2 was analyzed for each sample. The electron micrographs were taken from random locations within the HAZ of both samples to ensure representative results, and examples are provided in the supplementary data. The area fraction of interdendritic precipitates in the IN718 sample is 3.0 ± 0.2% and for the AM718R sample it is 1.9 ± 0.2%. Both results are comparable to the area fraction determined in the arc-melted microstructure of both samples. It is clear that the designed AM718R alloy has reduced segregation and formation of the Laves phase and therefore a higher phase stability than the standard IN718. The neural network predicted that the AM718R system would have phase stability of 98.5% and this result is acceptably close to the prediction.
The thermo-physical characteristics of the phases present were further investigated using differential scanning calorimetry (DSC) and X-ray diffraction (XRD). Disc specimen of thickness 1.0 mm and 5 mm in diameter were prepared from alloy samples using EDM. For the DSC analysis a Netzsch 404 calorimeter was used. For the measurements, samples were held in an alumina crucible under a constant stream of argon with a flow rate of 50 mL/min. The analysis cycle consisted of an initial heating to 1400 °C, cooling to 450 °C and reheating to 1400 °C before cooling to room temperature. For the cycles, a ramp rate of 10 °C/min was used and a 10 min isothermal hold was applied between steps for thermal equilibration.
The DSC traces for both samples have been given in Figure 7. The reported solidification sequence for IN718 is L → L + γ → L + NbC/γ → Laves/γ (Chen, Zhang, Huang, Hosseini, & Li, Reference Chen, Zhang, Huang, Hosseini and Li2016) and both samples display evidence of this sequence on cooling. Though these traces appear similar, there are several distinct differences. The on-cooling liquidus temperature of the AM718R sample, 1332 °C, was found to be higher than that of IN718, 1310 °C. An approximate freezing range for the alloys has been determined by analysis of the liquidus and the events near the termination of solidification. The samples have comparable solidification ranges, with the IN718 sample having an approximate range of 178–253 K and the AM718R sample having a range of 179–258 K. The target for AM718R was set as <260 K, which has been satisfied. The results for IN718 are comparable to those reported in the literature (Thavamani, Balusamy, Nampoothiri, Subramanian, & Ravi, Reference Thavamani, Balusamy, Nampoothiri, Subramanian and Ravi2018).
DSC traces for the first heating of IN718 and AM718R (a) samples from room temperature to 1400 °C and the accompanying cooling curves (b).

There are similar events for the two samples on the heating thermogram. The carbide dissolution is not easily identifiable by eye but occurs around 1290 °C for IN718 and there is an analogous event at 1305 °C for AM718R. This result is unsurprising given that the addition of W to the composition would increase the solidus and carbide solvus for the AM718R sample. For IN718 the δ and Laves dissolution event starts near 1070 °C and this agrees with previous reports in the literature (Chen et al., Reference Chen, Zhang, Huang, Hosseini and Li2016; Zhang et al., Reference Zhang, Yang, Lu, Wei, Meng and Gao2020). For AM718R there is an event in the same region, around 1080 °C. Both samples also display similar events that could be attributed to the precipitation of the γ″ and δ phases. For IN718 these start at approximately 760 °C and terminate near 905 °C. For AM718R there is an event that begins at 770 °C and finishes around 935 °C. The final event for IN718 is attributed to the precipitation of the γ′. There is a pronounced peak in a comparable position for the AM718R sample. The start for this event in IN718 is near 570 °C and terminates around 715 °C. In contrast, for AM718R this event starts at approximately 590 °C and ends near 725 °C.
Phase identification was performed using XRD with a Bruker D8 X-ray diffractometer operated at 40 kV and 40 mA with a Cu-Kα source. The detection of the Kβ peaks was suppressed by using a 12 μm thick Ni filter. Diffraction data were acquired over an angular range (2θ) of 20° to 110° with a step size of 0.05° and a dwell time of 2.8 seconds. The samples were rotated at 30 RPM during the measurement to improve counting statistics. The Bruker DIFFRAC.EVA software package was used for analysis of the diffraction data. The diffraction peaks were matched to their respective phases using the inbuilt database. The XRD patterns for IN718 and AM718R have been given in Figure 8a and are similar. The primary γ matrix peaks are easily identifiable, however, the γ′ and the γ″ superlattice reflections are not distinguishable. This observation is consistent with previous literature regarding IN718 (Markanday et al., Reference Markanday, Carpenter, Jones, Thompson, Rhodes, Heason and Stone2021). Several lower intensity peaks were also observed in the pattern given in Figure 8a.
(a) XRD patterns for IN718 and AM718R samples in the precipitation heat-treated condition. (b) higher resolution XRD patterns for the IN718 and AM718R samples over a selected range of 2θ. Labels have been added to highlight the reflections of the gamma (γ), MC carbide and Laves (φ) phases. Intensity has been altered to the square root of peak intensity for clarity.

Higher resolution XRD patterns taken over a narrower range of 2θ range have been given in Figure 8b to enhance these reflections. The occurrence of these peaks has been attributed to the presence of the MC carbide and Laves phases. With the peaks at approximately 35° and 37.5° 2θ being the MC carbide {111} and Laves phase {0110} reflections respectively (Chen et al., Reference Chen, Guo, Xu, Ma, Zhang, Wang, Yao and Li2019; Hosseini, Abbasi, & Madar, Reference Hosseini, Abbasi and Madar2018; Mostafa, Picazo Rubio, Brailovski, Jahazi, & Medraj, Reference Mostafa, Picazo Rubio, Brailovski, Jahazi and Medraj2017). The peak at approximately 41° 2θ can be attributed to both the MC carbide (200) and Laves phase (201) reflections. A shoulder appears visible just before 44 ° 2θ in the IN718 pattern, which might be attributable to a carbide. However, due to the weak intensity of this peak and no related reflections being present, reliable identification was not possible. The final peak at 45° 2θ was identified as the Laves phase {0220} reflection (Gan et al., Reference Gan, Cheng, Guo, Tai, Kozhevnikova, Song and Zhang2020; Gao et al., Reference Gao, Zhang, Cao, Chen, Feng, Poprawe, Schleifenbaum and Ziegler2019). It is worth noting that the MC carbide {111} was not observed in the diffraction data from the IN718 sample. Indeed, the peak at 41° 2θ is also reduced in intensity when compared to AM718R. However, the Laves phase {201} and {0222} reflections are stronger in the IN718 samples when compared to AM718R. This is likely to be a result of the reduced presence of the Laves phase in the AM718R sample.
3.3. Physical properties
Selected physical properties of AM718R were tested and compared to IN718. A critical property is that of oxidation resistance. To assess the high-temperature oxidation behavior, isothermal oxidation testing was performed at 650 °C, see Figure 9. Samples of the dimension 20 × 10 × 1 mm were machined from the alloy bars using EDM and ground to a 4000 gt finish. The oxidation testing was carried out on a Setaram Instruments Setsys Evolution TGA. Mass gains for the samples were measured over a 200-hour exposure at 650 °C. During testing the samples were hung from a microbalance and a continuous stream of air was permitted to flow at a rate of 30 mL min−1 and at a pressure of 1 bar. The Pierragi Method (Eq. 10) (Sanviemvongsak, Monceau, & Macquaire, Reference Sanviemvongsak, Monceau and Macquaire2018) was used to fit the data and determine the parabolic rate constants $ {K}_p $
(mg2.cm−4.s−1), where s (cm2) is the surface area,
$ {K}_p $
(mg2.cm−4.s−1), where s (cm2) is the surface area, $ t $
(sec) is the exposure time,
$ t $
(sec) is the exposure time, $ \Delta m $
(mg) is the mass gain and
$ \Delta m $
(mg) is the mass gain and $ {m}_o $
is a variable to account for the mass gain associated with the transient oxidation prior to the establishment of parabolic growth. Straight line fits of
$ {m}_o $
is a variable to account for the mass gain associated with the transient oxidation prior to the establishment of parabolic growth. Straight line fits of $ \frac{\Delta m}{s} $
against
$ \frac{\Delta m}{s} $
against $ \sqrt{t} $
, where the gradient corresponds to the square root of the
$ \sqrt{t} $
, where the gradient corresponds to the square root of the $ {K}_p $
value, were plotted for all of the samples.
$ {K}_p $
value, were plotted for all of the samples.
 $$ \frac{\Delta m}{s}\hskip0.35em =\hskip0.35em {m}_o+\sqrt{K_pt} $$
TGA traces for the 200-hour exposure of IN718 and AM718R in air at 650 °C. The graphs show the mass gain with respect to area against the square root of time.
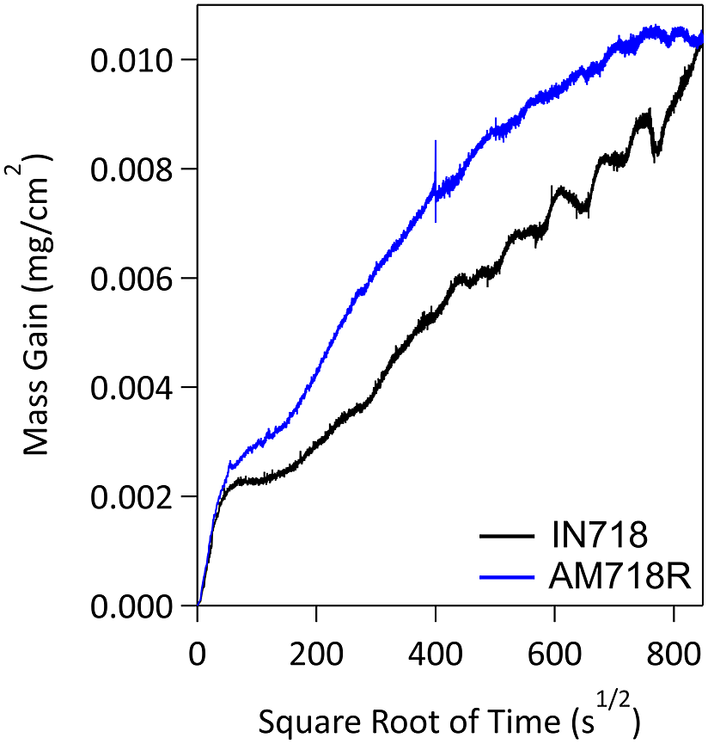
As the content of Cr was kept comparable to that of IN718 it was expected that the two alloys would have similar oxidation properties when exposed at the standard operating temperature of 650 °C. After 200-hours the mass gain was similar between the two samples, being 10.5 ± 0.2 μg cm−2 for IN718 and 10.9 ± 0.2 μg cm−2 for AM718R. The undulations that can be observed in the traces arise as a result of the day and night temperature variations affecting the buoyancy forces and therefore the measured weight at these extremely small mass gains. The spikes in the data could also be attributed to footfall near the equipment during working hours. A parabolic rate constant was calculated for both of the samples, excluding the initial transient region. For IN718 the constant was determined as 1.03 $ \times $
10−5 ± 5
$ \times $
10−5 ± 5 $ \times $
10−6 mg2.cm4.s−1 and for AM718R 1.19
$ \times $
10−6 mg2.cm4.s−1 and for AM718R 1.19 $ \times $
10−5 ± 5
$ \times $
10−5 ± 5 $ \times $
10−6 mg2.cm4.s−1. The comparable oxidation performance of AM718R to IN718 is highly encouraging. Maintaining performance comparable to IN718 is extremely important for this new system.
$ \times $
10−6 mg2.cm4.s−1. The comparable oxidation performance of AM718R to IN718 is highly encouraging. Maintaining performance comparable to IN718 is extremely important for this new system.
To gauge the mechanical properties of AM718R compared to IN718 the hardness and elastic modulus were measured at room temperature using a KLA iNano® series Nanoindenter. The samples used were in the 2-stage precipitation heat-treated condition and were mounted in Bakelite and polished using the metallographic protocol previously mentioned to a finish of 0.25 μm. Standard XP testing was carried out using a Berkovich tip with a depth limit of 1 μm, a load of 50 mN and a peak hold time of 10 seconds. The target strain rate was set at 0.05 s−1 and the allowable drift rate was set as 0.8 nms−1. Each test consisted of a matrix of 1 × 20 indents, with a spacing of 50 μm between indents. Prior to each test, a standard calibration on fused silica was carried out. Nanoindentation was carried out in both the arc-melted region and the laser-pass HAZ for the IN718 and AM718R samples. In each instance the data from each one of the 20 individual indents was used in the calculation of hardness.
In addition, the hardness and elastic modulus of LBP-DED IN718 were measured for comparison to the laser pass region on arc-melted IN718. The IN718 powder was prepared via gas atomization, yielding a powder with a log-normal particle size distribution of between 40–150 μm. Subsequent LBP-DED was carried out using a commercial set-up in line with current industry practices. A bilinear raster pattern was used with an overlap of half the laser diameter and a specific energy of 40 Jmm−1. The deposition parameters utilized were selected to improve microstructural uniformity and avoid the linear stacking trends that are observed as a result of co-linear and co-planar features (Markanday et al., Reference Markanday, Carpenter, Jones, Thompson, Rhodes, Heason and Stone2021). Column like samples were machined from the parent LBP-DED build using EDM. The samples were aged using a two-stage heat treatment that consisted of two 8-hour isothermal holds at 720 °C and 640 °C. Samples were mounted in Bakelite and polished using the metallographic protocol previously mentioned to a finish of 0.25 μm. Full details of the microstructure and properties of the LBP-DED IN718 have been given in a previous study (Markanday et al., Reference Markanday, Carpenter, Jones, Thompson, Rhodes, Heason and Stone2021).
The hardness and elastic modulus for LBP-DED IN718 was measured as 6.4 ± 0.3 GPa and 231 ± 7 GPa. These results are in good agreement with reports in the literature for hardness testing of IN718 to similar depths, and measured elastic modulus (Gong et al., Reference Gong, Wang, Cole, Jones, Cooper and Chou2015; Markanday et al., Reference Markanday, Carpenter, Jones, Thompson, Rhodes, Heason and Stone2021). The arc-melted regions in both samples gave highly variable results, which is to be expected with the length scales over which the microstructure varies. For IN718 in the hardness and moduli in this region were measured as 5.8 ± 1.5 GPa and 241 ± 8 GPa. The results in this region for AM718R were 5.8 ± 1.3 GPa and 243 ± 11 GPa.
The results for the laser pass region in both samples were more comparable to AM718R, with significantly less variability. For the IN718 the hardness and elastic modulus in the laser pass region were measured as 6.2 ± 0.2 GPa and 221 ± 8 GPa respectively. These results are comparable to that of LBP-DED IN718 and further demonstrate that laser pass testing can yield results comparable to additively manufactured material. For AM718R the analogous results were 6.3 ± 0.2 GPa and 216 ± 7 GPa, a marginal increase in hardness compared to IN718. This observation is excellent as it demonstrates that the AM718R system may have comparable or even improved mechanical properties when compared to IN718. The results further support that the designed AM718R system has advantages over convention IN718.
4. Conclusions
A neural network framework was used to design a Ni-based superalloy for LBP-DED repair applications. The composition of IN718 was used to confine the compositional design space considered by the neural network tool. A new Ni-based superalloy composition (AM718R) was identified that fulfilled the targets to surpass the contemporary IN718 phase stability, tensile strength, solidification strain, cost, and density. The properties of phase stability and solidification strain were prioritized due to their importance in additive manufacturing. Several properties of AM718R were experimentally verified using laser pass testing. The microstructure and properties of the laser pass region on the IN718 sample were comparable to that of additively manufactured IN718.
In comparison to IN718 the AM718R system:
-
1. Had a laser pass microstructure that was more refined and had a higher phase stability, with less Laves phase being observed to have formed. In addition, the processability was comparable to IN718 with a similar defect density observed.
-
2. Possessed an oxidation resistance comparable to IN718 at 650 °C.
-
3. Displayed a room temperature hardness that was marginally higher than that of IN718. This is indicative of comparable or indeed superior mechanical properties.
These results support the machine learning prediction that the designed AM718R system possesses improved properties compared to IN718 and would be a better candidate for LBP-DED repair applications.
Abbreviations
- DSC
-
differential scanning calorimetry
- EDM
-
electro-discharge machining
- HAZ
-
heat-affected zone
- HIP
-
hot isostatic pressing
- LBP-DED
-
laser-blown-powder directed-energy-deposition
- SE
-
secondary electron
- XRD
-
X-ray diffraction
- 718Plus
-
ATI 718Plus®
Acknowledgment
The authors would like to thank Dr. H. T. Pang for his assistance in data collection.
Author Contributions
Conceptualization: J.F.S.M., G.J.C., H.J.S.; Formal analysis: J.F.S.M., G.J.C., K.A.C.; Funding acquisition: G.J.B., C.P.H., H.J.S.; Investigation; J.F.S.M., G.J.C., J.T.P., L.C.; Methodology: J.F.S.M., G.J.C., J.T.P., L.C.; Resources: K.A.C., G.J.C., C.P.H., H.J.S.; Software: G.J.C., B.D.C.; Supervision: H.J.S.; Validation: J.F.S.M., G.J.C.; Visualization: J.F.S.M., G.J.C., B.D.C.; Writing—Original Draft: J.F.S.M., G.J.C.; Writing—Review & Editing: G.J.C., B.D.C., K.A.C., H.J.S.
Funding Statement
The authors acknowledge funding from the Engineering and Physical Sciences Research Council and from Rolls-Royce plc. G.J.C acknowledges funding from the Royal Society. The authors also wish to acknowledge the Henry Royce Institute for Advanced Materials, funded through EPSRC grants EP/R00661X/1, EP/S019367/1, EP/P02470X/1 and EP/P025285/1, for Aconity3D Mini access at The University of Sheffield.
Data Availability
The data that support the findings of this study are openly available in https://www.repository.cam.ac.uk


 Open access
Comments
No Comments have been published for this article.