

Methicillin-resistant Staphylococcus aureus (MRSA) remains a major public health concern despite improved compliance with hand washing, isolation precautions, and control of antibiotic use [Reference Lowy1, Reference Harbarth2]. Poor compliance with isolation precautions is not the only reason for the disappointing results obtained to eradicate this scourge, and alternative causes need to be identified. According to previous studies, MRSA clearance varies from 7 to 12 months [Reference Marschall and Mühlemann3–Reference Robicsek, Beaumont and Peterson5]. Readmission of asymptomatic MRSA carriers may, therefore, substantially contribute to the hospital reservoir, explaining the absence of a decrease in hospital prevalence of MRSA in many countries [Reference Scanvic4–Reference Robotham8]. Few studies have reported the rate of known MRSA patients who remain carriers on readmission, but none have assessed the respective weight of readmitted MRSA patients and new cases on MRSA colonization pressure in the hospital setting [Reference Scanvic4, Reference Robicsek, Beaumont and Peterson5, Reference MacKinnon and Allen7].
An electronic alert, identifying all MRSA carriers including new cases and previously known carriers who are readmitted to hospital, is a very useful tool in increasing the awareness of MRSA status by clinical wards and barrier nursing [Reference Evans9–Reference Kac12]. Such a computer alert system was set up in Hôpital Européen Georges Pompidou in 2003. Using this electronic system, we evaluated the contribution of known MRSA carriers to global MRSA colonization pressure over a 7-year period.
This study was conducted in a 850-bed, 23-ward acute-care teaching hospital (13 medical wards, six surgical wards, five intensive care units), with a mean annual number of 26 000 inpatients during the 2004–2010 study period. Antibiotic susceptibility testing for S. aureus isolates is routinely performed in the laboratory using the disk diffusion method on Mueller–Hinton agar (bioMérieux, France) according to the recommendations of the European Committee for Antimicrobial Susceptibility Testing [13]. Any S. aureus isolate resistant to methicillin is categorized as MRSA, and patients colonized and/or infected with a MRSA isolate are categorized as MRSA patients.
Once the MRSA status is known, the MRSA patient is placed in a single room. All staff members wear disposable aprons during care and perform hand rubbing with an alcoholic solution before and after direct or indirect contact with the MRSA patient. Gloves are required when contact with blood or body fluids is anticipated. A dedicated MRSA poster detailing all barrier isolation precautions is placed on the door of the patient's room. MRSA nasal screening (and for wound if necessary) is required: (i) for patients discharged from intensive care units and transferred to medical or surgical wards, (ii) for patients transferred from nursing homes or long-term care facilities, and (iii) for patients with chronic wounds. Previously identified MRSA patients are considered to still be carriers if they are readmitted within 3 months after discharge. In this case, no screening is required, and barrier isolation precautions are implemented. In contrast, wards are asked to collect a screening sample when the delay between discharge and readmission is >3 months; barrier isolation precautions are nonetheless implemented pending sample result. No change in screening policy occurred during the study period.
The knowledge of MRSA status by ward is mainly due to the electronic alert system [Reference Kac12]. Thanks to the laboratory information system, all initial MRSA isolates from diagnostic and screening samples, collected from inpatients and outpatients, are automatically included in a specific database. This database is automatically merged daily with the hospital's admission-discharge-transfer application. Three types of alert are therefore generated: one for new MRSA cases, one for MRSA patients transferred between wards, and one for all readmissions of known MRSA patients. Each alert is automatically emailed to the infection control team and the nursing team in charge of the patient.
From 2004 to 2010, 7346 alerts were generated by the computerized system for 1218 MRSA patients. New case alerts, transfer alerts and readmission alerts represented 14·4%, 11·1% and 74·5% of alerts, respectively, and concerned outpatients in 60·9% of cases. For the present study, only electronic alerts corresponding to new cases and readmitted inpatients were collected in a specific Access database (alerts corresponding to outpatients, i.e. patients attending the outpatient clinic, and transfer alerts were excluded). Thereby, 2058 alerts concerning 1060 patients were taken in account over the 7-year period. The number of alerts for each patient ranged from one to 18 with a mean of two alerts per patient. Among the 1060 patients, 574 patients were identified as new cases only, 154 were identified as readmitted cases only (because their first MRSA strain was isolated in the outpatient clinic and was not included in the study) and 332 were new cases who were subsequently readmitted.
According to median time of MRSA clearance reported previously [Reference Marschall and Mühlemann3–Reference Robicsek, Beaumont and Peterson5], the infection control team decided to exclude patients from the database when no positive MRSA sample could be found for 1 year. These patients could be re-included in the database as new MRSA cases if a new MRSA isolate was identified after 1 year. Thus, among the 906 new MRSA patients identified during the study period, 20 were counted twice, and two were counted three times for a total of 930 new case alerts (Table 1). The delay between two new case alerts for the same patient was <2 years for 17/22 patients, and the antimicrobial patterns of MRSA strains which resulted in several new case alerts for the same patient were different for only seven of the 22 patients (data not shown). This result suggests that when MRSA patients return to hospital a long time after discharge, and still remain a carrier, the persistence of the same strain appears to be the major mechanism encountered.
Distribution of 2058 MRSA alerts encountered in 1060 inpatients, according to type of alert and type of location
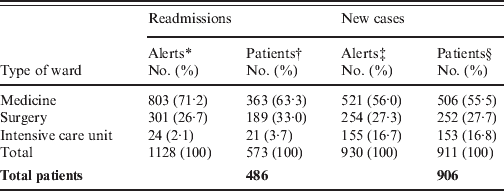
* Each alert counted correspond to the readmission of a MRSA patient in a clinical ward. The 486 MRSA readmitted patients accounted for 1128 patient-stays.
† Since the same patient could be readmitted in different wards for different stays, the total (573) is greater than the 486 MRSA readmitted patients.
‡ The number of new MRSA cases was 906, corresponding to 930 alerts. Twenty-two of these were excluded from the database due to absence of a MRSA-positive sample during one year, and re-included once (n = 20) or twice (n = 2) in the database for a new stay when a new MRSA isolate was found.
§ Since the same patient could be excluded from the database, and re-included in the database for a new stay in a different ward than the first, the total (911) is greater than the 906 MRSA new cases.
Among the 1060 MRSA patients, 486 (46%) were readmitted at least once, for a total of 1128 different stays (Table 1). This readmitted MRSA patient rate is similar to those calculated using a mathematical model [Reference Robotham8] and given by another automatic alert system associated with screening on readmission [Reference Scanvic4] (48·7% and 34%, respectively). Among these 486 patients, 332 (64·4%) were readmitted <3 months after discharge (Fig. 1), a result comparable to 73·6% of patients with a surgical site infection due to MRSA who were readmitted to hospital within 90 days after surgery [Reference Kaye14].
Distribution of intervals between discharge after the initial MRSA stay and the first readmission for the 486 readmitted MRSA patients.

The main purpose of this study was to assess the respective weight of new MRSA cases and readmitted MRSA patients on MRSA colonization pressure in hospital. Thus, the number of MRSA inpatients present each day was recorded. This included all patients with an active MRSA alert, i.e. new MRSA cases and readmitted known MRSA patients. The number of MRSA days was computed as the number of MRSA patients multiplied by the length of hospital stay. It was calculated for new MRSA cases and for readmitted MRSA patients (only from the first MRSA isolate until discharge for new MRSA cases). A mean of 20 MRSA patients were present in hospital each day, but ranged from six to 52, and eight to 40 according to the month and year considered, respectively (Fig. 2). The total number of MRSA patient-days was 34 575 corresponding to 2·5% of the 1 366 277 patient-days over the study period. For new MRSA cases, the number of MRSA patient-days ranged from one to 224 (mean 18 days, mode 8 days). For readmitted MRSA patients, the length of stay ranged from one to 218 days (mean 15 days, mode 7 days). Finally, the proportion of MRSA patient-days due to readmitted patients was 51·3% (17 737/34 575 days), confirming the major role played by this population in MRSA colonization pressure in hospital.
Assessment of MRSA colonization pressure in hospital. •, Each point corresponds to the mean monthly number of MRSA patients (new MRSA cases and readmitted MRSA patients) present in hospital each day. Numbers in dark grey boxes above the curves correspond to the annual average. ![]() , Each point corresponds to the mean monthly number of new MRSA patients discovered each day. Numbers in light grey boxes above the curves correspond to the annual average.
, Each point corresponds to the mean monthly number of new MRSA patients discovered each day. Numbers in light grey boxes above the curves correspond to the annual average.
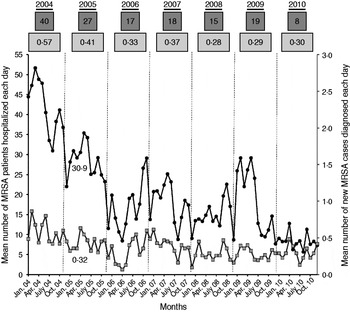
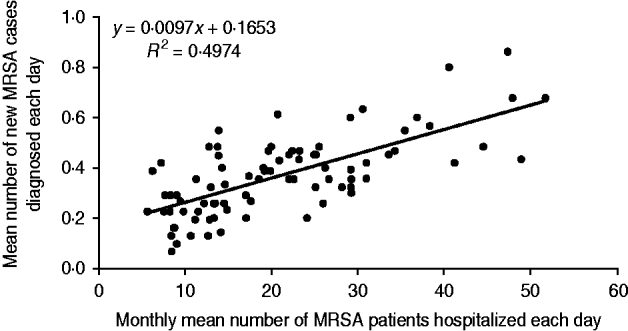
Our secondary objective was to assess the impact of MRSA patients present in hospital on the colonization of new patients by a MRSA strain. To achieve this, the mean number of MRSA patients hospitalized each day was compared to the mean number of new MRSA cases diagnosed each day (Fig. 2). For instance, in January 2005, the mean number of MRSA patients present each day was 30·9, and the mean number of new MRSA cases detected each day was 0·32. Using Spearman's method with Excel software, the correlation between the two datasets showed a linear regression coefficient (R 2) of 0·49 (Fig. 3). This means that the scatter of the ‘new MRSA case’ variable could be explained by MRSA colonization pressure in one half of cases. In fact, this was especially true during the 2004–2006 period, where the strong decrease (−57%) of MRSA patients present in hospital was associated with a significant decrease (−42%) of new MRSA cases (Fig. 2). In contrast, a relative stability was observed during subsequent years. The 2004–2006 period corresponded to the beginning of the electronic alert operation, and underlines efficiency of the system. Due to electronic alerts and early implementation of barrier isolation precautions, cross-transmission was limited and only MRSA background noise remained. Unknown imported MRSA cases and failure to control antibiotic use are other parameters that are probably responsible for new MRSA cases.
Regression curve between the monthly mean number of MRSA patients hospitalized each day and the monthly mean number of new MRSA patients discovered each day.
Our study has several limitations. It was a retrospective study utilizing the database used on a daily basis by the infection control team and clinical wards. Consequently, the MRSA colonization pressure rate raises a number of comments.
Due to poor compliance with the screening readmission sampling policy (only 20%) and the retrospective study design, MRSA carriage at readmission was not confirmed in all cases. The poor compliance can be explained by the high number of single rooms (85%) in our facility, allowing ease of isolation procedure implementation. Moreover, use of the electronic alert system meant that infection control measures were almost always set up quickly when an old MRSA carrier was readmitted [Reference Kac12]. In this context, the readmission screening sample was often omitted, unlike the isolation procedure. This could lead to overestimation of the MRSA colonization pressure rate since, in this study, all readmitted MRSA patients were assumed to be carriers.
However, about 64·4% of readmissions occurred within 3 months after discharge and, according to previous studies, probably almost all of these patients remained carriers [Reference Marschall and Mühlemann3, Reference Scanvic4]. For patients readmitted >3 months after discharge, all screening and diagnostic samples collected during the entire stay were reviewed. All of these patients were not sampled during their stay, but MRSA was isolated in 42% of them. This rate is similar to that reported in previous studies, ranging from 40% to 63% [Reference Scanvic4, Reference Robicsek, Beaumont and Peterson5, Reference MacKinnon and Allen7]. Furthermore, it has been shown that intermittent MRSA carriage is encountered in a significant number of MRSA patients [Reference Marschall and Mühlemann3, Reference Vriens15]. Finally, no systematic decontamination was practised in our facility. These elements suggest that the overestimation of the MRSA burden in relation to readmissions is probably low.
In contrast, absence of universal MRSA screening for all patients admitted to hospital could underestimate unknown MRSA patients arriving from the community. It is likely that parameters of over- and underestimation compensate for each other.
The study also has a number of strengths. It was conducted over a long period (7 years) and included a large number of patients. All MRSA patients present in hospital during the 7-year study period were included in the analysis, allowing comprehensive evaluation of the global MRSA burden in our hospital. The mean annual MRSA incidence computed on diagnostic samples during the study period was 0·7/1000 patient-days, i.e. 0·07% which is 35-fold lower than the MRSA colonization pressure rate. This suggests that the incidence, computed exclusively on positive MRSA diagnostic samples, does not accurately reflect colonization pressure.
In conclusion, this study, which used an electronic process to follow readmission of MRSA carriers, showed that a substantial proportion of MRSA patients present at hospital on a given day was due to the pool of readmitted MRSA patients. If not identified, these patients can be a major source of MRSA cross-transmission. Currently, electronic tools are essential to effectively combat the spread of MRSA by rapid identification of known MRSA carriers readmitted to hospital. In our facility, the effects of electronic alert implementation were noticeable.
DECLARATION OF INTEREST
None.


