





NOMENCLATURE
- 14,12R:
absolute measured ratio
- fm:
-
same as F14C
- dF14C:
-
uncertainty of an individual measurement or quoted error
- Bottom-up:
-
uncertainty approach represented by dF14C of a measurement
- Top-down (u expand):
-
long-term repeatability and bias
- bg:
-
background or blank
- cal:
-
calibrant, standard or reference material
- σ counts,rel:
-
relative standard error of the counts
 $$\left( {1/\sqrt {{N_T}} } \right)$$
. N
T
is the total counts
$$\left( {1/\sqrt {{N_T}} } \right)$$
. N
T
is the total counts - σ counts:
-
standard error of the counts in the absolute scale of 14,12 R
- σ bg-long term:
-
standard error of the background in the long term
- Δreplicates:
-
mean absolute deviation of the replicates of the same calibrant
- u Rw:
-
long-term repeatability, calculated from std. dev. of means of replicates of a calibrant
- Δreplicates u Rw:
-
repeatability, calculated from std. dev. of Δreplicates of a calibrant
- n:
-
number of individual replicates for a range of batches or measurement dates
- replicate size:
-
number of elements of a replicate set
- sample:
-
(statistics) data set or group of observations of a population
- pseudo u Rw (u pRw):
-
calculated from std. dev. of individual replicates of a calibrant
- u Rw, instrument:
-
each type of the above u Rw contains an instrumentation component as follows u Rw, instrument , Δreplicates u Rw, instrument and pseudo u Rw, instrument
- u Rw, graphite:
-
each type of the above u Rw contains a graphitization component
- u bias:
-
root mean square (RMS) of the biases of the mean of replicates relative to nominal
- u pbias pseudo bias:
-
RMS of biases of individual replicates relative to the nominal value
- u bias, combined:
-
every type of u bias is composed of the instrument and graphite combined components
- 14C sample:
-
material to be measured for 14C content
- ⟨ · ⟩:
-
mean

INTRODUCTION
In radiocarbon accelerator mass spectrometry (14C AMS), it has been observed that, most of the time, the quoted error for single measurements is an underestimation when comparing with replications of the same 14C sample (Boaretto et al. Reference Boaretto, Bryant, Carmi, Cook, Gulliksen, Harkness, Heinemeier, McClure, McGee, Naysmith, Possnert, Scott, van der Plicht and van Strydonck2002; Scott et al. Reference Scott, Cook and Naysmith2007). The underlying mechanism of this interesting discrepancy is still unknown. An empirical 14C sample-dependent error multiplier has been employed to increase the quoted errors to account for the “dark” uncertainty (Aerts-Bijma et al. Reference Aerts-Bijma, Paul, Dee, Palstra and Meijer2021). The current method of calculating the radiocarbon quoted error is by error propagation of uncertainties calculated from a measurement magazine or batch. This method, from a wider metrological perspective, follows the bottom-up approach of uncertainty measurement. The top-down approach is another widely used method in science. Its uncertainty is based on long-term variability of the measurand and usually this uncertainty is larger than the bottom-up uncertainty (Thompson et al. Reference Thompson and Ellison2011). It would be beneficial to the radiocarbon field to consider top-down components to obtain more realistic expanded quoted errors.
The bottom-up approach, as defined by the JCGM guide for uncertainty measurement, requires the determination of all the possible sources of uncertainty for an individual measurement (JCGM 1995). A measurand equation must be defined that accurately models the measurement by relating the value to be reported with the analytical instrument response, calibration and any other affecting variable as in Eq. (A1) of the supplemental appendix. Eq. (A1) includes the measured ratios (
14,12
R) of the blank (bg) and the reference material or standard calibrant (cal); in addition, isotopic fractionation correction using the drift of the stable isotope ratio (δ
13
C). The bottom-up uncertainty, shown in Eq. (1), combines the standard errors of: the counting statistics in
14,12
R scale (σcounts), measurement of
14,12
R of the blank and calibrant (σbg-long term, σcal) and measurement of the stable isotope (σδ13C). The standard error of the counts in the
14,12
R scale is calculated by
 $${\sigma _{counts}} = \; \left\langle {}_{}^{14,12}{R_{sample}} - {}_{}^{14,12}{R_{bg}} \right\rangle \; {\sigma _{counts,\;\;rel}}$$
where ⟨·⟩ is the symbol for average and in Eq. (1), ⟨·⟩ is the average of the passes means. σ
counts,rel
is the total counts (N
T
) relative Poisson error
$${\sigma _{counts}} = \; \left\langle {}_{}^{14,12}{R_{sample}} - {}_{}^{14,12}{R_{bg}} \right\rangle \; {\sigma _{counts,\;\;rel}}$$
where ⟨·⟩ is the symbol for average and in Eq. (1), ⟨·⟩ is the average of the passes means. σ
counts,rel
is the total counts (N
T
) relative Poisson error
 $$\left( {1/\sqrt {{N_T}} } \right)$$
. Eqs. (A1) and (1) are based on Aerts-Bijma et al. (Reference Aerts-Bijma, Paul, Dee, Palstra and Meijer2021) but the equations have been modified to include the symbol for the mean of means. Although this modification, both equations conserve their original form and an explanation has been included in the supplemental appendix. The equation of the bottom-up uncertainty comes from the law of error propagation that combines the partial derivatives of the measurand equation with respect to the different input variables of the measurement.
$$\left( {1/\sqrt {{N_T}} } \right)$$
. Eqs. (A1) and (1) are based on Aerts-Bijma et al. (Reference Aerts-Bijma, Paul, Dee, Palstra and Meijer2021) but the equations have been modified to include the symbol for the mean of means. Although this modification, both equations conserve their original form and an explanation has been included in the supplemental appendix. The equation of the bottom-up uncertainty comes from the law of error propagation that combines the partial derivatives of the measurand equation with respect to the different input variables of the measurement.
Bottom-up approach: error propagation of uncertainties of measurement variables
 $\begin{align}
{^{14}{C_{sample}}} & = \bigg\{ {\left( {{{{\sigma _{counts}}} \over {\left\langle{}_{}^{14,12}{R_{sample}} - {}_{}^{14,12}{R_{bg}}\right\rangle}}} \right)^2} + {\left( {{{{\sigma _{cal}}} \over {\left\langle{}_{}^{14,12}{R_{cal}} - {}_{}^{14,12}{R_{bg}}\right\rangle}}} \right)^2} \\
&\quad + {\left( {{{{\sigma _{bg - longterm}}{}_{}^{14,12}{R_{sample}} - {}_{}^{14,12}{R_{cal}}} \over {\left\langle{}_{}^{14,12}{R_{sample}} - {}_{}^{14,12}{R_{bg}}\right\rangle \left\langle{}_{}^{14,12}{R_{cal}} - {}_{}^{14,12}{R_{bg}}\right\rangle}}} \right)^2} + {\left( {{{2{\sigma _{{\delta ^{13}}{C_{sample}}}}} \over {1 + \left\langle{\delta ^{13}}{C_{sample}}\right\rangle}}} \right)^2}\\
&\quad + \left( {{2{\sigma _{{\delta ^{13}}{C_{cal}}}}} \over {1 + \left\langle{\delta ^{13}}{C_{cal}}\right\rangle}} \right)^2\bigg\} ^{0.5}{F^{14}}{C_{sample}}\end{align}
$
$\begin{align}
{^{14}{C_{sample}}} & = \bigg\{ {\left( {{{{\sigma _{counts}}} \over {\left\langle{}_{}^{14,12}{R_{sample}} - {}_{}^{14,12}{R_{bg}}\right\rangle}}} \right)^2} + {\left( {{{{\sigma _{cal}}} \over {\left\langle{}_{}^{14,12}{R_{cal}} - {}_{}^{14,12}{R_{bg}}\right\rangle}}} \right)^2} \\
&\quad + {\left( {{{{\sigma _{bg - longterm}}{}_{}^{14,12}{R_{sample}} - {}_{}^{14,12}{R_{cal}}} \over {\left\langle{}_{}^{14,12}{R_{sample}} - {}_{}^{14,12}{R_{bg}}\right\rangle \left\langle{}_{}^{14,12}{R_{cal}} - {}_{}^{14,12}{R_{bg}}\right\rangle}}} \right)^2} + {\left( {{{2{\sigma _{{\delta ^{13}}{C_{sample}}}}} \over {1 + \left\langle{\delta ^{13}}{C_{sample}}\right\rangle}}} \right)^2}\\
&\quad + \left( {{2{\sigma _{{\delta ^{13}}{C_{cal}}}}} \over {1 + \left\langle{\delta ^{13}}{C_{cal}}\right\rangle}} \right)^2\bigg\} ^{0.5}{F^{14}}{C_{sample}}\end{align}
$
The top-down approach combines the random and systematic effects on the reported value. Basically, the systematic effect or bias is determined by measuring secondary standards and comparing with the nominal or consensus value. The random effects are measured by long-term replications. The NIST (Possolo Reference Possolo2015) and the ISO norm for medical and clinical laboratories recommend the top-down approach (International Organization for Standardization 2019; Braga et al. Reference Braga and Panteghini2020). The most popular protocols for applying the top-down approach are the Nordtest (Magnusson et al. Reference Magnusson, Krysell, Sahlin and Näykki2011; Näykki et al. Reference Näykki, Virtanen and Leito2012) and the Eurachem (Ellison Reference Ellison2000). The ISO norm 11352 for water analysis is based on both approaches (International Organization for Standardization 2012). Interlaboratory comparison tests (Scott et al. Reference Scott, Cook and Naysmith2010) and intralaboratory proficiency tests are types of top-down approaches. In many fields of science, it has been observed that the uncertainty of the bottom-up approach trend to be smaller than the top-down (Burr et al. Reference Burr, Croft, Favalli, Krieger and Weaver2021) because there are unknown components that are not accounted. The repeatability of pure physical processes is resilient over the long term, but the case is different when chemical complex processes are involved (Thompson et al. Reference Thompson and Ellison2011) e.g., ionization and combustion/reduction for radiocarbon. Systematic errors affect the variability of the reported value because systematic errors, known or not, can change over the long term. Nevertheless, systematic errors are not considered on the calculation of the bottom-up quoted error. A more accurate report should include random and systematic effects as recently proposed by a unified theory of measurement errors and uncertainties (Huang Reference Huang2018). In this way, the bottom-up and the top-down approaches can be coherent. In radiocarbon studies, some long-term components have been taken into account like long-term repeatability and bias for only modern 14C samples (Miller et al. Reference Miller, Lehman, Wolak, Turnbull, Dunn, Graven, Keeling, Meijer, Aerts-Bijma, Palstra, Smith, Allison, Southon, Xu, Nakazawa, Aoki, Nakamura, Guilderson, LaFranchi, Mukai, Terao, Uchida and Kondo2013; Turnbull et al. Reference Turnbull, Zondervan, Kaiser, Norris, Dahl, Baisden and Lehman2015), blank long-term uncertainty, error multipliers and the error propagation for graphitization and chemical treatment (Scott et al. Reference Scott, Cook and Naysmith2007; Schuur et al. Reference Schuur, Druffel and Trumbore2016). It would be helpful to explore long-term uncertainty concepts which have been extensively applied by dedicated metrological laboratories.
Our hypothesis is to check if by including long-term random and bias effects, it is possible to infer more realistic linearly expanded uncertainties. The calculation has been applied to our graphite data acquired during 7 years using N2 stripper and 1 year after changing to He stripper. The quoted errors are compared with the uncertainty inferred from our top-down historical analysis to correct the discrepancy. The analysis was done until the graphitization level. Specific chemical treatment and field sampling levels were not considered.
METHODS
Bottom-Up Approach for Uncertainty Measurement
A computer script written in the R language (R Development Core Team 2013) was developed to automatically query, process and analyze graphite data from our database. The data was analysed by measurement batch (magazine). Every batch was already pre-processed by the MICADAS software BATS (IonPlus AG, Zurich, Switzerland) which saves the results in the database including the information of rejected cycles and passes. Blanks and calibrants with C mass lower than 0.8 mg were rejected by the R script. The calculations of the weighted mean were based on the calculations of BATS (Wacker et al. Reference Wacker, Christl and Synal2010) and the mean 14,12 R was corrected with the δ 13 C at every pass (Steier et al. Reference Steier, Dellinger, Kutschera, Priller, Rom and Wild2004). The final calculation consists of a mean of means method that groups the data by passes. Furthermore, the σbg-long term was taken as the blank uncertainty determined by a long-term top-down approach. The other uncertainties for the calibrant and δ 13 C were calculated as standard errors. These standard errors were calculated as the standard deviation of the passes means divided by the root of the number of passes (p).
The procedure mentioned above was applied automatically to every standard and blank of each batch combusted and graphitized by our EA (Elementar GmbH, Germany)–AGE (IonPlus) system. The R script was able to query the database batches within a specific range of measurement dates. Therefore, the R script was able to automatically analyze and pile up the results for all the calibrants from all the batches belonging to the dates when we used N2 stripper or He stripper.
Top-Down Approach for Uncertainty Measurement
The Nordtest is a well-known and easy to understand protocol. Third party researchers have applied it to 13C determination by NMR (Pironti et al. Reference Pironti, Cucciniello, Camin, Tonon, Motta and Proto2017) and to clinical studies (Cui et al. Reference Cui, Xu, Wang, Ju, Xu and Jing2017). The Nordtest expanded uncertainty (u expand ) is the quadrature sum of the long-term repeatability (u Rw ) and bias (u bias ) components (Eq. 2). Each component can be broken down into instrumentation and graphitization effects as shown in Eq. (3). This approach basically analyzes the variability of the reported F14C (fm) of historical replications. An R script was in charge of querying the reported values for any replicated blank or calibrant within a batch and for any non-replicated secondary calibrant. Our primary calibrant was Oxa2 (SRM 4990C, NIST) and the secondary calibrants were: Oxa1 (NIST), C5, C2, C7, and C6 (IAEA) (Le Clercq et al. Reference Le Clercq, van der Plicht and Gröning1997). The blank was sodium acetate (Sigma-Aldrich, No. 71180). After finding the replicates, outliers were rejected by a two-sided recursive Grubb’s method in which the data z-score was compared to a threshold value. Our z-score was calculated as: z =(fm–⟨fm⟩)/σ where the difference between the individual value and the mean of the data set is compared with the standard deviation of the data set (σ). Similar as Scott et al. (Reference Scott, Cook and Naysmith2010), our acceptance range was –2 to 2. We used the standard deviation of the data instead of the individual uncertainties or quoted errors because we wanted the top-down results to reflect the scatter only and to be independent of how the quoted error is calculated. The mean of each replicate set ⟨fm⟩ was calculated for all the batches. Then u Rw was calculated as the standard deviation of the replicates means ⟨fm⟩ for a specific calibrant as shown in Eq. (4) and illustrated in Figure 1.
 $${u_{expand}} = \sqrt {u_{Rw}^2 + u_{bias}^2} $$
 $${u_{expand}} = \sqrt {\left[ {u_{Rw,inst.}^2 + u_{Rw,graphite}^2} \right] + u_{bias,combined}^2} $$
Scheme of the calculations of the uncertainty of the top-down approach. The pseudo u Rw and pseudo u bias are basically bootstrap standard deviations or RMS factored by the number of individual replicates in the set.

The Nordtest protocol uses the replicates means ⟨fm⟩ in order to minimize the bias effect on the repeatability parameter u Rw . Statistically speaking, the replicate sets are statistics samples drawn from a population. The central limit theorem (Evans et al. Reference Evans and Rosenthal2004) tells that the standard deviation of the means of statistics samples can be approximated by the standard deviation of the population divided by the root of the sample size. In this paper, the sample size is the number of elements in the replicate set, usually 2 to 4. Thus, a pseudo u Rw (Eq. 5) was calculated as the bootstrap standard deviation of n individual replicates which approximates the standard deviation of the population and dividing by the root square of the replicate set mean size. n is defined in Figure 1. The pseudo u Rw has the advantage of having much more data points than the conventional u Rw . The conventional u bias was calculated for secondary calibrants and it is defined as a root mean square of biases of the means as in Eq. (6). The bias is the difference between each ⟨fm⟩ value with its respective nominal value. A pseudo bias (Eq. 7) was defined as the root mean square of the biases of the n individual replicate values for any primary and secondary calibrant, taking in account the mean size of the replicate sets. The conventional u Rw and u bias were not calculated for the primary calibrant Oxa2 because ⟨fm⟩ is fixed. Oxa2 can be used for the pseudo parameters because they measure the distribution of the individual fm values, not the ⟨fm⟩ value. The bias was not calculated for the blank because its true nominal value is unknown.
We had to select the right replicate type in order to estimate the instrument (u Rw,inst. ) and graphitization (u Rw,graphite ) uncertainty components. If the starting material (e.g., calibrant) was divided before combustion and the graphitized fractions were analyzed in the same batch then this replicate set was included to infer the combined graphitization+instrument components. If the starting material was divided after graphitization and measured in the same batch then it was used to infer the instrument uncertainty. The graphitization uncertainty was calculated as
 $$u_{Rw,graphite}^2 = u_{Rw,combined}^2 - u_{Rw,inst.}^2$$
For every calibrant material in our database, the n number of individual replicates for the combined uncertainty (n c ) was much smaller than the n number of individual replicates for the instrument uncertainty (n i ). This created a problem at the moment of comparing u Rw , u bias and their pseudo values for both replicate types in Eq. (3). The problem was that it is difficult to compare standard deviations and RMS of two data sets of very different n sizes also known as unpaired data sets (Mudelsee et al. Reference Mudelsee and Alkio2007). The bootstrapping technique solved this problem by resampling 1000 times the larger replicate data set (instrumentation) of size n i by taking random statistics subsamples with replacement of equal size as the smaller data set (n c ) and calculating the statistic of interest (e.g., u Rw or u bias ). Next, the 1000 values were averaged. The statistic of the smaller data set (instrumentation + graphitization components) was calculated conventionally using its whole data set.
For comparison, u Rw was also estimated based on the method of duplicates which has been applied to radiocarbon by e.g., Aerts-Bijma et al. (Reference Aerts-Bijma, Paul, Dee, Palstra and Meijer2021). The Δduplicates is the difference between the reported 14C content of duplicates. Instead, we used the Δreplicates concept calculated as the mean absolute difference (MAD) (Hyslop et al. Reference Hyslop and White2009) because we had many cases of triplicates and quadruplicates. Aerts-Bijma et al. (Reference Aerts-Bijma, Paul, Dee, Palstra and Meijer2021) analyzed the quotient of Δduplicates to quoted error. The collection of said normalized quotients from many batches leaded to a Gaussian distribution which standard deviation is equal to the error multiplier. However, we worked with the distribution of the absolute Δreplicates values (Thompson et al. Reference Thompson and Howarth1973) which leaded to half Gaussian curves due to the absence of negative Δreplicates. Δreplicates outliers were rejected by a one-sided recursive Grubb’s method. The Δreplicates u Rw was estimated as the zero-centered standard deviation of the Δreplicates, including the replicate size as:
 $$\Delta {\rm{replicates}}\,{u_{Rw}} = sd\{ \Delta {\rm{replicates}}\} {/\sqrt {\left\langle {{\rm{replicate\,size}}} \right\rangle}}.$$
RESULTS
First, a graphical illustration of the replicates and top-down approach of data accumulated during two years is explained. Next, we show how much the long-term repeatability of the top-down (average of Δreplicates u Rw and pseudo u Rw values) differs from the bottom-up approach also known as quoted error (dF14C population mean) in Figure 3a,b. The discrepancy is corrected by adjusting the σ bg-long term parameter of the bottom-up approach using 14C blanks. Then the three types of u Rw long-term uncertainties and two types of u bias are calculated for each type of 14C calibrant for their data accumulated during several years using N2 or He stripping. The plots of all the u Rw versus F14C lead to two groups, the instrumentation effect and the instrumentation combined with the graphitization effects. The two groups appear depending on how the calibrant material was treated and processed before measurement. The graphitization component is calculated from the quadrature difference of both groups. Finally, taking advantage of the linear trend of the plots of u Rw and u bias versus F14C; the instrumentation, graphitization and bias components are added in quadrature to obtain an expanded uncertainty for the 14C range from blank to Oxa2. This expanded uncertainty is compared with long-term repeatability studies from other laboratories.
Graphical Illustration of the Top-Down Approach
The reported F14C values calculated by BATS showed to be nearly identical to the R script calculation. This inspection was done for quality control purposes of our script. The quoted error (dF14C) is calculated with Eq. (1) which is based on the bottom-up approach. Eq. (1) is the complete propagation of the uncertainties corresponding to: the counts from the 14C sample, the calibrant 14,12 R, the blank 14,12 R long-term, and the δ13C of the 14C sample and calibrant. All these uncertainties except for the blank are calculated with the data of a specific batch as standard errors of the passes means. In the other hand, the top-down uncertainty is composed of the long-term repeatability and bias components. Each component can be further broken down into the instrumentation and graphitization components. For the top-down, another R script looked up the database for the F14C of replicates for the measurement dates corresponding to N2 and He stripping. Three types of repeatability parameters are calculated: u Rw , pseudo u Rw and Δreplicates u Rw ; and two types of bias: u bias and pseudo u bias . Each type of u Rw have instrumentation and graphitization components. Both type of u bias are calculated with the components combined.
Figure 2 is an illustration of the top-down approach where the long-term standard deviation is used for the pseudo u Rw . The zero-centred bootstrap standard deviation of the collection of the Δreplicates is used for the Δreplicates u Rw . The bias is the difference between the mean of each replicate set (thick line) to the nominal value and u bias is the mean effect of all the individual biases. All these parameters are calculated using the same raw data but applying different equations (Eqs. 4–7). Imagine, for a moment, a hypothetical case of a data with u Rw equal to Figure 2, but with zero biases on ⟨fm⟩. It will have all the replicates means aligned to the corresponding nominal value. In contrast, the scatter of the biases in the real case (Figure 2) decreases the certainty of the reported values comparing to the hypothetical case. Therefore, an accurate long-term uncertainty should include the quadrature addition of u bias as in Eq. (2). The primary standard Oxa2 is the only case equal to the described hypothetical case where the biases of ⟨fm⟩ are zero but each individual fm does have a bias. Another observation of the top-down approach is shown with the two sets of replicates indicated with red rectangles. The calculated Δreplicates values for both replicate sets are quite similar. However, their contribution to u Rw are quite different due to their different scatter around the global mean. We think that the information from the Δreplicates and u Rw are both important and complementary for the long-term repeatability. The number of selected data points and rejected outliers for the calculation of the pseudo and conventional parameters are shown in Table A1 of the supplemental appendix.
Example of the uncertainty of the top-down approach for N2 stripping and the C5 radiocarbon calibrant. The long-term range is for 2013 and 2020. Open circles are the reported F14C values for individual replicates. Dashed lines are the global mean and standard deviation ranges. Solid thin line is the nominal value. The solid thick lines contain the means of the replicate sets ⟨fm⟩ for each batch. Two examples of replicates are shown with red rectangles. (Please see electronic version for color figures.)

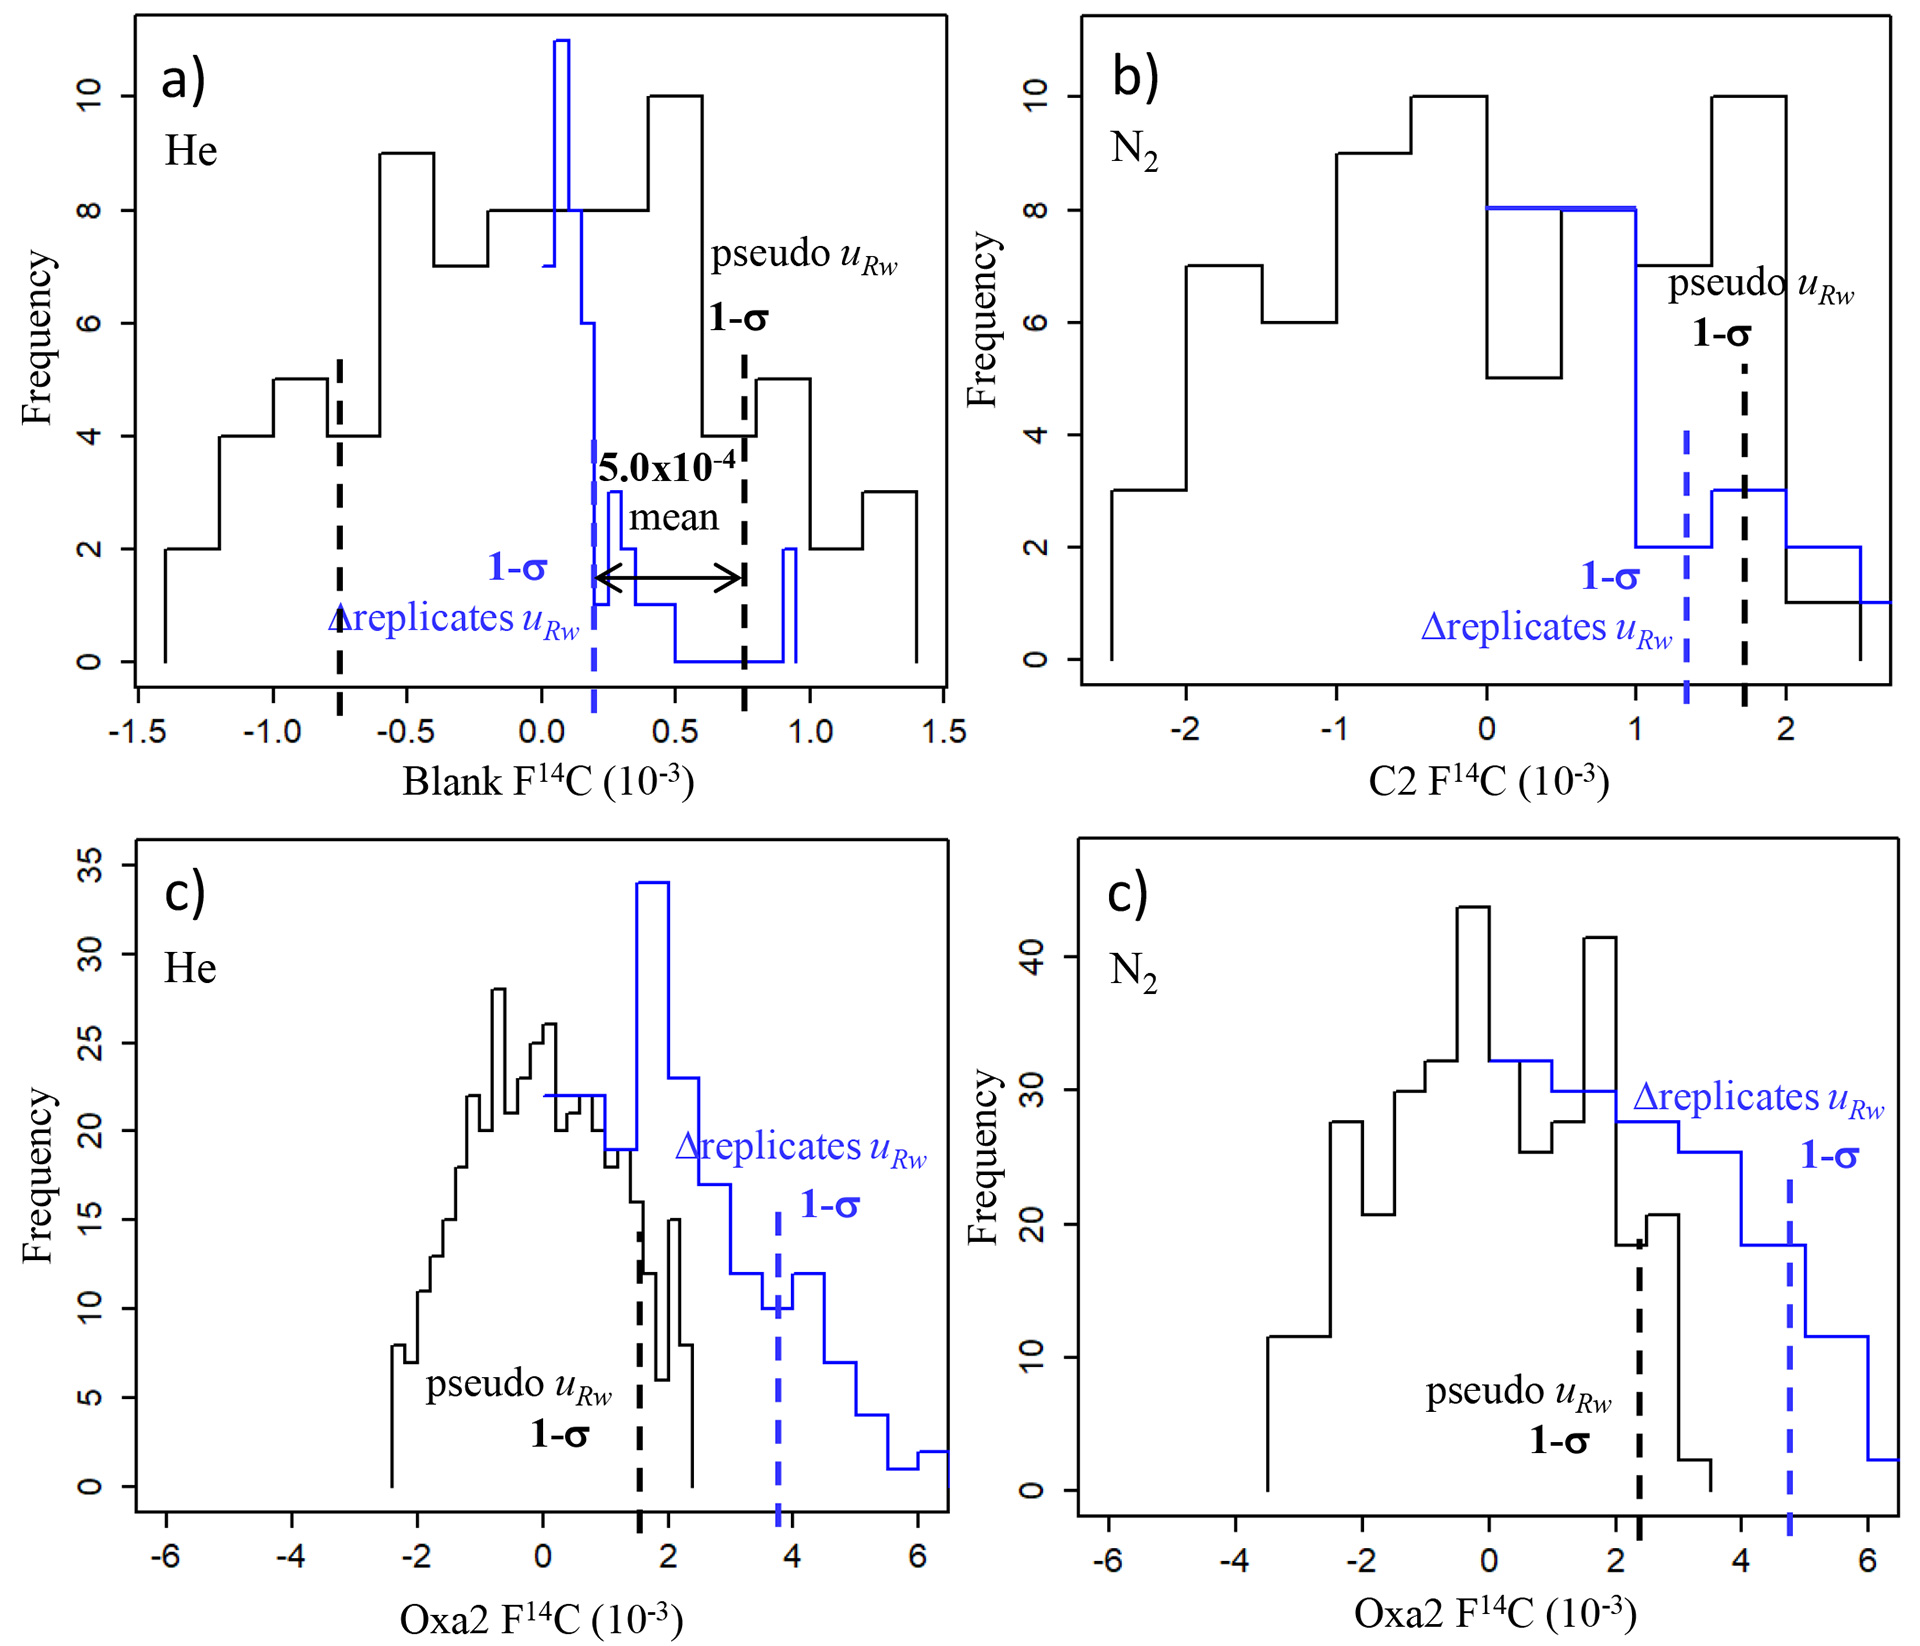
Histograms of bottom-up and top-down approaches. The data is a compilation of measurements for several years: a) Bottom-up approach for the blank at zero σ bg-long term . * is the dF14C distribution mean with value of 8 ± 2 × 10⁻⁵ for He and 1.0 ± 0.4 × 10⁻⁴ for N2. b) Long-term repeatability component of the top-down approach for the blank for N2 stripping. Half-Gaussian histogram for Δreplicates and zero-centred histogram of blank F14C values. Conventional u Rw is not included c) New bottom-up dF14C distributions for the blank with distribution mean (*) of 4.8 ± 0.1 × 10⁻⁴ for He and 7.6 ± 0.4 × 10⁻⁴ for N2 after correcting σ bg-long term . d) The bottom-up approach for Oxa2 showing its dF14C variation during several years. The distributions do not show much discrepancy with the top-down.

Correction of the Discrepancy between the Top-Down and Bottom-Up Approaches with the Blank
The main goal of this section is to compare and to approximate the average of the bottom-up to the average of the instrumentation repeatability using the blank. This need of equality between the bottom-up approach and the top-down approach without bias has been already pointed out for metrological labs by Horwitz (Reference Horwitz2003). The bottom-up is represented by the distribution mean of the dF14C quoted error. The instrumentation repeatability is represented by the 1-σ uncertainty of the F14C and Δreplicates distributions. Initially, the blank long-term uncertainty (σ bg-long term in Eq. 1) is set to zero. Figure 3a shows the distribution of the dF14C values of the population of blanks corresponding to each stripper gas. The dF14C distribution mean, for example, for N2 is 1.0 × 10⁻⁴. This result will be compared in the next paragraph with Figure 3b. Figure 3b shows a half-gaussian distribution of Δreplicates with 1-σ uncertainty of 4.0 × 10⁻⁴ which divided by the replicate size represents the Δreplicates u Rw . Figure 3b also shows a distribution of blanks F14C values with a global mean of 0.0031 and its 1-σ uncertainty (1.0 × 10⁻³) factored by the replicate size is the pseudo u Rw . The F14C distribution is centred to zero for visual purposes, so its scale fits the scale of the Δreplicates distribution. The statistics for the blank and the Oxa2 do not need bootstrapping because their instrumentation and combined components data sets are both similarly large. Figure 3b results tell us that 68% of the time, for N2 stripping, the F14C difference between blanks measured in the same batch should be 4.0 × 10⁻⁴ or lower and the F14C difference between blanks measured in different days or batches should be 1.0 × 10⁻³ or lower. The Δreplicates u Rw and the pseudo u Rw are two different ways of calculating the effect of the AMS instrument on the long-term repeatability for the top-down approach.
The mean of the two parameters, Δreplicates u Rw and the pseudo u Rw , is 7.0 × 10 –4 for N 2 while for He stripping, the mean is 5.0 × 10 –4 (Figure A1). In contrast, the bottom-up uncertainty (dF14C) of Figure 3a in average is lower (*1 × 10⁻⁴ for N2 and *8 × 10–5 for He). The quadratic difference between the long-term repeatability and the bottom-up uncertainty gives an approximate value of the σ bg-long term . Figure 3c shows the new histograms of dF14C after adjusting the σ bg-long term to 7.5 × 10⁻⁴ for N2 and 4.7 × 10⁻⁴ for He. Now, the new dF14C distribution means (*7.6 × 10 –4 for N 2 and *4.8 × 10 –4 for He) approximate to the average u Rw of the top-down long-term repeatability for the blank. The new dF14C distributions for Oxa2, shown in Figure 3d, can be characterized by the average and their 1-σ range. Basically, they cover (2.3–6.0) × 10–3 for N2 and (2.0–3.5) × 10–3 for He with averages of 4.1 × 10⁻³ for N2 and 2.9 × 10⁻³ for He. These Oxa2 dF14C averages approximate to the instrument top-down repeatability averages for the respective gases 3.1 × 10⁻³ for N2 and 2.3 × 10⁻³ for He as shown in Figure 4(a,b). Thus, Oxa2 practically does not present discrepancy between the top-down and bottom approaches. Actually, the Oxa2 distributions with or without σ bg-long term (data not shown) overlap each other because the σ bg-long term is too small to make a difference in the Oxa2 uncertainty range. In short, the application of the σ bg-long term magnitude is enough to approximate the bottom-up and top-down approaches for the blank. This is also true for the Oxa2 at the other side of the radiocarbon spectrum. It seems that the level of discrepancy depends on the 14C content.
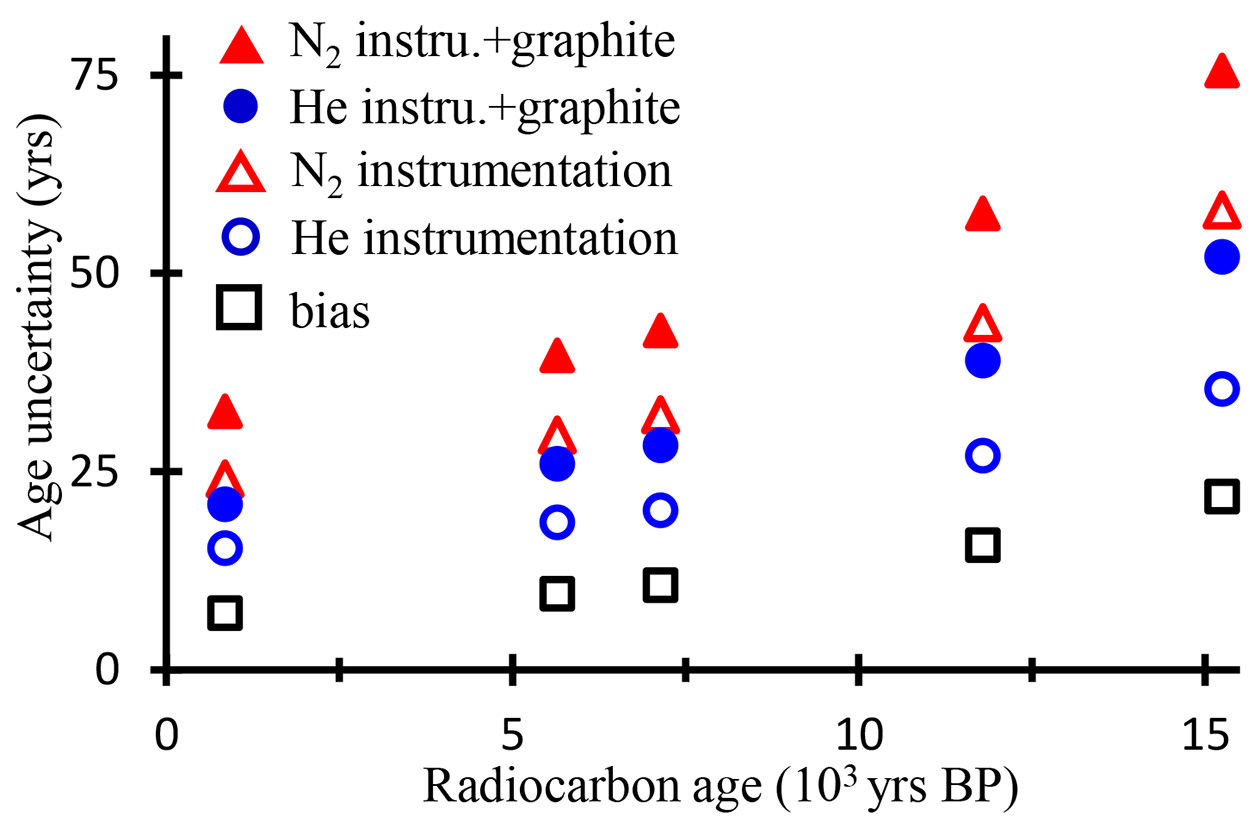
Summary of top-down approach for the graphitization and instrumentation components: (a) long-term component for N2 stripping. 1. black: conventional u Rw , 2. red: pseudo u Rw , 3. blue: Δreplicates u Rw . The arrow illustrates the graphitization vector. (b) long-term component for He stripping. Same color code as in (a). (c) bias combined component for both gases. (d) apportionment of the uncertainty components in radiocarbon age units.

We suppose that the difference between the uncertainties for the stripper gases is due to the higher target sputtering conditions for when N2 was used as stripper. The historical average passes per batch is 15 for N2 and 12 for He. Moreover, the average low-energy current is 55 μA for N2; and 44 μA for He. With these conditions, the Oxa2 targets registered in average 7.83 ± 1.80 × 10⁵ and 7.04 ± 1.42 × 10⁵ total counts per batch for N2 and He respectively. The blank registered 2.5 ± 1.0 × 10³ and 1.8 ± 0.7 × 10³ counts per batch for N2 and He respectively. This data tells that in order to fulfil our Oxa2 counting goal of ∼7 × 10⁵, the targets (blanks and Oxa2) needed to be sputtered during longer time and at higher sputtering intensity for the N2 stripper due to the difference in transmission efficiency with He. The more the target is sputtered, the more is the scatter of the 14,12 R and the δ13C throughout the batch analysis due to the physical change of the target. This beam distortion at the source is further amplified by the N2 angular straggling which is higher than the He straggling at their respective areal densities (Schulze-König et al. Reference Schulze-König, Seiler, Suter, Wacker and Synal2011). Probably, this 14,12 R within-batch scatter causes the inter-batch scatter, increasing the long-term scatter for N2 relative to He. The blank F14C repeatability seems to be very sensible to the stripper gas (Figure 3c). In contrast, the Oxa2 uncertainty is not very sensible to the stripper gas. For the Oxa2 distributions in Figure 3d, an overlapping area of 64% was calculated from their normalized density distributions using the package “overlapping” from the R program (Pastore Reference Pastore2018). Therefore, there is some degree of separation (36%) which means that the Oxa2 should have, 36% of the time, lower uncertainty for He stripping than for N2.
Reassessment of the Overall Uncertainty for 7 Years of Data Using Nitrogen or Helium Stripping
Figure 4 shows the result summary of the several types of long-term repeatability (u Rw ) and bias (u bias ) parameters. Pseudo u Rw and Δreplicates u Rw are basically calculated from the bootstrap standard deviation of the distributions shown in Figure 3(b) and A1 factored by the root of the replicate size. u bias is similar but using the root mean square. It is not possible to obtain the histogram for every data point in Figure 4 as the number of individual points is not always high. Table A1 shows that there are data points composed of as lows as 3 to 4 individual points. However, the error in calculating u Rw and u bias is the same as calculating the standard deviation of 3–4 points which is not uncommon in science. Figure 4 includes the instrumentation component and graphitization+instrumentation combined components of each of the three types of long-term repeatability u Rw . The instrumentation component is the effect of the AMS instrument alone. The graphitization includes the effect of combustion and reduction reactions. It is not necessary to break down the bias, thus it is calculated only for the graphitization+instrumentation combined effects. The idea is that the graphitization component can be inferred by subtracting the instrumentation component from the combined components. As it was explained for Figure 3, the bottom-up uncertainty was approximated to the instrument long-term repeatability component by adjusting the σ bg-long term parameter. This equality is not exact as it is an average but at least the order of magnitude is correct. The bottom-up uncertainty, usually referred as the quoted error, changes depending on individual measurements conditions. Nevertheless, the method is useful to infer the trend of the graphitization component.
The first objective of this section is to calculate the total expanded uncertainty as the quadrature sum of the instrumentation u Rw , plus the top-down graphitization u Rw plus the bias of the combined components as shown in Eq. (3). Figure 4(a,b) shows that the instrumentation and combined components can be expressed as linear fittings. Therefore, after subtracting both components using Eq. (8), the linear fittings for the graphitization u Rw component are: y = 2.4 × 10⁻³ x + 7.0 × 10⁻⁴ for N2 and y = 1.6 × 10⁻³ x + 6.0 × 10⁻⁴ for He. The graphitization equations are inferred not algebraically but by subtracting the combined and instrumentation components for each F14C value as illustrated in Figure 4(a,b) with an arrow at 0.9 F14C. Then, the linear fitting for graphitization is carried out. The subtraction yields the same result using relative or absolute values because the denominator of the relative forms are the same at each F14C data point. The graphitization uncertainty ranges corresponding to the radiocarbon range from blank to Oxa2 are (0.7 to 3.9) × 10–3 for N2 and (0.6–2.8) × 10–3 for He. The graphitization involves oxidation, reduction and handling which also adds uncertainty in the form of contamination and losses. The long-term repeatability for He stripping is considerably lower than for N2. The instrumentation component depends on the stability of the instrument and tuning; but also includes the 14C inhomogeneous concentration in the solid graphite target. After adding the bias component to the graphitization, the new linear fittings are
 $$y = {\rm{2}}.{\rm{5}} \times {\rm{1}}{0^{-{\rm{3}}}}x + {\rm{7}}.0 \times {\rm{1}}{0^{-{\rm{4}}}}\ {\rm{for }}\ {{\rm{N}}_{\rm{2}}}$$
 $$y = {\rm{1}}.{\rm{7}} \times {\rm{1}}{0^{-{\rm{3}}}}x + {\rm{7}}.0 \times {\rm{1}}{0^{-{\rm{4}}}}\ {\rm{for}}\,\,{\rm{He}}$$
In absolute F14C units, the graphitization+bias uncertainty ranges are (0.7 to 4.1) × 10–3 for N2 and (0.7–3.0) × 10–3 for He depending on the standard F14C. Then, in order to calculate the total expanded uncertainty, the bottom-up uncertainty (quoted error) can be added to the graphitization+bias. The total expanded uncertainty and its components apportionment are converted into radiocarbon age uncertainty as shown in Figure 4(d) and Figure A2 by using
 $$u\left[ {yrs} \right] = 8033u\left[ {{F^{14}}C} \right]/fm$$
.
$$u\left[ {yrs} \right] = 8033u\left[ {{F^{14}}C} \right]/fm$$
.
The results of Figure 4 have some scatter because this work was not actually designed as a long-term study; but rather we used the available replicates in the database. We have some measurement batches dedicated to replicates; however, the carbon mass, total 14C counts and beam currents were not dedicatedly controlled. Therefore, the results reflect our routine long-term output of processing standards with diverse characteristics. The measurement of the long-term combined components is weak because the data was only available for the blank and Oxa2. Figure 4 shows that the results of the pseudo parameters are close to the conventional u Rw and conventional bias. Thus, we think it is acceptable to include the pseudo parameters. The number of selected data points and rejected outliers for the calculation of the pseudo and conventional parameters are shown in Table A1 of the supplemental appendix. The y-axis scales in Figure 4 indicate that the magnitude of the bias component is just slightly smaller than the long-term repeatability. Therefore, the bias should not be ignored. Usually, the bias is considered to not increase the uncertainty of the measurement because it is a constant systematic error. However, it must be included if the bias randomly variates over time. The novelty of this work for radiocarbon is the application of a protocol that allows the calculation and apportionment of the bias as a variable separated from the repeatability; and the addition of both components as indicated by the top-down protocol. The use of the mean F14C (⟨fm⟩) of the replicates eliminates the bias effect on the repeatability calculation and eliminates random effects on the bias calculation as stated in the discussion and conclusions of Näykki et al. (Reference Näykki, Virtanen and Leito2012).
Comparison with Other Laboratories
If we define the error multiplier as the ratio between the total expanded uncertainty to the instrumentation uncertainty which approximates the quoted error then the ranges of the multiplier values are: 1.5–1.7 for N2 and 1.8–1.6 for He in the range of blank to Oxa2. The reason for the high error multiplier for He is the similar magnitude of the bias relative to the instrumentation. Without including the bias, the error multiplier range is 1.4–1.2 for He which is in agreement with Aerts-Bijma et al. (Reference Aerts-Bijma, Paul, Dee, Palstra and Meijer2021).
In Figure 5 and Table A2, we compare our results with other laboratories to assess the realism of our additive uncertainty expansion. Although the individual bottom-up quoted error of the measurements should be used for the expansion, we use the linear fit of the top-down instrumentation u Rw . This component is added to the graphitization u Rw and to the bias to obtain the long-term expanded uncertainty. Table A2-a compares our expanded uncertainties with Tables 2 and 3 in the report from the Alfred Wegener Institute (AWI) on long-term standard deviation of calibrants since approximately 2018 (Mollenhauer et al. Reference Mollenhauer, Grotheer, Gentz, Bonk and Hefter2021). Table A2-b is the comparison with the Table 3 in the report from the Centre for Isotope Research (CIO) on long-term factored expanded uncertainties for data obtained during 18 months since 2017 (Aerts-Bijma et al. Reference Aerts-Bijma, Paul, Dee, Palstra and Meijer2021). We refer to factored expanded uncertainty to the direct calculation of the error multiplier, in this case 1.4 for the graphitization component, as opposed to the linear additive expansion. Table A2-c is the comparison with Tables 2 and 3 in the Chronos Carbon-Cycle Facility (CHRO) report on long-term standard deviation of calibrants since approximately 2019 (Turney et al. Reference Turney, Becerra-Valdivia, Sookdeo, Thomas, Palmer, Haines, Cadd, Wacker, Baker, Andersen, Jacobsen, Meredith, Chinu, Bollhalder and Marjo2021). Table A2-d is the comparison with Table 1.6 for laboratories #5 and #8 in the FIRI report (Scott Reference Scott2003). Our work is about intralaboratory repeatability thus we selected intralaboratory results from FIRI. The data from laboratories #5, #8 fit well our results. We are using the fMC and F14C concepts interchangeably.
Comparison of our expanded uncertainty with long-term repeatability uncertainties (standard deviation) from diverse laboratories. The error bars of our expanded uncertainty come from the linear fitting confidence intervals.

We think that the reasons of the good fit of our expanded uncertainty with the repeatability of other laboratories are the advancement in AMS technologies and the efforts to uniform 14C sample graphitization (elemental analyzer). Chemical treatments effects were not taken in consideration in this paper. Other laboratories could implement the expansion by quadratically adding the graphitization+bias combined effect of Eq. (9) to their quoted error depending on the measured F14C.
As our expanded uncertainties come from the quadrature addition and subtraction of linear fittings in Figure 4(a–c), and each fitting has a confidence interval; thus, by quadratic sum of the confidence intervals, it is possible to assign a distribution range to the expanded uncertainties shown in Table A2 and in Figure 5 as error bars. Our expanded uncertainty is truncated for the fossil range (x∼0) at the value of 0.8 × 10⁻³ due to the constant effect of the intercepts. Uncertainty versus concentration plots that include an intercept have been observed by many researchers in diverse areas of metrology and science (Jiménez-Chacón et al. Reference Jiménez-Chacón and Alvarez-Prieto2009); and it is documented in the EURACHEM guide (Ellison Reference Ellison2000). In general, our results are in agreement with the results of other laboratories considering the very different circumstances and calculation methods. Our proposed method can close the discrepancy between the bottom-up and top-down approaches; therefore the expanded uncertainties are realistic.
CONCLUSIONS
A top-down protocol has been utilized to apportion the uncertainty into instrumentation u Rw , graphitization u Rw and bias components. For realistic purposes, the bottom-up approach (quoted error) is approximated to the instrumentation u Rw . Finally, the components are additively combined to obtain a more realistic expanded uncertainty. Therefore, in future, the individual quoted error can be expanded by adding the graphitization u Rw and bias depending on the F14C. In absolute F14C units, the graphitization+bias uncertainty ranges are (0.7 to 4.1) × 10–3 for N2 and (0.7–3.0) × 10–3 for He corresponding to the range from blank to Oxa2.
The σ bg-long term parameter allows to equate the bottom-up and top-down approaches for the blank. σ bg-long term is too small to change the Oxa2 bottom-up uncertainty; nevertheless, Oxa2 does not present discrepancy. It seems that the level of discrepancy depends on the 14C content.
The long-term repeatability of our AMS is much lower when using helium stripping than for nitrogen stripping for the blank and probably for other 14C samples with low 14C content. This demonstrate, from the repeatability point of view, that He stripping is better than N2.
The novelty of this work is the application of a protocol that allows the calculation and apportionment of the bias as a variable separated from the repeatability; and the addition of both components as stated by the top-down approach.
Our expanded uncertainties are in agreement with the repeatability of other laboratories considering the very different calculation methods. However, our expanded absolute uncertainty becomes truncated for fossil 14C samples. The error multipliers inferred from our expanded uncertainty also agree with previous studies.
Acknowledgments
We gratefully acknowledge the funding of the Berne University Research Foundation for the implementation of helium stripping for our MICADAS.
Supplementary material
To view supplementary material for this article, please visit https://doi.org/10.1017/RDC.2021.96




 Open access

