


Callous-unemotional (CU) traits are early-emerging personality features characterized by deficits in empathy, concern for others, and remorse following social transgressions (Frick & White, Reference Frick and White2008). These traits, which encompass the core affective and interpersonal traits of psychopathy, are associated with severe and persistent disruptive behavioral problems in childhood and adolescence, including aggression and delinquency, and pose a high risk for persistent aggressive and criminal behavior in adulthood (Barry et al., Reference Barry, Frick, Deshazo, McCoy, Ellis and Loney2000; Burke, Loeber, & Lahey, Reference Burke, Loeber and Lahey2007; Pardini, Reference Pardini2006; Pardini & Frick, Reference Pardini and Frick2013; Salekin, Brannen, Zalot, Leistico, & Neumann, Reference Salekin, Brannen, Zalot, Leistico and Neumann2006; Vasey, Kotov, Frick, & Loney, Reference Vasey, Kotov, Frick and Loney2005). Among the interpersonal deficits most consistently associated with CU traits are reduced behavioral and neurophysiological responsiveness to signs of others’ distress (e.g., fearful facial expressions) (Fanti et al., Reference Fanti, Kyranides, Georgiou, Petridou, Colins, Tuvblad and Andershed2017; Jusyte, Mayer, Künzel, Hautzinger, & Schönenberg, Reference Jusyte, Mayer, Künzel, Hautzinger and Schönenberg2015; Lozier et al., Reference Lozier, Cardinale, VanMeter, Marsh, Van Meter and Marsh2014; Marsh et al., Reference Marsh, Finger, Mitchell, Reid, Sims, Kosson and Blair2008; Sebastian et al., Reference Sebastian, McCrory, Dadds, Cecil, Lockwood, Hyde and Viding2014) as well as difficulty accurately interpreting these expressions (Dawel, O’Kearney, McKone, & Palermo, Reference Dawel, O’Kearney, McKone and Palermo2012; Marsh & Blair, Reference Marsh and Blair2008; Wilson, Juodis, & Porter, Reference Wilson, Juodis and Porter2011). However, because most neuroimaging studies of facial expression responding in CU youths feature passive viewing paradigms, there is little direct evidence linking how these expressions are interpreted by high-CU youths to their anomalous neural responses. The present study is the first to investigate neural responses to fearful facial expressions in different interpretative contexts in high-CU adolescents. We employed a novel data-driven approach to explore how variations in neural responding across interpretive contexts correspond to variations in CU traits.
High levels of CU traits are observed in approximately one-third of children with clinically significant conduct problems (Frick & Viding, Reference Frick and Viding2009; Mills-Koonce et al., Reference Mills-Koonce, Wagner, Willoughby, Stifter, Blair and Granger2015) and are consistently linked to atypical patterns of neural responding to a variety of fear-associated stimuli (Carré, Hyde, Neumann, Viding, & Hariri, Reference Carré, Hyde, Neumann, Viding and Hariri2013; Jones, Laurens, Herba, Barker, & Viding, Reference Jones, Laurens, Herba, Barker and Viding2009; Marsh et al., Reference Marsh, Finger, Mitchell, Reid, Sims, Kosson and Blair2008). Such stimuli include fearful facial expressions (Marsh, Reference Marsh2016), which serve important social functions that include signaling internal states of distress to others (Horstmann, Reference Horstmann2003), signaling vulnerability and appeasement to inhibit aggression or elicit care (Hammer & Marsh, Reference Hammer and Marsh2015; Marsh, Ambady, & Kleck, Reference Marsh, Ambady and Kleck2005), and promoting social learning about environmental threats (Hooker, Germine, Knight, & D’Esposito, Reference Hooker, Germine, Knight and D’Esposito2006; Olsson & Phelps, Reference Olsson and Phelps2007). High-CU youths and adults exhibit atypical responses to fear or other negative emotions expressed by the face, voice, or body, including reduced autonomic responding, reduced fear-potentiated startle, and impaired aversive conditioning (Blair, Reference Blair1999; Blair, Jones, Clark, & Smith, Reference Blair, Jones, Clark and Smith1997; Fanti et al., Reference Fanti, Kyranides, Georgiou, Petridou, Colins, Tuvblad and Andershed2017; Fanti, Panayiotou, Kyranides, & Avraamides, Reference Fanti, Panayiotou, Kyranides and Avraamides2016; Kimonis, Fanti, Goulter, & Hall, Reference Kimonis, Fanti, Goulter and Hall2017; Marsh et al., Reference Marsh, Finger, Schechter, Jurkowitz, Reid and Blair2011; Muñoz, Reference Muñoz2009; Rothemund et al., Reference Rothemund, Ziegler, Hermann, Gruesser, Foell, Patrick and Flor2012). High-CU individuals also consistently show atypical patterns of neural activation while viewing fearful expressions, including reduced amygdala activation and striatum (Carré et al., Reference Carré, Hyde, Neumann, Viding and Hariri2013; Jones et al., Reference Jones, Laurens, Herba, Barker and Viding2009; Lozier et al., Reference Lozier, Cardinale, VanMeter, Marsh, Van Meter and Marsh2014; Marsh et al., Reference Marsh, Finger, Mitchell, Reid, Sims, Kosson and Blair2008). However, less is known about where the stream of neural information processing of fearful faces in high-CU youths diverges from that of low-CU youths.
Information conveyed by faces is processed in distributed but overlapping systems of cortical and subcortical brain regions (Freiwald, Duchaine, & Yovel, Reference Freiwald, Duchaine and Yovel2016; Haxby et al., Reference Haxby, Gobbini, Furey, Ishai, Schouten and Pietrini2001; Ishai, Reference Ishai2008; Pessoa & Adolphs, Reference Pessoa and Adolphs2010). This information is systematically transformed from early representations in visual cortex (e.g., distinct facial features) to more complex, identity-specific representations in fusiform gyrus (e.g., combinations of features, then further reduced to aggregated, feature-invariant information) hierarchically along a posterior–anterior axis. Human neuroimaging finds evidence of activation to emotional faces along this hierarchy, including the visual cortex, fusiform gyrus (FFG), amygdala, superior temporal cortex, and more frontal interpretative regions that include the medial prefrontal cortex (mPFC), and lateral prefrontal cortex (lPFC; including the inferior, middle, and superior frontal gyri) (Sabatinelli et al., Reference Sabatinelli, Fortune, Li, Siddiqui, Krafft, Oliver and Jeffries2011). The amygdala plays a key role in coordinating adaptive responses particularly to fearful expressions and other fear-linked stimuli through its reciprocal connections with other subcortical (e.g., hypothalamus, periaqueductal gray, midbrain) and cortical regions (e.g., insula, subgenual cingulate, and medial and lateral prefrontal cortex) (Blair, Reference Blair2008; Davis & Whalen, Reference Davis and Whalen2001; Garvert, Friston, Dolan, & Garrido, Reference Garvert, Friston, Dolan and Garrido2014; Marsh, Reference Marsh2016; Robinson, Laird, Glahn, Lovallo, & Fox, Reference Robinson, Laird, Glahn, Lovallo and Fox2010; Rosen & Donley, Reference Rosen and Donley2006). Furthermore, functional coupling among face-selective regions shows evidence for hierarchical clustering roughly into three subnetworks likely corresponding to processing individual identity (e.g., inferior occipital gyri, FFG), retrieval of semantic knowledge (e.g., lPFC, inferior parietal sulci, supramarginal gyri), and representation of emotional information (e.g., mPFC, orbital frontal cortex, insula, superior temporal sulci, temporal pole) (Zhen, Fang, & Liu, Reference Zhen, Fang and Liu2013). These regions receive input from and send modulatory feedback to lower-level sensory areas, which may enable the derivation of socioaffective meaning from emotional face stimuli.
But despite this relatively comprehensive understanding of the brain networks underlying emotional face processing, little is known about how patterns of responses to fearful expression vary as function of CU traits along the cortical hierarchy. This is in part because interpretations of fearful expression are unconstrained in most neuroimaging studies. Because of the variable functions that fearful expressions serve, when these expressions are viewed in decontextualized settings, the signal of these expressions could be interpreted in multiple ways – for example, as a readout of an internal state (i.e., the expresser is afraid for themselves), as an effort to inhibit aggression (i.e., signaling that the expresser is afraid of the perceiver), or as a cooperative social cue (i.e., the expresser is signaling that they are afraid for the perceiver). This fact has several implications. For one, different subsets of participants (e.g., those with high- versus low-CU traits) may tend to interpret these expressions differently, which could contribute to inconsistencies in patterns of neural, physiological, and behavioral responding observed in response to them. In addition, CU traits may be more closely associated with atypical responses to fearful expressions in specific interpretative contexts. For example, CU traits may be more closely associated with atypical responses to fear when it is interpreted as an aggression-inhibition cue, given links between CU traits and failures to inhibit aggression despite the distress is caused (Cardinale & Marsh, Reference Cardinale and Marsh2015). This suggests the importance of understanding variation in neurophysiological responses to fearful expressions as a function of how these expressions are interpreted in high-CU youths.
The present study investigated whether adolescents with high-CU traits differentially respond to fearful facial expressions in each of three distinct contexts. Our primary aim was to explore whether variations in patterns of neural activation associated with viewing fearful facial expressions in these different contexts map onto variation in CU traits. To pursue this question, we employed a paradigm that presented participants with contextually-ambiguous fearful expressions as well as expressions for which the interpretive context is constrained (i.e., participants are instructed to interpret expressions as readouts of internal states) and measured blood-oxygenated level-dependent (BOLD) signal in a sample of adolescents with varying levels of CU during fMRI.
To analyze the resulting data, we conducted both univariate analyses and multivoxel pattern analyses that examined how idiosyncratic neural response patterns mapped onto differential intersubject models of CU traits. This allowed us to both assess the consistency of our results with past results obtained from univariate analyses and test novel questions such as whether high-CU participants show neural response patterns that are more similar to one another than low-CU participants. We employed a novel technique called Intersubject Representational Similarity Analysis (IS-RSA; Chen, Jolly, Cheong, & Chang, Reference Chen, Jolly, Cheong and Chang2020; Finn et al., Reference Finn, Glerean, Khojandi, Nielson, Molfese, Handwerker and Bandettini2020; Nguyen, Vanderwal, & Hasson, Reference Nguyen, Vanderwal and Hasson2019; van Baar, Chang, & Sanfey, Reference van Baar, Chang and Sanfey2019) that assesses how interindividual variability in multivoxel brain activity patterns relates to individual differences in behaviors or traits using second-order statistics (Kriegeskorte, Mur, & Bandettini, Reference Kriegeskorte, Mur and Bandettini2008). This approach leverages between-participant differences in CU traits and enables us to treat participant-level phenotypic differences as signal instead of noise (Foulkes & Blakemore, Reference Foulkes and Blakemore2018; van Baar et al., Reference van Baar, Chang and Sanfey2019). Specifically, we tested where multivoxel neural activity patterns associated with viewing fearful facial expressions in each of three contexts would be: 1) more similar among high scoring CU adolescents, but more dissimilar among all others; 2) more similar among low scoring CU adolescents, but more dissimilar among all others; and 3) more similar among adolescents who are very similar in their CU scores regardless of their absolute position on the scale, but more dissimilar for participants with dissimilar scores.
1. Method
1.1 Participants
The MRI sample consisted of 37 adolescents who varied in conduct problem severity and CU traits. Of the sample, 20 were assessed as exhibiting clinically significant CU traits; the remaining 17 adolescents did not exhibit significant levels of either CU traits or disruptive behavior. The sample included males and females aged 10 to 17 years old who were recruited from Washington, D. C. and surrounding areas through referrals, advertisements, fliers seeking both healthy children and children with conduct problems. All youths and a parent or guardian completed an initial screening visit to determine eligibility for the scanning portion of the study. During this visit, demographic and clinical assessments were conducted, including a test of cognitive intelligence (K-BIT, Kaufman & Kaufman, Reference Kaufman and Kaufman2004), and assessments of clinical symptomology using the Strengths and Difficulties Questionnaire (Goodman & Scott, Reference Goodman and Scott1999), Child Behavior Checklist (CBCL; Achenbach, Reference Achenbach1991), and the Inventory of Callous-Unemotional Traits (ICU; Frick & Ray, Reference Frick and Ray2015; Kimonis et al., Reference Kimonis, Frick, Skeem, Marsee, Cruise, Munoz and Morris2008) completed separately by parent and child. Participants were excluded based on the following criteria: full-scale IQ scores <80, history of head trauma, neurological disorder, parent report of pervasive developmental disorder, or magnetic resonance imaging (MRI) contraindications. In addition, no siblings were permitted to participate. Additional exclusion criteria for healthy controls included any history of mood, anxiety, or disruptive behavior disorders. Written informed assent and consent were obtained from children and parents before testing. Approval for all procedures was obtained from the Georgetown University Institutional Review Board.
Of this sample, four participants were excluded from analyses due to excessive motion during the MRI scanning and three participants were excluded from analyses for failing the attention checks during the task (>50% errors). The resulting sample consisted of 30 adolescents (M age = 13.33, SD = 2.29; 14 females; see Tables 1a and 1b). All participants were native English speakers.
Demographic and behavioral characteristics

Spearman ρ correlations among demographic and CU variables (N = 30)

**p < 0.001, *p < 0.05; ^imputed one question item as average of remaining responses for one subject due to blank data
1.2 Inventory on callous-unemotional traits
In accordance with standard procedures, ICU scores were calculated using the highest item response from either the child or parent for each item, which reduces susceptibility to social desirability biases and optimizes accuracy across multiple contexts (Frick et al., Reference Frick, Cornell, Bodin, Dane, Barry and Loney2003). Two subjects did not report an answer for a question item but their parents did, and one parent did not provide an answer for a question item but the subject did. For these instances, we used the only available item response. We also assigned “somewhat true” for two question items where one subject’s parent selected both “not at all true” and “somewhat true.” We then calculated a summary score of all item responses (ICU total) and each subscale (callous, uncaring, and unemotional) for each participant (Kimonis et al., Reference Kimonis, Frick, Skeem, Marsee, Cruise, Munoz and Morris2008). Internal consistency was high for the ICU total scale (α = .92), callousness (α = .82), and uncaring (α = .90) subscales, but low-to-moderate for the unemotional subscale (α = .49), which is commonly observed among studies (Cardinale & Marsh, Reference Cardinale and Marsh2017).
1.3 fMRI task
We adapted an experimental task from Palmer and colleagues (Reference Palmer2013), which comprised six runs. In the first two runs, participants viewed four 18-s blocks of rapidly presented fearful faces interleaved with four 18-s blocks of fixation for 3 min. During the fearful face blocks, faces were presented for 200 ms followed by a 300-ms fixation cross. The purpose of these baseline runs was to orient the participants to the fearful faces before presenting them in three experimental contexts. During the next four runs, participants again viewed 18-s blocks of rapidly presented fearful faces interleaved with 18-s blocks of fixation. During these runs, a 2000-ms cue appeared before each block that placed the faces in one of three contexts: “afraid of you,” “afraid for you,” or “afraid for themselves.” During this prompt, participants pressed one of three buttons corresponding to the condition to indicate that they had read and understood the context for the upcoming block. The interval between the offset of the cue and the onset of a face block pseudorandomly varied between 2500 and 3600 ms. Each contextualized block was presented twice per run for a total of six blocks of contextualized fearful faces interleaved with six blocks of fixation in each run. These final four runs of the task were 4 min 13 s each. The blocked design was selected to reduce cognitive load resulting from changing contexts (Figure 1).
Visualization of the fMRI Task. During the first two runs of fMRI, participants viewed 18-s blocks of noncontextualized fearful facial expressions (200 ms) and fixation (300 ms) interleaved with 18-s blocks of fixation (not depicted). During the final four runs, participants again viewed 18-s blocks of fearful facial expressions (200 ms) and fixation (300 ms) followed by 18-s blocks of fixation. Prior to each face block, a sentence appeared for 2000 s indicating that the “following people are all afraid… ‘FOR YOU’, ‘FOR THEMSELVES’, or ‘OF YOU’.” Participants were asked to press one of three buttons that corresponded to the instruction as an attentional check.

Face stimuli included fearful facial expressions from 24 different exemplar individuals from the Karolinska face database (Lundqvist, Flykt, & Ohman, Reference Lundqvist, Flykt and Ohman1998), selected because the actors in this database were between the ages of 20 and 30, which is younger than most facial expression sets. Faces presented in grayscale were normalized for size and luminance. Each individual face was presented in only one of the three context condition blocks (i.e., six identities per context). The other six identities were presented within the first two (baseline) runs.
1.4 fMRI data acquisition
MRI data were acquired on a 3.0 T Siemens TIM Trio MRI scanner (Erlangen, Germany), located at the Georgetown University Center for Functional and Molecular Imaging. The first two functional scans consisted of 72 contiguous T2*-weighted echo planar imaging (EPI) whole-brain functional volumes while the final four functional scans consisted of 102 T2*-weighted EPI volumes. All functional scan contained the following parameters: repetition time (TR) = 2500 ms; echo time (TE) = 35 ms; flip angle =90°, 43 slices, matrix = 64 × 64; field of view (FOV) = 240 × 240 × 129 mm3; acquisition voxel size = 3.75 × 3.75 × 3.00 mm3. A T1-weighted high-resolution anatomical image was acquired for coregistration and normalization of functional images with the following parameters: TR = 1900 ms; TE = 2.52 ms; flip angle = 9°; 176 slices; FOV = 176 × 250 × 250 mm3; acquisition voxel size = 1.00 × 0.98 × 0.98 mm3.
1.5 fMRI preprocessing and first-level analysis
Preprocessing was performed using fMRIPrep 1.3.2 (Esteban et al., Reference Esteban, Blair, Markiewicz, Berleant, Moodie, Ma and Gorgolewski2017, Reference Esteban, Markiewicz, Blair, Moodie, Ayse, Erramuzpe and Gorgolewski2018), which is based on Nipype 1.1.9 (Gorgolewski et al., Reference Gorgolewski, Esteban, Markiewicz, Ziegler, Ellis, Jarecka and Ghosh2019; Gorgolewski et al., Reference Gorgolewski, Madison, Burns, Clark, Halchenko, Waskom and Ghosh2011) and included anatomical T1-weighted brain extraction, head-motion estimation and correction, slice-timing correction, intrasubject registration, and spatial normalization to the Montreal Neurological Institute 152 Nonlinear Asymmetric 2009c Template. The data were smoothed using a 6 mm3 full-width half-maximum Gaussian kernel prior to first-level beta parameter estimation. Using Statistical Parametric Mapping (SPM12; https://www.fil.ion.ucl.ac.uk/spm/), a general lineal model (GLM) was constructed for each participant across each of the six runs using boxcar regressors for each of the three instruction prompts, three fearful faces conditions with contexts, six motion parameters, one fearful faces condition without context, and a constant regressor for each run. The resulting GLM was convolved using a canonical hemodynamic response function and corrected for temporal autocorrelations using a first-order autoregressive model. Lastly, a standard high-pass filter (cutoff at 128 s) was used to exclude low-frequency drifts. Subject-level beta maps are available in Supplementary Data.
1.6 fMRI univariate analysis
We first conducted a series of whole-brain univariate multiple regression analyses in SPM12 to examine how neural activation to fearful facial expressions varied as a function of CU traits. For each model, we controlled for age, gender, and IQ. A family-wise error (FWE) corrected threshold of p < 0.05 with >10 voxels per cluster at the whole-brain level was applied to all analyses. To address a priori hypotheses regarding the role of the amygdala in fearful face processing, we also applied small volume correction using an anatomically-defined bilateral amygdala parcel from the Harvard Oxford Subcortical Atlas (Desikan et al., Reference Desikan, Ségonne, Fischl, Quinn, Dickerson, Blacker and Killiany2006; Goldstein et al., Reference Goldstein, Seidman, Makris, Ahern, O’Brien, Caviness and Tsuang2007; Makris et al., Reference Makris, Goldstein, Kennedy, Hodge, Caviness, Faraone and Seidman2006) and conducted region-of-interest (ROI) analyses that averaged across voxels in the left and right amygdala.
Our first regression model examined the relationship between CU traits and activation during the first two baseline runs. The second regression analysis modeled how neural activation during the final four runs to fearful facial expressions varied across contexts (“afraid of you,” “afraid of you,” and “afraid for self”) and as a function of CU traits. We conducted each test for ICU total scores and subscale scores.
1.7 Searchlight intersubject representational similarity analysis (IS-RSA)
To test where multivoxel neural activity patterns associated with viewing contextualized fearful facial expressions corresponded to each of three models (high-CU alike, low-CU alike, and nearest neighbors), we employed IS-RSA (Chen et al., Reference Chen, Jolly, Cheong and Chang2020; Finn et al., Reference Finn, Glerean, Khojandi, Nielson, Molfese, Handwerker and Bandettini2020; Nguyen et al., Reference Nguyen, Vanderwal and Hasson2019; van Baar et al., Reference van Baar, Chang and Sanfey2019) using the NLTools package version 0.3.11 (Chang et al., Reference Chang, Sam, Jolly, Cheong, Burnashev, Chen and Frey2019) in Python 3.5.2 and the CoSMoMVPA Toolbox version 1.1.0 in MATLAB 2017a. We first constructed three intersubject models (30 subjects × 30 subjects symmetrical matrices) based on ICU total scores, with each cell corresponding to the models’ prediction of a subject pairs’ neural pattern dissimilarity based on their CU scores. The first two models were generated using the Anna Karenina principle that “all low (or high) CU scorers are alike; each high (or low) CU scorer is different in his or her own way” (Finn et al., Reference Finn, Glerean, Khojandi, Nielson, Molfese, Handwerker and Bandettini2020) according to the following formulas: the low-CU alike model was constructed using the maximum score for each subject pair; the high-CU alike model was constructed using 1 minus the minimum score for each subject pair. The third nearest neighbors model was constructed using the absolute value of the difference between subject pairs’ scores. Prior to constructing each model, all subjects’ summary scores were normalized relative to the maximum CU score in the sample. To investigate finer-grained patterns of CU traits, we also constructed a nearest neighbors model by calculating the Euclidean distance between subject pairs’ item-wise responses on the ICU. Each matrix consisted of 435 unique combinations of subject pairs (30!/2! × (30 − 2)!).
Next, we searched for brain regions that responded to fearful facial expressions similarly 1) among high-CU subjects, 2) among low-CU subjects, and 3) for subjects who were similar in CU traits in a relative rather than an absolute sense. We conducted this analysis using a spherical searchlight comprised of 100 voxels. For each task condition (baseline, “afraid for you,” “afraid of you,” and “afraid for self”), we created a 30 × 30 dissimilarity matrix in each searchlight in terms of the multivoxel activity pattern correlation distances (1 minus Spearman ρ) between all pairs of participants while they viewed the expressions in each context (again, 435 unique combinations). We assessed correspondence between the lower triangles of these matrices using a Spearman ρ correlation and assigned ρ values to the center voxel of each searchlight. Statistical significance was determined using a Mantel permutation test (Mantel, Reference Mantel1967; Nummenmaa et al., Reference Nummenmaa, Glerean, Viinikainen, Jääskeläinen, Hari and Sams2012), in which both the rows and columns of one subject × subject dissimilarity matrix (e.g., subject labels) were shuffled and the Spearman correlation between both correlation matrices was recomputed 1000 times to generate an empirical null distribution of rank correlations (Figure 2). For each searchlight, we calculated the p-value as the proportion of instances in which the permuted Spearman ρ statistic exceeded the true Spearman ρ statistic, and thresholded the resulting maps using a cluster-forming threshold at p < .005 and cluster-extent threshold at k = 10, and using a false-discovery rate (FDR) at q = .05.
Visualization of Searchlight Intersubject Representational Similarity Analysis. Searchlight Intersubject Representational Similarity Analysis (IS-RSA) consisted of the following steps: (1) We computed three subject × subject disimilarity matrices based on CU summary scores across subjects. The first matrix tested a model in which low scoring CU adolescents’ neural response patterns were more alike while all others’ were different from each other; the second matrix tested a model in which high scoring CU adolescents’ neural response patterns were more alike while all others’ were different from each other; and the third matrix tested a model where adolescents’ neural response patterns were similar to each other in a relative rather than an absolute sense. Depicted trait dissimilarity models are sorted by ICU total scores in ascending order. (2) For each condition (“Afraid for you”, “Afraid for self”, “Afraid of you”), we then computed a subject × subject neural dissimilarity matrix within 100-voxel searchlights across gray matter. (3) Again for each condition, we vectorized the lower triangle of each matrix and performed a Spearman ρ correlation at each searchlight between intersubject behavioral dissimilarity and intersubject neural dissimilarity matrices, and assigned the ρ statistic to the center voxel in the searchlight. (4) Statistical significance was determined using a Mantel permutation test, in which both the rows and columns of the subject × subject model dissimilarity matrix were shuffled and the Spearman correlation between both correlation matrices was recomputed 1000 times to generate an empirical null distribution of rank correlations. (5) At each searchlight, we calculated the p-value as the proportion of instances in which the permuted Spearman ρ statistic exceeded the true Spearman ρ statistic.

For each condition, we assessed the voxel-wise similarity between the nearest neighbors model constructed using subjects’ item-wise responses and the nearest neighbors model based on the absolute difference of subject pairs’ summary scores by conducting a Spearman rank correlation, list-wise excluding nonoverlapping voxels. Because these tests revealed significant similarity across voxels between models for all conditions (ρ baseline = .78, p < .0001; ρ ForYou = .76, p < .0001; ρ OfYou = .68, p < .0001; ρ ForSelf = .70, p < .0001), we opted to interpret results from the absolute difference nearest neighbors model across all conditions. We report findings using the Euclidean distance model in Table 2.
Table of searchlight IS-RSA results meeting significance threshold.

Note. Results are reported using a cluster-forming threshold at p < .005 and cluster-extent threshold at k = 10 with voxel size = 3mm3. + indicates a cluster surviving false discovery rate (FDR) correction at q = .05. ρ values represent the degree to which the specific cluster corresponds to the inter-subject model with positive values indicating higher correspondence and negative values indicating anticorrespondence. Regions were labeled using the Harvard Oxford Atlas, and organized by condition, intersubject model, positive-to-negative ρ values, and then posterior-to-anterior.
2. Results
2.1 Behavioral data
Age was neither related to ICU total nor any of the subscales (rs < .16, ps > .4). Gender was related to CU traits with males (M = 40.31, SE = 3.00) scoring higher than females (M = 30.79, SE = 3.75), t(28) = 2.00, p = .03. Males also had higher scores than females on the unemotional (t(28) = 1.70, p = .049) and uncaring (t(28) = 2.05, p = .025) subscales, and their scores trended higher on the callous (t(28) = 1.64, p = .056).
Behavioral data during the fMRI task consisted of adolescents’ responses to our attention-check questions in the final four runs of the fMRI task, where they pressed one of three buttons to confirm that they read and understood each prompt. The average accuracy score was 85.83% (SD = 2.72). A Poisson regression analysis controlling for age, gender, and IQ indicated no statistically significant association between number of errors and CU traits (ICU total) (β = .009, SE = .008, p = .29) or any covariates (.18 < p < .51).
2.2 Neuroimaging
2.2.1 Univariate
Our first analysis assessed how activation in response to fearful facial expressions varied as a function of CU traits using a traditional univariate approach across the whole-brain and within anatomically defined a priori bilateral amygdala masks. Multiple regression analyses revealed no statistically significant association between CU traits (total, callousness, uncaring, or unemotional) and neural activation to fearful faces at baseline when examining the whole brain. We found a significant main effect of activation to fearful faces versus fixation among all subjects in a small cluster in left visual cortex (13 voxels). Simultaneously, another multiple regression model predicting neural activation to fearful facial expressions across the different interpretative contexts found neither a significant effect of context nor an effect of CU traits. Applying small-volume correction in bilateral amygdala did not yield any findings across these two models.
Only when averaging across voxels in right amygdala did we find negative associations between mean activation and CU traits, controlling for age, gender, and IQ. During the “Afraid for Self” condition, we found associations between mean right amygdala activity and callousness (partial ρ = −.409, p = .02) and ICU total scores (partial ρ = −.349, p = .06). We present plots of mean activation as a function of CU traits for each context in bilateral, right, and left amygdala in the Supplementary Materials.
2.2.2 Intersubject RSA
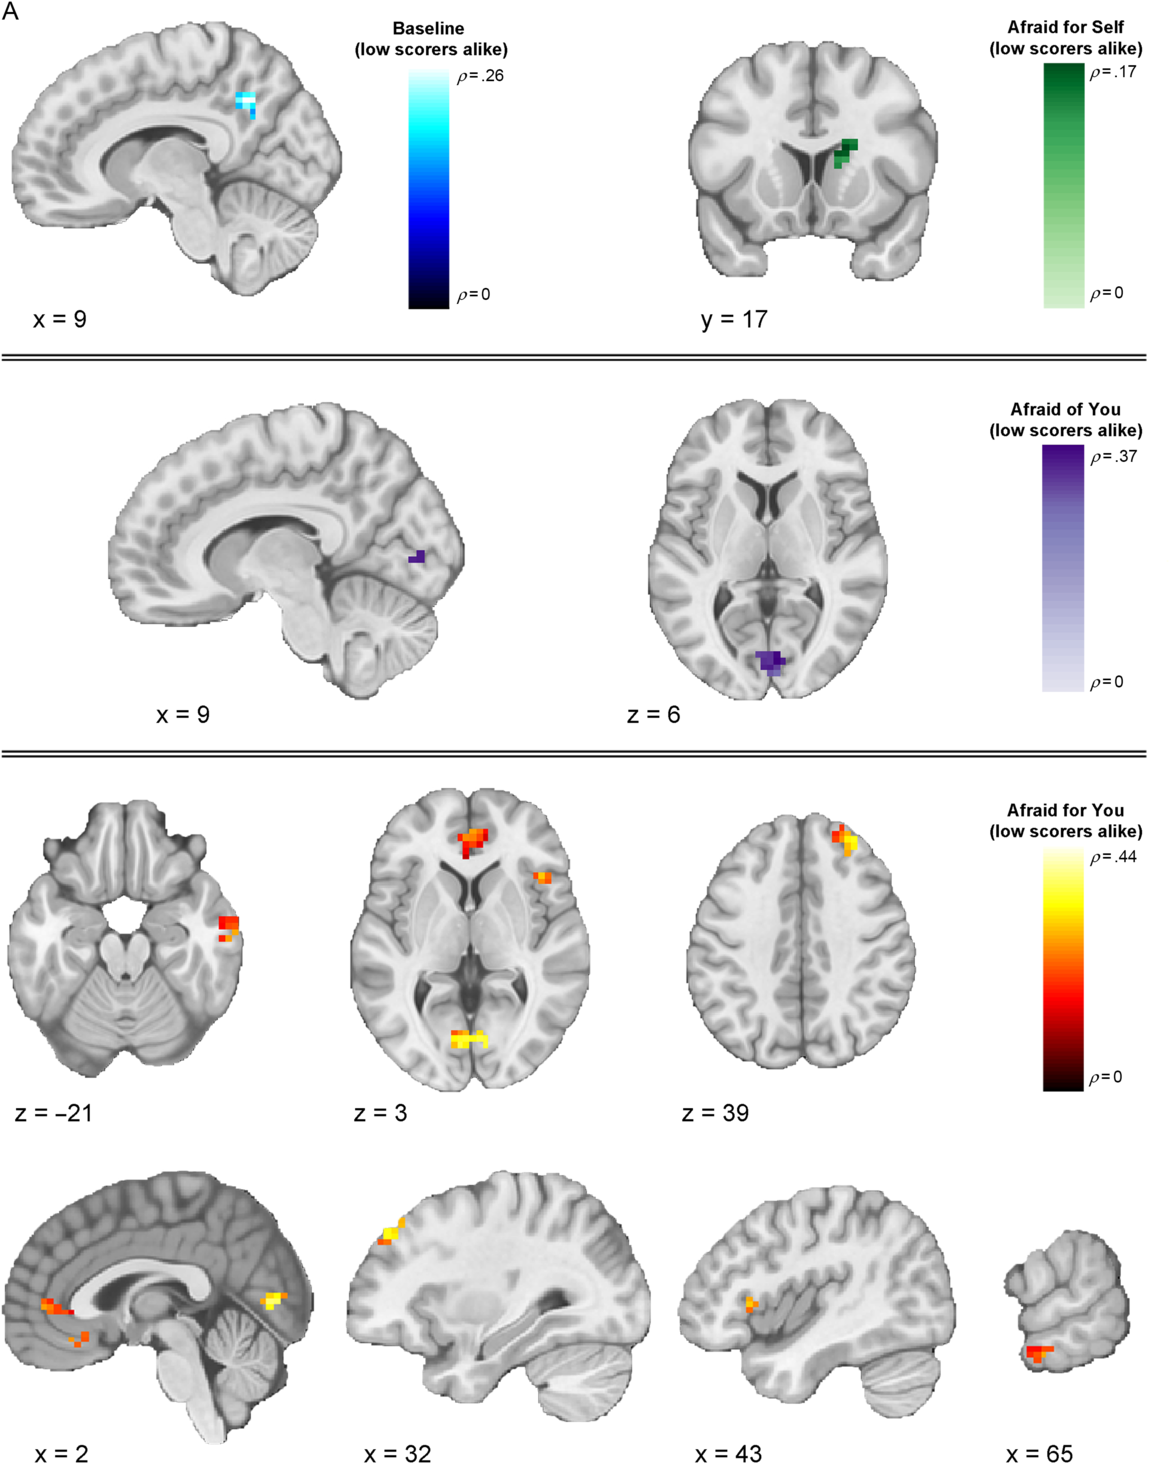
We next investigated whether multivoxel neural activation patterns associated with viewing fearful facial expressions in the different contexts would correspond to each of our three models (Table 2). Our first analyses focused on the baseline runs, during which the context was unspecified. Here, results from the IS-RSA revealed that a cluster in the precuneus (ρ = .257, p < .0001) exhibited an intersubject representational geometry where low-CU adolescents’ neural response patterns were similar while others’ were dissimilar during baseline fearful face viewing. A much larger set of clusters exhibited neural response patterns whereby high-CU adolescents’ neural response patterns were similar while others’ were dissimilar, including right posterior superior temporal gyrus extending to posterior superior temporal sulcus (pSTS) (ρ = .277, p < .0001), right middle temporal gyrus (MTG) (ρ = .168, p = .001), bilateral precentral gyrus (ρ = .266, p < .0001), left superior frontal gyrus (ρ = .247, p = .001), pars opercularis portion of the left inferior frontal gyrus (IFG) (ρ = .241, p = .002), left anterior STG (ρ = .227, p < .0001), and right postcentral gyrus extending to supramarginal gyrus (ρ = .177, p = .001). Finally, adolescents who are similar in CU traits, regardless of whether they were low or high, exhibited similar neural responses in regions that included right posterior MTG (pMTG) extending to pSTS (ρ = .409, p < .0001), right posterior inferior temporal gyrus (ρ = .200, p < .0001), and right MTG (ρ = .194, p = .003).
Our next analyses focused on response patterns during the cued contexts. When expressers were described as afraid for the viewer (“Afraid for you” condition), results from the IS-RSA revealed that specific regions exhibited an intersubject representational geometry where low-CU adolescents’ neural response patterns are similar while others’ are dissimilar. Identified brain regions included right intracalcarine cortex (ρ = .436, p < .0001), right frontal pole (ρ = .334, p < .0001), right frontal operculum (ρ = .292, p = .001), bilateral medial prefrontal cortex (ρ = .289, p = .004), right pMTG (ρ = .269, p < .0001), and bilateral paracingulate gyrus, extending to anterior cingulate cortex (ACC) (ρ = .263, p = .002). Results in this condition also showed geometry whereby high-CU adolescents’ neural response patterns were similar while others’ were dissimilar in regions including several early-visual stream areas: bilateral superior occipital cortex (ρ left = .230, p = .003; ρ right = .342, p = .001) and two clusters in right FFG (ρ = .551, p < .0001; ρ = .407, p = .005); and right cerebellum lobule VI (ρ = .242, p < .0001), right precuneus (ρ = .498, p < .0001), right posterior supramarginal gyrus (ρ = .399, p < .0001), right anterior supramarginal gyrus (ρ = .310, p < .0001), right superior parietal lobule (ρ = .273, p < .0001), pars opercularis portion of the right IFG (ρ = .270, p < .0001), and right middle frontal gyrus (ρ = .261, p = .001). Finally, among adolescents who were similar in CU traits, regardless of whether they were high or low on the scale, similar neural response patterns were observed in two clusters in the pars opercularis portion of right IFG (ρ = .283, p = .001; ρ = .188, p = .001), right temporoparietal junction (ρ = .262, p < .0001), two clusters in right FFG (ρ = .234, p = .001; ρ = .225, p < .0001), right aSTG (ρ = .222, p = .002), right ACC (ρ = .220, p = .001), right intracalcarine cortex (ρ = .214, p < .0001), and left posterior supramarginal gyrus (ρ = .206, p = .001)
When expressers were described as afraid of the viewer (“Afraid of you” condition), IS-RSA results revealed that low-CU adolescents’ neural response patterns were similar while others’ were dissimilar in right intracalcarine cortex (ρ = .368, p = .002). High-CU adolescents’ exhibited similar neural response patterns while others’ were dissimilar in left posterior cingulate cortex (PCC) (ρ = .411, p = .002). We did not identify any regions that corresponded to the nearest neighbor model in this condition.
In the “Afraid for self” condition (i.e., when expressers were described as afraid for themselves), right caudate was the only cluster that corresponded to the low-CU alike model (ρ = .174, p = .001). We did not identify any clusters meeting significance threshold that corresponded to the high-CU alike model. The only clusters that corresponded to the nearest neighbor model were the pars triangularis portion of the right IFG (ρ = .240, p < .0001), right angular gyrus (ρ = .233, p < .0001), and right frontal pole (ρ = .185, p = .001).
Regions showing a negative relationship with any of the models (clusters showing structure that is anticorrelated with the model) are listed in Table 2, but (for clarity) only clusters showing a positive relationship across models are displayed in Figures 3–5. Thresholded and unthresholded group-level statistical maps for IS-RSA are available in Supplementary Materials.
Thresholded IS-RSA Results (Low CU Scorers Alike Model). Visualization of clusters across conditions showing significant intersubject pattern response structure whereby low-CU adolescents were similar while all others were dissimilar. Clusters are thresholded at p < .005 and k = 10 (FDR-corrected results are reported in Table 2).
Thresholded IS-RSA Results (High CU Scorers Alike). Visualization of clusters across conditions showing significant intersubject pattern response structure whereby high-CU adolescents were similar while all others were dissimilar. Clusters are thresholded at p < .005 and k = 10 (FDR-corrected results are reported in Table 2).

Thresholded IS-RSA Results (Nearest Neighbors Model). Visualization of clusters across conditions showing significant intersubject pattern response structure whereby adolescents were similar in CU traits regardless of being low or high. Clusters are thresholded at p < .005 and k = 10 (FDR-corrected results are reported in Table 2).

3. Discussion
The present findings provide the first evidence that context-specific patterns of brain activity in response to fearful facial expressions align when people occupy similar positions in a phenotypic feature space of CU traits. IS-RSA identified how variations in adolescent- and parent-reported CU traits directly map onto variations in neural activation patterns associated with the context-specific interpretation of fearful facial expressions. Of note, we generally found activation patterns in regions implicated in low-level visual processing (e.g., occipital cortex), and the detection of personal threat from social cues (e.g., ACC) exhibited intersubject structure whereby low-CU adolescents were alike and others were dissimilar. By contrast, activation patterns in regions implicated in emotional face processing and perception (e.g., FFG, STG, pSTS) and higher-level social cognition (e.g., lPFC, mPFC, PCC, precuneus) more often showed intersubject structure whereby high-CU adolescents were alike while others were more dissimilar. These findings were highly right-lateralized, consistent with evidence for the right lateralization of emotional face processing and related socioaffective processes (Gläscher & Adolphs, Reference Gläscher and Adolphs2003; Hung et al., Reference Hung, Smith, Bayle, Mills, Cheyne and Taylor2010; Noesselt, Driver, Heinze, & Dolan, Reference Noesselt, Driver, Heinze and Dolan2005). CU traits also shaped patterns of responses to fearful expressions as a function of interpretative contexts, providing insight beyond prior findings of reduced amygdala responsiveness to these expressions (Byrd, Kahn, & Pardini, Reference Byrd, Kahn and Pardini2013; Cardinale & Marsh, Reference Cardinale and Marsh2017; Carré et al., Reference Carré, Hyde, Neumann, Viding and Hariri2013; Ciucci, Baroncelli, Franchi, Golmaryami, & Frick, Reference Ciucci, Baroncelli, Franchi, Golmaryami and Frick2014; Essau, Sasagawa, & Frick, Reference Essau, Sasagawa and Frick2006; Houghton, Hunter, & Crow, Reference Houghton, Hunter and Crow2013; Marsh et al., Reference Marsh, Finger, Mitchell, Reid, Sims, Kosson and Blair2008) – a finding that was partially replicated here, with CU traits linked to reduced univariate amygdala responsiveness to fearful expressions only when expressers were described as afraid for themselves.
In line with evidence from our univariate findings regarding the importance of contextual framing, our IS-RSA analyses for the first-time link intersubject similarities in neural response patterns to contextualized fearful expressions to differential intersubject models of CU traits. Two superordinate novel patterns emerged when youths varying in CU traits viewed fearful facial expressions across varying contexts. First, neural response patterns among low-CU adolescents became more idiosyncratic as emotional face information moved along the cortical processing hierarchy (as evidenced by the high-CU alike model). By contrast, neural response patterns aligned more among high-CU adolescents in regions along the entire cortical hierarchy, especially those that are implicated in social information processing, such as the FFG, STG, pSTS, PCC, and lPFC. These patterns may reflect these youths’ impairments in interpreting and responding to the social messages that fearful facial expressions convey. Second, these observations vary somewhat according to the context in which the fearful facial expressions are interpreted. Specifically, higher-order association regions exhibit intersubject neural activity pattern alignment even among low-CU adolescents when the context is specified. These findings align with recent work demonstrating the importance of contextual information for understanding emotional faces (Davis, Neta, Kim, Moran, & Whalen, Reference Davis, Neta, Kim, Moran and Whalen2016; Petro, Tong, Henley, & Neta, Reference Petro, Tong, Henley and Neta2018).
Using IS-RSA to investigate neural responding to fearful expressions, we found that intersubject neural response patterns reflected intersubject differences in CU traits, especially in contexts where the expressers were described as afraid for the participant (“Afraid for you” condition). For example, we found higher alignment for high-CU participants in right FFA (while other participants show more idiosyncratic patterns). Known for its role in face identity processing (Kanwisher, Reference Kanwisher2017; Kanwisher, McDermott, & Chun, Reference Kanwisher, McDermott and Chun1997), the right FFA also plays a role in emotion category discrimination, with selectivity for fearful facial expressions possibly resulting from feedback from the amygdala and mPFC, as suggested by findings from human fMRI and intracranial recordings (Harry, Williams, Davis, & Kim, Reference Harry, Williams, Davis and Kim2013; Ishai, Pessoa, Bikle, & Ungerleider, Reference Ishai, Pessoa, Bikle and Ungerleider2004; Kawasaki et al., Reference Kawasaki, Tsuchiya, Kovach, Nourski, Oya, Howard and Adolphs2012). The observed pattern alignment among multivoxel patterns in this region may underpin impairments in the category-based perceptions of fearful facial expressions in CU adolescents, potentially from disrupted modulation from the amygdala.
We also observed differential alignment across high- and low-CU adolescents in regions implicated in emotional appraisal and introspection, as well as defensive responses to threats. Also within the “Afraid for you” context, low-CU adolescents were more similar (and other adolescents were most dissimilar to each other) in regions that included mPFC and ACC. Previous studies have found that perspective-taking, emotional appraisal, and cognitive empathy tasks recruit mPFC in both adults (Bzdok et al., Reference Bzdok, Schilbach, Vogeley, Schneider, Laird, Langner and Eickhoff2012; Rameson, Morelli, & Lieberman, Reference Rameson, Morelli and Lieberman2012; Schurz, Radua, Aichhorn, Richlan, & Perner, Reference Schurz, Radua, Aichhorn, Richlan and Perner2014; Tusche, Bockler, Kanske, Trautwein, & Singer, Reference Tusche, Bockler, Kanske, Trautwein and Singer2016; Van Overwalle, Reference Van Overwalle2009) and adolescents (Sebastian et al., Reference Sebastian, Fontaine, Bird, Blakemore, De brito, Mccrory and Viding2012). For example, mPFC activation increases when adolescents perform tasks that require making inferences about social interactions (Kilford, Garrett, & Blakemore, Reference Kilford, Garrett and Blakemore2016; Sebastian, Burnett, & Blakemore, Reference Sebastian, Burnett and Blakemore2008; Vollm et al., Reference Vollm, Taylor, Richardson, Corcoran, Stirling, McKie and Elliott2006). mPFC is also functionally correlated with the amygdala during fearful face processing, which is compromised in CU individuals (Blair, Reference Blair2008; Breeden, Cardinale, Lozier, VanMeter, & Marsh, Reference Breeden, Cardinale, Lozier, VanMeter and Marsh2015; Marsh et al., Reference Marsh, Finger, Mitchell, Reid, Sims, Kosson and Blair2008). Evidence also demonstrates that ACC activates in response to threat-related stimuli (Bishop, Duncan, Brett, & Lawrence, Reference Bishop, Duncan, Brett and Lawrence2004), exhibits strong structural and functional connectivity with the amygdalae (Carlson, Cha, & Mujica-Parodi, Reference Carlson, Cha and Mujica-Parodi2013; Kim et al., Reference Kim, Loucks, Palmer, Brown, Solomon, Marchante and Whalen2011; Williams et al., Reference Williams, Das, Liddell, Kemp, Rennie and Gordon2006), and displays blunted responses to others’ distress in CU youths (Lockwood et al., Reference Lockwood, Sebastian, McCrory, Hyde, Gu, De Brito and Viding2013). Together, the present findings suggest a deficit within these regions among high-CU adolescents, particularly when viewing social cues that are contextualized as cooperative social signals.
Intersubject differences among subjects viewing fearful faces in the “Afraid of you” and “Afraid for self” conditions were less sensitive to the models testing relative and absolute differences among subjects. This could suggest that univariate patterns of activation better explain variation among CU adolescents within these contexts (particularly as we observed the stereotypical association between CU traits and reduced univariate amygdala response in the “afraid for self” condition). Notably, when expressers were described as afraid for themselves, we observed that low-CU adolescents were more similar (and all others dissimilar) in right caudate. Individual differences in activation to fearful facial expressions within this region has been linked to CU traits (Lozier et al., Reference Lozier, Cardinale, VanMeter, Marsh, Van Meter and Marsh2014), in which increased activation was related to lower CU traits. This finding in particular may reflect this region’s role in motivating prosocial approach towards relieving another’s personal distress (Schlund, Magee, & Hudgins, Reference Schlund, Magee and Hudgins2011).
3.1 Limitations
The reported findings should be considered in light of several limitations. First, our task was not selected for its ecological validity, but rather because the incorporated prompts allowed us to specify the context in which each expression should be interpreted. In the real world, of course, perceivers typically interpret others’ facial expressions using a larger variety of rich contextual cues and semantic information that require shifts in attention and reference to prior knowledge (Becker, Reference Becker2009). Future studies should explore how more naturalistic cues related to the context of emotional facial expressions shape responses to and interpretations of these expressions.
Our MRI session included six runs of passively viewed fearful facial expressions, such that attentional requirements of the task should be considered. While the initial two baseline runs oriented and habituated subjects to the fearful expressions, and attentional checks were included in the final four runs, it is possible that neural responses related to attention could vary as a function of CU traits. Mitigating this concern, however, is that we did not find a relationship between CU traits and accuracy in the attention checks. Our sample size also was limited by practical considerations and our goal of oversampling adolescents with moderate- to high- CU traits.
It is also important to note that greater similarity in neural activity patterns does not reflect increased or reduced activity. High similarity could occur if two participants exhibit different mean levels of activation in a given brain region if the participants covary in their multivoxel activity patterns similarly. Additionally, our study utilizes anatomically-aligned data across pairs of subjects, but evidence suggests that functional alignment (e.g., hyperalignment) can improve detection of individual differences (Feilong, Nastase, Guntupalli, & Haxby, Reference Feilong, Nastase, Guntupalli and Haxby2018). Our findings warrant further investigations to examine interindividual neural responses to the contextualization of fearful facial expressions in association with CU traits and other psychological constructs – particularly given the novelty of the approach.
It should lastly be noted that although CU traits are often understood to be a unitary construct, recent studies found that ICU subcomponents (which include uncaring, callousness, and unemotionality) exhibit divergent associations with external psychological and neural variables (Cardinale et al., Reference Cardinale, Connell, Robertson, Meena, Breeden, Lozier and Marsh2018; Cardinale & Marsh, Reference Cardinale and Marsh2017). In light of this, we calculated intersubject models for the ICU subscales separately and present these intersubject models in Supplementary Materials for comparison to the models constructed using ICU total scores.
4. Conclusions
Prior studies have consistently indicated disrupted neural responses to fearful facial expressions in CU youths, and found evidence that these disruptions are closely linked to the disruptive behavior characteristic of CU traits. Nonetheless, many questions remain regarding the nature of the observed disruptions. While some of these questions reflect the standard approaches to assessing responses to fearful expressions in CU youths, the present study observed more specific information about how CU traits disrupt responding to fearful expressions both by constraining the context in which the expressions were interpreted and applying a novel analytic approach that yields greater specificity in mapping CU traits onto patterns of neural responses. This work underscores the utility of using techniques that explore interindividual variation in behavioral and personality characteristics and multivoxel patterns of neural responding.
Data deposit
Data and code are available on the Open Science Framework at https://osf.io/bqdm5.
Supplementary material
To view supplementary material for this article, please visit https://doi.org/10.1017/pen.2020.13.
Acknowledgements
We would like to thank Luke J. Chang, Emily S. Finn, and the instructors and participants of the Methods in Neuroscience at Dartmouth (MIND) computational summer school 2018, for helpful suggestions, discussions, and feedback regarding intersubject representational similarity analysis. We would also like to thank the Georgetown Center for Functional and Molecular Imaging staff for all of their assistance with data collection.
Funding
This work was supported by the Eunice Kennedy Shriver National Institute of Child Health and Human Development (Grant R03 HD064906-01) to A.A.M, the National Science Foundation Graduate Research Fellowship Program Award to S.A.R., and the National Center for Advancing Translational Sciences Award (1KL2RR031974-01) to J.W.V. This work used the Extreme Science and Engineering Discovery Environment (XSEDE), which is supported by the National Science Foundation (Grant ACI-1548562).
Conflicts of interest
Authors have nothing to disclose.


 Open access

