





Governments across advanced welfare states face the challenge of balancing demands for social protection with fiscal discipline. For office-seeking politicians, the decision to retrench popular welfare state programmes in the name of balanced budgets requires strategic calculations. Whether, when, and to what extent governments pursue retrenchment depends on the proximity of elections, incumbents’ electoral vulnerability, and the competitiveness of specific races, among other factors (Abou-Chadi and Orlowski Reference Abou-Chadi and Orlowski2016; Hübscher Reference Hübscher2016; Hübscher and Sattler Reference Hübscher and Sattler2017; Pierson Reference Pierson1994; Zohlnhöfer Reference Zohlnhöfer2007). A central premise of this literature is the electoral connection: Voters sanction incumbents for welfare state retrenchment (Alesina, Carloni and Lecce Reference Alesina, Carloni and Lecce2011; Armingeon and Giger Reference Armingeon and Giger2008; Lee, Jensen, Arndt et al. Reference Lee, Jensen, Arndt and Wenzelburger2020). Yet while this assumption is central to research on the politics of social policy, evidence of a close connection between welfare state retrenchment and electoral outcomes is at best mixed. Where the electoral connection does find support, it is generally conditional on specific government types or partisan alignments. Recent assessments even find ‘no evidence for electoral consequences of welfare state changes’ (Ahrens and Bandau Reference Ahrens and Bandau2022, 1633).
To advance research on the political implications of social spending, we focus on the micro-foundations of policy-motivated voting. Our argument focuses on two features in particular. The first is the allocation of benefits. From labour market policy to old-age pensions and childcare, a single reform can create both winners and losers within the electorate. Aggregate spending measures are ill-equipped for summarising policy effects when their costs and benefits diverge across social groups (Bonoli and Natali Reference Bonoli and Natali2012; Häusermann Reference Häusermann2006, Reference Häusermann2010; Häusermann and Kübler Reference Häusermann and Kübler2010; Häusermann, Kurer and Traber Reference Häusermann, Kurer and Traber2019; Rueda Reference Rueda2007). Heterogeneity within national electorates complicates the task of linking changes in the distribution of welfare resources – rather than simple expansions or retrenchments – to shifts in popular support for governments. The second feature of note is economic vulnerability, a characteristic that affects how individuals perceive and respond to spending decisions across different welfare instruments. Unlike transient experiences of unemployment and economic hardship, vulnerability reflects a chronic state of financial insecurity.
We test implications of the argument on the case of old-age pensions. Pensions occupy a central position in contemporary welfare states, often accounting for the largest share of government budgets in affluent democracies (Fernández, Wiß and Anderson Reference Fernández, Wiß and Anderson2024). As life-course-oriented programmes, old-age pensions are characterised by a long-term time horizon, providing benefits that are temporally distant yet prolonged (Jensen Reference Jensen2012; Naumann, Buss and Bähr Reference Naumann, Buss and Bähr2016). This stands in contrast to the immediate, though typically short-lived, benefits from family, unemployment, and health policy schemes. One’s position as net contributor or net beneficiary from pension schemes is therefore shaped by structural economic vulnerability over the life cycle rather than by brief spells of unemployment or spates of economic hardship.
These features of pension systems inform our expectations with respect to public preferences and government support. The first concerns preferences over how spending is allocated. Individuals shielded from economic vulnerability stand to gain from ‘standard’ old-age pensions that allocate benefits based on contributions. Those who are habitually exposed to economic vulnerability should instead prefer to allocate spending toward benefits according to need. This preference stems from two factors: (i) their contributions are modest, irregular, or both, and (ii) they are less likely to have access to private pension funds. These expectations for preferences over the distribution of pension resources inform a second set of expectations for government support: citizens hold policymakers accountable for how spending is allocated, especially in contexts of heightened economic insecurity.
Cross-national analyses reveal that individuals facing high levels of economic vulnerability are more likely to support pension systems which prioritise redistribution toward the less well-off over those that allocate benefits proportional to contributions. This micro-level analysis sheds light on how exposure to risk matters for beliefs over what constitutes fair pension provision. Examining government job approval over time, we show in a second analysis that the electoral consequences of pension spending retrenchment depend on the distributional profile of pension spending – as identified in the analyses of individual preferences – in combination with the perceived salience of economic insecurity. We find that cuts to needs-based pensions are more electorally costly when such insecurity is high. In short, public responses to changes in old-age pensions hinge not simply on generosity, but on how spending is allocated and how this allocation interacts with broader economic vulnerability.
More broadly, our study highlights the strategic considerations underlying welfare state retrenchment. Drawing on the key case of old-age pensions – a policy considered to be universally popular – we show that preferences over how spending is allocated vary systematically with individuals’ exposure to economic vulnerability. By tracing how the composition of pension spending interacts with both individual and contextual vulnerability, we advance comparative welfare state scholarship by foregrounding the distributional consequences of welfare policy and refining theories of policy-motivated accountability.
Winners and losers of old-age pension spending
Old-age pensions offer a compelling example of the heterogeneous effects of spending on social policy. Pension schemes have the capacity to retrench existing levels of standard benefits while simultaneously expanding coverage to target new social needs (Häusermann Reference Häusermann2010). This dual capacity highlights the cross-cutting interests that policymakers must navigate when representing diverse social groups. At the same time, old-age pensions enjoy broad-based popularity. Unlike other groups targeted for means-tested assistance, the elderly are widely viewed as having legitimate needs; thus, support for channelling financial assistance to this demographic is widespread (Bremer and Bürgisser Reference Bremer and Bürgisser2023; Huddy, Jones and Chard Reference Huddy, Jones and Chard2001). These characteristics make old-age pensions a difficult test for our expectation of a heterogeneous electoral response to changes in spending allocation, as support for this policy area is typically assumed to be high and evenly distributed across the electorate.
Pension benefits and coverage expanded across industrialised democracies in the decades following the second world war. These systems were generally tied to the male breadwinner model, with benefits conditional on full-time, continuous employment (Bonoli Reference Bonoli2005). Yet, as with welfare models writ large, pension schemes varied in their entitlement bases, benefit principles, and the degree of employer involvement (Ebbinghaus Reference Ebbinghaus2011; Esping-Andersen Reference Esping-Andersen1990; Korpi and Palme Reference Korpi and Palme1998). Minimum or means-tested programmes allocated benefits based on need, while broad-based social insurance models provided universal benefits based on citizenship. The social and economic transformations of the late 20th and early 21st centuries disrupted the internal logic of these schemes. The growing participation of women in the labour market and the rise in nonstandard employment introduced long-term economic disparities and resulted in lower old-age pension entitlements for these groups (Bonoli Reference Bonoli2003). Existing schemes penalised workers for career interruptions due to infant care, part-time and temporary work, and frequent spells of unemployment. Compared to those in full-time, stable employment, workers with nonlinear or precarious career trajectories accrued significantly lower pension rights.
Many governments responded to labour market changes by expanding pension coverage and targeting new social risks. Policy measures included pension credits for childcare, pension splitting between spouses, minimum pensions for individuals with career breaks, and the extension of occupational pension coverage to low-income and part-time employees (Anderson and Meyer Reference Anderson, Meyer, Armingeon and Bonoli2006; Häusermann Reference Häusermann2010). However, these policy adaptations often occurred alongside the retrenchment of existing benefit levels or standard pensions. Typical adjustments to pension rules combined cuts to contribution-based benefits with targeted expansions of needs-based schemes. For example, Switzerland’s 1995 reform increased the retirement age while introducing credits for child-rearing and contribution sharing between spouses (Bonoli Reference Bonoli and Pierson2001). Similarly, Sweden’s reforms in the 1990s reduced pension entitlements for white-collar employees but introduced contribution credits for people with career interruptions due to childcare or periods of unemployment (Anderson Reference Anderson2001). Meanwhile, in the United Kingdom, reforms targeted poverty and inequality by expanding public pension coverage while simultaneously creating space for private sector development (Bridgen and Meyer Reference Bridgen and Meyer2018).
These patterns of reform – where expansions in coverage often come alongside benefit retrenchment – reflect broader trade-offs in pension policy. Figure 1 offers a comparative overview of how governments navigate these trade-offs, illustrating the generosity of public pension replacement rates for 21 advanced capitalist economies over a span of 33 years.Footnote 1 Standard pension replacement rates (SPRRs) are contribution-based benefits that require beneficiaries to retire at legal age and meet a minimum number of qualifying years. Minimum pension replacement rates (MPRRs), also known as ‘social’ pensions, are needs-based benefits provided to those who do not qualify for earnings-related pensions.Footnote 2 On average, standard contribution-based pensions tend to be more generous – in terms of replacement rates – than minimum needs-based schemes.
Standard and minimum pension replacement rates in 21 countries, 1985–2018.
Note: Figure reports box plots for country replacement rates for public pensions at 100% of the average wage for single-parent households with two children. Source: Scruggs (Reference Scruggs2022).

Figure 1 highlights three important takeaways which help motivate our inquiry. First, the two types of replacement rates are negatively correlated (r = −0.38), suggesting that governments often prioritise one at the expense of the other. Second, the size of this generosity gap varies across countries, as expected from classic welfare state regime typologies. Third, we observe considerable within-country variation over time, as indicated by the interquartile ranges in Figure 1. This suggests that while countries adopt distinct policy profiles, the allocation of spending across pension types shifts over time.
How do these shifts in the distribution of pension generosity influence public perceptions and political behaviour? Despite the prominence of pension reforms in welfare policy, their cross-cutting and offsetting effects remain unincorporated into research on policy preferences and electoral outcomes. Conventional wisdom holds that voters respond to net changes in social spending, with retrenchment seen as a particularly risky proposition for office-seeking politicians (Bremer and Bürgisser Reference Bremer and Bürgisser2023; Giger Reference Giger2011; Giger and Nelson Reference Giger and Nelson2011). However, empirical support for this conventional view is limited. Evidence of electoral punishment for welfare retrenchment in extant research is either absent or highly conditional. The few studies to examine heterogeneity in electoral response to policy change focus on social class (Arndt Reference Arndt2013b, Reference Arndt2013a), preferences for redistribution (Giger and Nelson Reference Giger and Nelson2013), government partisanship (Horn Reference Horn2021), and mass media coverage (Thurm, Wenzelburger and Jensen Reference Thurm, Wenzelburger and Jensen2024). Yet, there is limited attention to variation driven by economic vulnerability – either at the individual or country levels.
We next outline a framework that integrates policy-motivated voting with insights from welfare state reform research to better understand the political consequences of changes in the allocation of pension spending.
Heterogeneous public responses to pension spending allocation
We argue that public responses to social policy variation are shaped by both the structure of policy generosity and individuals’ exposure to economic vulnerability. A substantial body of research highlights how economic vulnerability influences preferences for redistribution. Studies have shown that this relationship depends on factors such as skill specificity (Cusack, Iversen and Rehm Reference Cusack, Iversen and Rehm2006), occupational unemployment rates (Rehm Reference Rehm2009), exposure to globalisation (Walter Reference Walter2010), temporary employment (Burgoon and Dekker Reference Burgoon and Dekker2010), the risk of nonstandard employment (Schwander and Häusermann Reference Schwander and Häusermann2013), and broader economic insecurity (Hacker, Rehm and Schlesinger Reference Hacker, Rehm and Schlesinger2013).Footnote 3
Old-age pensions offer a useful empirical case to reassess the assumptions underlying these claims. The effects of these policies are temporally distant for most individuals. Short-term spells of unemployment or economic hardship during working years rarely produce lasting shifts in attitudes toward old-age pension policies. While overall preferences on welfare spending may fluctuate with job loss and re-employment (Margalit Reference Margalit2013), preferences for intergenerational transfers appear more sensitive to general employment security or ‘employability’ (Marx Reference Marx2014; Viebrock and Clasen Reference Viebrock and Clasen2009). This aligns with findings from Naumann, Buss and Bähr (Reference Naumann, Buss and Bähr2016), who show that while changes in individual material circumstances affect preferences for unemployment benefits, they have no significant effect on support for old-age pensions. Workers in stable, well-compensated jobs contribute continuously to social security systems and qualify for full retirement benefits. In contrast, those with unstable work trajectories or whose compensation places them below the poverty line make irregular or minimal contributions. As a result, employment vulnerability and working poverty leave individuals in a precarious position past retirement age: they may qualify only for minimum retirement benefits, or, in some cases, receive no benefits at all.Footnote 4
We argue that preferences over old-age pensions depend on individuals’ status as net contributors or net beneficiaries which, in turn, is a function of their level of economic security. Economically secure individuals, insulated from unemployment and poverty risks, stand to gain from ‘standard’ old-age pensions that allocate benefits based on individual contributions. These workers are therefore likely to support the maintenance or expansion of contribution-based pensions over needs-based schemes, since they contribute to – but are unlikely to benefit from – the latter.Footnote 5 In contrast, individuals at risk of unemployment and poverty are likely to support higher needs-based pensions, which prioritise disbursing benefits based on financial need. For contribution-based pensions, economically vulnerable workers likely hold ambivalent preferences. While these pensions do not impose a direct cost and thus do not elicit strong opposition, they may be perceived as competing for limited public resources with needs-based pensions. This perception can reduce popular support for contribution-based pensions among economically vulnerable groups. Table 1 summarises these expectations across spending types.
Economic vulnerability and preferences for contribution-based and needs-based pension spending: expectations

These expectations over spending allocation have broader implications for the electoral connection. As noted, research on the electoral implications of social policy change typically assumes policymakers are rewarded for expansion and punished for retrenchment. Pioneering research by Weaver (Reference Weaver1986) and Pierson (Reference Pierson1994) further argues that politicians’ strategies of credit claiming and blame avoidance create asymmetries in public response to policy change.
Our argument builds on these insights but shifts the emphasis from discrete episodes of policy reform to the distributional composition of welfare spending.Footnote 6 We theorise that individual-level preferences for specific pension design features – linked to vulnerability – aggregate into patterns of public support or backlash when governments alter the balance between standard and needs-based pensions. This dual-level structure allows us to trace how distributional preferences translate into political consequences. Rather than attribute the consequences of policy adjustment solely to political contexts, such as the party system or government partisanship, we posit that the government’s public standing is jointly shaped by the type of pension spending prioritised and the public’s underlying risk profile. During times of relative economic security, the public is more likely to respond positively to governments that expand contribution-based pensions. Conversely, when economic precarity becomes salient, public sentiment should favour needs-based systems and penalise governments that cut them.
We emphasise that this more nuanced account does not assume an electorate composed of highly sophisticated voters. Rather, we argue that it is cognitively less demanding for citizens to evaluate the relative balance of spending – such as whether benefits are being directed toward ‘people like me’ or ‘those in need’ – than to track incremental changes in welfare policy generosity, as stipulated in earlier research (Bobo and Hutchings Reference Bobo and Hutchings1996; Norton and Sommers Reference Norton and Sommers2011). Voters may find it cognitively easier to judge fairness and adequacy by comparing the types of pensions being prioritised than by keeping track of budget figures.
Empirical approach
We evaluate these claims in two stages. First, we assess whether preferences over the allocation of pension spending respond to economic vulnerability. This stage helps identify the individual-level mechanism linking vulnerability to specific spending preferences – information that is critical to understanding how different policy choices resonate with distinct segments of the electorate. While existing research has examined factors shaping preferences for overall pension generosity (eg Busemeyer, Goerres and Weschle Reference Busemeyer, Goerres and Weschle2009; Kweon and Choi Reference Kweon and Choi2022), to our knowledge, no studies have considered how individuals’ economic risk exposure shapes preferences for the distribution of pension funds. In the second stage, we examine how changes in standard and needs-based pensions affect government popularity over time, with a particular focus on how this relationship is moderated by the macroeconomic salience of economic vulnerability.
Heterogeneous preferences for pension spending
Our first analyses rely on data from Round 4 of the European Social Survey (ESS 2023). Critically, the survey includes a key item on preferences for different social principles of old-age pensions. To capture preferences for the equivalence principle central to contributory pension systems, we rely on a survey item uniquely suited to measuring views on policy designs. Respondents are asked whether they think individuals who have contributed more to the pension system should be entitled to higher benefits or instead should benefits go to individuals in greater need. Respondents select one of the following three claims: (a) higher earners should receive larger pensions; (b) high and low earners should receive the same pension; or (c) lower earners should receive larger pensions. Most respondents voiced preferences either for ‘higher earners should receive larger pensions’ (45.1% of total responses) or ‘high and low earners should receive the same pension’ (42.4%), with only 12.5% opting for ‘lower earners should receive larger pensions’.Footnote 7
Although the item yields three categories, the latter two – flat-rate pensions (‘all earners the same’) and progressive (‘lower earners more’) – together capture the broader logic of needs-based provision. Both reflect departures from proportionality by directing benefits away from strict contribution-based rules toward more egalitarian or targeted designs. We therefore interpret the flat-rate and progressive responses jointly as indicators of preferences for needs-based pensions. In contrast, support for ‘higher earners should receive higher pensions’ reflects endorsement of earnings-related proportionality, consistent with the logic of contributory schemes.Footnote 8 This categorisation reflects core policy principles as understood by the public. Importantly, we acknowledge that perceptions of fairness may be guided more by relative earnings replacement than by detailed knowledge of contribution histories (cf. Reeskens and Van Oorschot Reference Reeskens and van Oorschot2013).
Per our theoretical discussion, we expect preferences over pension spending priorities to reflect not just individuals’ current income or employment status, but their long-term exposure to economic vulnerability. We operationalise this using two complementary measures: occupational unemployment rates and poverty risk rate. To capture general unemployment risk, we follow Rehm (Reference Rehm2009) in using OURs – occupation- and gender-specific unemployment rates – calculated from Eurostat Labor Force Surveys. These reflect the structural vulnerability of workers in a given occupation, independent of current employment status, and are merged into the ESS using the ISCO88 1-digit occupational codes.Footnote 9
To complement this, we construct a measure of poverty risk rate, which captures the likelihood of being employed yet not qualifying for adequate pension benefits (cf. Marinova Reference Marinova2022; Hellwig and Marinova Reference Hellwig and Marinova2023). While OURs capture the general risk of unemployment, they do not detect the risk of being in work but poor. Using large-N surveys from the European Union Statistics on Income and Living Conditions, we estimate the proportion of working poor in each of several labour market categories associated with a high poverty risk rate – temporary workers, part-time employees, the self-employed, the unemployed, and those inactive in the labour market – alongside labour market insiders and professional upscales. These category-level poverty rates are merged into the ESS by country and employment type.Footnote 10
Because our outcome variable has three unordered categories, we estimate a multinomial logistic regression model with country fixed effects and robust standard errors clustered by country.Footnote 11 Formally, if Y denotes respondents’ preference for pension schemes – where Y = 0 is (‘higher earners should receive higher pensions’, the reference category); Y = 1 denotes ‘all earners should receive the same pension’; and Y = 2 is ‘lower earners should receive higher pensions’ – then the log-odds of selecting category j ∈ {1,2} relative to j = 0 is modelled as:
 $$\log {{{P\left( {Y = j} \right)}}\over{{P\left( {Y = 0} \right)}}} = {\beta _{0j}} + {\beta _{1j}}OUR + {\beta _{2j}}\; Working\;Poverty\;Risk + {\beta _{kj}}{X_k} + \;{\varepsilon _j}.$$
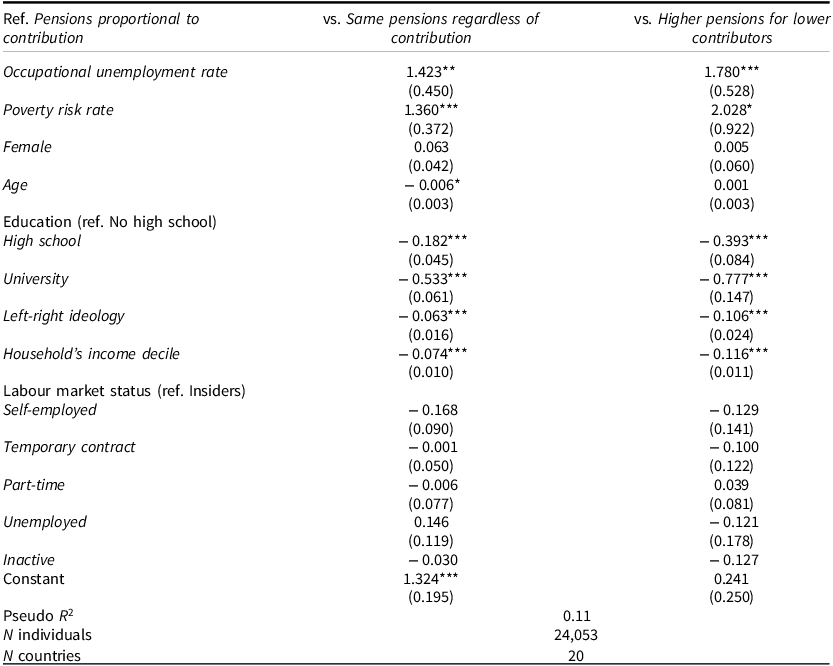
Estimates reported in Table 2 show that both occupational unemployment and poverty risk rate are positive and significantly associated with support for more redistributive pension spending, particularly for needs-based allocation. These effects are substantial – each is roughly twice as large as the effect of household income – and outperform current labour market status in predicting preferences. These results support our claim that persistent exposure to labour market and income risks – not just transitory hardship – drives demand for pension redistribution and needs-based pensions. Moreover, the ambivalence of economically vulnerable respondents toward contribution-based pensions reflects perceived competition between spending priorities.
Modelling preferences for old-age pension spending
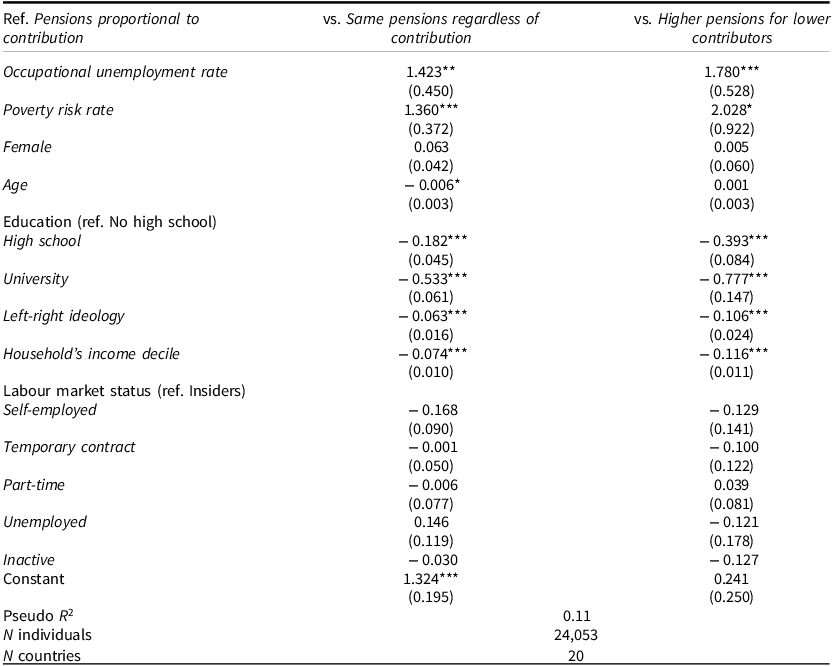
Note: Multinomial logit coefficient estimates with robust clustered standard errors in parentheses. *p < 0.05, **p < 0.01, ***p < 0.001. Model includes fixed effects for countries. Countries include Belgium, Switzerland, Czechia, Germany, Denmark, Estonia, Spain, Finland, France, Hungary, Ireland, Latvia, Netherlands, Norway, Poland, Portugal, Romania, Sweden, Slovenia, and the United Kingdom.
Source: European Social Survey, Round 4.
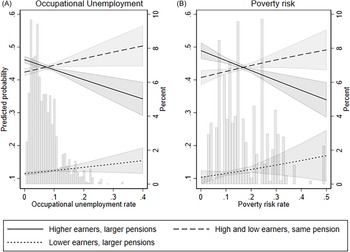
Figure 2A and B shows predicted probabilities of preferring each pension allocation principle as occupational unemployment risk (Panel A) and poverty risk rate (Panel B) vary. The left y-axis reports the predicted probability, while the right y-axis shows the distribution of respondents across the risk range (grey bars). The solid line indicates support for contribution-based pensions (‘higher earners should receive higher pensions’), the dashed line represents support for flat-rate pensions (‘all earners should receive the same pension’), and the dotted line reflects support for progressive pensions (‘lower earners should receive higher pensions’). While flat-rate and progressive logics differ in emphasis – universal versus targeted benefits – each departs from proportionality and reflects broader needs-based preferences. Because only 12.5% of respondents chose the explicitly needs-based option, confidence intervals for this category widen at high risk levels, making direct comparisons less precise.
Redistribution preferences for old-age pensions by Occupational unemployment and Poverty risk rate.
Note: Solid black lines report probability respondent agrees ‘higher earners should receive larger pensions’; long dashed lines for ‘high and low earners should receive the same pension’; and short dashed lines for ‘lower earners should receive larger pensions’. Shaded areas report 95% confidence intervals. Panel A (Panel B) shows predicted probabilities as OUR (poverty risk rate) varies holding other covariates at their means. Graphs were produced from estimates in Table 2.

Among economically secure individuals, support skews toward contribution-based logics: 46–49% of those with low poverty risk (Figure 2B) favour this option compared to 41–42% preferring flat-rate pensions and only 10–11% for progressive designs. Workers shielded from poverty are 8.2 percentage points more likely to favour contribution-based over flat-rate benefits and nearly 40 points more likely to prefer contribution-based over progressive pensions. The effect for occupational unemployment is similar but less pronounced (Figure 2A).
As vulnerability rises, support for contribution-based pensions declines sharply and preferences for needs-based pensions increase. At 35% occupational unemployment risk, contribution-based support drops 9 points (to 37%), while flat-rate preferences rise 6 points (to 48%) and progressive preferences rise 3 points (to 14%). The shift is even more pronounced for poverty: at a poverty risk rate of 50%, contribution-based support declines 15 points (to 34%), with flat-rate support climbing 8 points (to 49%) and progressive support rising 7 points (to 17%).
Contrary to expectations of ambivalence, vulnerable groups show clear opposition to contribution-based pensions. At 35% unemployment risk, support for contribution-based schemes is 11 points lower than flat-rate preferences and 23 points higher than progressive preferences. At 50% poverty risk, the gap widens further: contribution-based support lags flat-rate by 15 points, while remaining 17 points above progressive pensions. Most of the shift from contribution-based logics is towards universal (flat-rate) pensions, though progressive preferences also gain modestly. Overall, rising economic insecurity erodes support for contribution-based allocations while boosting both universal and targeted redistributive preferences, with the former capturing most of the gains.
All told, these findings support our argument that economic insecurity shapes public attitudes toward the distribution of old-age pension spending. As vulnerability increases, so does support for redistribution toward lower-income earners, while support for contribution-based allocations declines accordingly.
Spending composition and government approval
We now turn to a broader question: Do government decisions over pension spending composition influence public evaluations of policymaker performance? As noted, prior analyses of the relationship between social spending and mass political behaviour have yielded mixed findings (cf., Ahrens and Bandau Reference Ahrens and Bandau2022; Giger and Nelson Reference Giger and Nelson2013). The individual-level evidence reported above shows that economic vulnerability shapes opinions over pension policy design. We now assess whether this same logic extends to the macro-level: if risk factors like job insecurity and working poverty structure policy preferences, then shifts in pension spending allocations – especially in times of heightened economic insecurity – should influence government support.
To evaluate this claim, we shift from individual-level analysis to a macro-level examination of political accountability. Specifically, we assess whether the relationship between macroeconomic vulnerability and executive approval varies with the composition of pension spending.
The dependent variable, Approval, is measured as the percentage with positive views toward the executive’s performance as provided by the Executive Approval Project, release 2.0. The measure incorporates approval series from multiple polling firms and uses a dyads-ratio algorithm to estimate series that are comparable across governments, countries, and time (Carlin, Hartlyn, Hellwig et al. Reference Carlin, Hartlyn, Hellwig, Love, Martínez-Gallardo, Singer, Hellwig and Singer2023). Compared to votes in general elections, which occur at infrequent and irregular intervals and are contaminated by electoral campaigns, higher frequency series tracking public support are better equipped to track the mass political consequences of policy reforms. At the same time, approval ratings are strongly predictive of votes in national elections (eg Lewis-Beck and Stegmaier Reference Lewis-Beck and Stegmaier2014), and researchers commonly interpret public evaluations between elections as a continual accountability mechanism (eg Carlin and Hellwig Reference Carlin and Hellwig2019).
We measure economic vulnerability in the aggregate in two ways. Our primary measure is household debt expectations, provided by the European Commission’s Business and Consumer Surveys.Footnote 13 The surveys ask respondents ‘Over the next 12 months, how likely will you be to save any money?’ We create an aggregate score of economic vulnerability by subtracting the percentage of respondents deeming it (very/fairly) likely they will save money from the percentage expecting they will not be able to save.Footnote 14 As an alternative, we gauge vulnerability through household expenditure. Households that spend a greater share of their income on price-inelastic goods and services are more likely to be vulnerable. At the aggregate level, this is reflected in the amount of total consumption expenditure made by households to meet their everyday needs, such as food, clothing, housing, energy, and transportation, measured as a percentage of GDP.Footnote 15 We report results with household debt expectations in the main text and place results using household spending in the online Appendix (Table A11).
Per our argument, we model the influence of vulnerability as conditional on pension policy. Pension allocations are measured using SPRR and MPRR, as introduced in Figure 1 (Scruggs Reference Scruggs2022).Footnote 16 These capture the relative generosity of contribution-based and needs-based pension spending, respectively, and together approximate the distributional profile of pension policy. Rather than classify entire national systems into ‘standard’ or ‘needs-based’ categories, we treat standard and MPRRs as continuous dimensions of generosity that can be compared across all systems, regardless of their institutional design. This allows us to analyse how variation in each component, rather than the overall system type, conditions the influence of economic vulnerability on government approval.
In line with our causal mechanism, changes in replacement rates primarily reflect publicly legislated policy parameters – such as benefit formulas and replacement levels codified in national laws and verified against national and international documentation.Footnote 17 To substantiate this assumption, we report additional analyses in the Appendix showing that changes in pension policies shape public perceptions of the salience of pensions as a political issue, indicating that these changes are indeed visible and transmitted to the public.Footnote 18
Lastly, to account for dynamic effects, models include a lagged dependent variable and controls to capture cyclical effects. Research on popularity functions finds that government support varies over the electoral cycle. Executives typically receive a boost in approval early in their terms. We capture this ‘honeymoon’ effect with dummy variables scored 1 in the first quarter of a new government’s tenure and include a variable for months since the previous election (Carlin, Hartlyn, Hellwig et al. Reference Carlin, Hartlyn, Hellwig, Love, Martínez-Gallardo and Singer2018; Müller and Louwerse Reference Müller and Louwerse2020; Stimson Reference Stimson1976). We estimate a model of the form: $Approva{l_{jt}} = {\alpha _0} + {\alpha _1}Approva{l_{jt - 1}} + {\beta _1}Vulnerabl{e_{jt}} + {\beta _2}SPR{R_{jt}} + {\beta _3}MPR{R_{jt}} + {\beta _4}Vulnerabl{e_{jt}}$$SPR{R_{jt}} + {\beta _5}Vulnerabl{e_{jt}}*MPR{R_{jt}} + {\beta _k}{X_{jt}} + \;{\varepsilon _{jt}},$
where j indexes countries and t time. Consistent with our argument, we expect shocks to vulnerability to reduce government approval (β
1
< 0). We expect that expansions to standardised pensions, which provide little assistance to at-risk workers, may amplify the negative effects of vulnerability (β
4
< 0) while expansions to minimum replacement rates may mitigate them (β
5
> 0).
$Approva{l_{jt}} = {\alpha _0} + {\alpha _1}Approva{l_{jt - 1}} + {\beta _1}Vulnerabl{e_{jt}} + {\beta _2}SPR{R_{jt}} + {\beta _3}MPR{R_{jt}} + {\beta _4}Vulnerabl{e_{jt}}$$SPR{R_{jt}} + {\beta _5}Vulnerabl{e_{jt}}*MPR{R_{jt}} + {\beta _k}{X_{jt}} + \;{\varepsilon _{jt}},$
where j indexes countries and t time. Consistent with our argument, we expect shocks to vulnerability to reduce government approval (β
1
< 0). We expect that expansions to standardised pensions, which provide little assistance to at-risk workers, may amplify the negative effects of vulnerability (β
4
< 0) while expansions to minimum replacement rates may mitigate them (β
5
> 0).
We estimate the model using quarterly data on aggregate government job approval across eleven European welfare states from 1986 to 2019.Footnote 19 The pooled time-series design allows us to isolate within-country shifts in spending composition as well as longer-term impacts of policy change on public opinion. While a macro-level analysis invites risks of ecological inference, our focus is on how national policy environments and macroeconomic conditions shape public opinion as conditioned by national policy environments. The analysis of government approval thus complements rather than extrapolates from individual-level mechanisms.
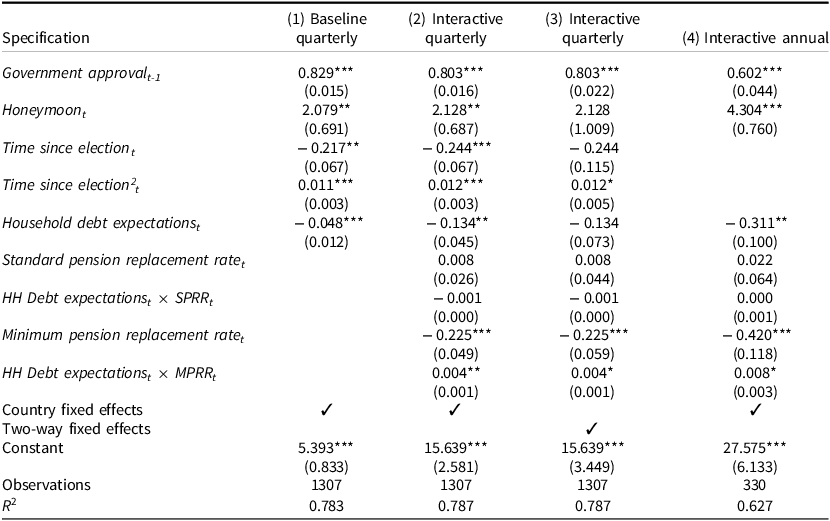
Table 3 reports results from autoregressive distributed lag models with country fixed effects.Footnote 20 The baseline specification in Model 1 indicates that government job approval ratings tend to be higher during ‘honeymoon’ periods, and electoral cycle effects are consistent with expectations. Macroeconomic sentiment also affects public support: government job performance ratings are lower as expectations over household debt levels increase.
Modelling government approval in 11 countries, 1986–2019
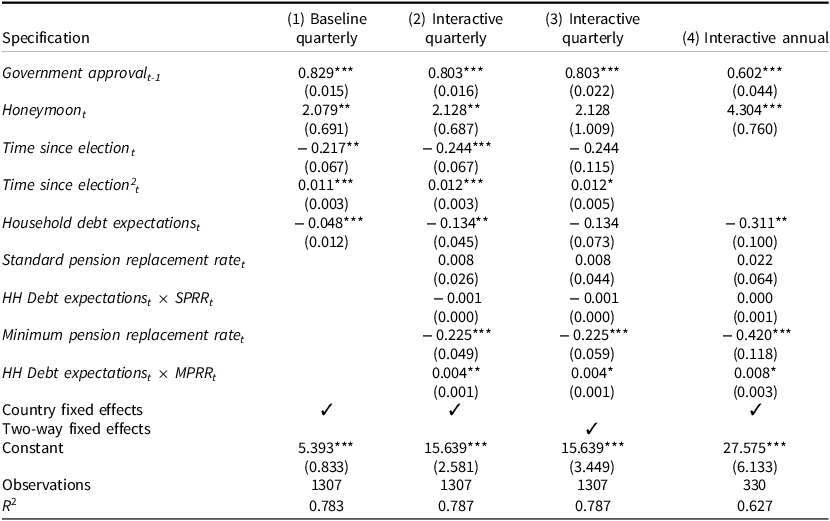
Note: Dependent variable is Government approval. Cells report ordinary least squares coefficients with standard errors in parentheses. Countries include Austria, Denmark, Germany, Greece, France, Ireland, Italy, Portugal, Spain, Sweden, and the United Kingdom. *p < 0.05, **p < 0.01, ***p < 0.001.
The remaining columns examine whether the connection between economic vulnerability – measured here as Household debt expectations – depends on changes in the allocation of spending on pensions. Because replacement rates are annual while the approval series are quarterly, we estimate models using three different strategies: (1) linear interpolation of annual data to quarterly series to estimate quarterly series, (2) two-way clustering on countries and years to address sources of non-random disturbances, and (3) annual averaging of the quarterly public opinion series.
Results across all three specifications are consistent (Table 3 Models 2–4). In each case, the coefficient on Standard replacement rates is negatively signed but not statistically different from zero. The influence of Minimum replacement rates, however, is negative, indicating that governments which oversee expansions to needs-based pension benefits are punished by the electorate. This finding contradicts claims, common in the literature, that voters reward leaders for expanding social programmes and punish them for retrenchment. Critical to our inquiry, the interactive coefficients suggest that social policy expansion need not be costly for governments. The impact of minimum replacement rates depends on aggregate debt expectations. When debt expectations are low, raising minimum replacement rates has an adverse impact on government approval. But when levels of economic vulnerability are high, governments can expand minimum pension protections without incurring a loss to their job performance ratings. Overall, results are in line with theoretical expectations.
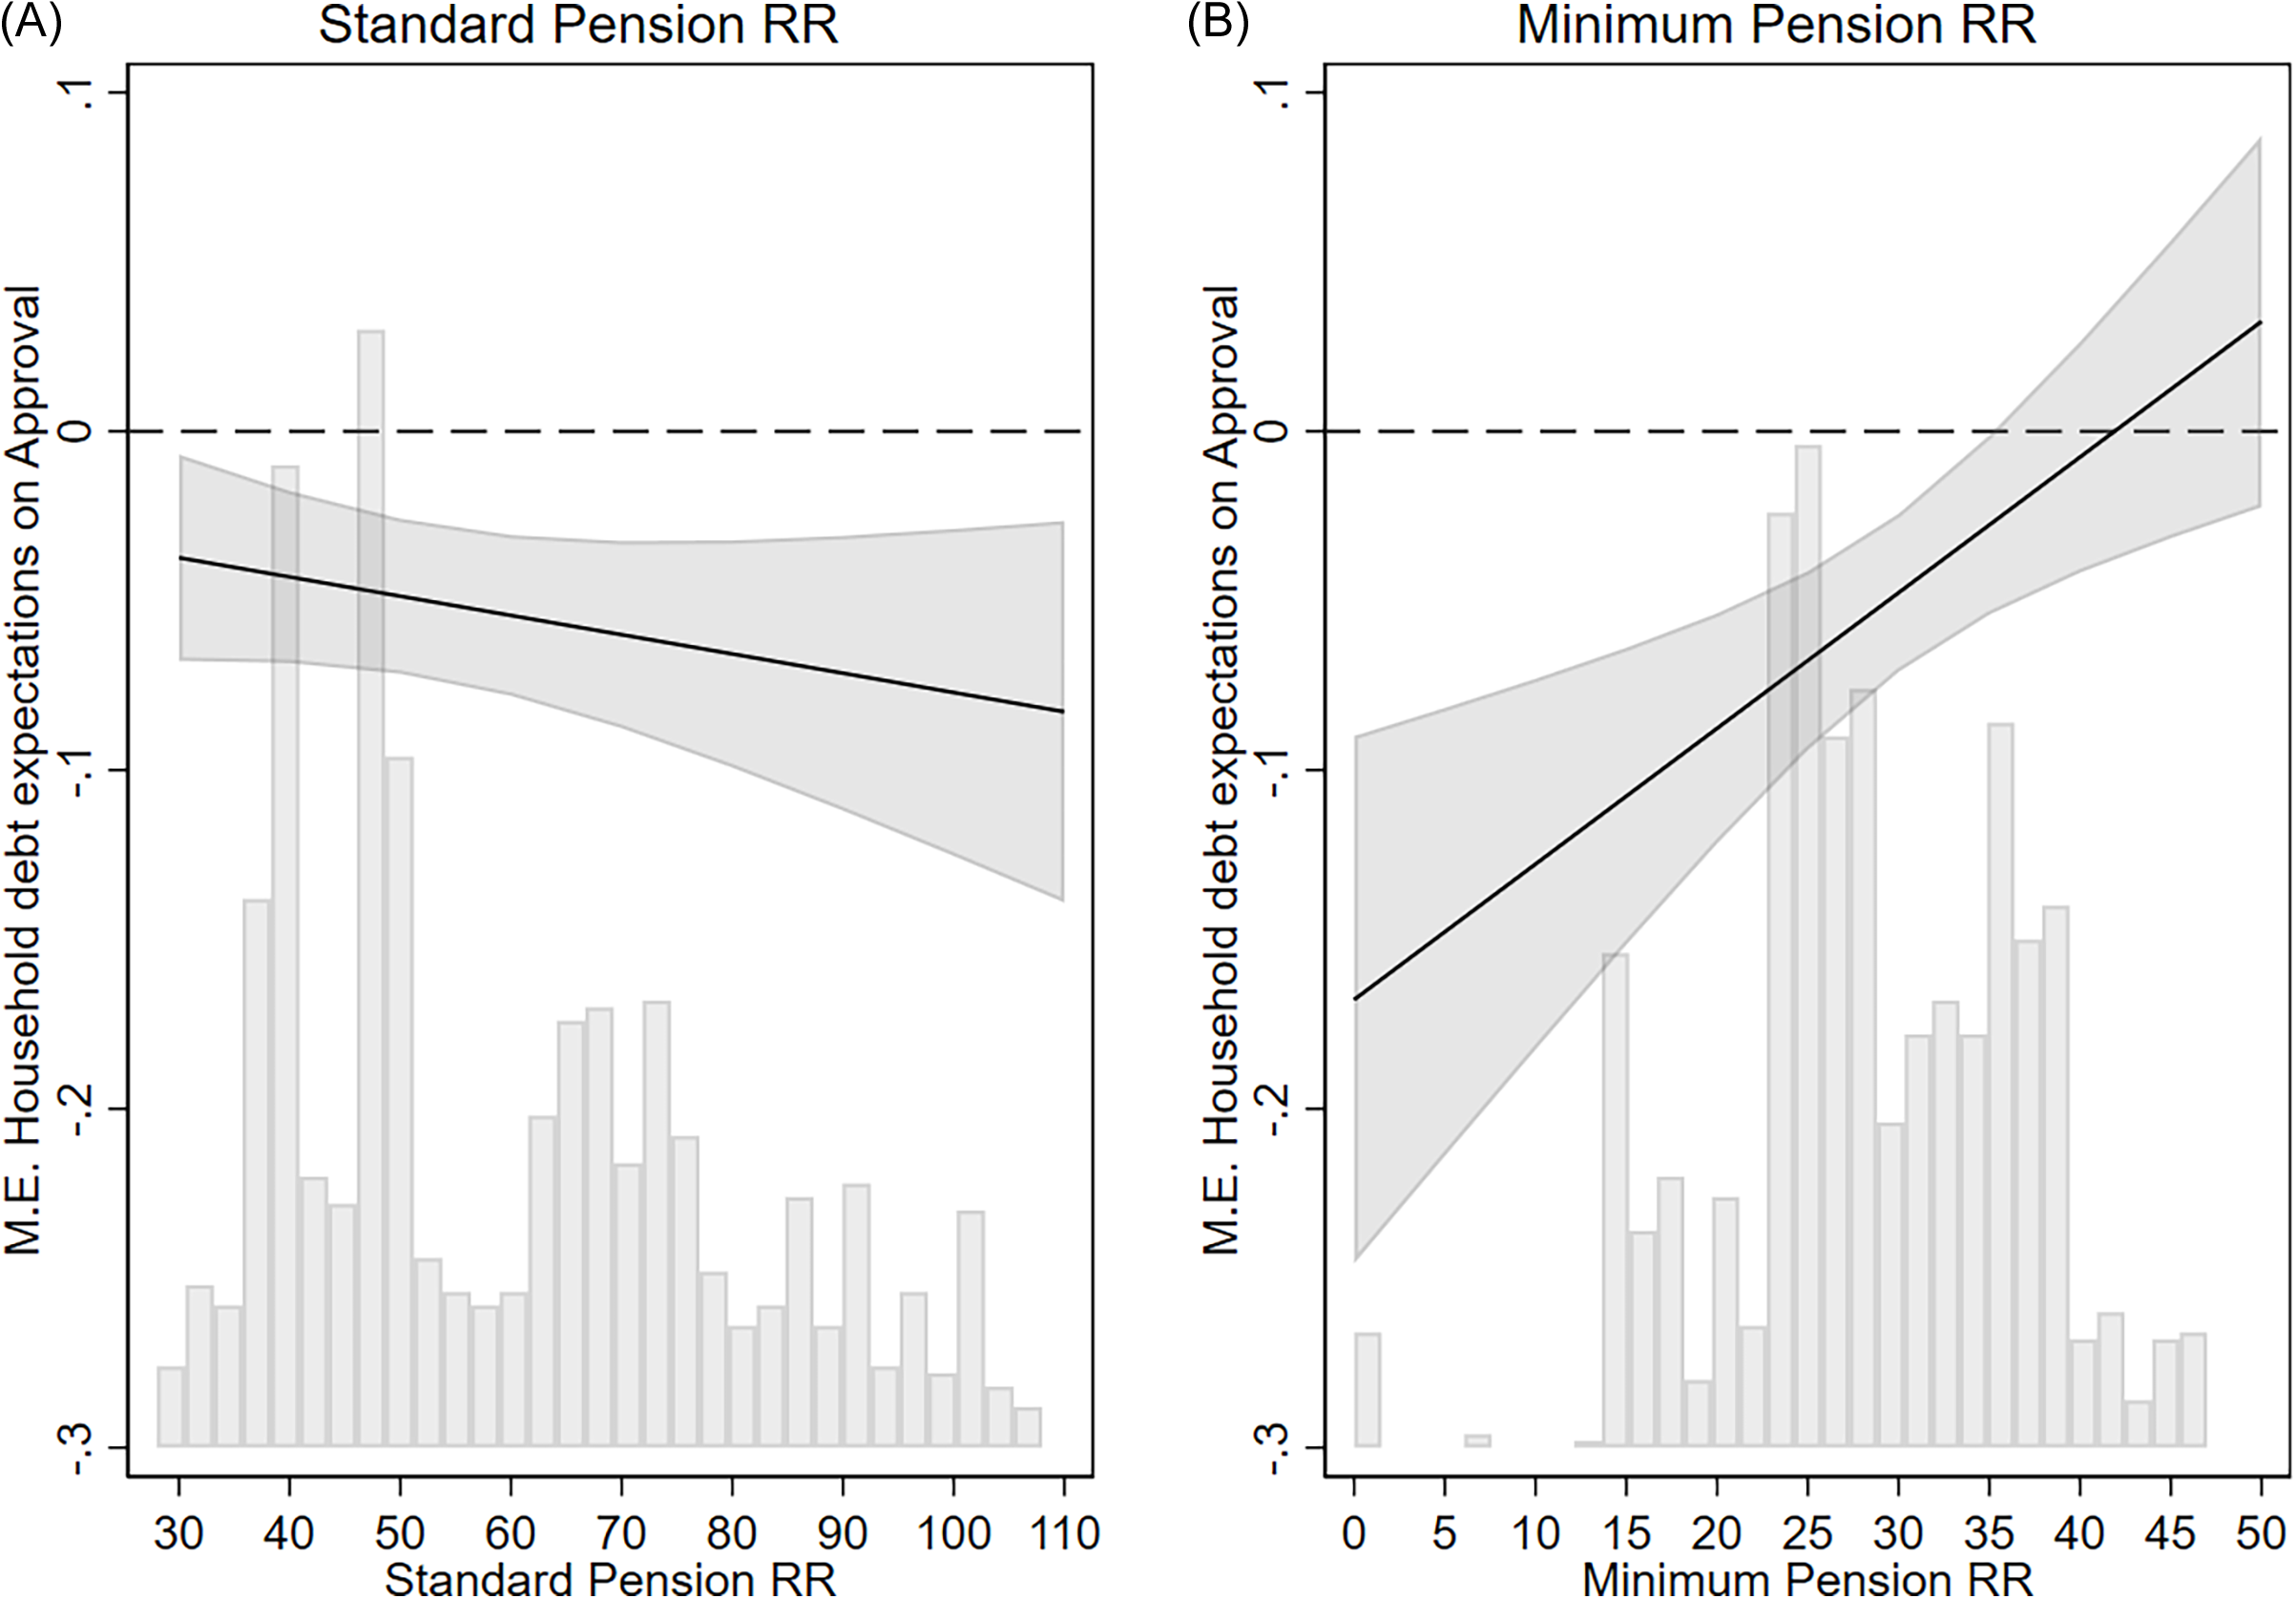
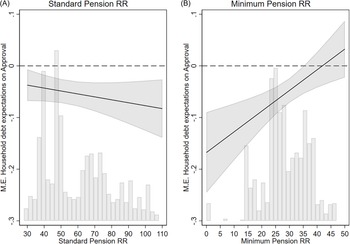
We perform a pair of estimation analyses to gauge the substantive effects of pension policy on approval. Figure 3 uses estimates from Table 3 Model 2 to display the marginal effects of debt expectations on approval as pension policy generosity varies. The graph on the left-hand side indicates that debt expectations may exert a stronger adverse influence on government approval when standard pensions packages become more generous. However, the substantive effect is modest, and the coefficient on Household debt expectations is negative (below zero) regardless of replacement rates for standard pensions.Footnote 21 The display on the right-hand side, in contrast, reveals an effect for needs-based pensions: debt expectations generally depress approval ratings; however, this effect disappears in cases where MPRRs are at 35 percent or greater. Pension spending can shape how publics evaluate governments, provided policymakers strike the right policy mix.
Marginal effects of household debt expectations on government approval.
Note: Graphs produced using estimates from Table 3 Model 2. Solid black lines report parameter estimates on Household debt expectations conditioned on SPRR (left-hand side) and MPRR (right-hand side), with 95% confidence intervals. Grey vertical bar lines report the frequency distribution of SPRR and MPRR.
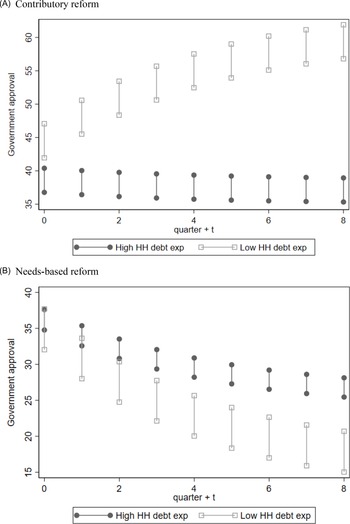
However, we do not expect the full effect of policy change on public opinion to be realised immediately. We therefore simulate the trajectory of Approval over time under two stylised policy reform scenarios.Footnote 22 Figure 4 Panel A models a ‘contributory’ scenario, which we approximate by setting the standard replacement rate to ten points above its mean value and the minimum replacement rate to ten points below it. Approval rates are then forecast under low and high vulnerability using Household debt expectations values of −25 and +25. Results show that this policy mix increases approval ratings over time, but only during periods of low economic vulnerability. Panel B models a ‘needs-based’ scenario wherein the standard replacement rate is reduced (to ten percentage points below the mean) and the minimum replacement rate is raised by the same margin (mean + 10). This policy mix leads to lower average approval, but its political cost is substantially smaller in contexts of widespread insecurity.
Forecasting Government approval under different policy reform scenarios.
Note: Graphs produced using estimates from Table 3 Model 2. Panel A displays a forecast of Government approval produced by a ‘contributory’ pension reform; Panel B does so with a ‘needs-based’ reform, as described in the text. Vertical bars display 95% confidence intervals.
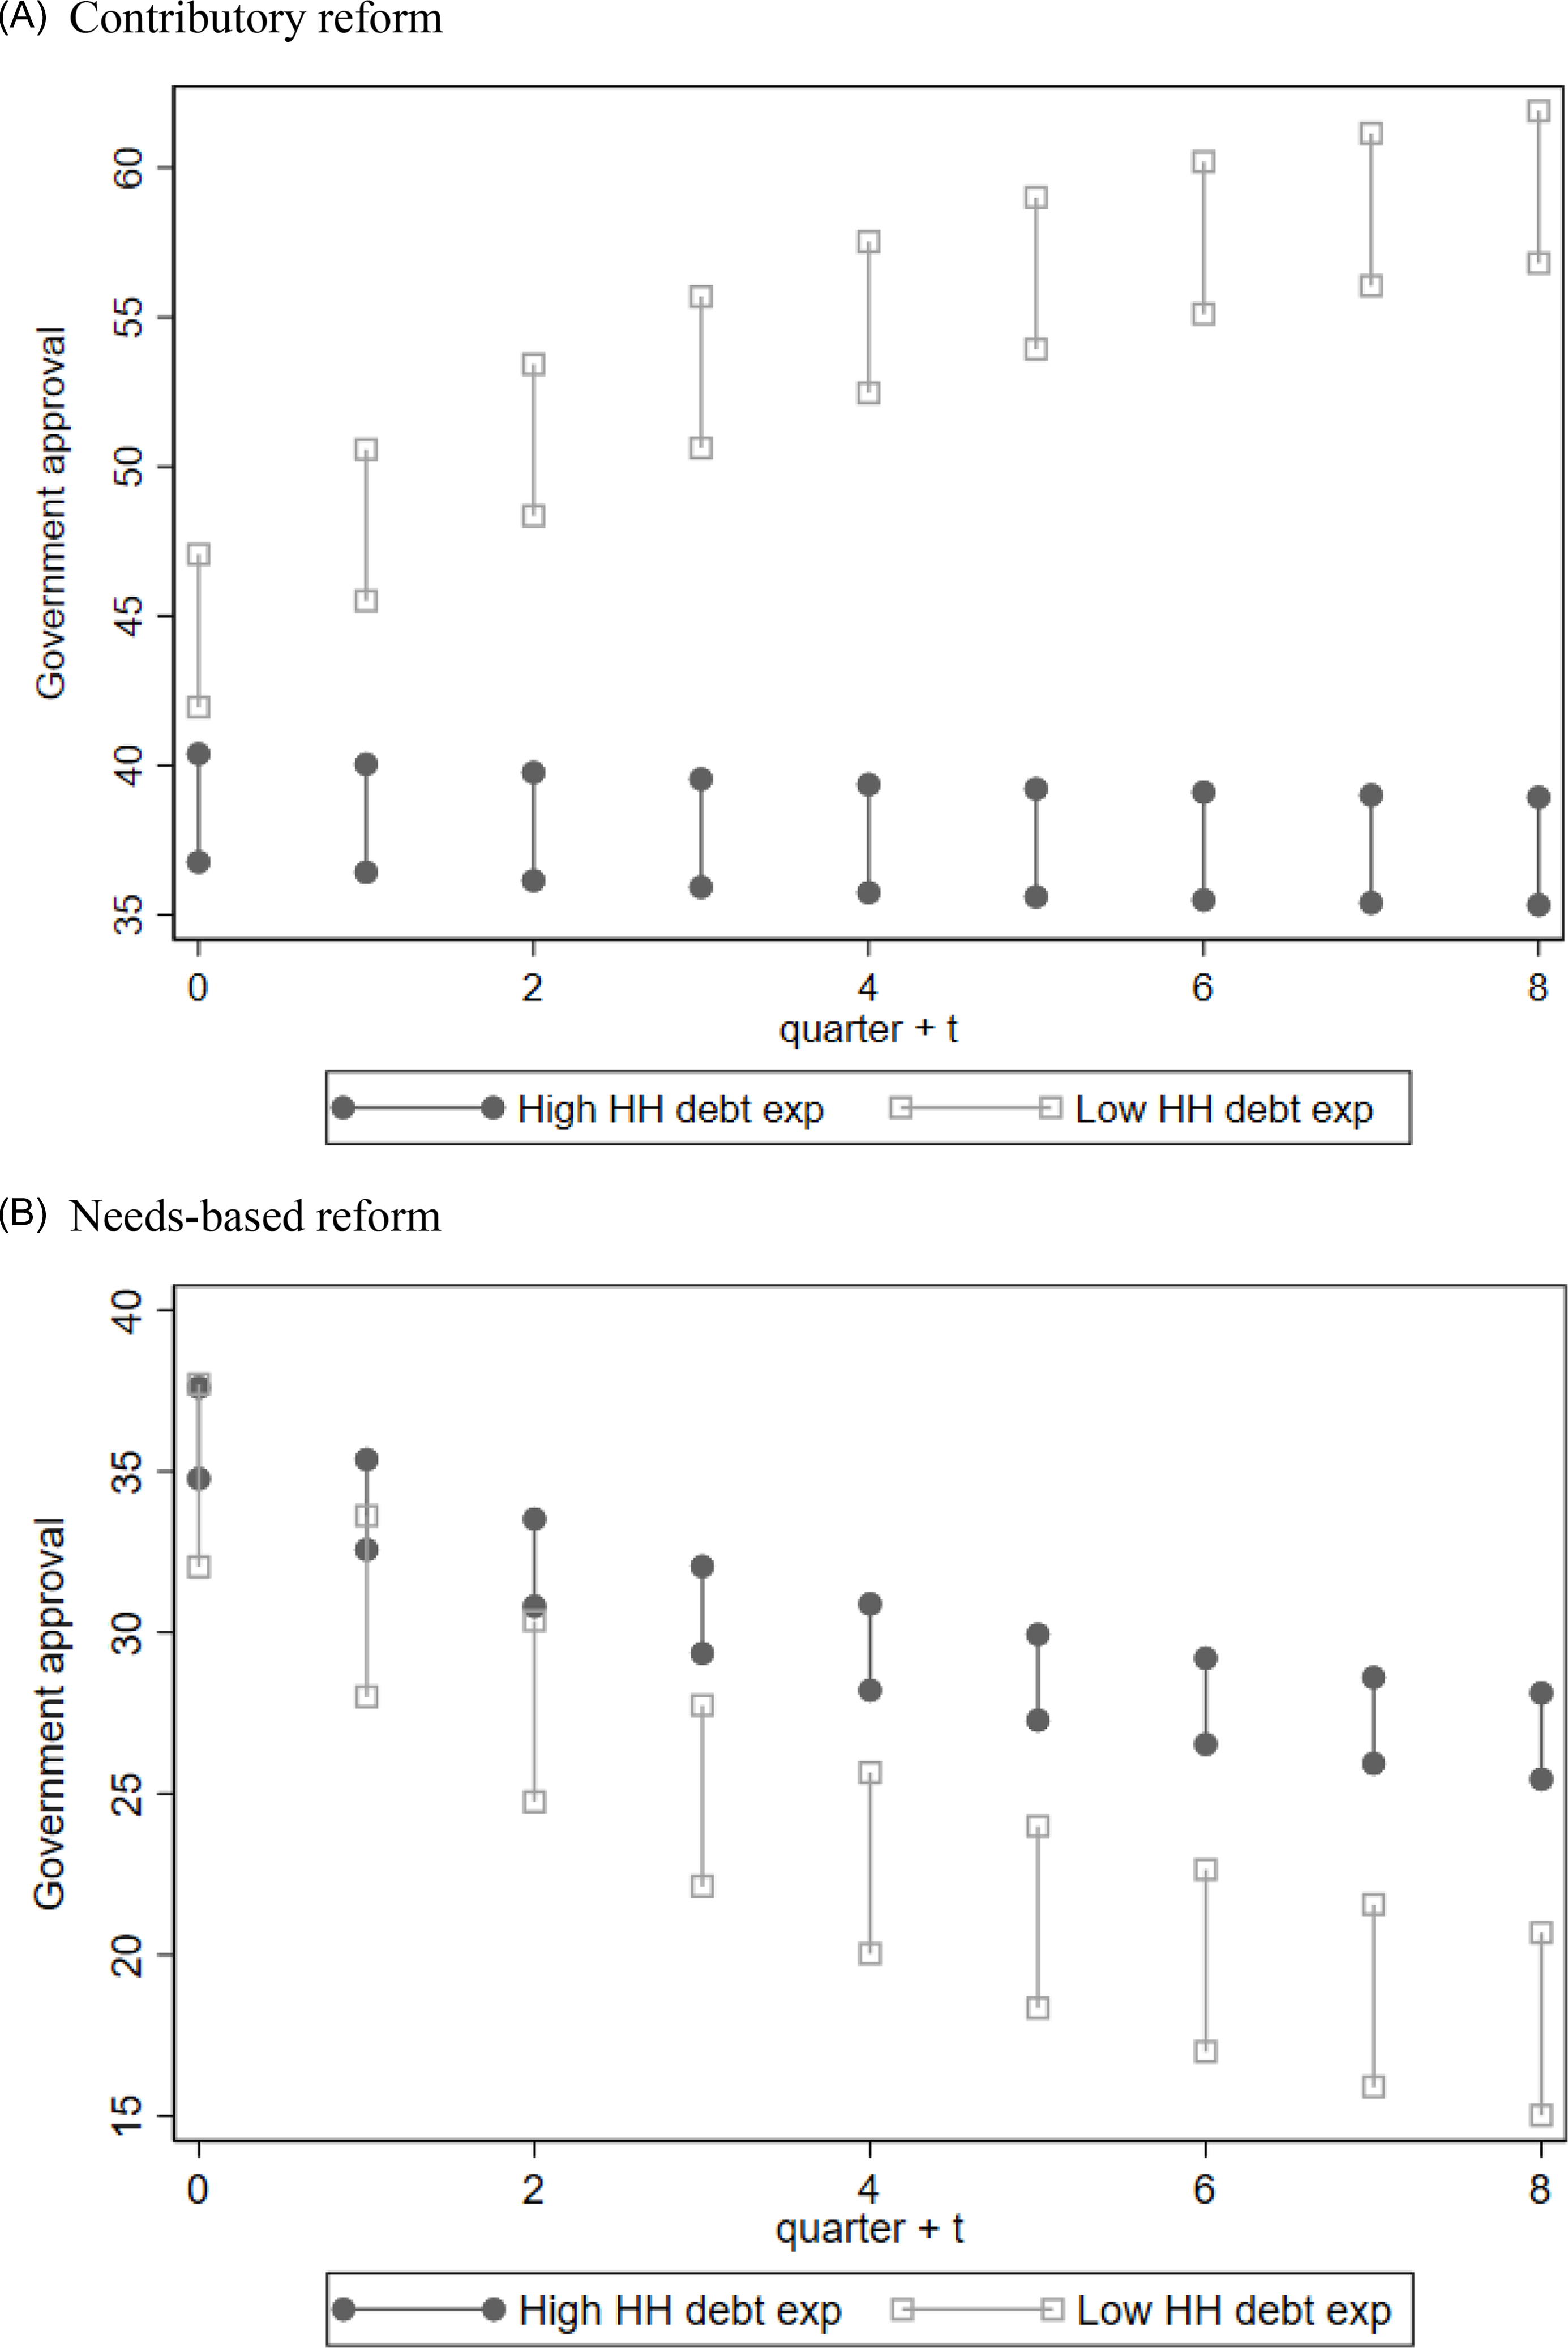
These results provide a key insight with respect to the electoral consequences of social policy change. Pioneering research by Pierson (Reference Pierson1994) maintains that retrenchment is politically possible in times of crisis (see also Giger and Nelson Reference Giger and Nelson2011). We recast this claim from a focus on crisis, which tends to be short-lived, to one of vulnerability, which is more of a long-term syndrome. We show that the political impact of policy change turns not only on its direction (retrenchment or expansion) but on how the public interprets these shifts through the lens of economic risk. For vote-seeking governments, a key takeaway is that policy expansion can be pursued without backlash, provided it is directed at those who are in greatest need when vulnerability is salient (eg Figure 4B, black bars). Alternatively, expansion of contribution-based policies is best done – from an electoral standpoint – when vulnerability is low (Figure 4A, grey bars).
Before closing, we consider two factors that may condition the relationship between welfare policy and government support. First, the electoral consequences of reform may vary based on government partisanship (Giger and Nelson Reference Giger and Nelson2011). Partisan theories of government approval suggest that voters are more responsive to social policy changes under left-leaning governments than under centrist or right-wing governments. To explore this, we stratify the sample by government orientation and re-estimate the model.Footnote 23 We find that results are similar – if not stronger – for left-of-centre governments than for governments overall: anticipated debt reduces the negative impact of cuts to minimum pensions. For non-left governments, however, high debt expectations are associated with greater punishment for expanding standard pensions, while the effect of minimum pension reforms is less pronounced. Overall, these results are consistent with the claim that vulnerability – proxied by household debt expectations – conditions public reactions differently depending on the type of pension reform and the government’s partisan profile.
Second, the institutional configuration of pension systems may condition these dynamics. Pension systems vary across OECD countries in terms of public-private mix, flat-rate versus contribution-based schemes, pay-as-you-go versus funded models, and public versus private sector dominance. While we cannot capture the full diversity across our eleven country cases, we compare Bismarckian social insurance systems (represented in the sample by Austria, France, Germany, and Italy) with multi-pillar models (eg Ebbinghaus Reference Ebbinghaus2011). In the more contributory Bismarckian systems, we find that standard pension reforms condition the influence of vulnerability: the negative impact of Household debt expectations on Approval is greater in magnitude as standard pension generosity increases. In the more diverse and increasingly more common multi-pillar systems, economic vulnerability is felt through minimum replacement rates (Table A13 Models 3 and 4). As with partisanship, stratifying the data by pension system yields different dynamics, lending support to our broader argument about the heterogeneous effects of policy reform.
Discussion and conclusion
Popular support for rolling back the welfare state in the face of demographic and budgetary pressures is hard to come by. Similarly, evidence linking welfare reform to popular support via an ‘electoral connection’ remains elusive. In this study, we have argued that public preferences over welfare state generosity – particularly in old-age pensions – are shaped by economic vulnerability, and vulnerability in turn helps explain when and how citizens hold governments accountable for shifts in the allocation of pension spending.
Our analyses provide support for a pair of claims. First, at the individual level, economic vulnerability informs preferences over pension spending priorities. Individuals who experience habitual unemployment or working poverty are much more likely to support needs-based redistribution and less likely to endorse schemes that allocate benefits in proportion to contributions. Second, we find that the political consequences of shifting pension generosity – toward either contributory or redistributive models – depend on the prevailing levels of economic insecurity. Governments that expand needs-based pensions are rewarded only when economic vulnerability is high. In other words, the public reacts to changes in the composition of pension spending but does so in a way that is contingent on contextual risk.
Although our focus is on pension policy, the findings have broader implications for how citizens evaluate welfare state reform. Prior research on the electoral response to changes in spending has produced mixed evidence (cf. Ahrens and Bandau’s (Reference Ahrens and Bandau2022) for null findings on general social spending). Part of this inconsistency, we suggest, can be traced to a lack of attention to the heterogeneous consequences of shifting welfare allocations within increasingly unequal societies. Prior research shows that economic crises can intensify electoral punishment (eg Giger and Nelson Reference Giger and Nelson2013), but our results add a key nuance: it is not economic vulnerability alone, but its interaction with the type of pension reform, that influences government approval. Specifically, governments face stronger backlash when minimum pensions are cut during periods of high vulnerability, while retrenchment of standard pensions elicits a weaker response under similar conditions. Our contributions lie in identifying the strata of the electorate most affected by these changes as well as in showing that the allocation of social spending – contributory versus needs-based – plays a decisive role in the electoral connection. As demographic and fiscal pressures mount, understanding this conditionality will be essential to explaining the political viability of welfare state reform.
Importantly, we show that the micro-level preferences expressed in survey data (ESS) align with the macro-level responses to changes in pension spending composition. The public support observed for expanding needs-based pensions during times of economic hardship reflects the same logic uncovered at the micro-level: individuals facing structural economic insecurity are more supportive of needs-based protection. This alignment between individual attitudes and aggregate behaviour reinforces the link between public opinion and government approval and underscores the importance of economic risk as a structuring condition.
Our results also raise questions about the role of different institutional architectures of national pension systems. Occupational and private pensions constitute an important component of old-age income in several countries, particularly in liberal and corporatist welfare regimes. Such schemes may buffer individuals from the effects of public pension retrenchment or, alternatively, contribute to greater stratification in retirement outcomes. While variation in coverage – variously affected by industry sector, firm size, and unionisation – is likely to affect perceptions of pension security, it is difficult to observe across countries. Our measures of SPRR and MPRR allow us to capture two continuous dimensions of generosity that cut across these institutional variations in ways not done in previous research. However, these measures do not capture the full complexity of pension systems, such as the role of occupational schemes, the relative weight of private pillars, or hybrid universalist features common in Scandinavian models. Nor can they distinguish whether shifts in replacement rates stem from legislative reforms or automatic adjustment mechanisms, which may differ in visibility to the public. Future work should build on this to develop measures that integrate these institutional nuances, examine how public, occupational, and private pension pillars jointly shape political responses, and assess whether the visibility and framing of policy changes affect how voters hold governments accountable.
For policymakers, we offer both a warning and a roadmap. Balancing demands for social protection with fiscal discipline requires strategic calculation. Recent protests against reforms to old-age pensions in France, Spain, and other industrial democracies underscore the political risks involved. Our findings suggest that while governments may not be punished for expanding needs-based pensions per se, the timing and economic context of such reforms are crucial. Redistributive expansions during periods of perceived economic stability may erode support, whereas the same policies can bolster support when vulnerability is widespread. These results echo earlier work on targeted welfare state reforms (eg Hübscher Reference Hübscher2017; Marinova Reference Marinova2020; Rueda Reference Rueda2007) while offering new evidence on the importance of spending allocation and risk salience in shaping mass evaluations. Lastly, this study speaks to extant research on new social risk groups. In Western democracies, economic precarity has translated into a growing share of the working poor. If preferences translate into policies through electoral accountability, we should expect to see a shift toward needs-based pensions and a reduction in contribution-based pensions.
Finally, our findings also point to a broader political concern. The conditional punishment of governments for cutting pensions under conditions of high vulnerability reflects not only policy dissatisfaction with specific policy choices, but also deeper disillusionment among citizens who perceive the state as unresponsive to economic insecurity. As economic risks become increasingly concentrated in particular social groups, these patterns of conditional support may contribute to wider trends of declining trust in democratic institutions and growing frustration with political elites. These dynamics echo recent evidence that fiscal austerity and economic vulnerability amplify anti-establishment sentiment and populist voting (Baccini and Sattler Reference Baccini and Sattler2025). Building on this evidence, future research on the political consequences of welfare state retrenchment should pay closer attention to how economic vulnerability conditions citizens’ political responses.
Our findings invite further testing and theorising, especially in relation to how strategic elites frame policy decisions. While this study focuses on the effects of actual policies (eg replacement rates), the public’s response to these changes may manifest later, when the policy’s effects are fully realised, or in advance of the change, during debates captured by the media. While there is evidence that the public is informed about social policy change (eg Table A9; Fernández, Wiß and Anderson Reference Fernández, Wiß and Anderson2024), future research should examine the timing of the public responses, as well as investigate how publics respond to discrete policy reforms, such as those related to pension schemes (eg Thurm, Wenzelburger and Jensen Reference Thurm, Wenzelburger and Jensen2024). Analysts should also examine whether the findings we report have greater relevance during periods of policy expansion or retrenchment. Elites’ communication skills – particularly their deployment of blame avoidance strategies (Pierson Reference Pierson1994) – also may play a role in shaping public opinion and policy outcomes.
Supplementary material
To view supplementary material for this article, please visit https://doi.org/10.1017/S147567652610067X
Data availability statement
The data and replication materials for this article are publicly available in the Harvard Dataverse. They can be accessed at: Marinova, Dani; Hellwig, Timothy (2026), ‘Replication Data for Welfare by Design: Public Responses to the Distribution of Old Age Pensions’, Harvard Dataverse, https://doi.org/10.7910/DVN/GTXHFB.
Acknowledgements
Previous versions of this article were presented at the Politics and Society Workshop Series at the University of Milan in 2022 and at Lund University in 2024. For helpful comments and suggestions, we thank Hanna Bäck, Mark Kayser, Yesola Kweon, Paul Marx, Moira Nelson, Mikael Persson, Jon Polk, and Flori So.
Author contributors
Dani Marinova is Serra Hunter Associate Professor in the Department of Political Science and Public Law at Universitat Autònoma de Barcelona. Timothy Hellwig is Professor in the Department of Political Science at the University at Buffalo, SUNY.
Funding statement
This research was supported by a Marie Skłodowska-Curie Individual Fellowship funded by the European Commission (2018–2020), Labor Market Segmentation and Political Participation (LABOREP).
Competing interests
The authors declare no competing interests.
Ethical statement
Not applicable.




 Open access

