


1. INTRODUCTION
Air traffic growth is expected to continue over the next several decades. This growth requires more efficient aircraft operations, including increased airspace capacity, (including reduced required separation between aircraft) while maintaining safety. To set an appropriate separation standard, a collision risk model has been developed for three dimensions: (longitudinal (along-track) separation, lateral separation, and vertical separation). The first collision risk model in aviation was proposed by Reich (Reference Reich1966). Although this model is stationary, it can calculate the risk of collision in a very simple form. However, such a stationary model cannot describe the detailed dynamics of aircraft, so a non-stationary, that is, time-dependent model was developed by Hsu (Reference Hsu1981). Currently, vertical and lateral separation standards are determined based on the Reich model, while the longitudinal separation standard is based on the Hsu model (International Civil Aviation Organization (ICAO), 2010; 2017). This paper focuses on longitudinal separation. Although the current longitudinal collision risk model is based on the Hsu model, it has undergone many modifications to reflect actual Air Traffic Control (ATC) and pilot operations. Recently, Observed Navigation Performance (ONP) has come into use instead of the Required Navigation Performance (RNP) value to estimate more accurate risk of collision (Barry and Aldis, Reference Barry and Aldis2013). The author also proposed a new calculation method by considering dependent parameters (Mori, Reference Mori2014).
Under the longitudinal separation model, a key factor is the accuracy of the speed prediction error. The speed prediction error indicates the accuracy of the Estimated Time of Arrival (ETA) at a downstream point in the unit of knots (kt). This value has been obtained for various places (Nagaoka et al., Reference Nagaoka, Amai and Sumiya2002; Fujita, Reference Fujita2007; Falk, Reference Falk2013), and the value of 5·82 kt is currently being used to determine the current 30 NM separation standard. (ICAO, 2017) However, this value actually varies with the airspace, and the factors which affect it have not yet been revealed. If the main error source is identified, further actions will be possible to reduce the speed prediction error and introduce a shorter separation standard. In this paper, detailed flight data have been obtained from an airline, and the source of the speed prediction error is analysed.
2. DETAILS OF SPEED PREDICTION ERROR AND DATA USED
2.1. Definition of speed prediction error
This paper is focused on the speed prediction error, defined as explained below. On oceanic flights, a position report is usually sent to ATC as an Automatic Dependent Surveillance – Contract (ADS-C) message. ADS-C is a system through which an aircraft sends data automatically to the ATC and is usually operated via a satellite connection. The data sent includes the current aircraft position, the ETA at a given point (predicted aircraft position and time), and other current basic data (for example, Mach number and track angle). Since the ADS-C message is usually sent every 10 minutes in Japanese airspace, the real-time aircraft position is estimated from the current position and future estimated position. Figure 1 shows an illustration of speed prediction error. Assume an aircraft sends a position report at t = t 1. The corresponding longitudinal position is x = x 1. At the same time, the aircraft sends a future position ( $x_{1\_{\rm est}}$ at t = $t_{1\_{\rm est}}\rpar $. After about 10 minutes, the same aircraft sends a position report x = x 2 again at t = t 2. At t = t 2, according to the previous position report, the aircraft should have been at the following position if linearly interpolated:
Calculation of speed prediction error.

 $$x_{t_2 }^{est} =x_1 +\displaystyle{{x_{1\_est} -x_1 }\over{t_{1\_est} -t_1 }}\lpar t_2 -t_1\rpar $$
 The position prediction error is defined as  $x_{2} -x_{t_{2}}^{est}$. Therefore, the speed prediction error Δ v is defined by:
 $$\Delta v=\displaystyle{{x_2 -x_{t_2 }^{est}}\over{t_2 -t_1}} $$
2.2. Possible sources of speed prediction error
In the cruise phase, an aircraft usually flies tracking a target Mach. The target Mach is calculated by the Flight Management System (FMS) considering the aircraft weight, wind speed, cost index, etc. The speed prediction error is equal to the difference between the actual ground speed and the predicted ground speed. The Ground Speed (GS) is the sum of the wind speed (w) and the True Airspeed (TAS). TAS is the product of Mach (M) and sound speed (a). The sound speed is the function of air Temperature (T). These relationships can be described by the following equations. Here, Equation (3) considers only the longitudinal component:
 $$GS=TAS+w $$
 $$TAS=aM $$
 $$a=\sqrt {\gamma RT} $$
where γ is the adiabatic index of air, and R is the real gas constant. Therefore, the speed prediction error can be affected by the following three factors: (1) wind prediction error, (2) air temperature prediction error, and (3) target Mach tracking error. The wind prediction error directly affects the speed prediction error. Considering air temperature error, since the sound speed is a function of the air temperature, an inaccurate air temperature estimation causes a speed prediction error. As for target Mach tracking error, an aircraft is usually controlled to track a given target Mach, but the aircraft cannot follow the target exactly and flies with a small deviation in Mach speed. Recent aircraft have a Required Time of Arrival (RTA) function, which can control the target time to arrive a certain waypoint. Although this RTA function is expected to improve the speed prediction error, oceanic airspace is usually far from the destination airport, and it is rarely used. Therefore, here we assume that the target Mach profile is not changed since the last position report.
2.3. Data used for analysis
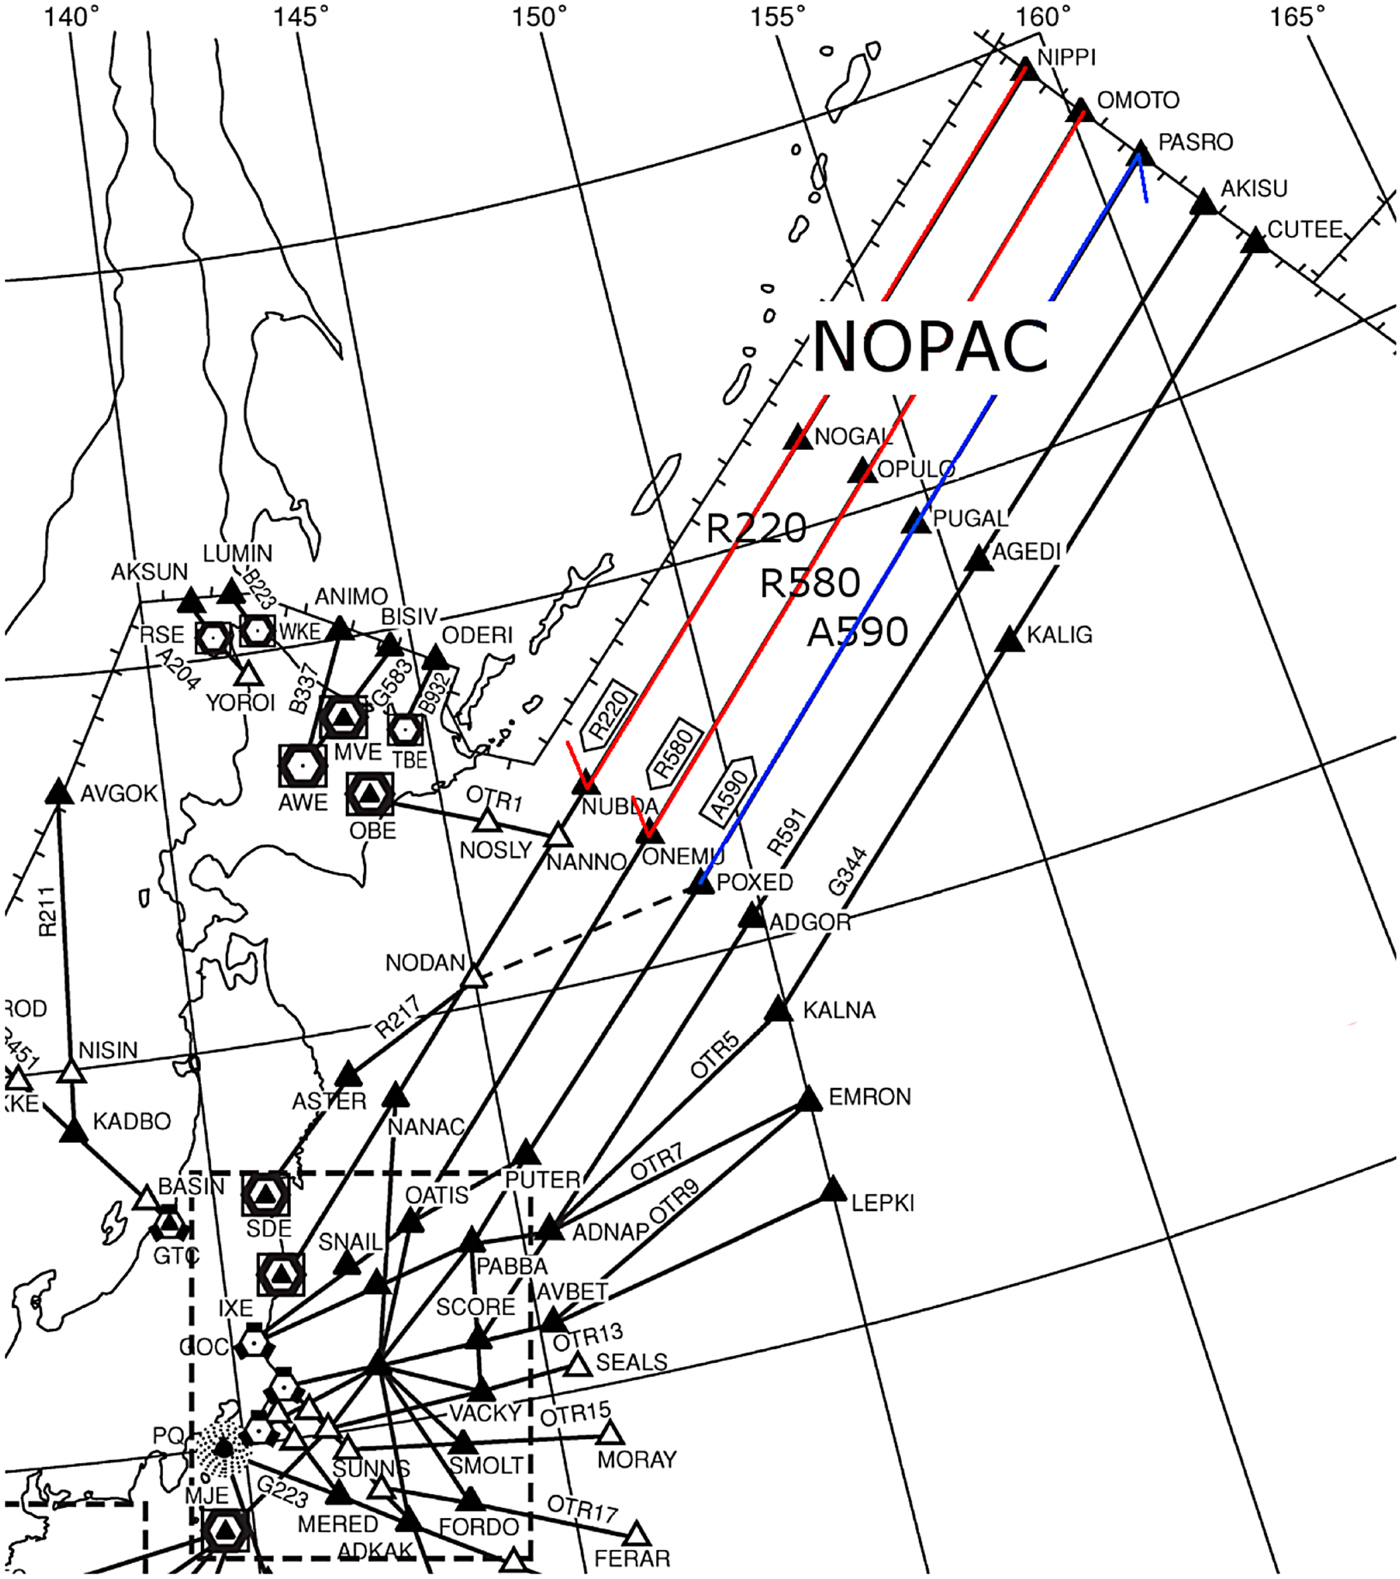
To analyse speed prediction error in detail, flight data are needed. For the purposes of this study, Quick Access Recorder (QAR) data have been provided by an airline which includes precise data such as GS, TAS, Mach, real wind data, etc, obtained every second. In total, data from 56 flights were used for the analysis, and all aircraft flew over North Pacific (NOPAC) routes as shown in Figure 2. The three northern NOPAC routes (R220, R580 and A590) were used for the analysis. Each NOPAC route is 660 NM in length, and waypoints are set every 330 NM. The aircraft type was either B777-300ER or B787-8. The corresponding ADS-C messages were also obtained, so the corresponding speed prediction error by ADS-C can be calculated. Since QAR data does not include the wind prediction data, instead meteorological data provided by the Japan Meteorological Agency (JMA) were used as wind prediction data.
NOPAC routes.
3. DATA ANALYSIS
3.1. Distribution model
Previous work by ICAO (2017) has shown that speed errors, and many other risk variables, are well modelled by Laplace distributions (assumed here as the First Laplacian, and also called two sided, or double exponential distributions). These have longer tails than Gaussian (Normal) distributions and are often used in safety analysis as they more conservatively model risk driven by unusual behaviour in the tails of a distribution. The Laplace distribution with scale parameter λ has equation:
 $$L\lpar x\semicolon \; \mu \comma \; \lambda \rpar =\displaystyle{{1}\over{2\lambda}}\exp \left({-\displaystyle{{\vert x-\mu \vert}\over{\lambda}}}\right)$$
 Laplace distribution has a log-linear tail, while the normal distribution has a log-quadric tail. The Standard Deviation (SD) of a Laplace distribution is  $\sqrt{2}\lambda$, so λ is the important parameter in this distribution.
3.2. GS error caused by wind prediction error
The actual wind data was obtained in QAR data every second. Since the predicted wind data in the estimation was not available, six hours forecast wind data in the Global Spectral Model (GSM) provided by JMA was used (JMA, 2013). In reality, the wind information can be updated on board via satellite connection, but it depends on the pilot and, if not updated, the old wind data obtained on the ground was used. Considering this fact, six hour forecast wind data was assumed to be used.
The speed prediction error affects the GS error. If the wind speed, wind direction, TAS and track angle are known in advance, GS can be calculated using the following form considering the wind/GS/TAS triangle:
 $$GS=-w\cos \lpar {\Omega -\phi } \rpar +\sqrt {w^2\cos ^2\lpar {\Omega -\phi } \rpar +TAS^2-w^2} $$
where w is the wind magnitude, Ω is the aircraft track angle and ϕ is the wind direction. If actual wind is assumed, the GS value is obtained. If estimated wind is assumed, another GS value is obtained. The difference between these two GS values becomes the GS error caused by speed prediction error. Since the QAR data is available every second, all parameters in Equation (7) can be obtained every second. However, the position report interval is much longer than a second, so the average prediction error for a certain time interval is more important from the safety point of view. Therefore, a one minute average and ten minutes average were calculated.
First, FMS wind prediction data was considered. FMS can usually only include the wind prediction data at each waypoint, while GSM provides the wind data at each mesh (every 0·5° latitude and longitude). Such coarse wind data can degrade the prediction performance.
Figure 3 shows an example of time histories of along-track wind. Actual (measured) wind was obtained via QAR data every second. GSM wind estimation data was also calculated every second considering the corresponding QAR latitude and longitude data. GSM coarse estimation means that the wind is linearly interpolated based on the wind at each waypoint. As seen in the figure, GSM every-second estimation fits the actual wind significantly better than GSM coarse estimation.
Example of time histories of along-track wind (waypoints are located at 0, 330, and 660 NM points).

Next, one minute average and ten minutes average of GS error caused by wind prediction error over NOPAC routes were calculated. In total, 4,566 minutes of QAR data were analysed. Figure 4 shows the ten minutes average of GS error caused by wind prediction error from a coarse GSM estimation. The Laplace distribution seems to be a good fit. Table 1 summarises the scale parameter of GS error caused by wind prediction error among average calculation intervals and every-second/coarse estimation. Figure 5 shows the SD of GS error caused by wind prediction error for various time intervals for average calculation. As for the coarseness of the wind prediction, the scale parameter by coarse estimation is about 20% larger than that by every-second estimation. If the FMS can include more detailed wind information, the speed prediction error can potentially be improved. Thus, as the average calculation time interval increases, the scale parameter/SD of GS error caused by wind prediction error decreases, which means that the position prediction error does not increase linearly with time.
Distribution of GS error caused by wind prediction error by GSM coarse estimation for ten minute averages.

Relationship between standard deviation of GS error caused by wind prediction error and the time interval for average calculation.

Scale parameter of GS error caused by wind prediction error in each average calculation interval and every-second/coarse estimation

3.3. Temperature error
Temperature estimation is also obtained via GSM data as for the wind analysis, and the results are summarised in Table 2. According to these results, both the coarseness of the estimation data and the average calculation interval affect the result, a trend observed in the wind prediction error analysis as well. The scale parameter of air temperature is assumed to be 1·16°C, and the corresponding speed error is calculated. The average air temperature during the cruise phase was −50·4°C.
Scale parameter [°C] of air temperature error in each average time calculation

The effect on the speed of sound by a +/− 1·16°C change in air temperature error can be estimated by calculation of the speed a(T) at a temperature near −50·4°C (a default temperature for cruising aircraft), based on the Kelvin absolute temperate (T = 273 · 15Kelvin = 0°C):
 $$\displaystyle{{\matrix{\vert {a\lpar 273{\cdot}15-50{\cdot}4+1{\cdot}16\rpar -a\lpar 273{\cdot}15-50{\cdot}4\rpar } \vert \cr +\vert {a\lpar 273{\cdot}15-50{\cdot}4-1{\cdot}16\rpar -a\lpar 273{\cdot}15-50{\cdot}4\rpar } \vert }}\over{2}}=0{\cdot}779\, \lsqb {\rm m}/{\rm s}\rsqb $$
If the nominal Mach is assumed to be 0·85, the speed error is calculated by the following formula:
 $$0{\cdot}779\times 0{\cdot}85\times 1{\cdot}94384=1{\cdot}29\lsqb \hbox{kt}\rsqb \quad \hbox{where}\ 1\, \hbox{m/s} = 1{\cdot}94384\, \hbox{kt} $$
If the air temperature error is assumed to follow a Laplace distribution with a scale parameter of 1·16°C, the corresponding speed error follows a Laplace distribution with a scale parameter of 1·29 kt.
3.4. Mach tracking error
QAR includes both the actual Mach number and the target Mach number, so the average Mach difference is calculated for several time intervals. Figure 6 shows the SD of Mach error for various time intervals for average calculation. The mean value of the Mach tracking error over ten minutes is about one third of that over one minute. As for the ten minutes average, the SD of the Mach tracking error is 0·000849, and the scale parameter of the Laplace distribution is 0·000644. The Mach tracking error is assumed to follow a Laplace distribution with a scale parameter of 0·000644, and the corresponding speed error is calculated. The same assumptions as used in air temperature calculation (the average air temperature is −50·4°C and the nominal Mach is 0·85) are applied, and the corresponding speed error is calculated in the following equation:
Relationship between standard deviation of Mach tracking error and time interval for average calculation.

 $$a\lpar 273{\cdot}15-50{\cdot}4\rpar \times 0{\cdot}000644\times 0{\cdot}85\times 1{\cdot}94384=0{\cdot}32\, \lsqb \hbox{kt}\rsqb $$
This value is almost negligible compared to the scale parameter of wind prediction error (4–5 kt).
3.5. Speed prediction error by ADS-C
The corresponding speed prediction error from ADS-C messages is also obtained. In total, 293 sets of data were available, all of which apply to the ten minutes position report interval. The scale parameter of 3·97 is obtained, and the Laplace distribution is well fitted as shown in Figure 7.
Distribution of speed prediction error via ADS-C messages.

4. DISCUSSIONS AND FURTHER ANALYSIS
4.1. Summary of the QAR data analysis
Based on the analysis in the previous section, the scale parameters of each error source are summarised in Table 3. Here, all errors are assumed to follow Laplace distributions. Also, current FMS use coarse estimation of wind data, so the coarse estimation result of ten minutes average is shown here. According to the error analysis, the scale parameter of wind prediction error is higher than those of others, so it is the error which mainly contributes to the speed prediction error. The total speed error calculated by three error sources is calculated and nearly equal to  $\sqrt{wind^{2}+Temp^{2}+Mach^{2}}$, though this equation is not strictly valid under the assumption of a Laplace distribution. According to the calculation result, the speed prediction error estimated by the three error sources (4·96 kt) and the speed prediction error obtained by ADS-C (3·97 kt) have about 20% differences.
Summary of speed prediction error in each error source

There are several possible reasons. First, the combination of the different errors (wind, temperature, Mach) often do not combine independently. The ADS-C error seems to indicate that the combination (total error) is a conservative (that is, higher) but reasonable estimate of the wind prediction error, and hence may be used to approximate the relative contribution of the error components. The second reason is that the onboard wind estimation data and the wind data in this analysis are different. The onboard wind source and the latest update time are unknown, so there should be a certain discrepancy. The third reason is that the aircraft updates the wind estimation using its own flight data. The aircraft can obtain wind data in real time, so the aircraft can know the difference of the actual wind and the estimated wind. This difference can be used to improve the future estimation. Unfortunately, the detailed algorithm is unknown, so this effect cannot be directly analysed. However, if the above reasons are valid, the following assumptions can be made:
(1) Since the wind source in each airline is different, the speed prediction error varies with airlines.
(2) Since the prediction update logic is different among aircraft types (FMSs), the speed prediction error varies with aircraft types.
4.2. Data analysis of ADS-C
To investigate the above assumptions, further analysis is conducted using ADS-C messages. The speed prediction error calculated by ADS-C is examined among airlines and aircraft types. Using the ADS-C messages, the data of speed prediction error is obtained in each airline and each aircraft type, and a scale parameter is calculated when there are more than 500 data sets in each case.
Figure 8 shows the list of scale parameters for each airline (A ~ Z) and in each aircraft type (a ~ h). The scale parameter is shown in yellow (small) and red (large). The black colour indicates that less than 500 data sets are observed. This figure clearly shows that the scale parameter differs among airlines and aircraft types. As for the airline, a scale parameter of less than 4·0 kt was obtained for airlines L and Y, while a scale parameter of more than 6 kt scale was obtained for airlines A, K, O, Q, R and U. Each airline applies a similar scale parameter regardless of aircraft types, which infers that the major difference of the speed prediction error among airlines could be due to the difference of the wind source. As for aircraft types, aircraft type g performs the best, and aircraft type e is the second best. However, there are only three operators flying aircraft type e, so this result is not generalised. Since the same airline usually uses the same wind data regardless of aircraft types, the difference of aircraft types should be discussed within the same airline. While only two operators (M and Z) fly aircraft type h, both scale parameters are large. Since the scale parameter of other aircraft types for airlines M and Z is smaller than that of aircraft type h, the type h aircraft seems to perform worse than other aircraft types. In addition, aircraft types f and g have in general the smallest scale parameters when compared to those used by other aircraft types. The difference is 2–3 kt, which is significant.
Scale parameters of each airline and each aircraft type.

In summary, the difference of scale parameters among airlines is significant, and this could be due to the difference of wind prediction sources used by each airline. The difference of scale parameters is also observed among aircraft types. This difference could be due to the difference of the estimation logic or update logic.
4.3. Discussion
To the best of the author's knowledge, there have been no previous discussions regarding the difference of the scale parameter among airlines and aircraft types, so the results presented in this paper were new to the author. In terms of the separation standard, the large-scale parameter potentially increases the risk of collision, so an effort to reduce the scale parameter is recommended. In general, newer aircraft are expected to have a smaller scale parameter, so one solution is to replace aircraft with newer fleet. This process will require time, but the scale parameter is expected to be improved over a long time period. As for the wind source, if an airline uses a more accurate wind source, the speed prediction error could be improved. Currently, there is no standard for airline wind source usage, so it is recommended that the speed prediction error is investigated in each airline, and airlines with large scale parameters are encouraged to use more accurate wind information. Another solution is to standardise the wind information used by airlines all over the world. If wind is the main source of the prediction error and consecutive aircraft use the same wind information, the risk of collision would be negligible.
The results presented in this paper also provides good feedback for future four-dimensional trajectory operation and arrival management. The International Civil Aviation Organization is aiming to introduce a four-dimension trajectory-based operation in the future as well as a sophisticated arrival manager. (ICAO, 2016). In both concepts, the accuracy of ETA significantly affects the system performance, and more accurate ETAs are expected. (Bai et al., Reference Bai, Weitz and Priess2016; Lee et al., Reference Lee, Lee and Hwang2016). The ATC systems usually rely on each aircraft's ETA information, but this paper demonstrates that the accuracy of ETA depends on the wind information each aircraft uses and aircraft type. Based on the results in this paper, a unified wind information source could improve ETA accuracy. Since the difference of ETA among airlines and aircraft types has not yet been considered, this could improve the whole system performance. Although this paper only considers oceanic flights, similar results will be expected under en-route flights as well if the main error source is the wind. Further analysis is underway.
5. CONCLUSIONS
The speed prediction error, that is, ETA accuracy at downstream points, is a key factor in determining longitudinal separation standards, but its detail has not been clarified up until now. Therefore, this paper analysed speed prediction error using airline QAR flight data. Data analysis revealed that the main factor of speed prediction error was wind prediction error. As for the wind prediction error, since the predicted wind information differs among airlines, the speed prediction error was further examined among airlines and aircraft types using ADS-C data. The result showed that there was a difference of the speed prediction error among airlines, which could be due to the difference of wind prediction data. Difference of the speed prediction error among aircraft types was also observed. These characteristics have not yet been revealed by other researchers and the results inferred that an improvement of ETA accuracy could easily be achieved by using more accurate wind information. An improvement of ETA accuracy will support a future four-dimensional trajectory-based operation as well as the introduction of a shorter longitudinal separation standard.
ACKNOWLEDGMENT
The author would like to thank Japan Airlines for providing QAR flight data.


 Open access

