


1. Introduction
Although breastfed infants experience lower rates of illness and reduced healthcare expenditures (Ajetunmobi et al., Reference Ajetunmobi, McIntosh, Stockton, Tappin and Whyte2024; Griswold and Palmquist, Reference Griswold and Palmquist2019; Jegier, Smith and Bartick, Reference Jegier, Smith and Bartick2024; Ma, Brewer-Asling and Magnus, Reference Ma, Brewer-Asling and Magnus2013; Weimer, Reference Weimer1999), infant feeding practices vary substantially across households and over time. In the United States, feeding decisions reflect a combination of health considerations, labor-market constraints, social norms, and access to safe alternatives, and infant formula plays a central role when breastfeeding is insufficient or infeasible (Capra et al., Reference Capra, Decarolis, Monopoli, Laudisio, Giudice, Stanyevic, Esposito and Biasucci2024; Obladen, Reference Obladen2014). Governments and public-health organizations therefore emphasize the importance of safe, nutritionally adequate infant formula as a critical component of infant nutrition policy (Brown Reference Brown2018; Kent, Reference Kent2006; Ryan, Reference Ryan1997; World Health Organization, 2009, 2016).
Over the past century, concerns about product safety, quality, and nutritional adequacy have shaped the evolution of the infant formula market (Food and Drug Administration, 2014; Patel, Reference Patel2023; Wolf, Reference Wolf2003; World Health Organization, 2016). In developed countries such as the United States, infant formula is subject to strict regulatory oversight, including nutritional standards and manufacturing requirements designed to ensure infant health (Guo and Ahmad, Reference Guo and Ahmad2014; Kent, Reference Kent2015; Pomeranz and Harris, Reference Pomeranz and Harris2019). As a result, infant formula occupies a unique position among food products: it is both a heavily regulated good and, for many households, a necessary input into infant care.
In this paper, we examine household-level demand for infant formula across major product forms – powder, ready-to-use, and concentrate – with particular attention to how prices, income, and participation in the Special Supplemental Nutrition Program for Women, Infants, and Children (WIC) are associated with substitution patterns among purchasing households.
A large body of economic research has examined how WIC interacts with the infant formula market, primarily from a market-level perspective. Early theoretical and empirical work shows that WIC’s rebate system can influence equilibrium prices and market concentration (Betson, Reference Betson2009; Prell, Reference Prell2004), while subsequent studies document brand-level spillovers and higher retail prices for non-WIC consumers following contract awards (Choi et al., Reference Choi, Ludwig, Andreyeva and Harris2020; Davis, Reference Davis2011; Huang and Perloff, Reference Huang and Perloff2014). More recent contributions explore procurement design, demand spillovers, and distributional consequences in formula markets (Abito et al., Reference Abito, Hui, Salan and Uetake2022; An et al., Reference An, Davis, Liu and Xiao2023). Collectively, this literature underscores WIC’s role as a dominant institutional buyer in the infant formula market.
From the perspective of households, however, WIC infant formula benefits are structured in ways that can differentially affect purchasing behavior across product forms. In most states, WIC benefits predominantly cover powder formula, typically designated through state-level sole-source contracts and authorized product lists. Ready-to-use and concentrate formulas are generally more limited in eligibility, often restricted to specific medical or situational circumstances, and are less consistently available across retailers. As a result, stores tend to offer a wider variety of WIC-eligible powder formulas than ready-to-use or concentrate products, reflecting both program rules and procurement practices. WIC formula benefits are allocated on a monthly basis and provide covered products at a zero marginal price (i.e., no out-of-pocket cost for covered quantities) up to the prescribed quantity, while purchases beyond the benefit allotment or of non-eligible forms must be made out of pocket (Davis, Reference Davis2011; Huang and Perloff, Reference Huang and Perloff2014; Oliveira et al., Reference Oliveira, Frazao and Smallwood2011). These institutional features imply that observed differences in formula choice and price responsiveness across product forms may reflect program design and availability constraints, rather than household preferences alone.
As a primary or sole nutritional source for many infants (Oliveira and Frazão, Reference Oliveira and Frazão2009), infant formula plays a critical role in early-life health and development (Victora et al., Reference Victora, Bahl, Barros, França, Horton, Krasevec and Rollins2016). For economically vulnerable households, expenditures on infant formula can represent a substantial share of food budgets, making prices and availability particularly consequential (Oliveira, Reference Oliveira2004). Understanding how households adjust formula purchases across product forms in response to prices and program rules is therefore essential for evaluating how market conditions and nutrition assistance programs jointly shape access to adequate infant nutrition.
At the same time, existing research has largely emphasized market-level contracting outcomes or brand-level effects of WIC participation. Much less is known about how households that rely on formula allocate spending across different product forms – such as powder, ready-to-use, and concentrate – under varying prices, incomes, and benefit structures. In particular, evidence on within-formula substitution behavior at the household level remains limited.
This study addresses this gap by shifting the focus from market-level contracts and brand outcomes to household-level demand behavior across infant formula forms. We conduct a household-level demand analysis using an Almost Ideal Demand System (AIDS) framework and examine how own-price, cross-price, and expenditure responses vary across product forms and socio-demographic characteristics, including income, race, education, and participation in WIC. Rather than evaluating program participation or identifying causal program effects, the analysis documents descriptive differences in demand behavior across households observed to participate in WIC and those that do not.
Previewing the results, we find that demand for powder and ready-to-use formula is approximately unit elastic and that substitution patterns across product forms are asymmetric, with adjustments concentrated between powder and ready-to-use formulas. We also find that price responsiveness is broadly similar across income groups and between WIC and non-WIC households, with only modest variation in substitution magnitudes. These patterns suggest that household demand for infant formula is relatively stable across demographic groups, consistent with the essential nature of infant nutrition. This stability is notable because standard economic reasoning would predict differences: WIC households face a distinct effective price structure for covered products, low-income households face tighter budget constraints that typically generate more elastic demand, and the applied food demand literature has documented substantial heterogeneity in price responsiveness by income and program participation for other food categories (e.g., Andreyeva, Long and Brownell, Reference Andreyeva, Long and Brownell2010; Hastings and Shapiro, Reference Hastings and Shapiro2018). Finding that infant formula demand is broadly invariant to these distinctions has implications for how price shocks – such as those observed during the 2022 infant formula shortage – propagate across household types, which we develop in the Discussion.
The contribution of this study is twofold. First, it provides the first household-level demand system analysis that explicitly documents substitution and price responsiveness across infant formula product forms, rather than across brands or manufacturers. Second, the analysis documents that price responsiveness is broadly stable across income groups and between WIC and non-WIC households – a finding that is itself informative, given that prior reasoning and evidence from other food categories would predict meaningful heterogeneity. The WIC comparison, while based on a limited subsample, provides illustrative evidence within this broader finding of demand stability. These contributions complement existing market-level studies by providing micro-level insight into how prices and household characteristics are associated with observed formula purchasing behavior, without implying causal program effects.
The remainder of the paper is organized as follows. Section 2 describes the data and presents descriptive evidence on household purchasing patterns. Section 3 outlines the empirical framework and econometric approach. Section 4 reports elasticity estimates across household groups. Section 5 discusses the implications of the findings, limitations, and directions for future research, and concludes.
2. Data and descriptive analysis
This study utilizes data from the NielsenIQ Homescan panel, sourced from NielsenIQ Company (U.S.), LLC, and marketing databases from the Kilts Center for Marketing Data Center at the University of Chicago.Footnote 1 NielsenIQ Homescan specifically includes four datasets: Household Panel, Trip, Purchase, and Products. These tables are linked by matching unique household identification codes, trip codes, and Unique Product Codes (UPC), covering the period from 2014 to 2022. The Household Panel provides socio-demographic information such as race, gender, and education level for each household member, household-level income, and WIC participation status.
We only select households with at least one family member born within one year prior to the survey year, as infant formula is typically not necessary for children older than one year (Clark and Ghebreyesus, Reference Clark and Ghebreyesus2022; Harris and Pomeranz, Reference Harris and Pomeranz2020; Pomeranz, Palafox and Harris, Reference Pomeranz, Palafox and Harris2018). For example, households recorded in 2018 are included only if they have at least one member born in 2017. Purchase data are initially observed at the UPC–trip level and then aggregated to the annual household–year level. The unit of observation used throughout the descriptive analysis and the demand estimation is therefore the household–year. Household–year observations with no formula purchases are excluded from the estimation sample.
Table 1 summarizes the construction of the analytic sample and purchasing behavior by calendar year. The table reports the total number of households in the Homescan panel, the subset identified as households with infants, and the number of households purchasing infant formula in each year. To clarify the relationship between the underlying panel and the estimation sample, the table further distinguishes between all formula-purchasing households and households with infants purchasing formula. In particular, among the 4,554 households with infants, 1,675 household-year observations (37%) involved positive infant-formula purchases.
Sample composition and purchasing behavior by year

Table 1. Long description
The table has 12 columns and 17 rows. The columns are labeled Year, Total households (panel), Households with infants, Formula-purchasing households, HH with infants purchasing formula, Product-level purchase records, Purchase records (HH with infants), Powder, Ready-to-use, Concentrate, Share purchasing formula (percent), Purchases per HH with infant, Purchases per HH without infant, WIC, Non-WIC, low income, Low income, and Mid-to-high income. The rows are labeled with years from 2014 to 2022 and Total. Row 1: 2014, 61557, 509, 1175, 167, 5372, 3676, 158, 39, 6, 32.8, 22.0, 1.7, 23, 42, 65, 102. Row 2: 2015, 61380, 548, 1435, 265, 7110, 3736, 248, 45, 12, 48.4, 14.1, 2.9, 32, 63, 95, 170. Row 3: 2016, 63150, 656, 1665, 260, 8483, 3900, 250, 41, 4, 39.6, 15.0, 3.3, 21, 68, 89, 171. Row 4: 2017, 62831, 666, 1270, 221, 6319, 3925, 203, 43, 6, 33.2, 17.8, 2.3, 17, 47, 64, 157. Row 5: 2018, 61384, 652, 1474, 275, 7563, 3917, 269, 39, 4, 42.2, 14.2, 3.0, 25, 68, 93, 182. Row 6: 2019, 61483, 518, 1378, 214, 6967, 2811, 210, 20, 3, 41.3, 13.1, 3.6, 17, 47, 64, 150. Row 7: 2020, 60101, 427, 1362, 183, 6455, 1630, 174, 29, 2, 42.9, 8.9, 4.1, 20, 44, 64, 119. Row 8: 2021, 58226, 295, 434, 40, 1520, 514, 40, 0, 0, 13.6, 12.9, 2.6, 3, 10, 13, 27. Row 9: 2022, 56795, 283, 444, 50, 1192, 442, 50, 2, 0, 17.7, 8.8, 1.9, 4, 15, 19, 31. Row 10: Total, 546907, 4554, 10637, 1675, 50981, 24551, 1602, 258, 37, 37.0, 13.8, 2.7, 162, 404, 566, 1109.
Notes: This table summarizes sample composition and purchasing activity by calendar year. Counts refer to unique households observed in each year of the NielsenIQ Homescan panel. Households with infants are defined as households reporting at least one member born within one year prior to the survey year. Formula-purchasing households include all households that purchase infant formula at least once during the calendar year. Households with infants purchasing formula are those that satisfy both conditions. Product-level purchase records correspond to UPC–trip observations and are aggregated to the household–year level in the demand estimation. The unit of observation in the demand system is the household–year, constructed by aggregating all UPC-level purchases within each year. Formula choice categories are not mutually exclusive; a household may purchase more than one formula type within a year. WIC participation and income categories are reported for households with infants purchasing formula. WIC: Special Supplemental Nutrition Program for Women, Infants, and Children.
Table 1 further shows that purchasing intensity differs sharply between households with infants and households without infants. Although households with infants do not account for the majority of households that ever purchase infant formula in a given year, they account for a disproportionately large share of purchase transactions and purchasing intensity (purchases per purchasing household with infant vs. purchases per purchasing household without infant). Households with infants that purchase formula record substantially higher numbers of formula purchase transactions per year than households without infants purchasing formula, indicating that households with infants dominate formula purchases along the intensive margin even if they are not the majority of purchasers along the extensive margin.
Within the analytic sample, most household–year observations purchase only one formula form. Specifically, 1,397 household–years purchase powder formula exclusively, 65 purchase only ready-to-use formula, and 5 purchase only concentrate formula, with the remaining household–year observations purchasing multiple formula types within a year. This pattern further motivates our focus on households with infants in the analytic sample, as formula purchases by households without infants are relatively infrequent and likely reflect sporadic or secondary uses rather than sustained feeding behavior.
Table 1 also reports WIC participation and income categories among households with infants purchasing formula, motivating the subsample analyses conducted in the demand system.
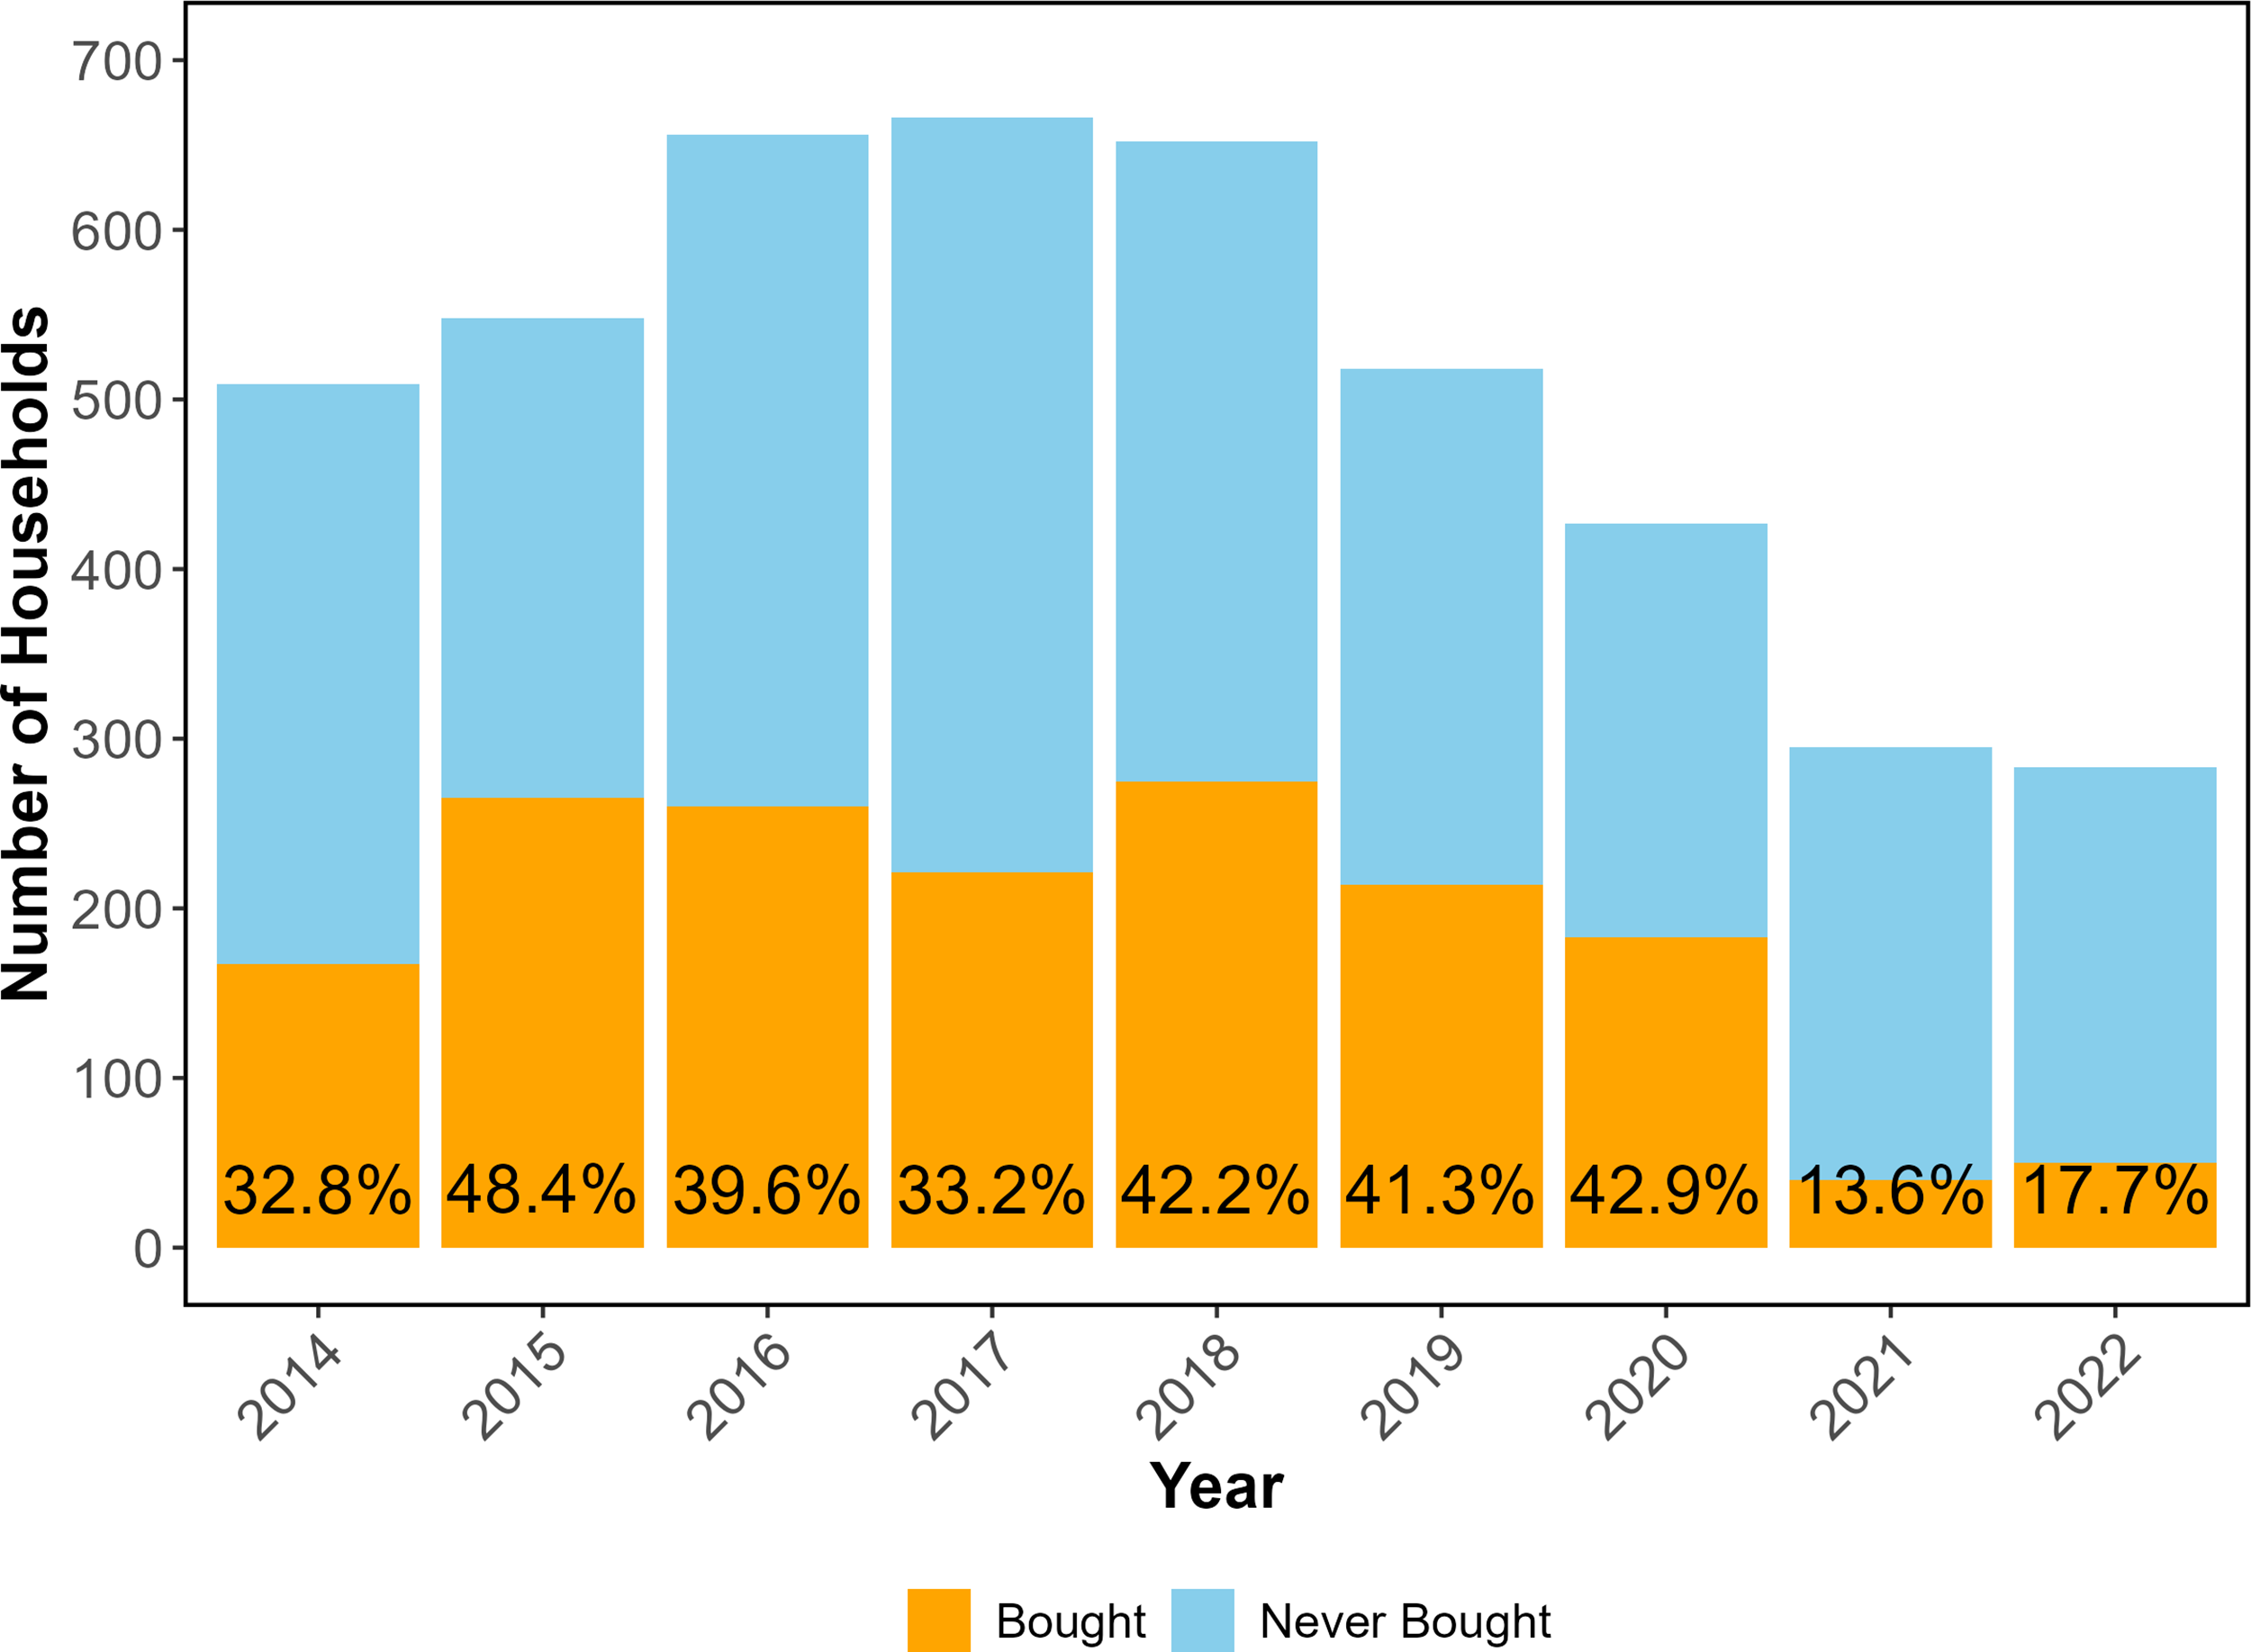
As shown in Figure 1, the data from 2014 to 2019 exhibits a relatively stable range of 509 to 666 households with infants each year, with 33% to 48% consistently purchasing infant formula. However, the onset of the COVID-19 pandemic led to a notable decline in both sample size and purchasing behavior: household numbers dropped to 427 in 2020, and further to 295 and 283 in 2021 and 2022, respectively. Concurrently, the proportion of households buying infant formula plummeted to 13.6% in 2021, slightly recovering to 17.7% in 2022, consistent with evidence that the COVID-19 pandemic affected infant feeding practices and created challenges in obtaining formula and feeding support (Marino et al., Reference Marino, Meraz, Dhaliwal, Payán, Wright and Hahn-Holbrook2023) and motivating the inclusion of year fixed effects in the empirical analysis.
Share of households with infants purchasing formula, 2014–2022.
Note: The vertical axis represents the number of households, and the horizontal axis represents years from 2014 to 2022. Bars indicate the total number of households with infants under one year of age. Each bar is segmented by color: blue indicates households that never purchased infant formula, and orange indicates households that ever purchased infant formula during the corresponding year. The percentage shown below each bar indicates the proportion of households with infants who ever purchased infant formula in that year.
To align the descriptive evidence with the annual household–year aggregation used in the demand estimation, we focus on annual descriptive patterns of prices and quantities. This choice avoids noise arising from sparse high-frequency purchases and ensures consistency between the descriptive analysis and the subsequent econometric framework. Figure 2 reports annual household–year average normalized real unit values for powder, ready-to-use, and concentrate infant formulas. Prices are expressed in real January 2014 dollars and are normalized to liquid-ounce equivalents to facilitate comparisons across formula forms with different preparation requirements.Footnote 2 Powder formula prices exhibit relatively modest variation over time, while ready-to-use prices display greater year-to-year fluctuation. Because purchases of ready-to-use and especially concentrate formula are sparse in some years, price series for these categories should be interpreted cautiously.
Annual average Normalized real unit values by infant-formula type, 2014–2022.
Note: The figure reports annual household–year average unit values (real January 2014 dollars), computed among households with positive purchases of the corresponding formula type in that year. Powder formula is shown in blue, ready-to-use formula in green, and concentrate formula in red. Prices for powder and concentrate are normalized to liquid-ounce equivalents to facilitate comparison with ready-to-use formula (i.e., expressed in dollars per liquid ounce). Normalized prices are presented for descriptive purposes and are not used in the demand estimation. Because purchases of ready-to-use and especially concentrate formula are sparse in some years, series based on these categories should be interpreted cautiously. Years with fewer than ten purchasing household–year observations for a given formula type are suppressed.
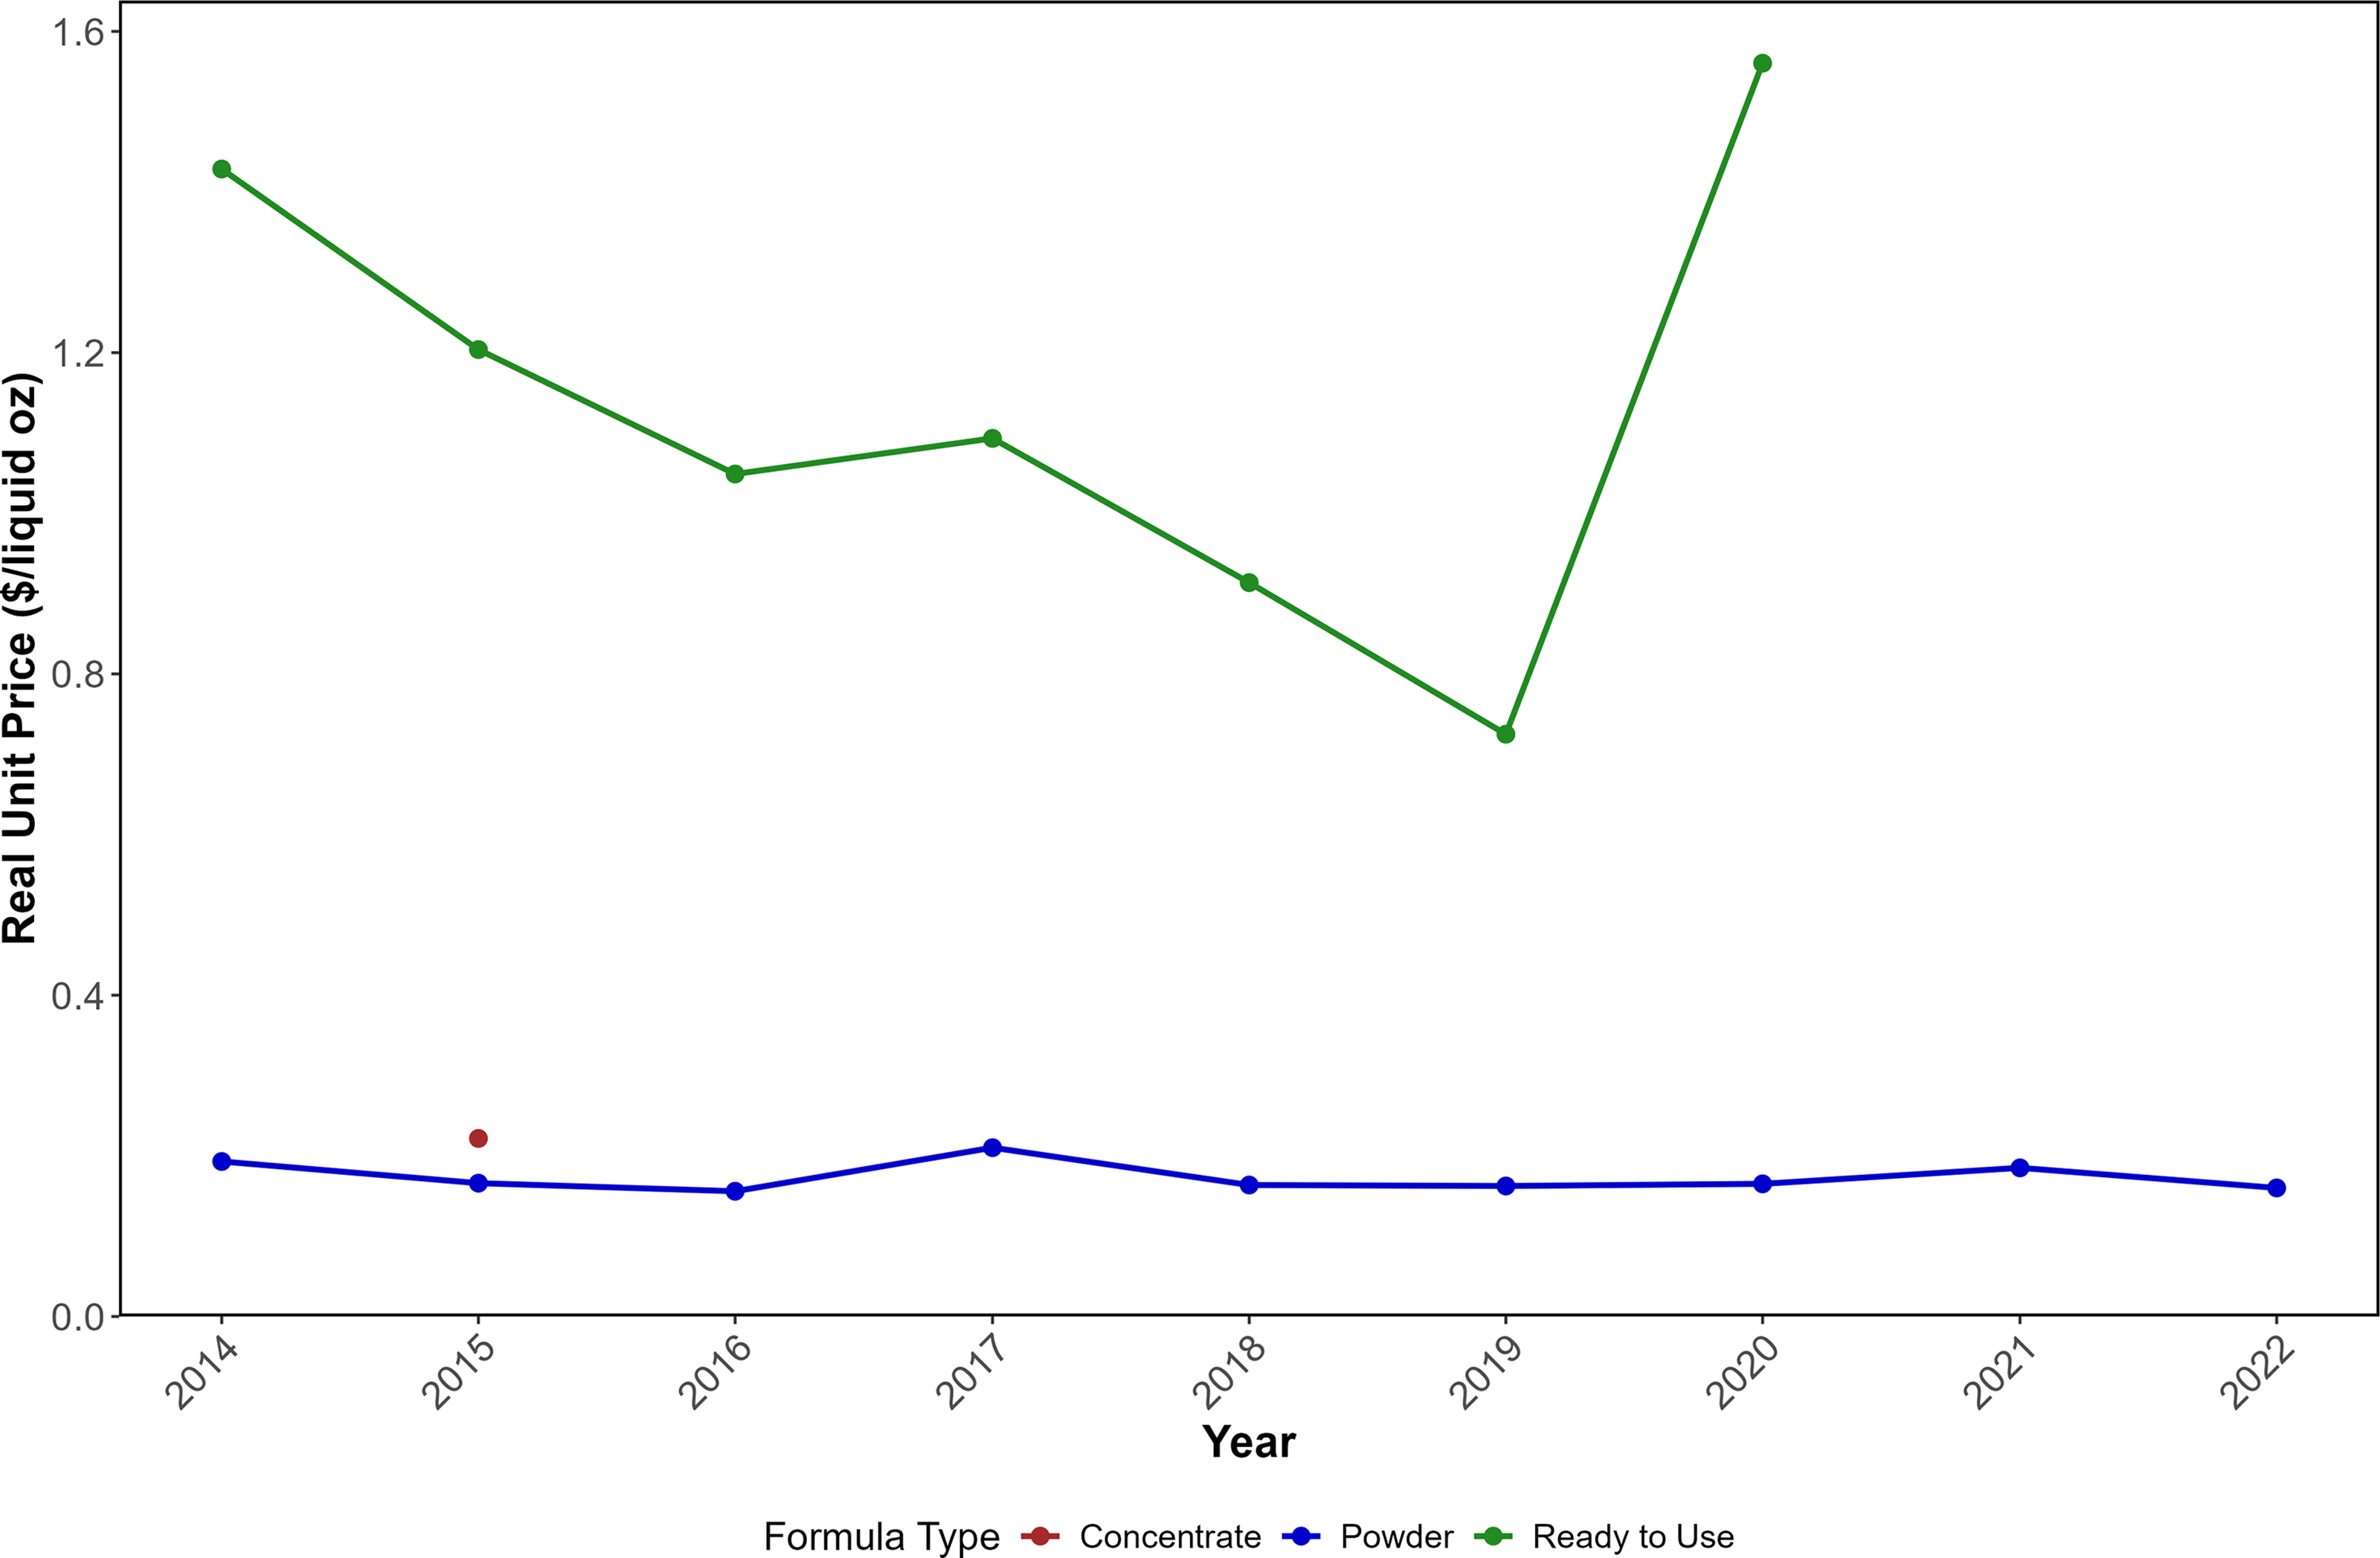
Figure 3 presents annual average quantities purchased per purchasing household, measured in ounces. Powder formula accounts for the largest share of quantities purchased and exhibits relatively stable annual patterns. In contrast, ready-to-use and concentrate formulas display greater variability over time, reflecting both lower purchase incidence and sensitivity to a small number of purchasing households. These figures are intended to document broad annual patterns rather than to identify behavioral responses to price changes.
Annual average quantity purchased per purchasing household by infant-formula type, 2014–2022.
Note: The figure reports annual average quantities (ounces) purchased per purchasing household, computed among households with positive purchases of the corresponding formula type in that year. Powder formula is shown in blue, ready-to-use formula in green, and concentrate formula in red. Because purchases of ready-to-use and concentrate formula are infrequent in several years, annual averages for these categories can be sensitive to a small number of observations and should be interpreted descriptively. Years with fewer than ten purchasing household–year observations for a given formula type are suppressed.

Table 2 reports summary statistics for the analytic sample, defined as household–year observations with positive infant-formula purchases. The table summarizes expenditure shares by formula type, unit values, total infant-formula expenditures, and key socio-demographic characteristics used in the demand estimation. Consistent with the purchase-incidence patterns documented above, powder formula accounts for the majority of infant-formula expenditure, while ready-to-use and concentrate formulas represent relatively small shares on average. Substantial variation is observed in unit values and total expenditures, reflecting heterogeneity in purchasing intensity across households and years.
Summary statistics (N = 1,675)
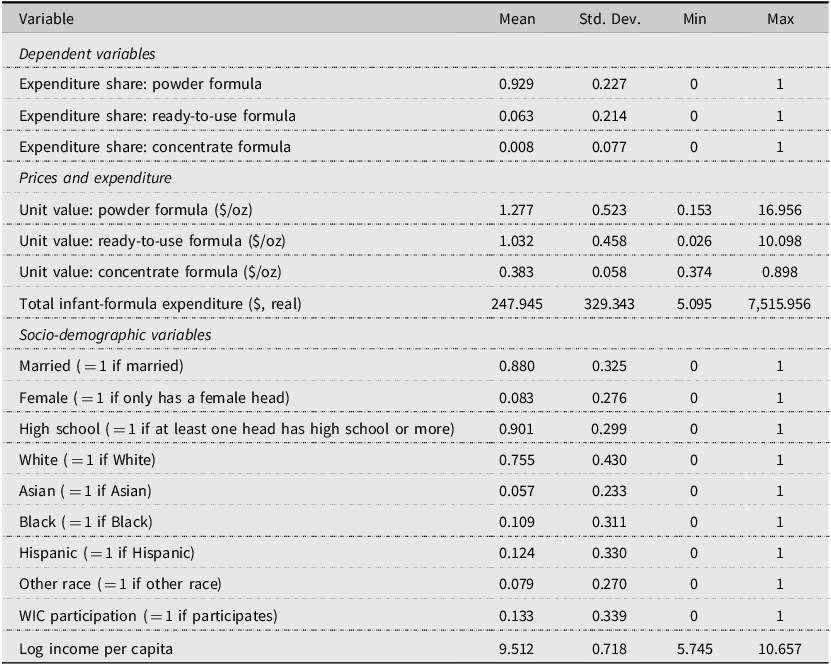
Table 2. Long description
The table presents summary statistics for 1,675 household-year observations with positive infant-formula purchases. It includes data on expenditure shares by formula type, unit values, total infant-formula expenditures, and key socio-demographic characteristics. The table has 18 rows and 5 columns. Column headers are Variable, Mean, Std. Dev., Min, and Max. Row labels are grouped under Dependent variables, Prices and expenditure, and Socio-demographic variables. Each row provides specific data points for these categories. For example, the expenditure share for powder formula has a mean of 0.929, a standard deviation of 0.227, a minimum of 0, and a maximum of 1. The table also includes various socio-demographic variables such as marital status, gender, education level, race, WIC participation, and log income per capita.
Notes: Summary statistics are computed for the estimation sample consisting of household–year observations with positive infant-formula purchases. Expenditure shares are defined as the share of total infant-formula expenditure allocated to each formula type within a household–year. Unit values are constructed as expenditures divided by quantities and expressed in real January 2014 dollars per ounce. Total infant-formula expenditure is measured in real dollars and aggregated to the annual household–year level. All socio-demographic variables are measured at the household level. The number of household–year observations in the estimation sample is 1,675. WIC: Special Supplemental Nutrition Program for Women, Infants, and Children.
Unit values are constructed as total expenditure (in dollars) divided by total quantity (in ounces) at the UPC level for each formula type, then aggregated to the household–year level and expressed in dollars per ounce throughout the manuscript. Among the 1,602 household observations with positive powder purchases, the median unit value is $1.17 per ounce, with an interquartile range of $0.92 to $1.34 and 98% of observations falling between $0.45 and $2.38 per ounce. Ready-to-use unit values (258 purchasing household observations) exhibit wider dispersion, with a median of $0.49 per ounce and an interquartile range of $0.24 to $1.62, reflecting greater heterogeneity in package sizes and product formats. Concentrate unit values (37 purchasing household observations) are tightly clustered, with a median of $0.40 per ounce and an interquartile range of $0.39 to $0.42. Extreme values in the tails of the powder and ready-to-use distributions likely reflect small-quantity purchases of specialty or single-serving products rather than systematic measurement error. Annual aggregation attenuates transaction-level noise arising from miscoding, promotional pricing, or unusual package sizes, and the price imputation procedure described in Section 3 further addresses unit-value quality by isolating price variation orthogonal to observable household characteristics. As a robustness check, we re-estimate the demand system after excluding household observations with unit values in the top or bottom 1% of each formula type’s distribution and find that the estimated elasticities are very similar to the baseline results (Appendix Table B3).
Since relatively few households purchase ready-to-use and concentrate formulas compared to powder, we further explore socio-demographic differences in formula-type purchases. Table 3 presents the proportions of households purchasing each formula type by demographic groups, with p-values from two-sample tests of proportions reported for each pairwise comparison.
Percentage of households with infants purchasing each infant-formula type, by socio-demographics (%)
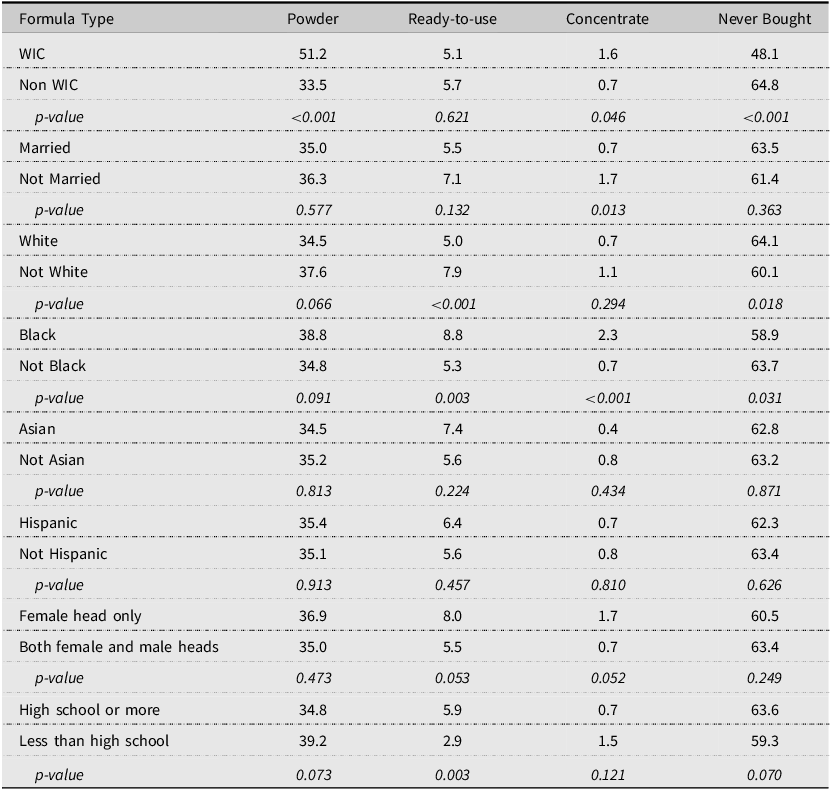
Table 3. Long description
The table presents the percentages of households with infants purchasing each infant-formula type, categorized by various socio-demographic factors. It includes columns for Powder, Ready-to-use, Concentrate, and Never Bought, with rows for different demographic groups such as WIC, marital status, race, and education level. Each row provides specific percentages for each formula type and includes p-values for pairwise comparisons. For example, the WIC row shows 51.2 percent for Powder, 5.1 percent for Ready-to-use, 1.6 percent for Concentrate, and 48.1 percent for Never Bought, with p-values indicating statistical significance. The table highlights variations in formula-type purchases across different socio-demographic groups.
Note: Table displays percentages of households with infants purchasing powder, ready-to-use, and concentrate infant formulas by socio-demographic groups. The “Never Bought” column indicates the percentage of households that never purchased any formula type. P-values are from two-sample tests of proportions for the pairwise comparison within each demographic group. Percentages may exceed 100% across rows because formula-type categories are not mutually exclusive. WIC: Special Supplemental Nutrition Program for Women, Infants, and Children.
WIC-participating households are significantly more likely to purchase powder formula (51.2%) compared to non-WIC households (33.5%), a difference significant at the 1% level. Purchases of ready-to-use formula are relatively similar between WIC (5.1%) and non-WIC households (5.7%), while concentrate formula purchases, though low overall, differ significantly at the 5% level (1.6% for WIC versus 0.7% for non-WIC). Marital status shows limited significant differences, with unmarried households slightly more frequently purchasing concentrate formula (1.7%) compared to married households (0.7%), significant at the 5% level.
Racial differences in formula-type purchases are more pronounced. Non-White households purchase ready-to-use formula significantly more often (7.9%) than White households (5.0%), significant at the 1% level. Specifically, Black households exhibit significantly higher purchases of both ready-to-use (8.8% vs. 5.3%) and concentrate formulas (2.3% vs. 0.7%) compared to non-Black households, each significant at the 1% level. Conversely, no significant differences in formula-type purchases are observed between Asian and non-Asian households or Hispanic and non-Hispanic households.
Education level is also associated with purchasing behaviors. Households headed by individuals with less than high school education purchase powder formula more frequently (39.2%) compared to more educated households (34.8%), significant at the 10% level, but are significantly less likely to purchase ready-to-use formula (2.9% vs. 5.9%), significant at the 5% level. Households with a female head only show slightly higher purchases of ready-to-use (8.0% vs. 5.5%) and concentrate (1.7% vs. 0.7%) formulas compared to those with a male head, differences significant at the 10% level. Overall, these patterns highlight important socio-demographic differences shaping infant formula purchasing decisions, highlighting meaningful socio-demographic heterogeneity in infant formula purchasing behavior.
To provide external context for these purchase-incidence patterns, we compare them with published breastfeeding prevalence from the 2022 National Immunization Survey (NIS) reported by the Centers for Disease Control and Prevention (CDC). According to the CDC, approximately 47.6% of infants in the United States are exclusively breastfed through the first three months of life.Footnote 3 In our sample, 1,675 out of 4,554 households with infants ever purchase infant formula.
Moreover, the demographic gradients observed in Table 3 align closely with those documented in NIS, which shows higher rates of exclusive breastfeeding among non-Hispanic White mothers and among mothers with higher educational attainment, and lower rates among non-Hispanic Black mothers and those with lower education levels. These same groups in our data exhibit lower and higher incidence of formula purchases, respectively, particularly for ready-to-use and concentrate formulas.Footnote 4 This alignment suggests that the heterogeneity in formula purchase incidence observed in the scanner data reflects meaningful differences in infant feeding practices across demographic groups rather than measurement error or sample artifacts.
In summary, these descriptive statistics suggest that socio-demographic factors, particularly WIC participation, race, and education, are closely associated with household purchasing behavior for different types of infant formula. The consistency between these patterns and nationally reported breastfeeding prevalence further supports the interpretation that observed non-purchase and purchase heterogeneity reflects underlying differences in infant feeding practices. Given these observed differences, it is essential to incorporate socio-demographic factors in the empirical analysis to accurately characterize price sensitivities and substitution patterns.
3. Methodology
We model household-level demand for three types of infant formula using the AIDS model (Banks, Blundell and Lewbel, Reference Banks, Blundell and Lewbel1997; Deaton and Muellbauer, Reference Deaton and Muellbauer1980). The dependent variable in each equation is the expenditure share of each type of infant formula, and each household’s expenditure share on powder, ready-to-use, and concentrate formula is modeled separately. The independent variables are the unit prices (per ounce) of all three types of formula and the total expenditure on all three types of infant formula, along with household-level socio-demographic variables of interest, including household head race and ethnicity, household per-capita income, and a binary variable indicating the household’s participation status in WIC.
We adopt the AIDS framework as a parsimonious and well-established demand system that is suitable for annual household–year data with limited support for some product categories. Although more flexible alternatives such as Quadratic AIDS (Banks, Blundell and Lewbel, Reference Banks, Blundell and Lewbel1997) or Exact Affine Stone Index (EASI) (Lewbel and Pendakur, Reference Lewbel and Pendakur2009) demand system can accommodate nonlinear Engel curves and richer heterogeneity, their application in this setting is constrained by substantial censoring and sparse purchases of ready-to-use and concentrate formula, particularly in subsample analyses. The AIDS model therefore provides a transparent and statistically stable framework for documenting category-level demand patterns across formula types and household groups. The AIDS model is specified as follows: ${w_{iht}} = {\alpha _i} + \sum\limits_{j = 1}^3 {{\gamma _{ij}}} \ln ({p_{jht}}) + {\beta _i}\ln \left( {{{{m_{ht}}} \over {{P_{ht}}}}} \right) + {\delta _i}{z_{ht}},$
where:
-
• w iht : Expenditure share for good i of household h in year t.
-
• α i : Good-specific constant.
-
• γ ij : Coefficient reflecting cross-price effects.
-
• p jht : Average price (dollars/ounce) for good j, household h, year t.
-
• β i : Coefficient for total expenditure effect.
-
• m ht : Total infant formula expenditure for household h in year t.
-
• z ht : Socio-demographic vector (log per-capita income, marital status, race/ethnicity, gender, education, WIC participation).
-
• δ i : Socio-demographic coefficients for good i.
-
• P: Stone price index, defined as:
Consistent with the linearized AIDS specification, we approximate the price aggregator using the Stone price index, constructed as a weighted average of log prices using sample mean expenditure shares following Lecocq and Robin (Reference Lecocq and Robin2015): $ \ln (P_{ht}) = \sum _{i=1}^{3} \bar {w}_i \ln (p_{iht}), $
which serves as a first-order approximation to the exact price index and is standard in empirical applications of the AIDS model.
To ensure the AIDS model adheres to fundamental economic principles and generates meaningful interpretations, several theoretical restrictions must be applied. These include adding-up, homogeneity, and symmetry:
-
a. Adding-Up:
The adding-up assumption ensures total formula expenditure is fully allocated across the three types. Formally, $ \sum _{i=1}^{3} w_{iht} = 1, $
implying restrictions on parameters as follows: $ \sum _{i=1}^{3}\alpha _i = 1, \quad \sum _{i=1}^{3}\gamma _{ij} = 0\; \forall j, \quad \sum _{i=1}^{3}\beta _i = 0 $
These conditions guarantee consistency with consumer budget constraints, ensuring all shares sum precisely to 100%.
-
b. Homogeneity:
The homogeneity assumption states that demand is homogeneous of degree zero in prices and total expenditure. This means that if all prices and total expenditure increase proportionally, the expenditure shares remain unchanged. Essentially, only relative price changes, not absolute price levels, affect demand. This condition requires that the sum of the price elasticities of demand is zero: $ \sum _{j=1}^{3}\gamma _{ij} = 0 \quad {\rm for\ each\ } i $
This implies that the coefficients γ ij in the demand system must satisfy this restriction to maintain the property of homogeneity. As a result, the demand system remains consistent with the theory of consumer choice under proportional price and expenditure changes.
-
c. Symmetry: Cross-price effects are symmetric:
Symmetry requires cross-price effects to be reciprocal between formula types, reflecting consistent consumer preferences. Formally: $ \gamma _{ij} = \gamma _{ji} $
Symmetry arises naturally from assuming twice differentiable consumer preferences, where cross-price substitution between goods must be equal in both directions.
From the estimated parameters, we compute uncompensated own-price elasticities, compensated cross-price elasticities, and expenditure elasticities. Uncompensated own-price elasticities capture the total response to price changes, while compensated cross-price elasticities isolate substitution effects holding utility constant. Expenditure elasticities describe how demand responds to changes in total infant-formula expenditure and are interpreted as proxies for income elasticities, following standard practice in demand system analysis (Deaton and Muellbauer, Reference Deaton and Muellbauer1980). All elasticities are interpreted as descriptive, category-level measures rather than structural or welfare parameters.
Two econometric issues may bias elasticity estimates: censoring and price endogeneity. Censoring arises because many households do not purchase certain formula types in a given year, resulting in zero expenditure shares. We address censoring using a generalized Heckman two-step procedure, separating the extensive margin of purchase from the intensive margin of conditional demand (Heckman, Reference Heckman1979; Maddala, Reference Maddala1983; Muñoz et al., Reference Muñoz, Hufstedler, Gustafson, Bärnighausen, De Jong and Debray2023). In the first step, we estimate a probit model for the purchase decision of each formula type separately as a function of household socio-demographic characteristics and Census region fixed effects. Inverse Mills ratios derived from these models are then included in the corresponding AIDS equations to adjust for selection into the purchasing sample.Footnote 5 This approach is adopted to provide a practical and transparent correction for selection in the presence of sparse purchases, particularly for ready-to-use and concentrate formula, where fully censored system estimators are infeasible due to limited support (e.g., Capps and Wang, Reference Capps and Wang2024).
Price endogeneity arises because observed unit values may reflect unobserved quality choices or market segmentation (Feenstra and Romalis, Reference Feenstra and Romalis2014; Semadeni, Withers and Trevis Certo, Reference Semadeni, Withers and Trevis Certo2014). If uncorrected, this can bias estimated elasticities (Cox and Wohlgenant, Reference Cox and Wohlgenant1986; Deaton, Reference Deaton1988; Gibson and Rozelle, Reference Gibson and Rozelle2011). To address price endogeneity, we implement a control-function–type imputation approach commonly used in household demand analyses (e.g., Alviola and Capps, Reference Alviola and Capps2010; Bakhtavoryan et al., Reference Bakhtavoryan, Cheng, Capps and Dharmasena2022; Capps and Wang, Reference Capps and Wang2024; Dong, Gould and Kaiser, Reference Dong, Gould and Kaiser2004; Kyureghian, Capps and Nayga, Reference Kyureghian, Capps and Nayga2011; Park et al., Reference Park, Holcomb, Raper and Capps1996). Specifically, following a similar procedure to Capps and Wang (Reference Capps and Wang2024), Capps et al. (Reference Capps, Jia, Mishra and Ogieriakhi2024), Park et al. (Reference Park, Holcomb, Raper and Capps1996), and Wang and Capps (Reference Wang and Capps2025), observed unit values for each formula type are regressed on household socio-demographic characteristics. Imputed prices are then constructed from the estimated regression intercept and residuals, isolating price variation orthogonal to observed household characteristics. Households that do not purchase a given formula type are assigned the intercept as their imputed price.Footnote 6 , Footnote 7
We conduct the analysis using annual household–year data. Annual aggregation is chosen to align with the estimation framework and to avoid noise and mechanical artifacts arising from sparse high-frequency purchases. Using quarterly or monthly data would require extensive imputation and yield limited additional identifying variation given the infrequency of purchases for some formula types.
After estimating the model on the full sample, we first investigate how demand patterns differ by WIC participation status. Recognizing that WIC eligibility is means-tested and closely linked to income, we restrict our analysis to low-income households with gross income below 185% of the federal poverty line (FPL), the standard federal income eligibility threshold for WIC (excluding adjunctive eligibilityFootnote 8 ). Noteworthy, WIC participation in this study is treated as a stratifying characteristic rather than an exogenous treatment, and the analysis does not aim to identify causal program effects.
Subsequently, we conduct a broader subsample analysis by household income to explore how income alone shapes demand behavior. Specifically, we estimate the AIDS model separately for low-income and mid-to-high-income households, defined by gross income below and above 185% of the FPL, a commonly used benchmark for federal nutrition assistance eligibility including WIC. This subsample analysis documents how demand patterns vary across income groups, independent of program participation, and is interpreted descriptively.
4. Results
4.1. Elasticities – Full sample analysis
Table 4-(A) presents estimates of uncompensated own-price elasticities and total expenditure elasticities for the full sample of households with infants.
Elasticity estimates for the full sample of households with infants
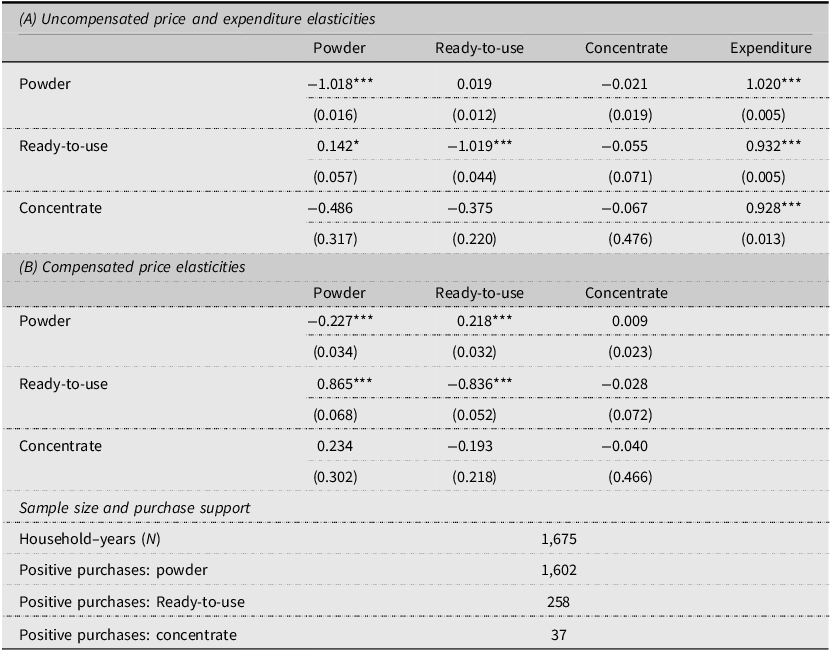
Table 4. Long description
A table comparing elasticity estimates for households with infants. The table has two main sections: (A) Uncompensated price and expenditure elasticities, and (B) Compensated price elasticities. Section A has four columns: Powder, Ready-to-use, Concentrate, and Expenditure, with three row labels: Powder, Ready-to-use, and Concentrate. Section B has three columns: Powder, Ready-to-use, and Concentrate, with the same three row labels. Sample size and purchase support are listed below the table. Row 1: Powder, -1.018***, 0.019, -0.021, 1.020***. Row 2: Ready-to-use, 0.142*, -1.019***, -0.055, 0.932***. Row 3: Concentrate, -0.486, -0.375, -0.067, 0.928**. Row 4: Powder, -0.227***, 0.218***, 0.009. Row 5: Ready-to-use, 0.865***, -0.836***, -0.028. Row 6: Concentrate, 0.234, -0.193, -0.040. Sample size and purchase support: Household-years (N), 1,675. Positive purchases: powder, 1,602. Positive purchases: Ready-to-use, 258. Positive purchases: concentrate, 37.
Notes: Panel (A) reports uncompensated own- and cross-price elasticities and expenditure elasticities; Panel (B) reports compensated (Hicksian) cross-price elasticities, which measure substitution responses holding utility constant. In both panels, each entry is read as the percentage change in demand for the formula type listed in the row in response to a one-percent change in the price of the formula type listed in the column. For example, the entry in the Ready-to-Use row and Powder column of Panel (B) represents the percentage change in ready-to-use demand associated with a one-percent increase in the price of powder formula, holding utility constant. A positive cross-price entry in Panel (B) indicates net substitutability between two formula forms. The lower panel reports the number of household–year observations and the number of positive purchase observations underlying the estimates. Standard errors are in parentheses. Statistical significance is indicated by *p < 0.05, **p < 0.01, and ***p < 0.001. Elasticities are estimated using the Almost Ideal Demand System (AIDS) model, accounting for censoring via a Heckman selection correction and price endogeneity via a control-function approach. All elasticities are interpreted as descriptive, category-level measures.
For concentrate formula, the estimated own-price elasticity is not statistically significant and is imprecisely estimated. As shown in the sample support panel of Table 4, concentrate purchases are observed in only a few household–year observations. The limited number of positive purchases likely contributes to the instability and lack of precision in the estimated concentrate elasticity.
The estimated total expenditure elasticities for powder, ready-to-use, and concentrate formulas are 1.020, 0.932, and 0.928, respectively, and are all statistically significant at the 1% level. These elasticities describe how demand for each formula type varies with total infant-formula expenditure and are interpreted as proxies for expenditure responsiveness within the infant-formula category. The expenditure elasticity for powder formula is close to one, while the elasticities for ready-to-use and concentrate formulas are modestly below one, suggesting relatively stable budget allocation patterns across formula types as total infant-formula expenditure changes.
Table 4-(B) reports compensated cross-price elasticities, which summarize substitution patterns across formula types while holding utility constant. We focus interpretation on powder and ready-to-use formulas, given the limited support for concentrate purchases. The positive and statistically significant compensated cross-price elasticities between powder and ready-to-use indicate substitutability between these two forms of infant formula. The estimated cross-price elasticities are asymmetric in magnitude, with larger responses observed when powder prices increase relative to when ready-to-use prices increase. Within the context of broad, form-level product aggregation, these asymmetries are likely shaped in part by the sample composition documented in Section 2: nearly all formula-purchasing households in the analytic sample purchase powder, while only a small subset purchases ready-to-use, and most of those ready-to-use purchasers buy powder as well. As interior consumers of powder, households can readily reallocate away from powder when powder prices rise; the reverse substitution – from ready-to-use toward powder – is mechanically bounded because most ready-to-use purchasers already purchase powder. These asymmetries therefore reflect how adjustments are distributed across formula types in the estimated demand system given the underlying purchase-incidence structure, rather than providing evidence on specific behavioral mechanisms.Footnote 9
Table 6 reports coefficient estimates for socio-demographic controls included in the demand system. These coefficients capture systematic differences in expenditure shares across household characteristics and over time and serve to account for observable heterogeneity in infant formula purchasing patterns rather than to identify causal demographic effects. In particular, at face value, the WIC coefficients in Table 6 indicate that WIC participation is associated with a lower expenditure share on powder formula and a higher expenditure share on ready-to-use formula, conditional on the other controls. Because WIC benefits predominantly cover powder formula, this pattern may initially appear counterintuitive. One interpretation, consistent with program design rather than with a behavioral preference shift, is that the scanner data record expenditures only for out-of-pocket transactions and do not capture voucher-funded purchases. To the extent that WIC vouchers shift powder purchases toward (near-)zero recorded out-of-pocket expenditure while ready-to-use formula – which is less consistently WIC-eligible – is typically purchased out of pocket, the observed expenditure share on powder will mechanically decline among WIC households even when these households purchase powder formula at high rates. This reconciliation is consistent with the descriptive evidence in Table 3, which shows that WIC households are substantially more likely than non-WIC households to purchase powder formula. We caution, however, that the scanner-data limitations described above and in Section 4.2 preclude a definitive explanation, and we report the coefficients as descriptive associations.
Almost ideal demand system model estimates: model parameters
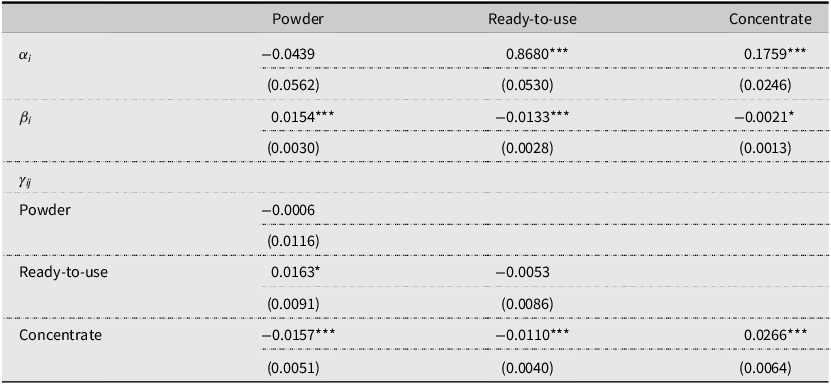
Table 5. Long description
The table presents estimates of model parameters for powder, ready-to-use, and concentrate using the Almost Ideal Demand System model. It includes good-specific constants, total expenditure effects, and cross-price coefficients. The table has 3 rows and 3 columns for the parameters, with standard errors in parentheses. Notable values include 0.8680 for ready-to-use under good-specific constants, 0.0154 for powder under total expenditure effects, and 0.0266 for concentrate under cross-price coefficients. Statistical significance is indicated with asterisks.
Note: Parameter estimates from the Almost Ideal Demand System (AIDS) model accounting for censoring and price endogeneity, including good-specific constants (α i ), total expenditure effects (β i ), and cross-price coefficients (γ ij ). Standard errors are in parentheses. Statistical significance: *p < 0.05, **p < 0.01, ***p < 0.001.
Almost ideal demand system model estimates: demographic controls
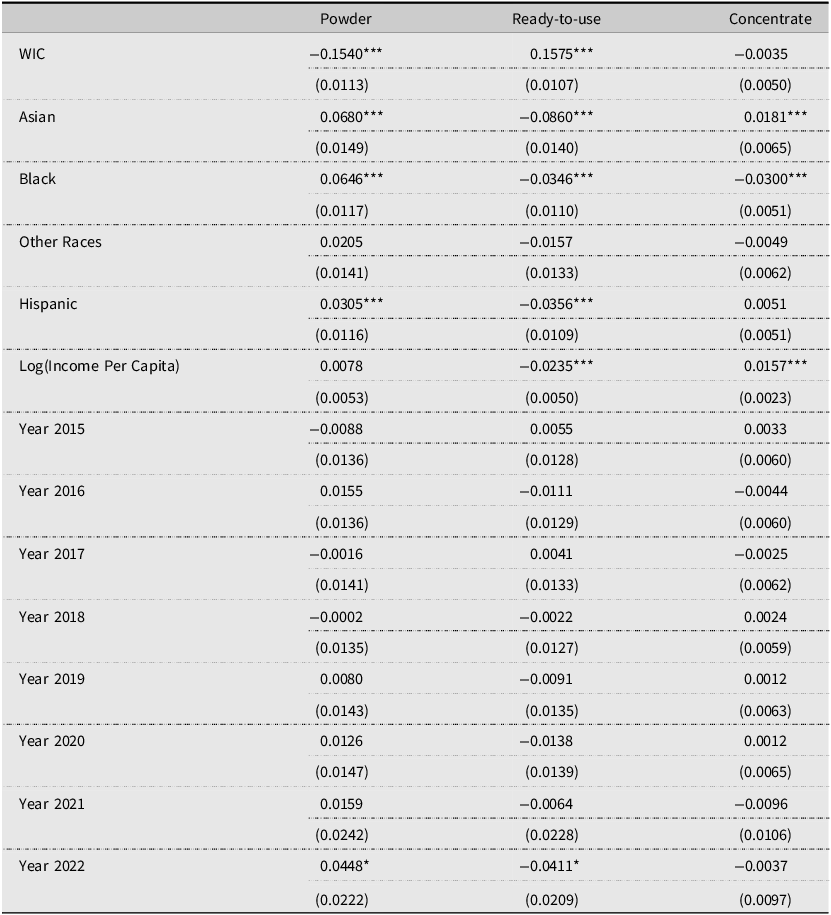
Table 6. Long description
A table with 13 rows and 4 columns showing coefficient estimates for socio-demographic controls in the infant formula demand system. The columns are labeled Powder, Ready-to-use, and Concentrate. The rows are labeled with different demographic groups and years. Each cell contains a coefficient estimate with its standard error in parentheses. Notable trends include significant coefficients for WIC, Asian, Black, Other Races, Hispanic, and Log(Income Per Capita) across different formula types. The table captures systematic differences in expenditure shares across household characteristics and over time.
Note: Estimates for socio-demographic control variables on expenditure shares for powder, ready-to-use, and concentrate formulas from the Almost Ideal Demand System (AIDS) model, accounting for censoring and price endogeneity. The reference categories are White for race and the year 2014. Standard errors are in parentheses. WIC: Special Supplemental Nutrition Program for Women, Infants, and Children. Statistical significance is indicated by asterisks: *p < 0.05, **p < 0.01, ***p < 0.001.
4.2. Elasticities – WIC vs. Non-WIC among Low-Income Households
Elasticity estimates comparing WIC-participating households (N = 162 household–years) and non-WIC households (N = 404 household–years) within the low-income sample are reported in Table 7. Panel (A) shows that uncompensated own-price elasticities for powder formula are very similar across WIC (–1.014) and non-WIC (–0.996) households and are statistically significant at the 1% level in both groups. These estimates indicate that, among low-income households, demand for powder formula responds approximately proportionally to price changes regardless of WIC participation status.
Elasticity estimates by WIC participation status with income <185% of federal poverty line
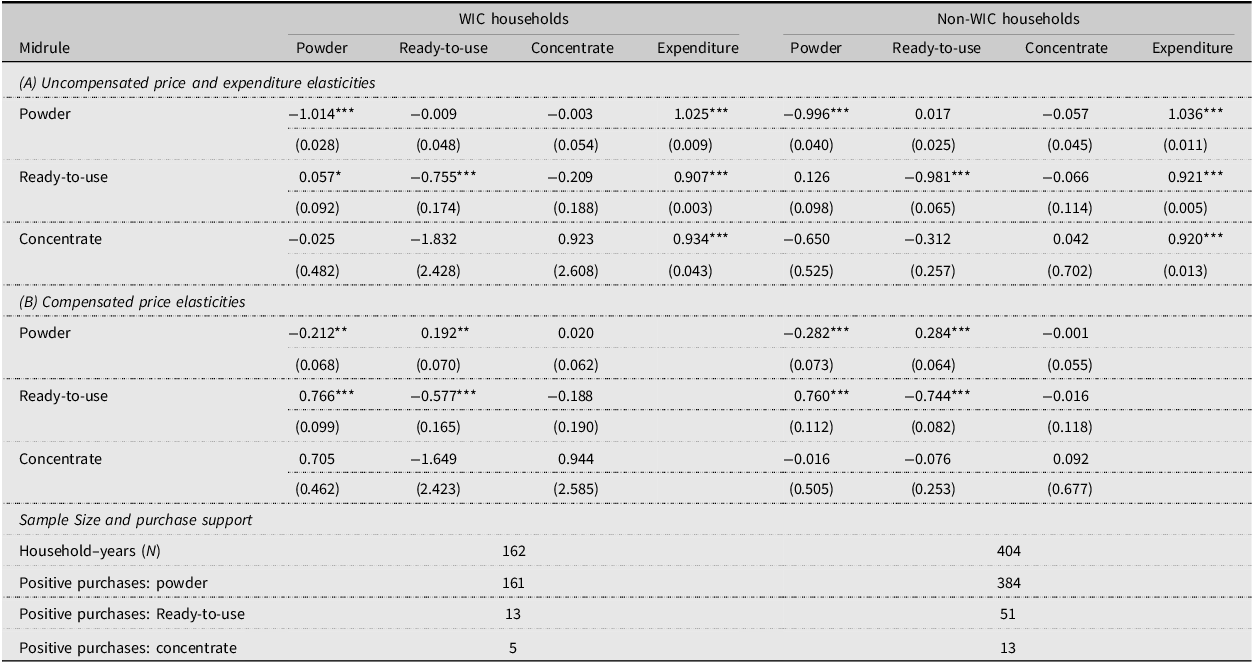
Table 7. Long description
The table compares elasticity estimates for WIC and non-WIC households within a low-income sample. It has 16 rows and 10 columns. The columns are labeled as Midrule, Powder, Ready-to-use, Concentrate, Expenditure for WIC households, and Powder, Ready-to-use, Concentrate, Expenditure for non-WIC households. The rows are labeled with (A) Uncompensated price and expenditure elasticities and (B) Compensated price elasticities. Sample Size and purchase support are also included. Row 1: Powder, -1.014***, -0.009, -0.003, 1.025***, -0.996***, 0.017, -0.057, 1.036***. Row 2: Ready-to-use, 0.057*, -0.755***, -0.209, 0.907***, 0.126, -0.981***, -0.066, 0.921***. Row 3: Concentrate, -0.025, -1.832, 0.923, 0.934***, -0.650, -0.312, 0.042, 0.920***. Row 4: Powder, -0.212**, 0.192**, 0.020, -0.282**, 0.284***, -0.001. Row 5: Ready-to-use, 0.766***, -0.577***, -0.188, 0.760***, -0.744***, -0.016. Row 6: Concentrate, 0.705, -1.649, 0.944, -0.016, -0.076, 0.092. Row 7: Household-years (N), 162, 404. Row 8: Positive purchases: powder, 161, 384. Row 9: Positive purchases: Ready-to-use, 13, 51. Row 10: Positive purchases: concentrate, 5, 13.
Notes: Elasticity estimates are reported for households with income below 185% of the federal poverty line (FPL). Columns compare WIC-participating and non-WIC households within this income group. Panel (A) reports uncompensated own- and cross-price elasticities and expenditure elasticities; Panel (B) reports compensated (Hicksian) cross-price elasticities, which measure substitution responses holding utility constant. In both panels, each entry is read as the percentage change in demand for the formula type listed in the row in response to a one-percent change in the price of the formula type listed in the column. A positive cross-price entry in Panel (B) indicates net substitutability between two formula forms. The lower panel reports the number of household–year observations and the number of positive purchase observations underlying each set of estimates. Standard errors are in parentheses. Statistical significance is indicated by *p < 0.05, **p < 0.01, and ***p < 0.001. Elasticities are estimated using the Almost Ideal Demand System (AIDS) model. All elasticities are interpreted as descriptive, category-level measures. WIC: Special Supplemental Nutrition Program for Women, Infants, and Children.
For ready-to-use formula, the estimated own-price elasticity is smaller in magnitude for WIC households (–0.755) than for low-income non-WIC households (–0.981), with both estimates statistically significant. However, as shown in the sample support panel of Table 7, ready-to-use purchases are observed in only 13 WIC household–year observations, compared with 51 among non-WIC households. Given this limited support, the difference in estimated ready-to-use elasticities should be interpreted cautiously, and we do not emphasize statistical distinctions between the two groups. Elasticity estimates for concentrate formula remain imprecisely estimated in both groups, reflecting the small number of positive purchases.
Panel (B) presents compensated cross-price elasticities, which summarize substitution patterns between formula types while holding utility constant. For both WIC and non-WIC households, the estimated cross-price elasticities indicate substitution between powder and ready-to-use formulas. When ready-to-use prices increase, both groups exhibit an increase in powder demand, with the estimated response slightly larger for non-WIC households than for WIC households. Conversely, when powder prices increase, both WIC and non-WIC households exhibit sizeable increases in ready-to-use demand of similar magnitude. Overall, substitution patterns between powder and ready-to-use formulas appear broadly comparable across WIC participation status, particularly for the most commonly purchased formula forms.
Taken together, the elasticity estimates indicate that price responsiveness and substitution patterns between powder and ready-to-use formulas are broadly similar across WIC and non-WIC households within the low-income sample. However, it is important to note that the scanner data do not distinguish between voucher-funded and out-of-pocket transactions. Accordingly, WIC-related elasticities are interpreted as descriptive of observed purchasing behavior conditional on recorded transactions, rather than as responses to prices faced at the point of voucher redemption. Given the limited size of the WIC subsample (162 household observations, with only 13 positive ready-to-use purchases among WIC households), these comparisons should be interpreted as exploratory rather than as definitive evidence of how WIC participation shapes formula demand. Establishing WIC-specific demand parameters with greater precision would require larger targeted samples or administrative data that link benefit redemption to purchasing records.
4.3. Elasticities – Low-income vs. Mid-to-high-income households
Elasticity estimates comparing low-income households (N = 566 household–years) and mid-to-high-income households (N = 1, 109 household–years), defined using an income threshold at 185% of the FPL, are reported in Table 8. Panel (A) shows that uncompensated own-price elasticities for both powder and ready-to-use formulas are very similar across income groups and are statistically significant at the 1% level. For powder formula, the estimated own-price elasticity is –1.022 among low-income households and –1.014 among mid-to-high-income households. For ready-to-use formula, the corresponding elasticities are –0.996 and –1.023. These estimates indicate broadly comparable price sensitivity across income groups for the two most frequently purchased formula forms.
Elasticity estimates by income group (Threshold: 185% of federal poverty line)
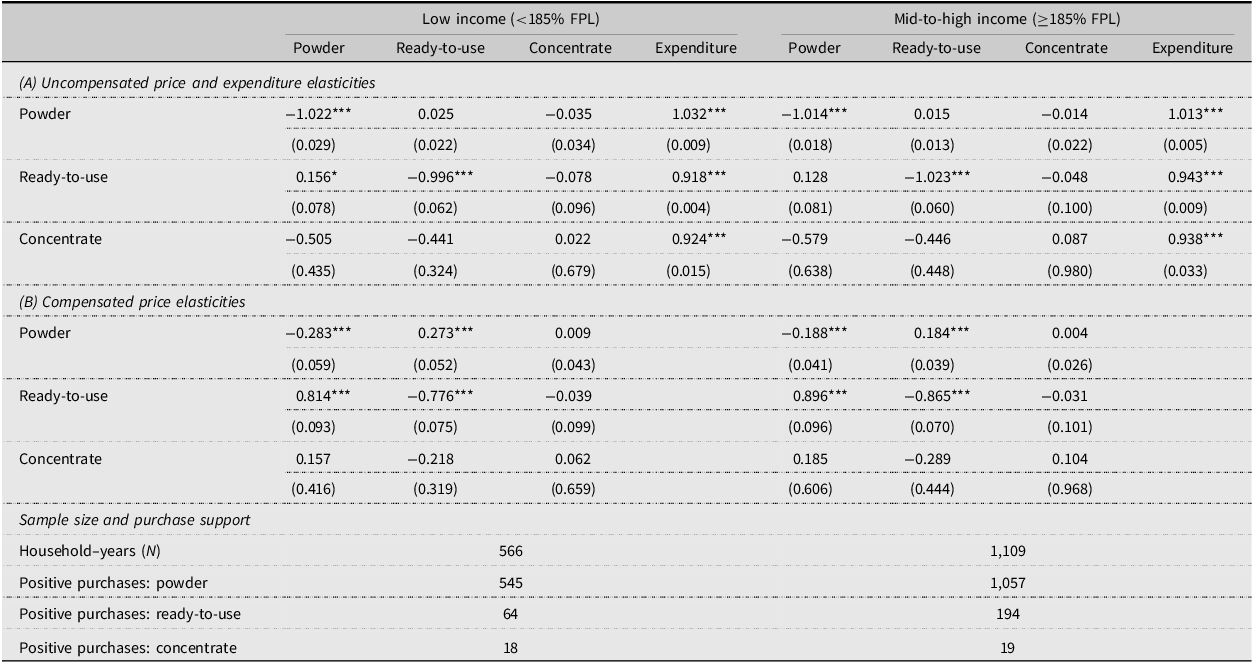
Table 8. Long description
A table comparing elasticity estimates by income groups, divided into low income (<185% FPL) and mid-to-high income (≥185% FPL). The table has 12 rows and 10 columns. Column headers are: Powder, Ready-to-use, Concentrate, Expenditure for both Low income and Mid-to-high income groups. Row labels are: Powder, Ready-to-use, Concentrate under sections (A) Uncompensated price and expenditure elasticities and (B) Compensated price elasticities. Sample size and purchase support section includes Household-years (N), Positive purchases: powder, Positive purchases: ready-to-use, Positive purchases: concentrate. Each cell contains numerical values with standard errors in parentheses. Notable trends include significant own-price elasticities for powder and ready-to-use formulas across income groups, indicating comparable price sensitivity.
Notes: Elasticity estimates are reported separately for households below and above 185% of the federal poverty line (FPL). Panel (A) reports uncompensated own- and cross-price elasticities and expenditure elasticities; Panel (B) reports compensated (Hicksian) cross-price elasticities, which measure substitution responses holding utility constant. In both panels, each entry is read as the percentage change in demand for the formula type listed in the row in response to a one-percent change in the price of the formula type listed in the column. A positive cross-price entry in Panel (B) indicates net substitutability between two formula forms. The lower panel reports the number of household–year observations and the number of positive purchase observations underlying each set of estimates. FPL: federal poverty line. Standard errors are in parentheses. Statistical significance is indicated by *p < 0.05, **p < 0.01, and ***p < 0.001. Elasticities are estimated using the Almost Ideal Demand System (AIDS) model. All elasticities are interpreted as descriptive, category-level measures.
Differences across income groups are more apparent in compensated cross-price elasticities, reported in Panel (B). When ready-to-use formula prices increase, the estimated substitution toward powder is somewhat larger for low-income households than for mid-to-high-income households. The magnitude of this difference is modest, and the direction is broadly in line with prior evidence that substitution responses to relative price changes can be more pronounced among lower-income households (e.g., Andreyeva, Long and Brownell, Reference Andreyeva, Long and Brownell2010; Jensen and Miller, Reference Jensen and Miller2008; LaFrance, Reference LaFrance2005). At the same time, as shown in the sample support panel of Table 8, ready-to-use purchases are observed in a relatively limited number of household–year observations, and these differences should therefore be interpreted cautiously.
By contrast, substitution responses from powder price increases to ready-to-use demand are large and of similar magnitude for both low-income and mid-to-high-income households. This pattern suggests that, within the estimated demand system, powder-to-ready-to-use substitution represents an important adjustment margin across income groups.
Overall, the results in Table 8 indicate that demand responsiveness for powder and ready-to-use formulas is broadly stable across income groups, with only modest variation in substitution magnitudes.
5. Discussions and conclusion
This study provides a household-level analysis of demand for three major infant formula forms – powder, ready-to-use, and concentrate – using an Almost Ideal Demand System (AIDS) with adjustments for censoring and price endogeneity, with the goal of understanding how prices and institutional settings shape observed formula access among households. The analysis documents how own-price, cross-price, and expenditure responses vary across product forms and household characteristics, and how observed demand patterns differ by income and participation in WIC.
Several findings emerge. First, demand for powder and ready-to-use formula is approximately unit elastic, and substitution between these two forms is asymmetric. Powder formula – by far the most commonly purchased form – accounts for the majority of infant-formula expenditures and exhibits relatively stable demand. Adjustments in response to price changes are concentrated along the powder–ready-to-use margin, underscoring the central role of powder formula within the category, consistent with prior evidence on cost differences and WIC market structure (Davis, Reference Davis2011; Huang and Perloff, Reference Huang and Perloff2014). As discussed in Section 4.1, the asymmetry of these adjustments is likely shaped in part by the sample-composition structure documented in Section 2: nearly all formula-purchasing households are interior consumers of powder, while ready-to-use purchasers are a small subset who typically also purchase powder, mechanically bounding the scope for substitution toward powder. At the level of aggregation used in this study, these patterns indicate how adjustments are distributed across formula forms rather than identifying household-level switching behavior.
Second, differences between WIC and non-WIC households are generally modest but informative when interpreted in light of institutional features of the program. Among low-income households, estimated own-price elasticities for powder formula are very similar across WIC participation status, while elasticities for other forms are less precisely estimated due to sparse purchases. Importantly, the scanner data do not distinguish between voucher-funded and out-of-pocket transactions. As a result, estimated price sensitivities for WIC households reflect observed purchasing behavior conditional on recorded transactions rather than responses to prices faced at the point of voucher redemption.
These patterns can be interpreted in light of how WIC benefits are structured across formula forms. Because WIC predominantly covers powder formula at no out-of-pocket cost, WIC households may be less exposed to market price variation for powder than for other forms. Ready-to-use and concentrate formulas, which are more limited in WIC eligibility, are more likely to be purchased out of pocket. Observed differences in estimated price responsiveness across formula types therefore align with program design and availability constraints rather than differences in household preferences or behavioral “shielding.”
Third, differences in price responsiveness across income groups are relatively small. Own-price elasticities for powder and ready-to-use formulas are similar across low-income and mid-to-high-income households, and substitution patterns differ only modestly. One plausible interpretation is that preferences for meeting infants’ nutritional needs are relatively similar across income groups once households rely on formula, limiting heterogeneity in price responsiveness despite differences in economic resources. This interpretation is offered as a post hoc explanation of the observed patterns rather than as an a priori hypothesis or a formally tested behavioral mechanism, but is consistent with the essential nature of infant nutrition and the constrained scope for substitution within the formula category (Victora et al., Reference Victora, Bahl, Barros, França, Horton, Krasevec and Rollins2016).
Taken together, the relative uniformity of price responsiveness across income and WIC groups is itself a substantive finding. In the broader applied demand literature, income and program participation frequently predict meaningful differences in price elasticities for food products. For example, studies of the Supplemental Nutrition Assistance Program (SNAP) have documented that low-income and SNAP-participating households exhibit different expenditure and price responses than higher-income households for a range of food categories (Hastings and Shapiro, Reference Hastings and Shapiro2018; Hoynes et al., Reference Hoynes, McGranahan and Schanzenbach2015), and meta-analytic evidence indicates that price elasticities for food vary systematically with income (Andreyeva, Long and Brownell, Reference Andreyeva, Long and Brownell2010). Against this backdrop, the finding that infant formula demand is broadly invariant to income and WIC participation status suggests that infant formula occupies a distinct position within household food budgets – one where the essential and non-substitutable nature of infant nutrition constrains the scope for demand adjustment regardless of economic circumstances. For policy, this stability implies that market-price changes – including the price disruptions observed during the 2022 infant formula shortage – would affect formula purchasing behavior comparably across income and WIC groups, conditional on the current benefit structure. This finding provides an empirical benchmark for evaluating the distributional effects of formula price shocks and for informing discussions of WIC benefit design and infant formula access. We note, however, that the WIC comparison is based on a limited subsample and should be interpreted as illustrative; establishing definitive WIC-specific demand parameters would require richer data or larger targeted surveys.
Several policy interpretations follow from this stability. First, market-level interventions aimed at stabilizing powder formula prices – whether through procurement contracting, supply-chain resilience investment, or temporary price supports during shortages – appear to confer relatively uniform benefits across income groups, given that powder-form price responsiveness is comparable for low-income, mid-to-high-income, WIC, and non-WIC households in our descriptive estimates. Second, the absence of meaningfully different price responsiveness between WIC and non-WIC households within the low-income sample raises questions about the extent to which WIC’s current benefit structure differentially shields participants from formula-price volatility. Because WIC benefits are allocated on a fixed-quantity rather than fixed-budget basis, and because non-eligible forms and out-of-allotment purchases remain exposed to market prices, the program’s calibration to insulate households from price shocks may warrant re-examination, particularly in light of the 2022 shortage (Kalaitzandonakes, Ellison and Coppess, Reference Kalaitzandonakes, Ellison and Coppess2023). These interpretations are offered as policy-relevant readings of the descriptive evidence rather than as causal claims about program effects, and definitive evaluation of WIC-specific responsiveness would require larger samples and benefit-redemption-linked data.
Beyond income and WIC participation, socio-demographic characteristics – including race, ethnicity, and education – are associated with differences in formula purchasing patterns. These differences likely reflect a combination of cultural feeding norms, information access, caregiving arrangements, and economic constraints, rather than price responsiveness alone (Pak-Gorstein, Haq and Graham, Reference Pak-Gorstein, Haq and Graham2009). Recognizing this heterogeneity is important for contextualizing observed demand patterns and for understanding how infant nutrition policies interact with diverse household circumstances.
Convenience considerations may also help contextualize differences across formula forms. Ready-to-use formula is typically associated with higher convenience but higher cost, while powder formula is less convenient but substantially more affordable and therefore more widely purchased. Households purchasing ready-to-use formula represent a relatively small subset of purchasers and may do so for situational reasons – such as time constraints, travel, or caregiving arrangements – rather than as a primary feeding strategy. These considerations are offered as contextual interpretation rather than as evidence of causal mechanisms.
Several limitations point to avenues for future research. The analysis focuses exclusively on infant formula and does not capture how WIC households may reallocate benefits across other WIC-eligible food categories when formula prices rise or when supply disruptions occur. Extending the analysis to broader food-at-home expenditures could provide insight into substitution across benefit categories and household adjustment under price or supply shocks. In addition, the data do not capture qualitative dimensions of household decision-making – such as brand preferences or perceptions of product quality – which may further shape purchasing behavior.
The findings in this study should be interpreted in light of the scope and structure of the analysis. The demand system is estimated at the level of broad infant formula product forms and uses scanner data that do not distinguish voucher-funded from out-of-pocket purchases. Accordingly, the estimated elasticities characterize observed purchasing behavior among households with positive formula purchases and should be interpreted as descriptive, category-level associations rather than causal responses to prices or program participation. Differences across WIC participation status reflect purchasing patterns conditional on recorded transactions and institutional constraints embedded in program design, not the causal effects of WIC participation itself.
In summary, this study provides the first household-level demand system analysis of infant formula in the United States that documents price responsiveness and substitution patterns across product forms and household groups. The finding that demand responsiveness is broadly stable across income and WIC groups – despite prior expectations of heterogeneity – establishes that infant formula demand behaves distinctly from other food categories and provides an empirical benchmark for evaluating how price shocks and policy changes affect formula access across populations. By situating household behavior within the institutional context of WIC and a heavily regulated market, these findings contribute to ongoing policy discussions on infant formula affordability, benefit design, and the distributional consequences of market disruptions.
Data availability statement
Researcher(s)’ own analyses calculated (or derived) based in part on data from Nielsen Consumer LLC and marketing databases provided through the NielsenIQ Datasets at the Kilts Center for Marketing Data Center at The University of Chicago Booth School of Business. The conclusions drawn from the NielsenIQ data are those of the researcher(s) and do not reflect the views of NielsenIQ. NielsenIQ is not responsible for, had no role in, and was not involved in analyzing and preparing the results reported herein. Because of contractual stipulations, we are not at liberty to share the data publicly.
Author contributions
Conceptualization, AL, XW, YYZ; Methodology, AL, XW; Formal Analysis, AL, XW; Data Curation, AL, XW; Writing – Original Draft, AL, XW; Writing – Review and Editing, AL, XW, YYZ; Supervision, XW, YYZ; Funding Acquisition, NA.
Financial support
This research received no specific grant from any funding agency, commercial or non-profit sectors.
Competing interests
No potential conflict of interest was reported by the authors.
Appendix A. Elasticity formulas
This appendix documents the formulas used to compute expenditure elasticities, uncompensated (Marshallian) price elasticities, and compensated (Hicksian) price elasticities from the estimated parameters of the Almost Ideal Demand System (AIDS).
A.1 AIDS Specification
The estimated AIDS share equation for infant formula type i ∈ {1, 2, 3} (powder, ready-to-use, concentrate) is given by: $ w_{iht} = \alpha _i + \sum _{j=1}^{3} \gamma _{ij} \ln (p_{jht}) + \beta _i \ln \left ( {m_{ht}} \over {P_{ht}}\right ) + \delta _i z_{ht}, $
where w iht is the expenditure share of formula type i for household h in year t, p jht denotes the unit price of formula type j, m ht is total infant-formula expenditure, and z ht is a vector of household socio-demographic characteristics.
Following the linearized AIDS specification, the price index is approximated by the Stone price index constructed using sample mean expenditure shares: $ \ln (P_{ht}) = \sum _{k=1}^{3} \bar {w}_k \ln (p_{kht}), $
where $\bar {w}_k$
denotes the sample mean expenditure share of formula type k.
$\bar {w}_k$
denotes the sample mean expenditure share of formula type k.
A.2 Expenditure Elasticities
The expenditure elasticity for formula type i is computed as: ${\eta _i} = 1 + {{{\beta _i}} \over {{w_i}}},$
where w i denotes the mean expenditure share of formula type i in the relevant estimation sample or subsample.
A.3 Uncompensated (Marshallian) Price Elasticities
Uncompensated own- and cross-price elasticities are calculated as: $\varepsilon _{ij}^M = - {\delta _{ij}} + {1 \over {{w_i}}}\left( {{\gamma _{ij}} - {\beta _i}{w_j}} \right),$
where ${\varepsilon_{ij}^M}$
denotes the uncompensated elasticity of demand for formula type i with respect to the price of formula type j, δ
ij
is the Kronecker delta (equal to 1 if i = j and 0 otherwise), and w
i
and w
j
are mean expenditure shares.
${\varepsilon_{ij}^M}$
denotes the uncompensated elasticity of demand for formula type i with respect to the price of formula type j, δ
ij
is the Kronecker delta (equal to 1 if i = j and 0 otherwise), and w
i
and w
j
are mean expenditure shares.
A.4 Compensated (Hicksian) Price Elasticities
Compensated price elasticities are obtained using the Slutsky relationship: $ \varepsilon _{ij}^{H} = \varepsilon _{ij}^{M} + w_j \eta _i, $
where ${\varepsilon _{ij}^H}$
denotes the compensated (Hicksian) elasticity and η
i
is the expenditure elasticity defined above.
${\varepsilon _{ij}^H}$
denotes the compensated (Hicksian) elasticity and η
i
is the expenditure elasticity defined above.
A.5 Implementation and Interpretation
All elasticities reported in the paper are evaluated at sample mean expenditure shares for the corresponding estimation sample or subsample (full sample, WIC vs. non-WIC households, and income groups). Standard errors for elasticities are computed using the delta method based on the estimated covariance matrix of the AIDS parameters.
Because goods are defined at the formula-form level rather than at the brand level, the elasticities should be interpreted as descriptive, category-level measures summarizing average adjustment patterns across broad formula types, rather than as brand-level price sensitivities or welfare measures.
Appendix B. Supplemental Tables
Demographic Characteristics by WIC Participation Status with Income < 185% of Federal Poverty Line
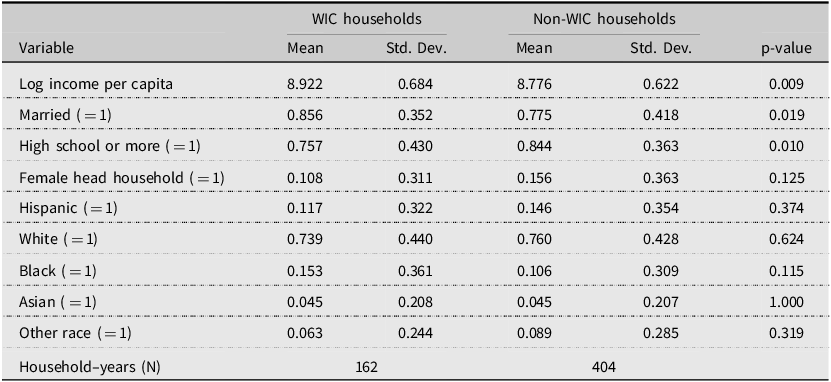
Table B1 Long description
The table compares demographic characteristics of WIC and non-WIC households with income less than 185% of the federal poverty line. It has 11 rows and 6 columns. The columns are labeled Variable, Mean for WIC households, Standard Deviation for WIC households, Mean for Non-WIC households, Standard Deviation for Non-WIC households, and p-value. The rows are labeled with different variables such as Log income per capita, Married, High school or more, Female head household, Hispanic, White, Black, Asian, Other race, and Household-years. Each row provides the mean and standard deviation for WIC and non-WIC households, along with a p-value indicating the significance of the differences. Notable trends include higher mean values for Married and High school or more in non-WIC households compared to WIC households, with significant p-values indicating these differences are statistically significant.
Notes: The table reports mean demographic characteristics and standard deviations for WIC and non-WIC households with income less than 185% of the federal poverty line in the analytic sample. p-values correspond to two-sided tests of differences in means (Welch t-test for continuous variables) or differences in proportions (two-sample tests of proportions for binary indicators). WIC: Special Supplemental Nutrition Program for Women, Infants, and Children.
Demographic Characteristics by Income Group
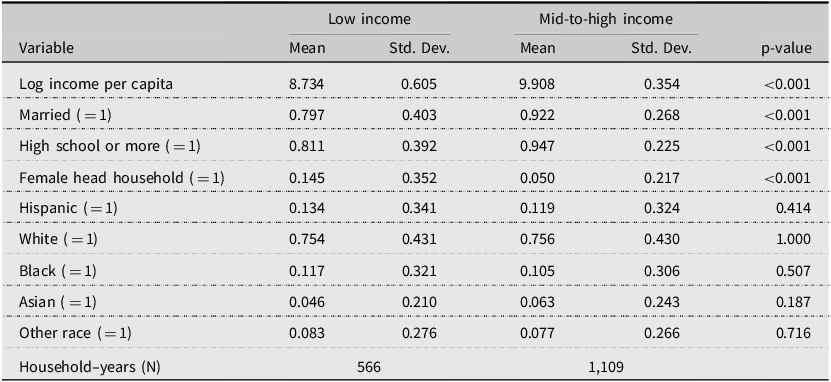
Table B2 Long description
A table comparing demographic characteristics by income group. The table has 12 rows and 6 columns. The columns are labeled Variable, Low income Mean, Low income Std. Dev., Mid-to-high income Mean, Mid-to-high income Std. Dev., and p-value. The rows list different variables and their corresponding mean and standard deviation values for low income and mid-to-high income groups, along with p-values for the differences. Row 1: Log income per capita, 8.734, 0.605, 9.908, 0.354, <0.001. Row 2: Married (=1), 0.797, 0.403, 0.922, 0.268, <0.001. Row 3: High school or more (=1), 0.811, 0.392, 0.947, 0.225, <0.001. Row 4: Female head household (=1), 0.145, 0.352, 0.050, 0.217, <0.001. Row 5: Hispanic (=1), 0.134, 0.341, 0.119, 0.324, 0.414. Row 6: White (=1), 0.754, 0.431, 0.756, 0.430, 1.000. Row 7: Black (=1), 0.117, 0.321, 0.105, 0.306, 0.507. Row 8: Asian (=1), 0.046, 0.210, 0.063, 0.243, 0.187. Row 9: Other race (=1), 0.083, 0.276, 0.077, 0.266, 0.716. Row 10: Household-years (N), 566, , 1,109, , .
Notes: The table reports mean demographic characteristics and standard deviations for low-income and mid-to-high income households in the analytic sample. Group sizes are N = 566 household–year observations for low-income households and N = 1,109 household–year observations for not low-income households. p-values correspond to two-sided tests of differences in means (Welch t-test for continuous variables) or differences in proportions (two-sample tests of proportions for binary indicators). WIC: Special Supplemental Nutrition Program for Women, Infants, and Children. Low and mid-to-high income households are defined by income less than or greater than or equal to 185% of the federal poverty line.
Robustness Check: Elasticity Estimates After Trimming Extreme Unit Values
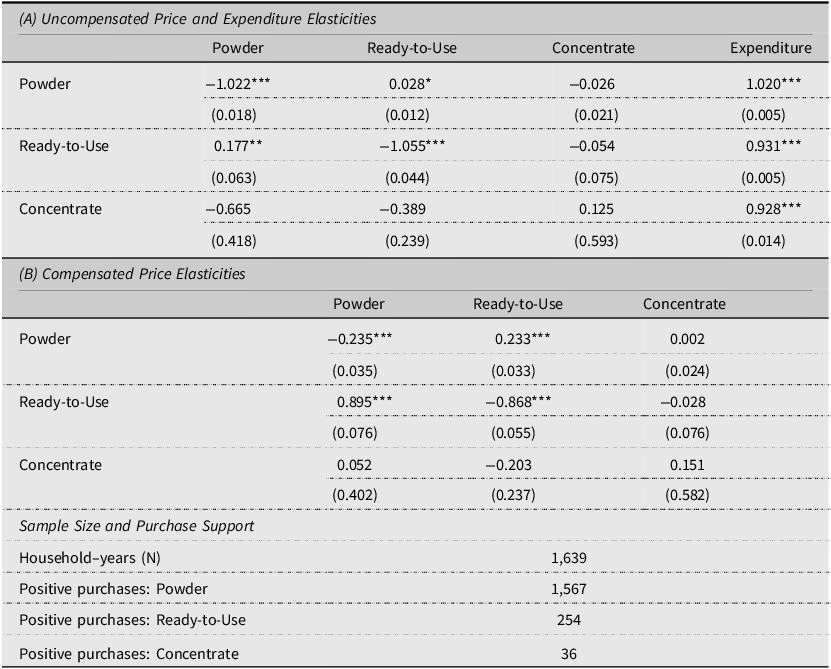
Table B3 Long description
The table is divided into two main sections: (A) Uncompensated Price and Expenditure Elasticities and (B) Compensated Price Elasticities. Each section contains a matrix of values with corresponding standard errors in parentheses. Panel A includes rows and columns for Powder, Ready-to-Use, Concentrate, and Expenditure. Panel B includes rows and columns for Powder, Ready-to-Use, and Concentrate. The table also includes a section for Sample Size and Purchase Support, listing the number of household-years and positive purchases for each formula type. Panel A: Row 1: Powder, 1.022***, 0.028*, -0.026, 1.020***; Row 2: Ready-to-Use, 0.177**, -1.055***, -0.054, 0.931***; Row 3: Concentrate, -0.665, -0.389, 0.125, 0.928***. Panel B: Row 1: Powder, -0.235***, 0.233***, 0.002; Row 2: Ready-to-Use, 0.895***, -0.868***, -0.028; Row 3: Concentrate, 0.052, -0.203, 0.151. Sample Size and Purchase Support: Household-years (N), 1,639; Positive purchases: Powder, 1,567; Positive purchases: Ready-to-Use, 254; Positive purchases: Concentrate, 36.
Notes: This table reports elasticity estimates from the AIDS model after excluding household–year observations with unit values in the top or bottom 1% of the distribution for any purchased formula type (36 observations dropped from the baseline sample of 1,675). Panel (A) reports uncompensated own- and cross-price elasticities and expenditure elasticities; Panel (B) reports compensated (Hicksian) cross-price elasticities, which measure substitution responses holding utility constant. In both panels, each entry is read as the percentage change in demand for the formula type listed in the row in response to a one-percent change in the price of the formula type listed in the column. A positive cross-price entry in Panel (B) indicates net substitutability between two formula forms. The lower panel reports the number of household–year observations and the number of positive purchase observations underlying the estimates. Standard errors are in parentheses. Statistical significance is indicated by *p<0.05, **p<0.01, and ***p<0.001. Elasticities are estimated using the Almost Ideal Demand System (AIDS) model, accounting for censoring via a Heckman selection correction and price endogeneity via a control-function approach. All elasticities are interpreted as descriptive, category-level measures. Results are very similar to the baseline estimates reported in Table (full estimates), confirming that the main findings are not driven by outlier unit values.
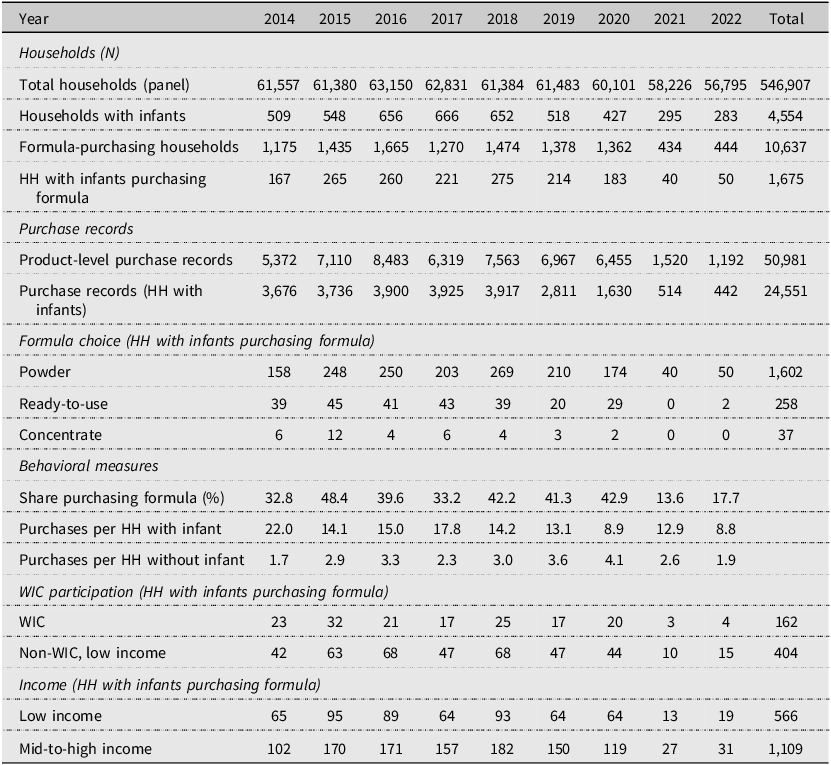
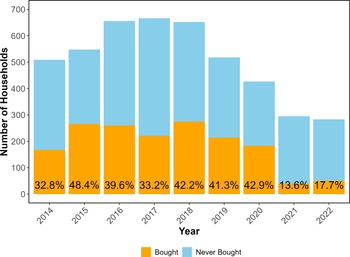
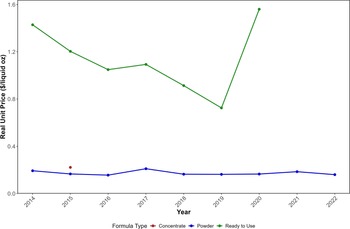
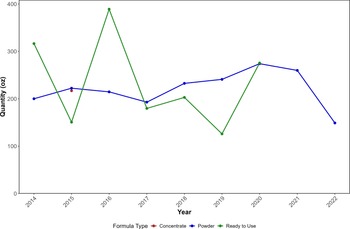
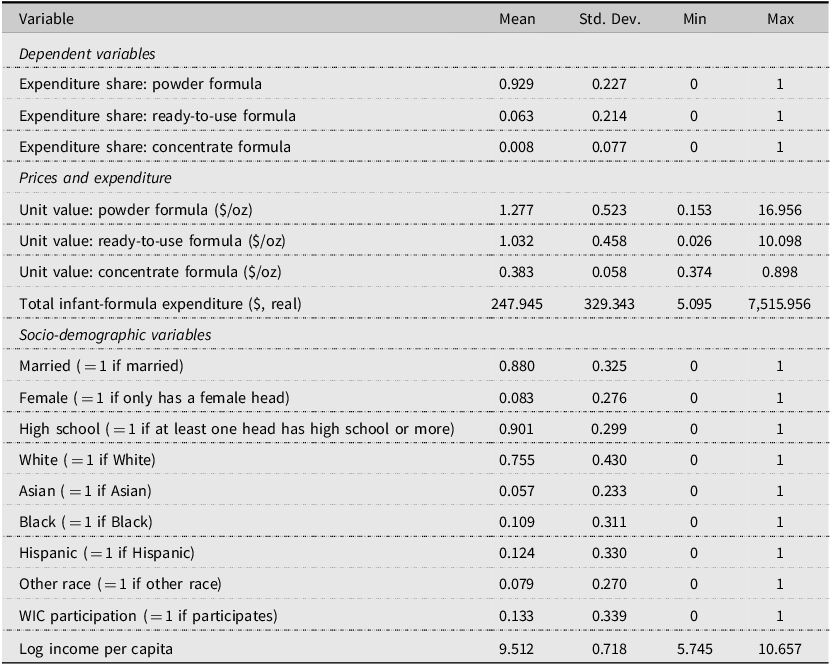
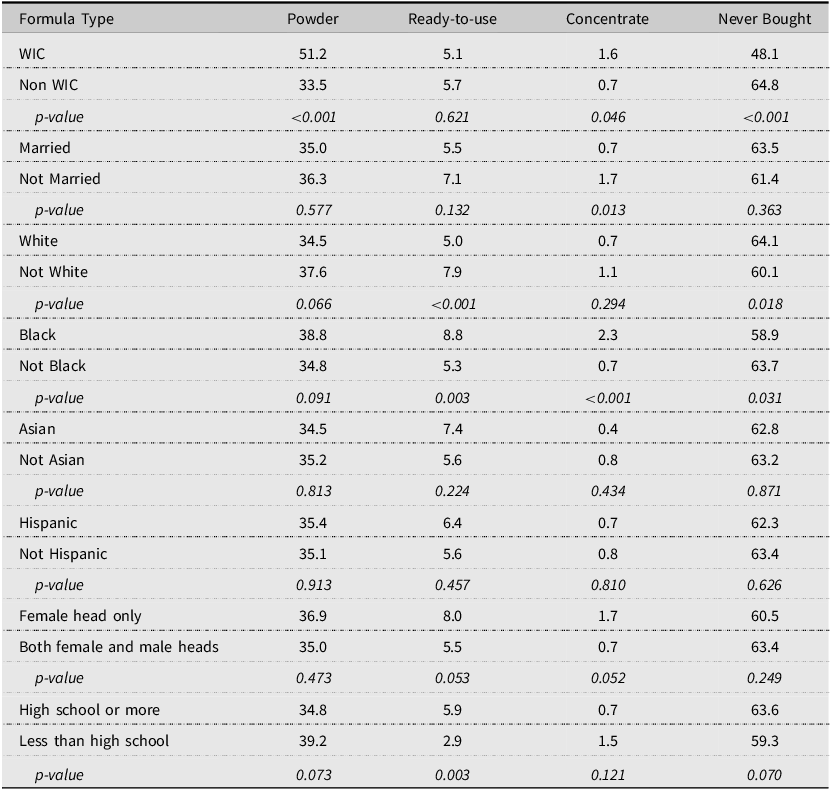
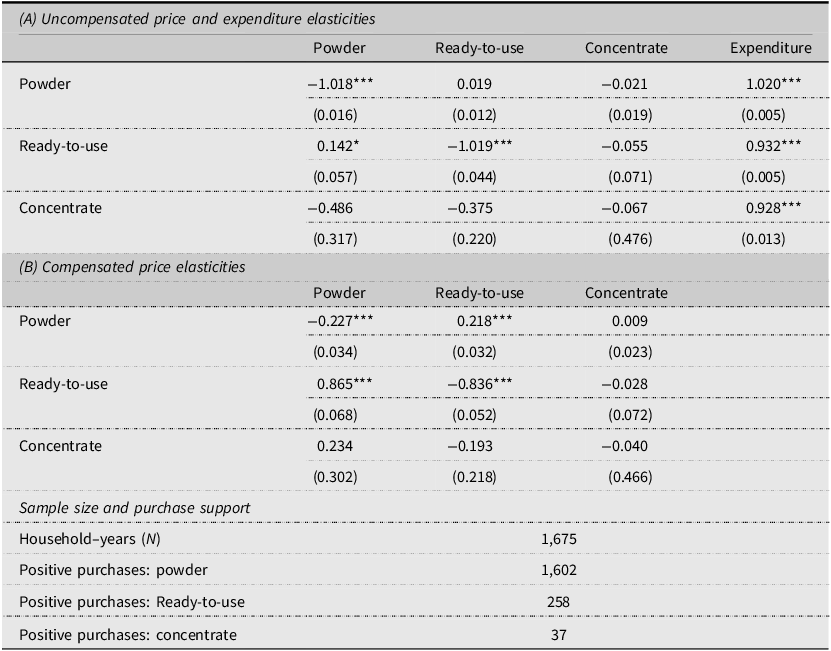
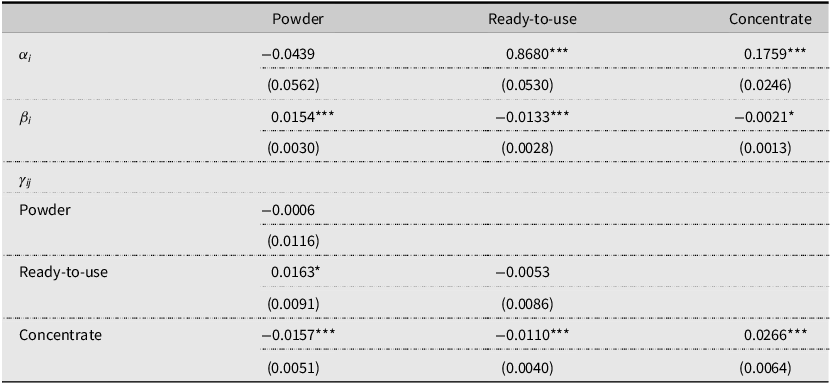
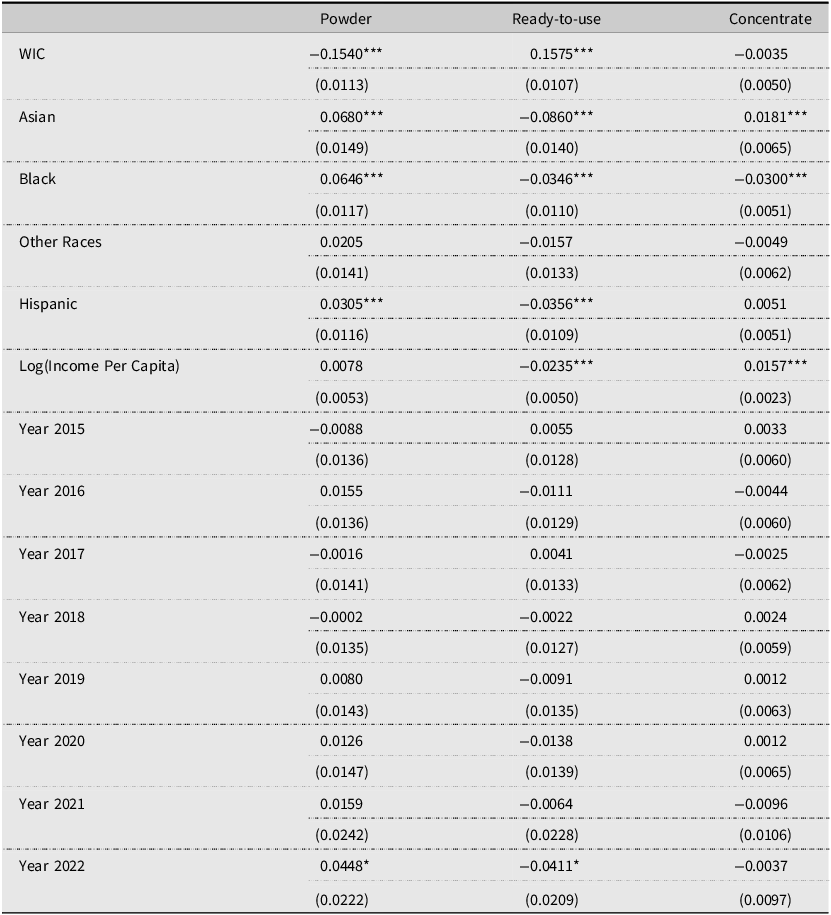
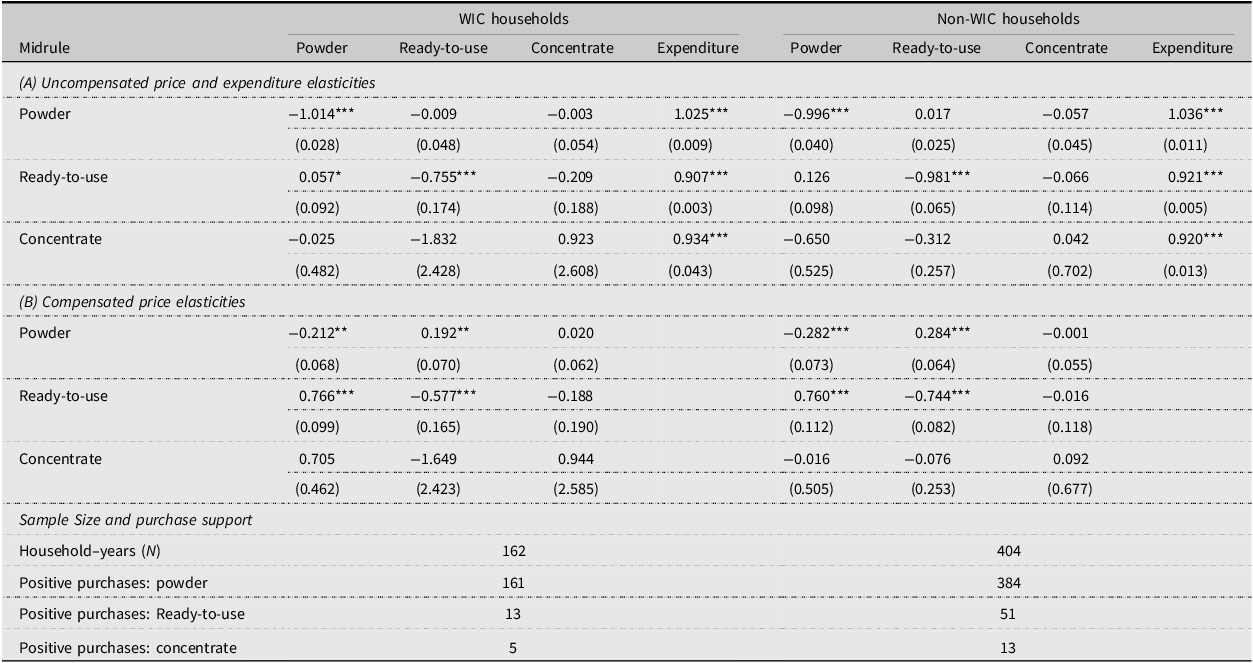
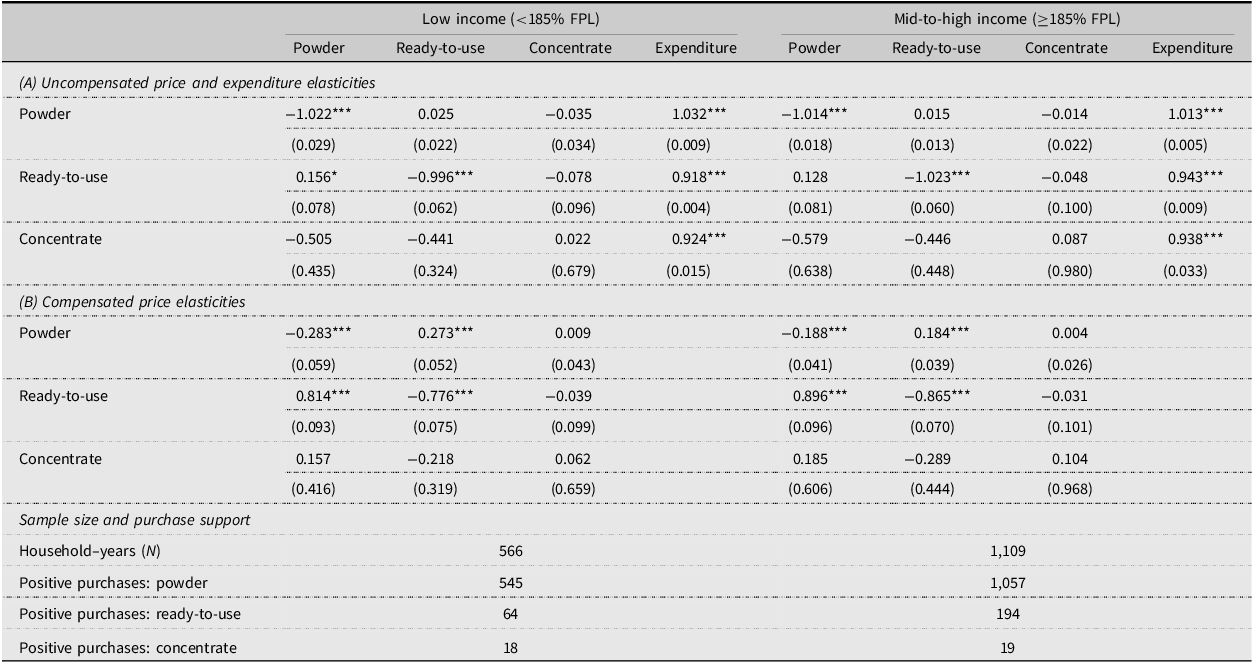
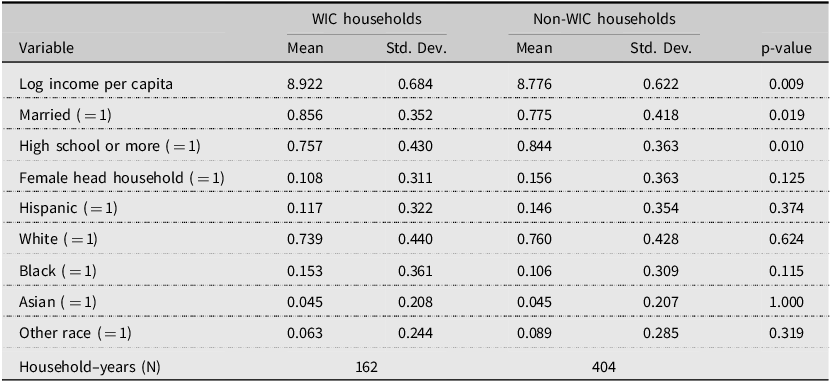
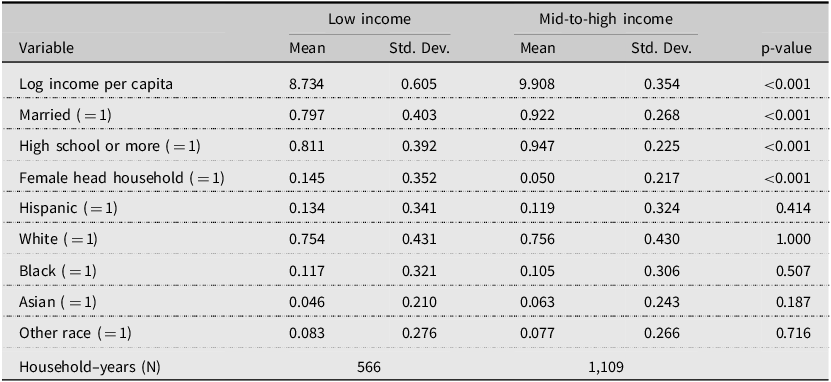
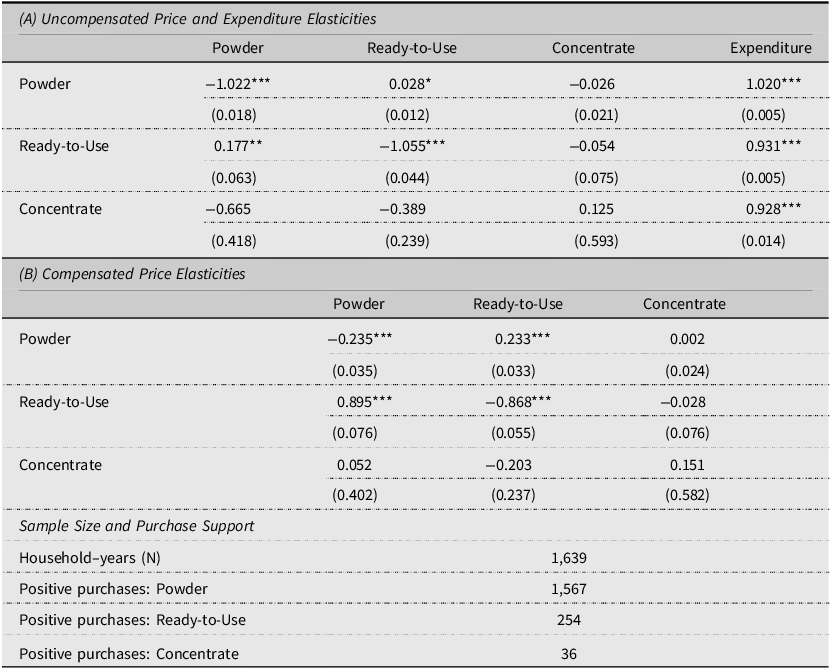

 Open access

