

In 1950, Maurice Kendall and Alan Stuart (Reference Kendall and Stuart1950) published the famous cube rule, providing a better understanding of seat allocation under the plurality voting system. It remains a classic in the literature on electoral systems. However, to date, our knowledge of the winners and losers of seat allocation under proportional representation (PR), which is the most widespread electoral system, is much more limited.
A large body of literature has emerged that examines the format of party systems and how they are shaped by electoral systems (Amorim Neto and Cox Reference Amorim Neto and Cox1997; Clark and Golder Reference Clark and Golder2006; Rae Reference Rae1967; Taagepera and Shugart Reference Taagepera and Shugart2017). Most comparative work on electoral and party systems is based on abstract scores, such as the effective number of parties or vote-seat deviations (Gallagher Reference Gallagher1991; Taagepera and Grofman Reference Taagepera and Grofman2003; Taagepera and Shugart Reference Taagepera and Shugart2017: 139–147), which address the system, and not individual parties. While disproportionalities almost always benefit the largest parties, aggregated scores do not identify the losers, nor do they provide detailed information about the expected consequences of an electoral reform for individual parties. This information is essential for both scholars and the public seeking to understand the electoral prospects of a political party or a social movement.
This article introduces a new solution complementing existing work that has either relied on simulations or on mathematical models. The effect of electoral reforms on the representation of political parties is often analysed through simulations, which are either ad hoc or more sophisticated, accounting not only for mechanical but also for strategic effects (Kedar et al. Reference Kedar, Harsgor and Sheinerman2016, Reference Kedar, Harsgor and Tuttnauer2021; see also the literature review in the next section). Simulations address specific empirical cases and thus rely on past vote distributions. They are therefore limited in what they can teach us regarding future elections with unknown vote distributions (Pilet and Bol Reference Pilet and Bol2011; Taagepera Reference Taagepera2007: 13).
The literature in mathematics has established general laws about the effects of PR, based either on algebraic solutions or on simulations. Most approaches operate at the level of electoral districts, where seats are allocated (Benoit Reference Benoit2000; Medzihorsky Reference Medzihorsky2019), and do not inform us about national effects in multi-district electoral systems.
This article combines a theoretical algebra-based approach with empirical data from elections under D’Hondt around the world to understand deviations from proportionality under the D’Hondt formula. My algebra-based solution delivers predictions about the vote-seat deviations, based on straightforward assumptions about the distributions of remainders in the seat allocation process. In particular, the model in this article shows how the effect of the rounding rule depends on thresholds of representation and hence on votes cast for small parties below such thresholds (Hug Reference Hug2001), on electoral geography, and on inequalities between districts, such as malapportionment (Kedar et al. Reference Kedar, Harsgor and Sheinerman2016; Monroe and Rose Reference Monroe and Rose2002). The empirical study applies the model to a large global dataset of elections under D’Hondt and examines the seat allocation. Unlike work investigating the strategic effect or using simulated data (see the literature review below), this study starts from the actual votes cast in elections.
This approach is innovative in that, first, it targets national representation in proportional electoral systems with multiple districts. Second, it moves away from empirical simulations and instead offers fully theoretically based predictions. Third, it is comprehensive in that it includes a range of elements that affect the national representation of parties in multi-district electoral systems. This has several advantages, not least, because it enables us to decompose the deviations from PR into multiple elements, including four dimensions of between-district variance. Earlier work has often lumped several of them together (e.g. malapportionment with unequal district magnitude). Fourth, it distinguishes between direct (mechanical) effects and anticipatory or indirect (psychological) effects. Fifth, it enables us to predict the consequences of an electoral reform for any party running in elections, based on a set of variables related to its vote share, the territorial distribution of votes and its competitors, even in the absence of a detailed design of the electoral districts. In brief, this comprehensive approach leads to a better understanding of deviations from proportionality at the national level, whereas previous similar work has primarily focused on the district level.
The analysis identifies the important factors for the representation of parties of different sizes. For small parties (less than 10% of the electorate), these are thresholds of representation and the geographical distribution of their votes rather than the seat allocation formula. Parties with 10%–20% of the electorate mostly lose seats due to the rounding effect, while parties with more than 20% are net winners in the D’Hondt seat allocation. The net effect of malapportionment is surprisingly small, but malapportionment is often associated with covariates, such as unequal district magnitude and unequal opportunities for party competition across the territory, which also introduce deviations from proportionality.
Estimates of deviations from proportionality at the level of parties are important, for example, in assessing the consequences of electoral reforms, but also for crucial features of democracy, such as assessing the tendency of electoral systems to produce single-party majorities (e.g. Blais and Carty Reference Blais and Carty1987; Haggard and Kaufman Reference Haggard and Kaufman2021: 49–50). Party strength in parliament matters for coalition formation (Laver Reference Laver1998), portfolio allocation (Carroll and Cox Reference Carroll and Cox2007) and policy impact (e.g. Manow Reference Manow2009). Based on the models presented in this article, it is possible to calculate how many votes a party needs to win a majority or a qualified majority in parliament (Ruiz-Rufino Reference Ruiz-Rufino2011; Taagepera and Ensch Reference Taagepera and Ensch2006). Deviations from proportionality are crucial for new parties seeking to establish themselves as relevant voices in parliament. My model captures the ‘mechanical effect’ of the D’Hondt formula and shows that it is shaped by the strategic decisions of parties and voters, thus providing new insights for further research on party strategies under PR. The findings at the party level may also provide a more robust theoretical foundation for studies at the level of party systems.
The D’Hondt formula in the literature
The academic literature on the proportionality effect of PR seat allocation formulas dates back to the early twentieth century. Scholars have demonstrated the different effects of PR formulas, such as the differences between the D’Hondt (Jefferson) and the Sainte-Laguë (Webster) formulas, based on mathematical models (Sainte-Laguë Reference Sainte-Laguë1910).
Much of this research uses indicators at the system level as dependent variables. Under proportional electoral systems using the D’Hondt formula – the most widely used seat allocation method for PR in national parliaments worldwide – the effective number of parties in national parliaments ranges from 2 to 13. The D’Hondt formula favours large parties in the seat allocation, and disproportionality scores (least-square index) under D’Hondt range from 0.8 to 16.Footnote 1
In this article, I shift the focus to political parties as the unit of analysis and assess whether they gain proportional representation in parliament. Some of the deviations from proportionality are as-if-random, meaning that two parties with largely identical numbers of votes and distribution of votes across districts win different shares of seats in different elections. However, there are also systematic factors leading to systematic (non-random) deviation from proportionality. They include the differential effects of the D’Hondt formula for parties of different sizes or due to differences in some of the variables capturing territorial differences (Benoit Reference Benoit2000; Monroe and Rose Reference Monroe and Rose2002).
A major challenge for empirical studies seeking to explain deviations from proportionality is the existence of multiple and interacting causes. The fact that seat allocation formulae can lead to partisan bias is well established (Balinski and Young Reference Balinski and Young2001). However, the magnitude of this bias depends on, among other things, electoral geography, malapportionment, district magnitude and legal electoral thresholds (see the following section).
I distinguish three main approaches to the study of deviations from proportionality under PR or the impact of electoral rules on party representation. One is based on extensive simulations, either for specific countries and elections or for simulated data. Simulations can either assume a fixed distribution of votes on political parties and thereby analyse the ‘mechanical effect’ of electoral systems, or they can address the strategic behaviour of voters, political parties and other political actors in light of the rules at play (psychological effect). Simulation studies of different PR seat allocation rules show systematic advantages for certain parties under the D’Hondt rule (Balinski and Young Reference Balinski and Young2001; Benoit Reference Benoit2000; Pólya Reference Pólya1918). Burt Monroe and Amanda Rose (Reference Monroe and Rose2002) focus on territorial differences in the electoral rules. In order to capture the psychological effect, they first simulate the institutional consequences for the distribution of votes across districts. In a second step, they simulate the allocation of seats (mechanical effect). In doing so, they provide a comprehensive view of the set of institutional rules (PR formula, district design) but come up against their limits when it comes to assessing the effect of individual components, e.g. distinguishing malapportionment from other closely related effects (see next section). Rein Taagepera and Mirjam Allik (Reference Taagepera and Allik2006) simulate both stages using ‘logical models’. Orit Kedar et al. (Reference Kedar, Harsgor and Sheinerman2016, Reference Kedar, Harsgor and Tuttnauer2021) rely on empirical approaches, where deviations from proportionality are explained through multivariate statistics, which allow for multiple factors to be controlled for simultaneously. Simulations that address specific empirical cases rely on past vote distributions, and they are limited to the variance covered in the elections analysed. Empirical simulations also reach their limits in cases of complex or non-linear effects (e.g. interactions of vote distributions and unequal district magnitude or legal thresholds with the seat allocation formula).
A second approach relies on mathematical rules of the seat allocation formula (see Gallagher Reference Gallagher1992 for an introduction). Based on algebraic solutions and simulations, this body of work has shown that the distortions due to rounding effects are related to the relative rank of parties, in terms of their vote shares (Drton and Schwingenschlögl Reference Drton and Schwingenschlögl2005; Medzihorsky Reference Medzihorsky2019; Pukelsheim Reference Pukelsheim2014; Ruiz-Rufino Reference Ruiz-Rufino2011; Schuster et al. Reference Schuster, Pukelsheim, Drton and Draper2003). Daniel Bochsler, studying the mechanical effect of list apparentments, relies on a simplified estimate of the D’Hondt effect at the district level (Bochsler Reference Bochsler2010). Jarosław Flis et al. (Reference Flis, Słomczyński and Stolicki2020) used his approach to explain the over- and under-representation of parties in elections. They analyse only electorally viable parties (‘relevant parties’, i.e. those above thresholds of representation), and they selected a sample with limited between-district variance in the vote distribution and in electoral rules (district magnitude and seat-to-voter ratios) (Flis et al. Reference Flis, Słomczyński and Stolicki2020: 217).
Third, empirical comparative studies have studied new and/or small parties and asked whether they can win seats in parliament. The main decisive factor here is the threshold of exclusion (Grofman Reference Grofman1975; Hug Reference Hug2001; Lijphart and Gibberd Reference Lijphart and Gibberd1977). However, for many parties, the crucial question is not whether they win representation in parliament, but whether they win a share of seats equal to their share of votes.
Model
Problem definition
The theoretical model developed in this section is concerned with deviations from proportionality in multi-district PR elections using the D’Hondt seat allocation formula or equivalent formulas (such as the Hagenbach–Bischoff formula used in Luxembourg and Switzerland, which leads to the same seat allocation as D’Hondt).
The model is based on two key elements. First, it translates the D’Hondt rounding rule into a simple and straightforward mathematical function for the partisan effect in the seat allocation. Simple algebra and straightforward assumptions result in a basic model that serves as the workhorse of my approach. The further parts discuss the model’s assumptions. These relate to small parties and four partially related problems of between-district variance. This discussion informs us about a series of adjustments to the operationalisation and allows for more precise predictions in the presence of small parties or in elections with variance on the four territorial dimensions.
This theoretically driven approach renders the model universal and comprehensive. I validate it relying on the largest available dataset of elections under D’Hondt in democratic countries. The model is comprehensive, as it analyses the interplay of several institutional and geographical components related to the allocation of seats in multi-district PR systems.
At the theoretical stage, my dependent variable is the absolute number of seats allocated to political parties. In the empirical tests, I use a transformed version (representation ratios) that is better suited to assessing the variance.
Constructing the model: the basic steps
The model introduces an algebraic approximation for the number of seats that a party can expect to win in a national parliamentary election under proportional (D’Hondt) rules. It is modular, and I introduce it in stages. Steps 1–3 examine the impact of the D’Hondt seat allocation formula based on national-level variables, such as national party vote shares. Steps 4–7 extend this to variance across districts. The main text discusses the main lines, while details on the operationalisation are provided in the Supplementary Material, Section A.
Step 1: the basic proportionality model
Any model of seat allocation under PR (or deviations from it) starts with the proportional rule as its basis (e.g. Kedar et al. Reference Kedar, Harsgor and Sheinerman2016: 682): in an assembly with S seats, the number of seats a party wins sj is proportional to its vote share vj, so that
 \begin{equation*}s_j\,=v_j\,\cdot\,\,S\end{equation*}
Step 2: the D’Hondt rounding rule
The result of Step 1 is seat fractions, but eventually, they need to be rounded to full seats (non-negative integers). The centrepiece of any PR seat allocation rule (and of my model) is the rounding rule. The D’Hondt rule rounds them down. Its effect can be thought of as a tax system, in which each party pays a ‘head tax’ of 0.5 seats for each electoral list. The tax revenue is redistributed in favour of the larger parties, resulting in a net redistribution from small to large.
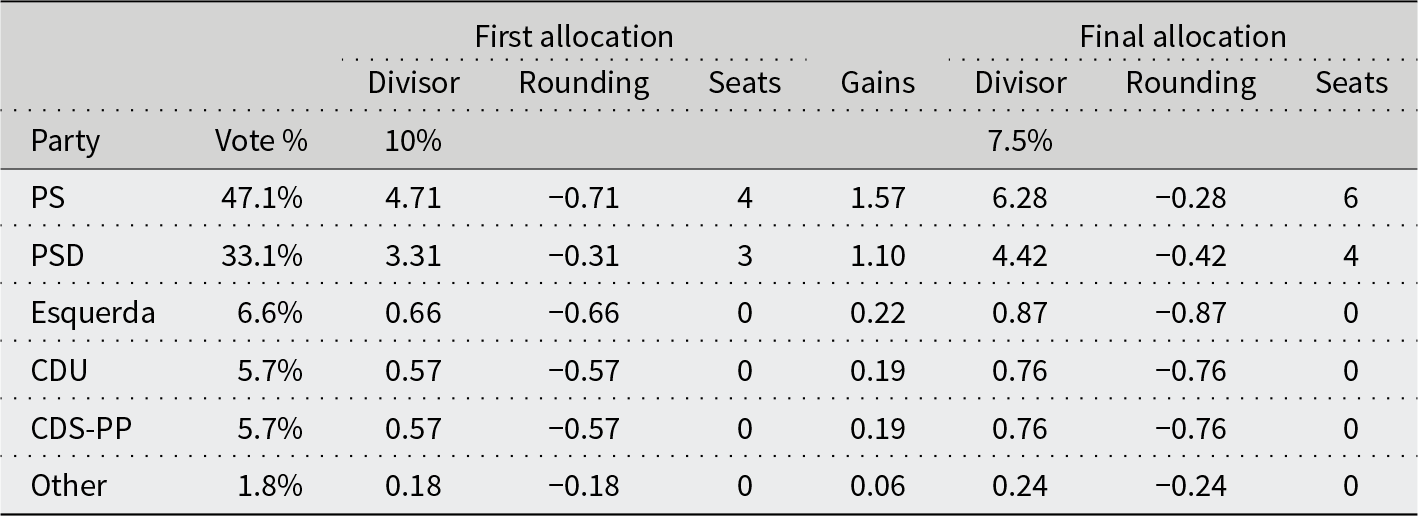
The 0.5 seat rule of thumb is not an arbitrary approximation. It is derived from the mathematical definition of D’Hondt as the divisor rule as with rounding down. The votes (here: vote share) of each party are divided by a divisor Hi, and then rounded down to the nearest integer. In the exemplary calculation in Table 1 for a 10-seat district in Portugal, this first divisor H 1 amounts to 10%, equivalent to 1 out of 10 seats. The non-integer fractions of seats resulting from the division are rounded down. For example, the proportional allocation of seats of 4.71 for the PS is rounded down to 4. These rounding losses could be between 0 and 0.99 seats for each party or in any symmetric distribution an average of 0.5 seats per party (but see Step 3 for deviations). In a six-party competition, three seats in total are lost through rounding. In further iterations, the divisor Hi is lowered (here from 10% to 7.5%), and the non-integer fractions are rounded down again until these three seats are also allocated. Mathematically, lower divisors imply that the remaining three seats are reallocated, on average, in proportion to the parties’ vote share vj. Each party loses 0.5 seats per district, but larger parties regain more.
D’Hondt Calculation Example (Portugal, 2005, Constituency Coimbra, 10 Seats)

Table 1 Long description
The table illustrates the D'Hondt method applied to the 2005 election results in Coimbra, Portugal, for allocating 10 seats among parties. PS, with 47.1% of the vote, initially received 4 seats but gained 2 more in the final allocation, totaling 6 seats. PSD, with 33.1% of the vote, initially received 3 seats and gained 1 more, totaling 4 seats. Esquerda, CDU, CDS-PP, and Other parties, each with less than 7% of the vote, did not receive any seats in either allocation phase. The table highlights the impact of vote percentage and divisor adjustments on seat distribution, emphasizing the advantage of higher vote percentages in gaining seats.
Equation 1 presents the resulting model, consisting of two summands: first, each party j is allocated a number of seats proportional to its vote share vj, but according to the second summand, each party loses the same amount. The rounding effect, and thus the redistribution, is larger with more competitors N. This is reiterated in every district d:
 \begin{equation}s_j=v_j\,S+\left(\frac{\left(Nv_j-1\right)}2\right)\,d\end{equation}
 Incidentally, the equation identifies the vote share at which parties gain a perfectly proportional share of seats, which Rein Taagepera and Markku Laakso (Reference Taagepera and Laakso1980) defined as the ‘break-even point’. It is equal to the inverse of the number of competitors 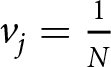 ${v_j} = \frac{1}{N}$. In the calculation example of an election with six parties and with no further information, parties with more than 17% of the vote tend to be overrepresented, and those with less than 17% tend to be underrepresented.
Other divisor or quota methods have different rounding rules, which makes some of them (Sainte-Laguë, Hare/Niemayer) free of systematic deviations from PR.
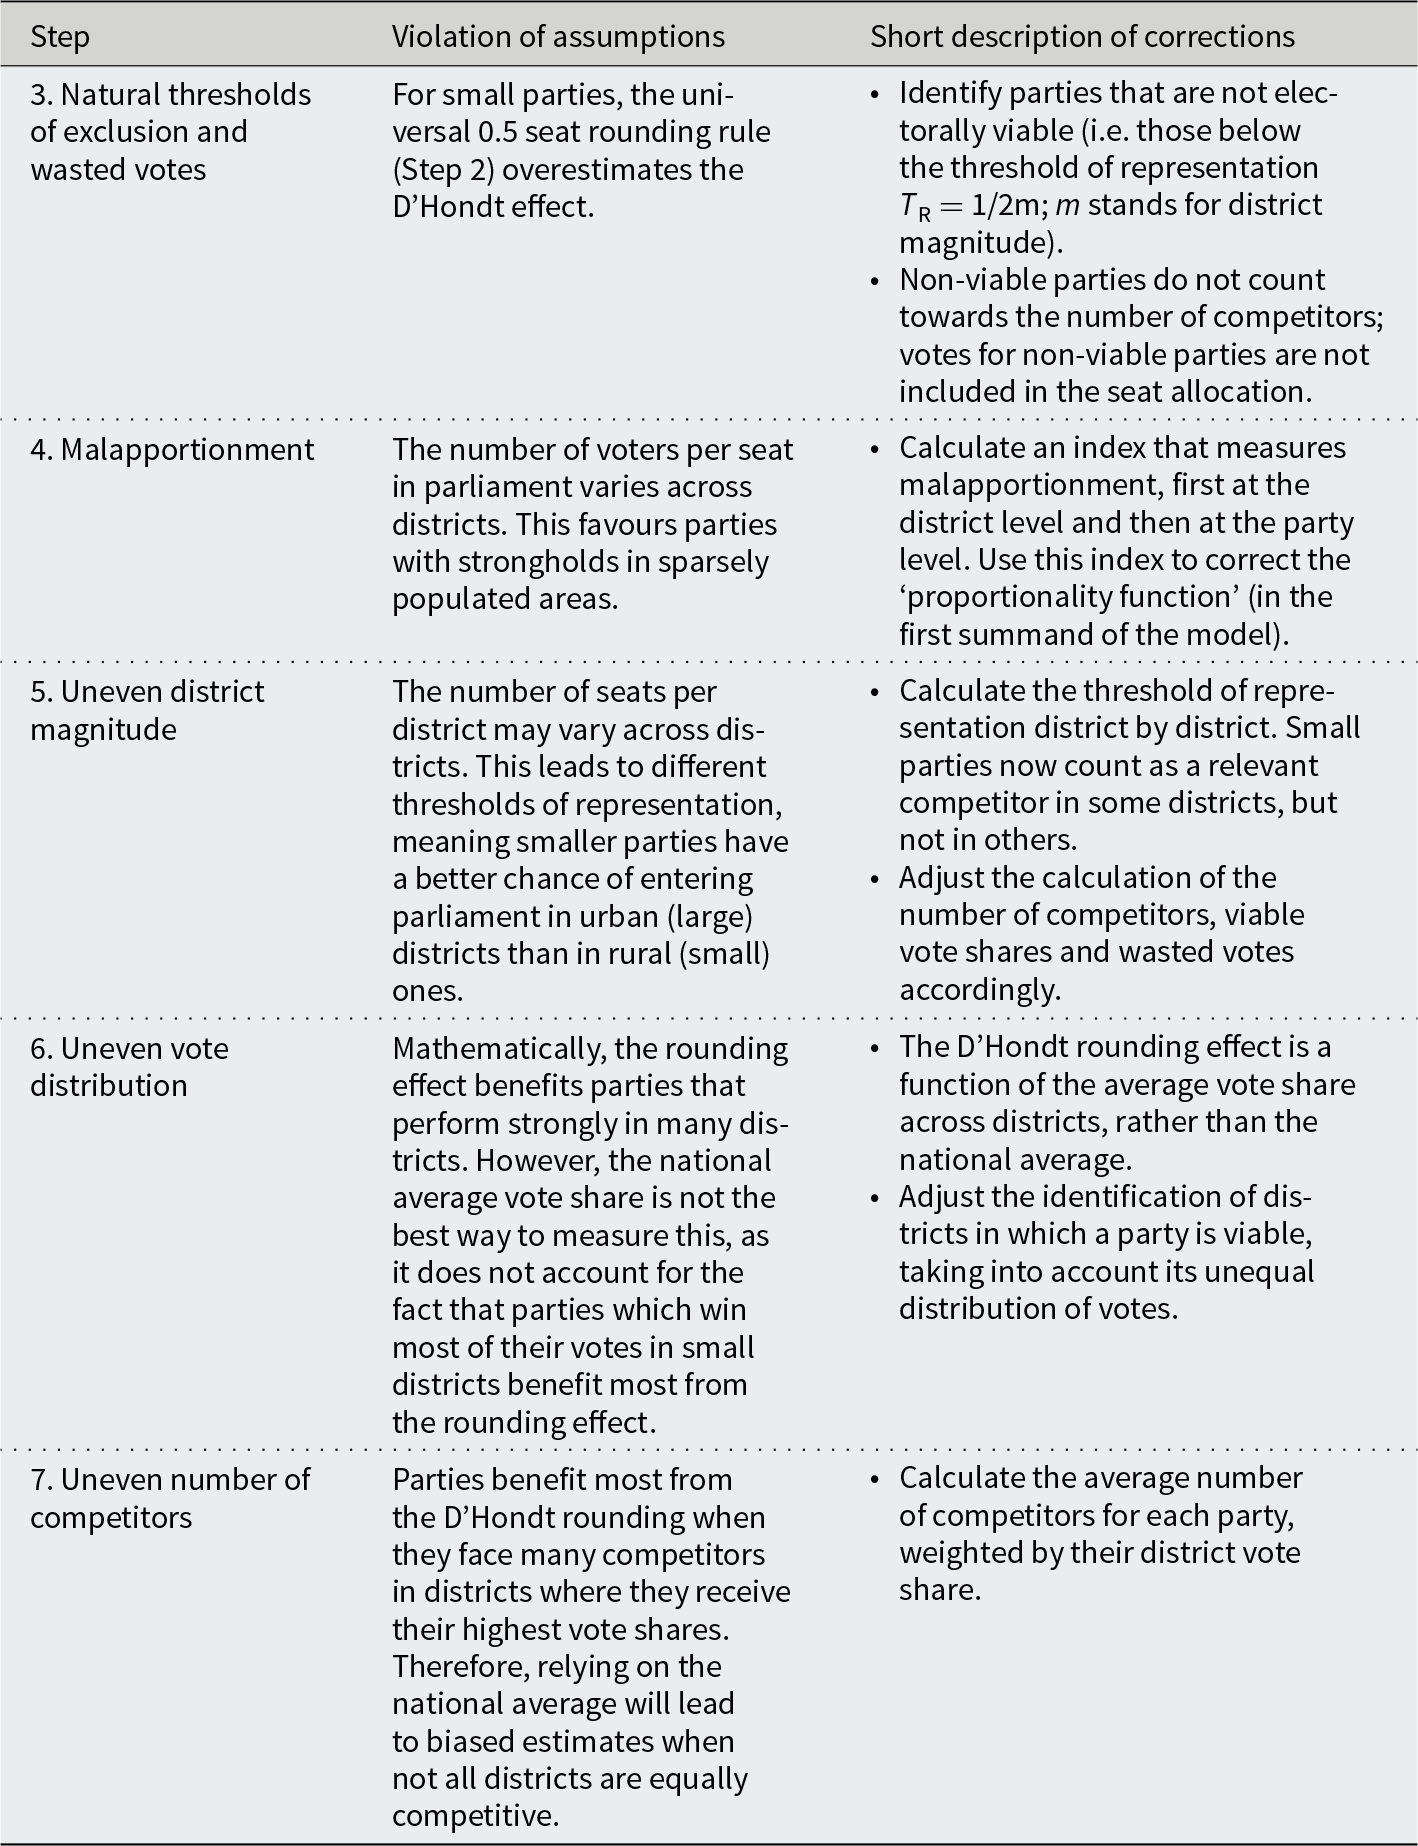
This parsimonious solution for dealing with rounding effects relies on simplifying assumptions. Steps 3 and 5 explain why the assumptions about the distribution of seat fractions may be violated, and Steps 4–7 discuss how to deal with variables that vary across the territory. See also Table 2 and the Supplementary Material, Section A.
Adjustments of the Basic Model
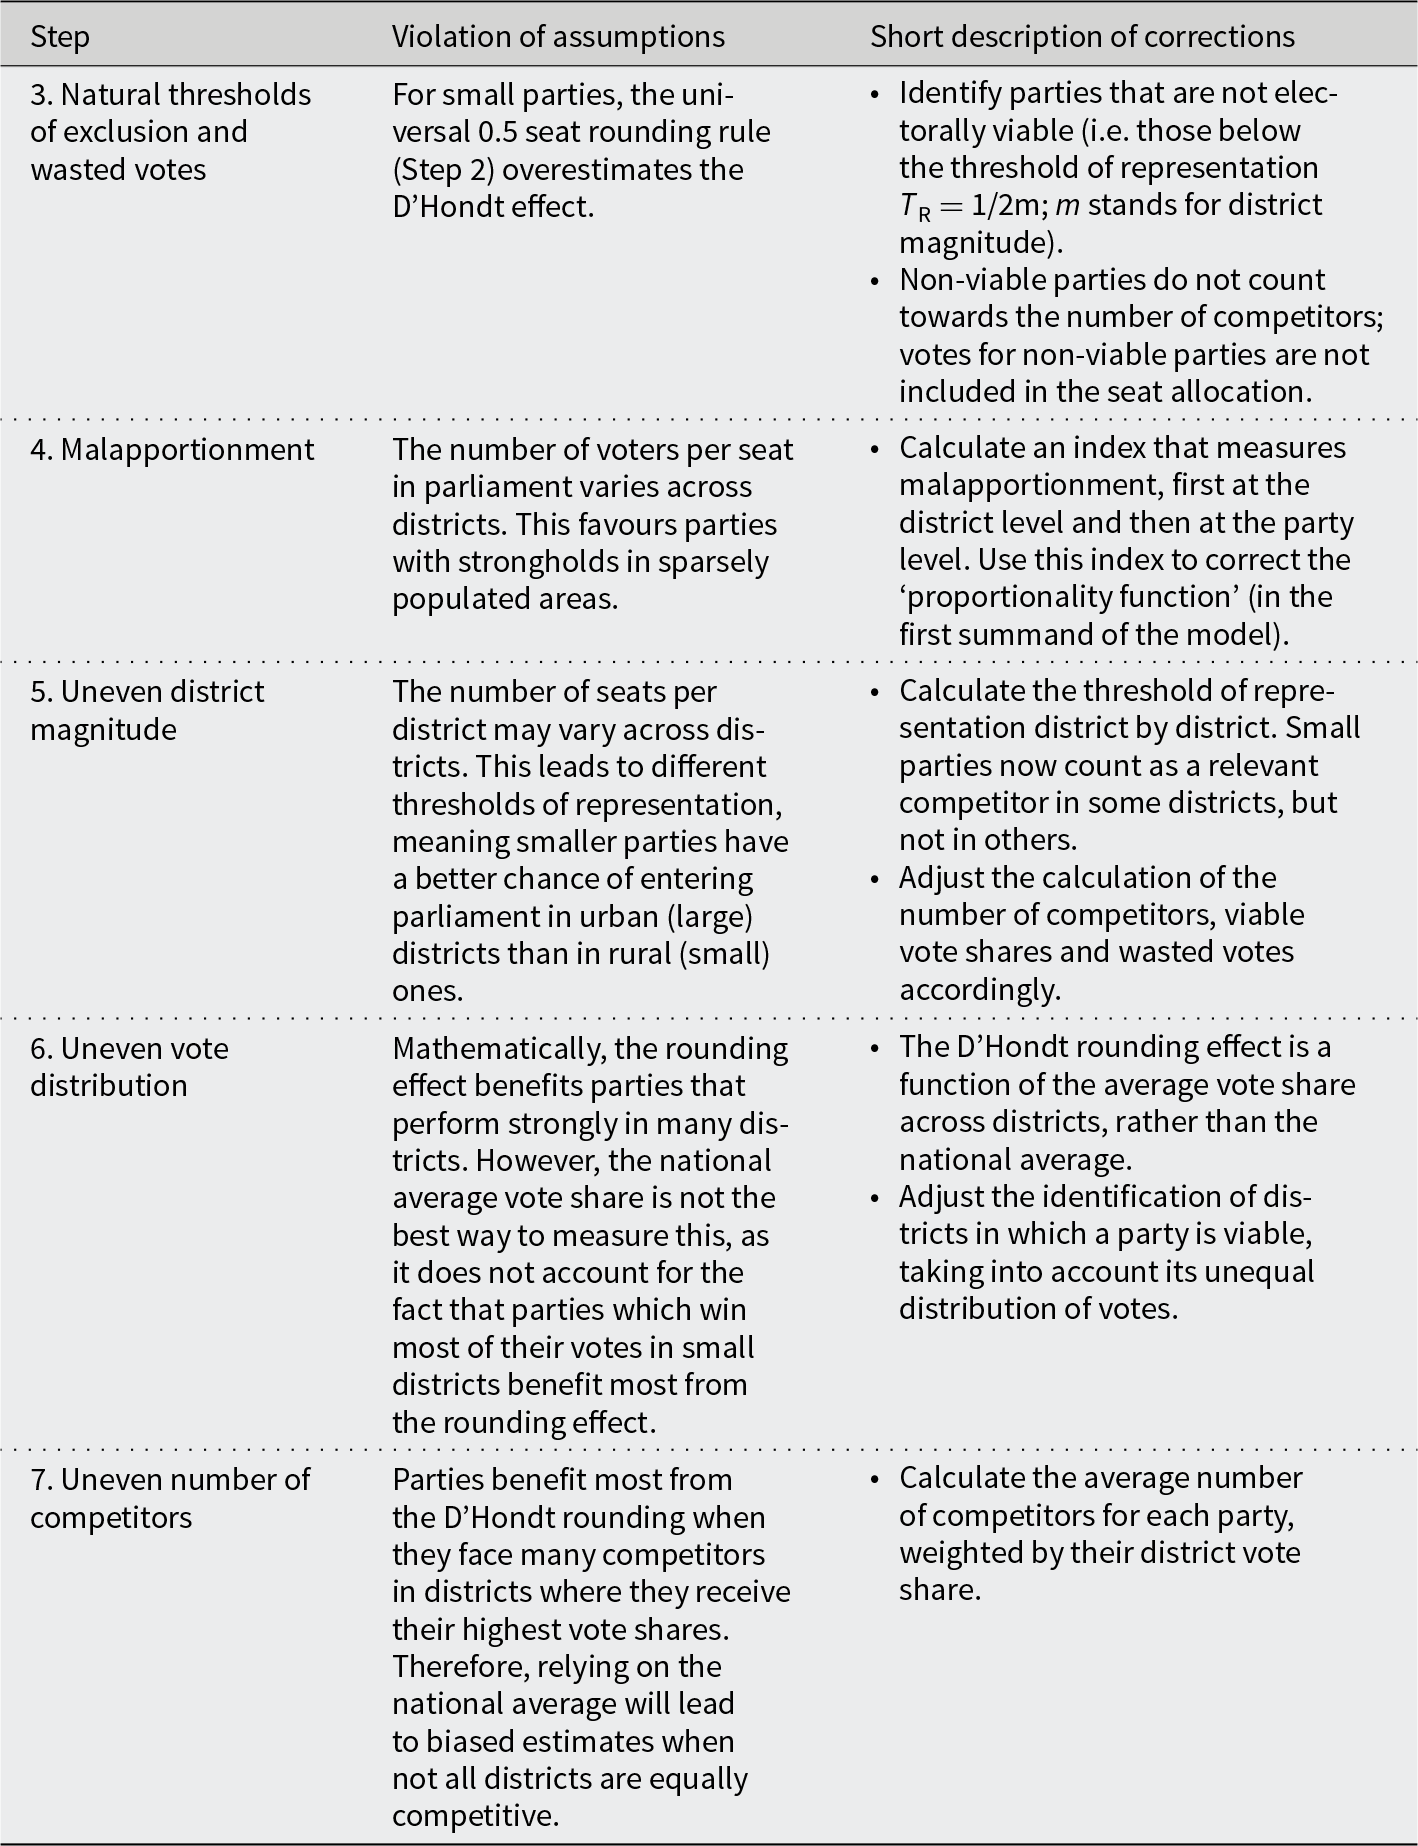
Table 2 Long description
The table details adjustments to an electoral model, focusing on correcting assumptions that impact party representation and vote allocation. Key issues include malapportionment, where voter-to-seat ratios vary across districts, favoring parties in less populated areas. Uneven district magnitude affects representation thresholds, giving smaller parties better chances in larger urban districts. The rounding effect benefits parties with strong performances in multiple districts, not accurately reflected by national averages. The number of competitors also influences party advantage, with more competitors in high vote-share districts skewing results. These corrections aim to improve the model's accuracy in reflecting electoral dynamics.
Step 3: assumption about seat fractions and rounding
The 0.5-seat deduction rule is based on the straightforward assumption that parties hold seat fractions after the point between 0.00 and 0.99. This applies to medium-sized or larger parties. Step 3 explains why and when this does not apply for very small parties and suggests an adjustment to the operationalisation of the model.
Very small parties rarely come close to winning a seat in a district, meaning their decimals tend to be closer to 0 than 1. For these parties, the average rounding-down effect (Step 2 of my model) is, therefore, smaller than 0.5. For example, in the 2006 Dominican Republic elections, 17 small parties with fewer than 3% of the vote were contesting across 47 constituencies, each with between 2 and 13 seats; none of them came close to winning a seat. According to the 0.5 seat rule-of-thumb, with 47 districts and 20 parties, no fewer than 470 seats would be redistributed to large parties. This is almost three times the total number of seats in the lower chamber. As a consequence, the model would predict a negative number of seats for small parties.
However, these predictions are wrong. This is because for very small parties with a vote share equivalent to fewer than 0.5 seats in a district, the average rounding-down effect amounts to less than 0.5 seats. By definition, parties with a vote share that is less than the natural threshold of representation T R do not win any representation. Under the D’Hondt rule, this threshold of representation amounts to a vote equivalent to 0.5 district seats (T R = 1/2m, where m stands for district magnitude).Footnote 2
I adjust the model by not applying it to these very small parties below the threshold of representation. Accordingly, I also remove their votes (also called ‘wasted votes’) from the calculation and remove these parties from the count of ‘viable’ parties (see Supplementary Material, Section A, for the details of the operationalisation). In this example, three viable parties remain, and the total number of seats reallocated due to the D’Hondt formula corresponds to this number.Footnote 3
Variance across districts: institutions and electoral geography
The remaining steps address elections in multiple districts and between-district variance. The basic model (Steps 1–3) is based on national averages, such as the number of competitors, national vote shares and average district magnitude. However, under the D’Hondt rule, seats are allocated in districts, and the national result is the sum of all district results. In the presence of variance across districts – whether due to electoral rules or party competition and votes not being uniform – national averages can be misleading when it comes to predicting the D’Hondt effect (Walter and Emmenegger Reference Walter and Emmenegger2023). Steps 4–7 account for this variance.
One of the most-discussed elements of between-district institutional variance is malapportionment (defined as an unequal number of voters per seat across districts). When unequal voters-per-seat ratios correlate with unequal party vote shares or numbers of competitors across districts, they introduce partisan bias in the national seat allocation (Kedar et al. Reference Kedar, Harsgor and Tuttnauer2021; Monroe and Rose Reference Monroe and Rose2002). However, focusing on malapportionment obscures three other sources of bias associated with between-district variance. More specifically, malapportionment usually correlates with several dimensions of electoral geography (uneven party strengths, uneven competitiveness and unequal percentages of wasted votes across districts), and it only has a partisan effect for parties whose vote shares vary across districts. However, all three dimensions of electoral geography affect seat allocation even in the absence of malapportionment. Steps 4–7 of the model disentangle these three variables from malapportionment.
I proceed by rewriting my model at the level of electoral districts, and then aggregate it across multiple districts, whereby I allow the above-mentioned parameters (number of voters per seat, district magnitude, parties’ relative vote strength, competitiveness) to vary across districts. This cumulative function is displayed in Equation 2, using the example of two districts. In analogy to the national-level model (Equation 1), the first summand is the proportional seat allocation for both my districts 1 and 2 (in analogy to Step 1); it also includes a parameter wi for wasted votes by district (introduced in Step 3). The second part is identical to the national-level model for the rounding effect (Step 2, with the refinements from Step 3). However, at the district-level, instead of seats in parliament S and national vote shares, I calculate with district magnitude (m 1 and m 2) and district-level vote shares for parties above the threshold of representation (vj 1′ and vj 2′):
 \begin{equation}{s_{j1}}{\text{ }} + {s_{j2}}{\text{ }} = \frac{{{v_{j1{\text{ }}}}'}}{{1 - w{}_1}}{m_1}{\text{ }} + \frac{{{v_{j2}}{\text{ }}'}}{{1 - {w_2}}}{m_2} + \frac{{{N_1}\frac{{{v_{j1}}}}{{1 - {w_1}}} - 1}}{2} + \frac{{{N_2}\frac{{{v_{j2}}}}{{1 - {w_2}}} - 1}}{2}\end{equation}
This complex function can be simplified. The left summand is identical to the national-level proportional seat share under two conditions: (a) the number of voters per seat is identical in every district (i.e. no ‘malapportionment’); and (b) the share of wasted votes is identical in all districts. The right summand can be simplified if the party vote share, the number of competitors and the share of wasted votes do not vary across districts, or if this variance is accounted for.Footnote 4 For elections where these conditions are not met, Steps 4–7 introduce new parameters or modified variable operationalisations to account for variance across districts on the respective variables.
Step 4: malapportionment
Malapportionment is defined as the uneven allocation of seats to districts (disproportionally to the number of voters) (Flis et al. Reference Flis, Słomczyński and Stolicki2020: 207; Monroe and Rose Reference Monroe and Rose2002). For example, rural or peripheral areas (e.g. islands or sparsely populated regions) tend to have smaller districts and more seats per capita in parliament than urban or densely populated areas (Baker Reference Baker1955: 41–45). This can give parties an advantage in the seat allocation process, provided that their vote shares vary across districts. My national-level model (Equation 1) ignores this, as it builds on the assumption of an invariant number of voters per seat across districts (defined as no malapportionment; see Supplementary Material, Section A, Step 4).
An exemplary case of malapportionment is Spain, where in smaller constituencies (e.g. Soria in 2004) as few as 26,000 voters elect a representative, whereas at the national average, districts are assigned a seat for every 99,000 voters, almost four times as many. Consequently, parties that gain their votes from rural or peripheral areas are overrepresented in parliament.
I incorporate the direct effect of malapportionment (unequal seat-to-voters ratios) into my model in two steps. First, I calculate a district malapportionment index by comparing the voters per seat in each district to the national average. Second, I calculate a party malapportionment index by aggregating the district malapportionment indices based on the districts from which the party receives votes (calculation details are provided in the Supplementary Material, Section A).Footnote 5 Consequently, a Spanish party whose voters are based in Soria would be assigned an index of 3.9 and would be overrepresented in parliament by this factor. Such high scores are only obtained by local parties. The maximum for a larger party in my data is from Suriname, a 1.44 score for the General Liberation and Development Party. Spain’s much-cited malapportionment advantage for the Popular Party is around 1.02–1.04, equating to 2–4 extra seats for every 100 seats. Malapportionment affects the first segment of the national-level equation. Correlates of malapportionment, such as variance in district magnitude, are dealt with in the remaining steps.
Step 5: uneven district magnitude
Variance in district magnitudes across constituencies is a common side effect of malapportionment, but it also occurs independently. It matters in my model because low-magnitude districts (typically rural or peripheral) are associated with higher thresholds of representation, which makes it harder for smaller parties to enter parliament. In contrast, larger-magnitude districts (e.g. urban) allow small parties to win seats (Kedar et al. Reference Kedar, Harsgor and Sheinerman2016; Lago and Martínez i Coma Reference Lago and Martínez I Coma2024; Monroe and Rose Reference Monroe and Rose2002: 72). This difference is particularly significant for political parties with vote shares around the threshold of representation, as they are electorally viable only in higher-magnitude districts, where the threshold of representation is lower than their vote share.
To account for varying district magnitude, I need to adjust a series of variables for different thresholds of representation and calculate a new cumulative score across districts where parties are electorally viable (in particular, vote share above the threshold of representation and number of relevant competitors) or not (wasted votes) (see the Supplementary Material, Section A, for the modified operationalisation of these variables).
Step 6: uneven vote distribution
The third aspect of territorial variance in my quartet concerns uneven vote shares across districts (i.e. local party strongholds). As can be seen on the right-hand side of Equation 2, parties benefit from the D’Hondt rounding effect in proportion to their district vote share, irrespective of district size (i.e. district magnitude or the total number of voters). The national average vote share, which I use in Equation 1, underestimates the rounding advantage for parties that have their strongholds in (many) smaller districts (rural or peripheral parties) compared to equally strong parties with their strongholds in a few larger (urban) districts. This effect benefits the same parties as malapportionment does, in the same strongholds (districts with fewer voters) (Step 4), although it affects any party with uneven vote shares, even in the absence of malapportionment. The mathematical solution is straightforward: rather than relying on the national average vote share, the rounding effect should be calculated as a function of the average vote share across districts, which is slightly higher for parties that perform well in smaller districts.
Step 7: uneven number of competitors
The fourth variable in the quartet of territorial inequalities is the unequal number of competitors across districts. Variation in party strength and district magnitude implies that in some districts more electorally relevant parties are present than in others. The D’Hondt rounding effect yields more benefits for parties that face more competitors. Consequently, urban parties (with strongholds in districts of higher magnitude and greater political pluralism, see Step 6) tend to benefit more (Monroe and Rose Reference Monroe and Rose2002: 71). The Supplementary Material, Section F, illustrates this empirically. The factors driving this effect are associated with malapportionment (Step 4) but also occur independently. In order to adjust the D’Hondt rounding effect for the uneven number of competitors and in simplification of Equation 2, I first count the number of (electorally viable) competitors by district. Then, for each party, I calculate the average number of competitors across the districts in which it is running, weighted by its district vote share.
Aggregated effect: calculation example
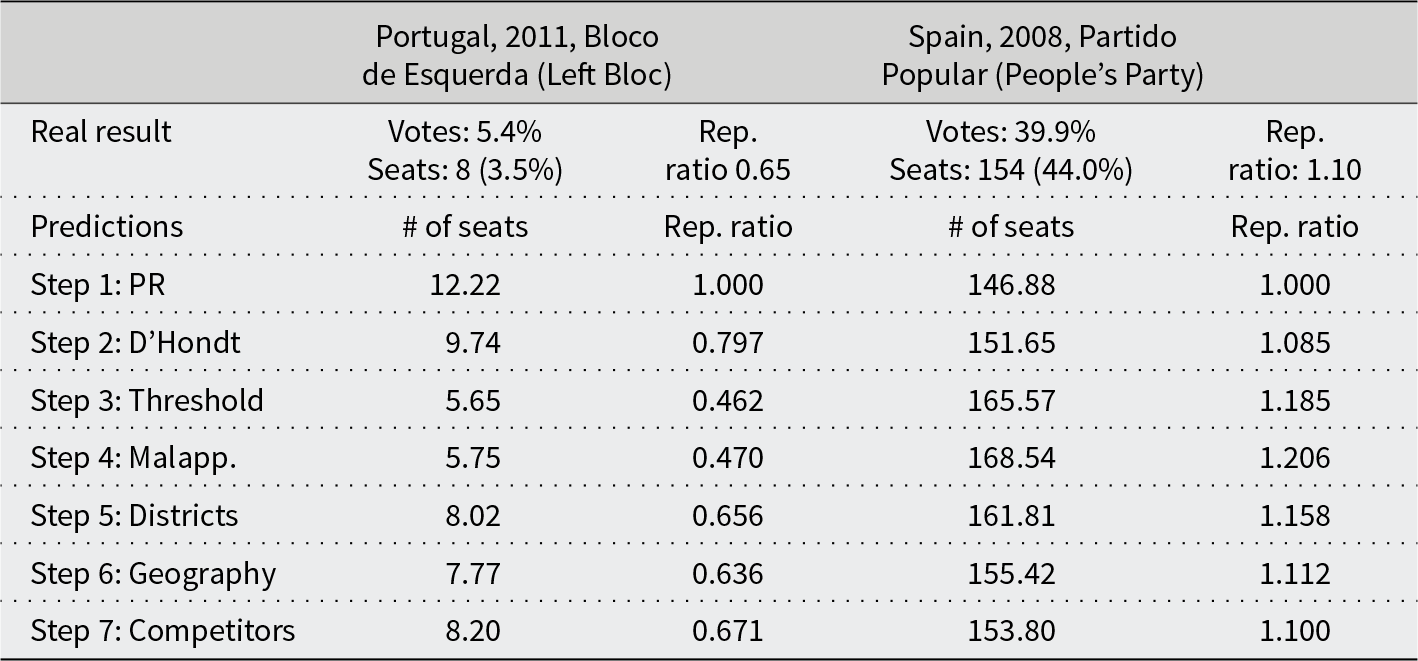
I illustrate this calculation for two parties, the small Left Bloc in the 2011 elections in Portugal and the large People’s Party in the 2008 elections in Spain (Table 3). The D’Hondt rounding rule (Step 2) predicts 9.7 seats for the Portuguese Left Bloc and 151.6 seats for the Spanish People’s Party. My basic model predicts the actual seat allocation better than the proportionality model. However, I overestimate the representation of the small party (the Left Bloc) and underestimate that of the large party (People’s Party). With further adjustments (Steps 3–7), my model becomes less parsimonious, but now it exactly predicts 8.2 and 153.8 seats for the two parties. The only remaining difference is the inevitable need to round to an integer. For the small Left Bloc, the most important improvement to the prediction comes from uneven district magnitude (Step 5), whereas for the large People’s Party, all four dimensions of territorial variance (Steps 4–7) are important for the prediction.
The Substantial Effect for a Small and a Large Party: Real Results and Model Predictions
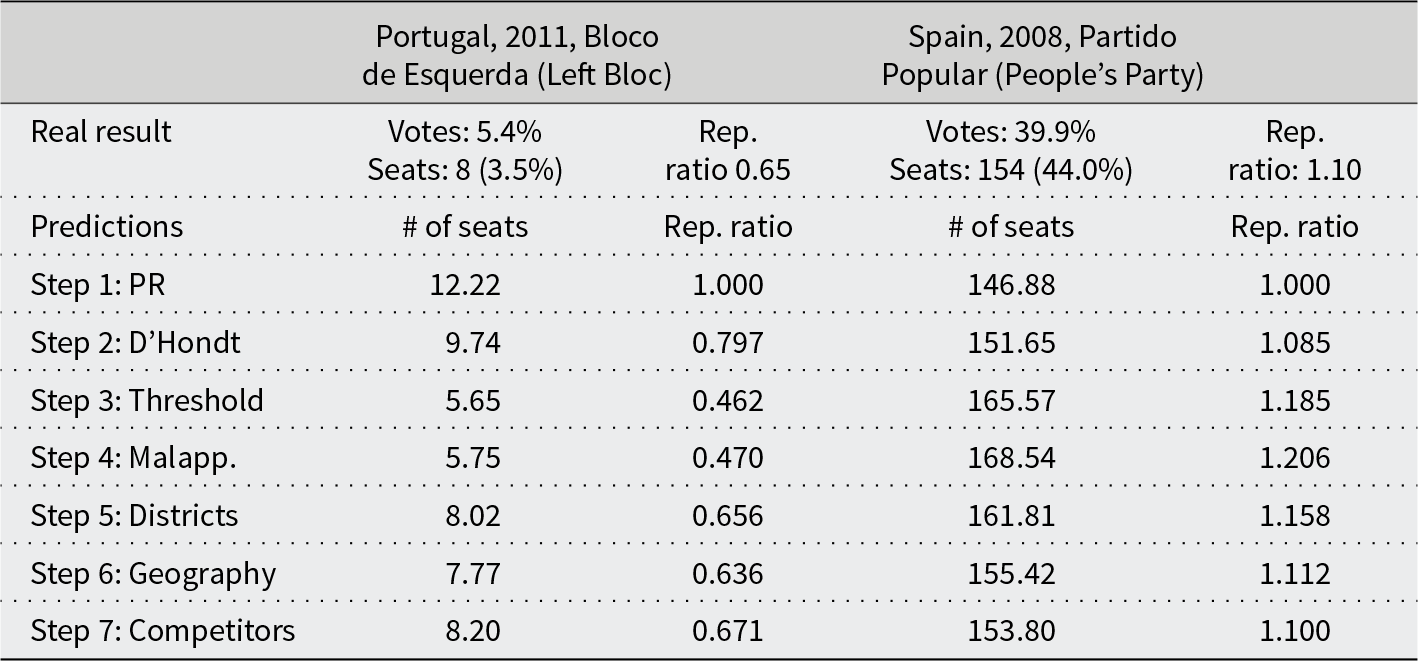
Table 3 Long description
The table compares real election results with model predictions for two political parties: Portugal's Left Bloc in 2011 and Spain's People's Party in 2008. It shows the percentage of votes, actual seats won, and representation ratios, alongside predicted seat counts and ratios across seven modeling steps. For the Left Bloc, real results show 8 seats with a representation ratio of 0.65, while predictions range from 5.65 to 12.22 seats, indicating varying levels of underrepresentation. For the People's Party, real results show 154 seats with a representation ratio of 1.10, and predictions range from 146.88 to 168.54 seats, suggesting slight overrepresentation. The modeling steps include proportional representation, D'Hondt method, threshold adjustments, malapportionment, districting, geographic factors, and competitor effects, each affecting seat predictions differently. The data highlights the complexities in predicting electoral outcomes and the impact of different electoral systems and methodologies on representation ratios.
Empirical tests
In the rest of this article, I apply the algebra-based model to 156 national parliamentary elections (lower house) under the D’Hondt rule, from 23 democracies worldwide, with a total of 3,653 political parties and 2,139 constituencies, for a total of 24,105 data points (party results per constituency). The sample includes 17 countries with PR according to the D’Hondt formula in multiple districts, applying to (almost) all districts and parliamentary seats, and six countries with a single district. In seven countries, a few districts, with no more than three parliamentary seats in total, elect representatives in single-seat majoritarian districts. These are regular territorial districts in Paraguay and Peru, island districts in Finland, overseas territories in Spain, districts for voters abroad in Guinea-Bissau and Macedonia, and districts for indigenous voters in Colombia.
In the elections covered in this sample, I count an average of 14.5 parties standing in each district, although this number varies widely from 3.7 parties in Cape Verde to 26.3 in Israel, correlating with district magnitude. It drops to an average of 2.9 for Albania and 8.3 for the full sample once I exclude all parties that do not meet the legal electoral thresholds.
For all parties in the dataset, I compute the predicted seat allocation at the national level and compare it with the actual national results. This analysis serves two purposes: first, it allows me to predict deviations under the D’Hondt rule and to show the magnitude of each of the seven partial effects. Second, it allows me to test the contribution of each of the seven steps to the explanatory power. For the seven elements of my model – introduced jointly, separately, as well as in all 26 different configurations of elements.Footnote 6
As the results show, some of the elements are essential for analysing the advantages of larger parties under the D’Hondt formula, while other elements are indispensable for analysing smaller parties. For small parties, the third step is the most crucial: the reason why most small parties (below 5% of the national vote) do not gain any seats in parliament is due to electoral thresholds (legal thresholds and the natural threshold of representation). For larger parties, however, the second step, capturing the D’Hondt rounding rule, is the most important element: medium-sized parties with 10%–15% of the national vote tend to lose some seats, while larger parties with over 20% of the national vote are net beneficiaries of the rounding process.
Dataset and descriptives
I selected democratic parliamentary elections (first chamber) under the D’Hondt rule, for elections for which complete election results (votes and seats) are available at the constituency level, for all political parties, including smaller ones, which are omitted from many comparative compendiums of election results.Footnote 7 The CLEA dataset offers complete election results, which for most countries include both votes and seats, also for the smallest parties, as well as district-level information. Where necessary, I supplemented this data with information from national electoral commissions.
In some countries, the D’Hondt rule is used in conjunction with other elements, such as multiple tiers of seat allocation or legal thresholds. Technically, the model may also be applied to analyse the lower-tier seat allocation in multi-tier elections or to upper-house elections under PR. However, as the seat allocation is partially or entirely based on the upper-tier rules, the parties’ nomination strategies and the vote distributions will be influenced by the latter. Similarly, upper-house elections are contaminated by the lower-house election and election rules. In order to restrict the sample to the most similar and comparable cases, I only analyse lower house single-tier electoral systems. I incorporate legal thresholds into the model by setting the number of electorally viable votes in a district to zero for parties that do not cross a district-level legal threshold (Albania, Croatia, Spain) or a national legal threshold, including differentiated thresholds for coalitions (Czech Republic, Poland). For elections involving list apparentments, the parties running in apparentments and their votes are dealt with as a single entity, where possible.Footnote 8 There are practical difficulties in using national aggregated variables when the set of parties participating in apparentments varies across districts. Because of such incongruent apparentments, I cannot include Argentina or Switzerland. All elections, as well as the reasons for exclusion, are listed in the Supplementary Material, Section B.
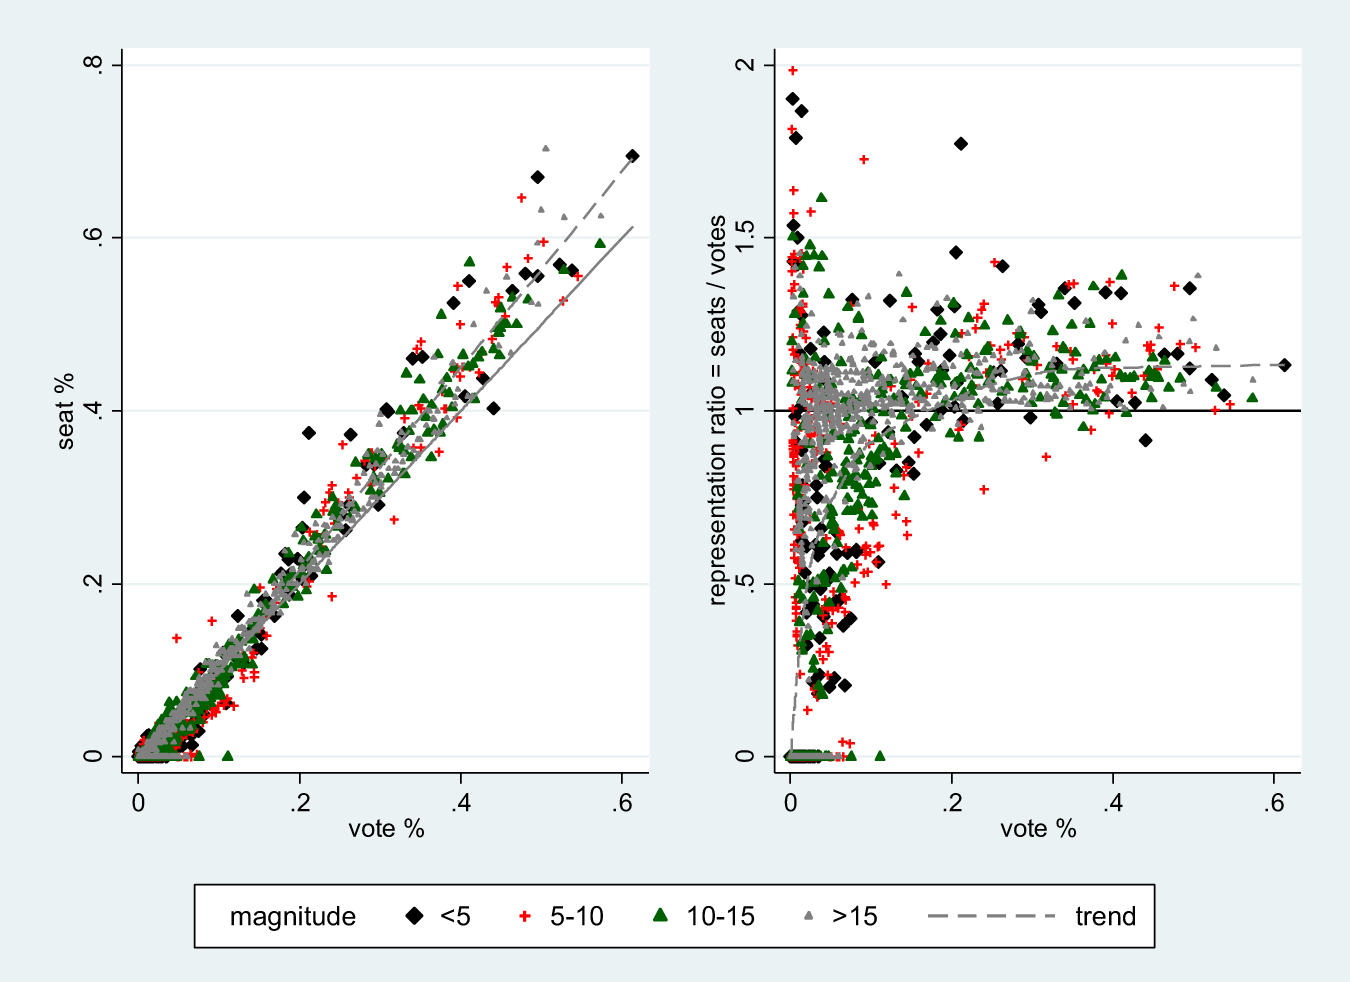
The first visual display of the data (Figure 1, left panel) can best be described in one term: proportionality. The empirical match between parties’ vote shares and seat shares in D’Hondt elections is almost perfect, with almost all points falling in the area around the bisecting line, and a correlation coefficient of r = 0.99. However, non-PR electoral systems also lead to such a near-perfect correlation. It is due to large parties gaining more representation than small parties, and the correlation is largely insensitive to over- or under-representation. A more meaningful measure for our purpose is the ‘representation ratio’ (Taagepera and Laakso Reference Taagepera and Laakso1980). It is the ratio of seat shares to vote shares by party. As can be seen in the right part of Figure 1, the representation ratio reveals the variance that is barely visible in the left panel. The bisecting line now becomes a horizontal line, at y = 1. Values above 1 stand for the degree of overrepresentation, and values below 1 for underrepresentation. In particular, for parties below 15% of the vote, the representation ratio varies across parties. Large parties with more than 20% of the national vote tend to be overrepresented, in the range of 1–1.35, thus winning up to 35% more seats than their actual vote share. This variance is more pronounced for PR systems with low district magnitudes (<5 seats or 5–10 seats, national average). In my sample, low-magnitude cases such as these are found in Latin American countries, as well as Norway and Spain. By default, the proportionality model (Step 1) predicts a representation ratio of 1 for all data points. Thus, the explanatory power of my first step shrinks from 99% to 0%.
Vote and Seat Distributions (Left) and Representation Ratios (Right)

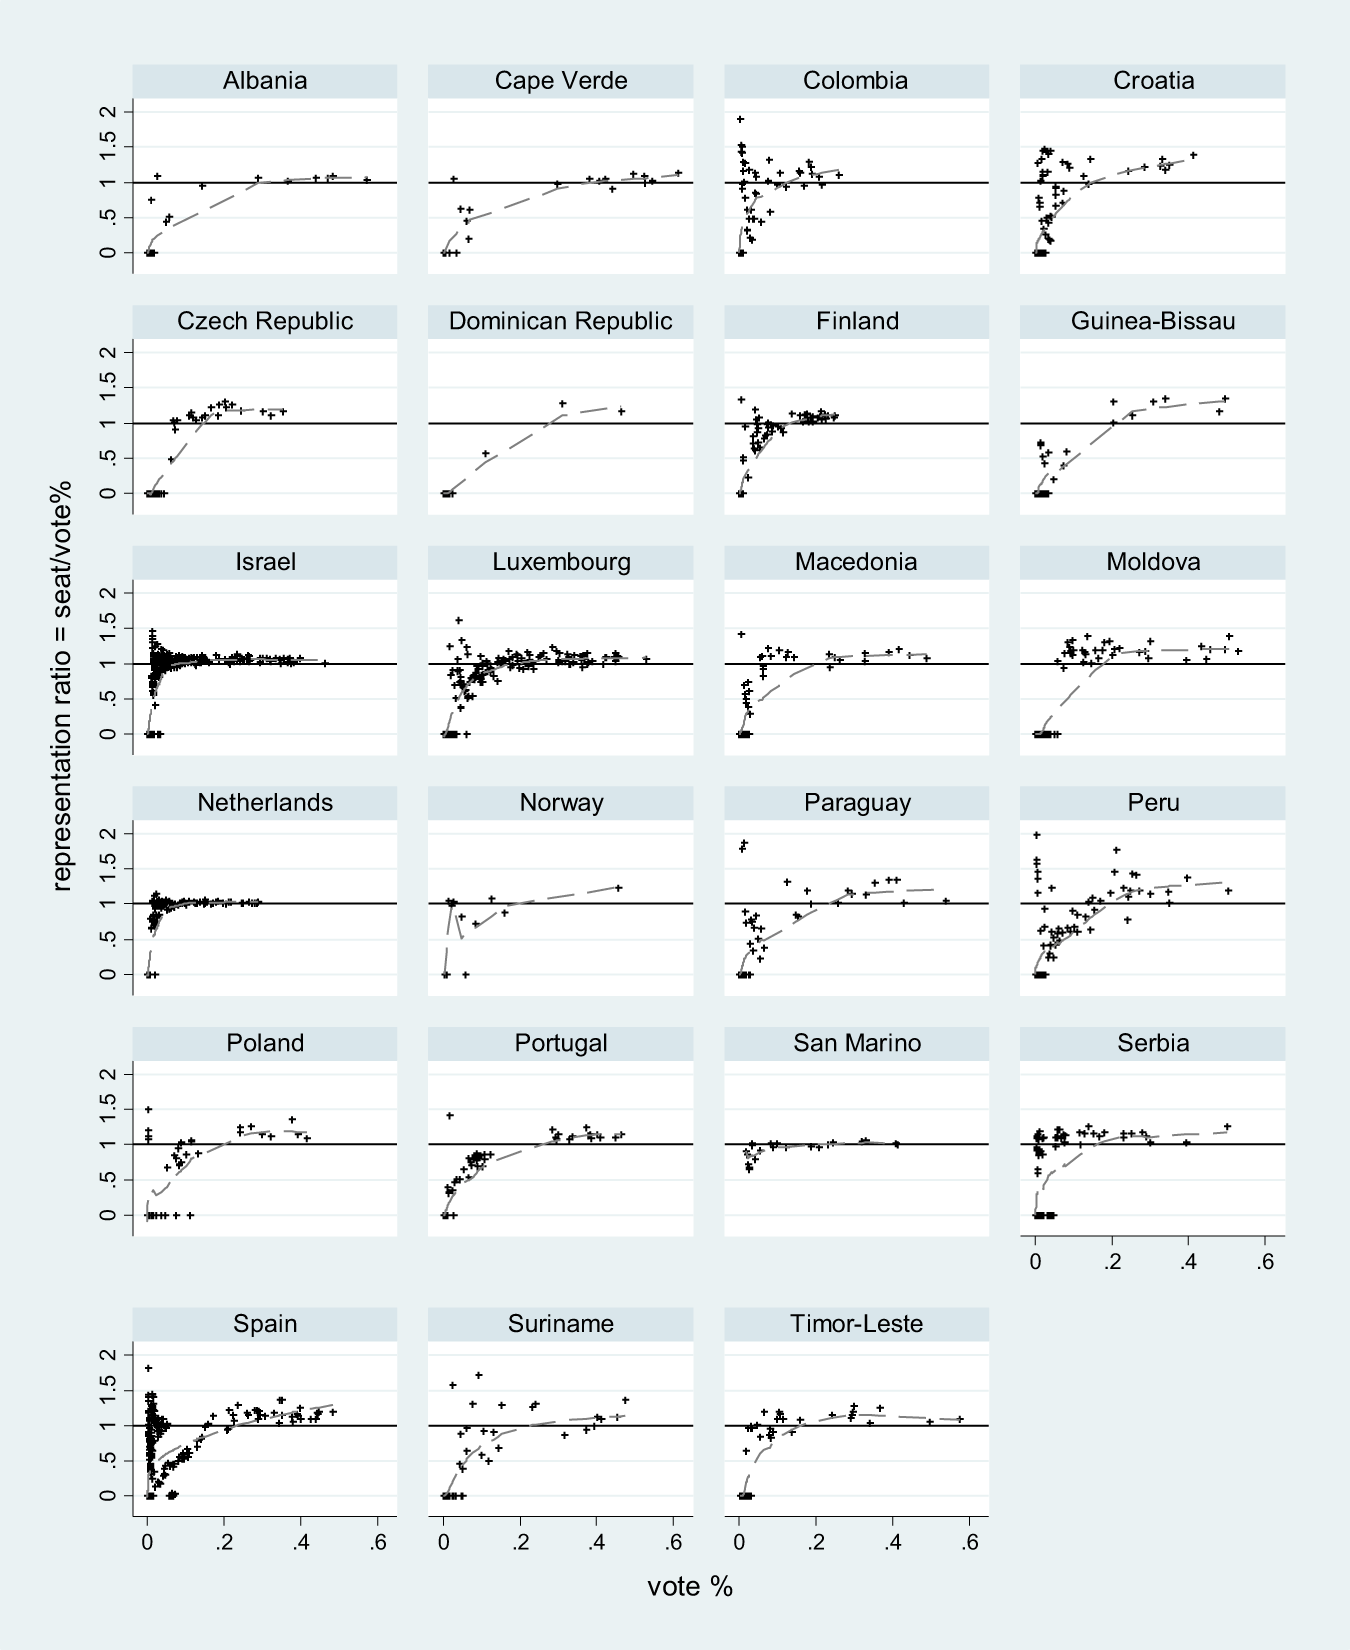
The results vary somewhat from country to country: Colombia, Peru and Spain have many small regional political parties, some of which win a proportional or even above-proportional seat share (see Figure 2). The distribution is more even in Luxembourg, Finland and Suriname, all of which are among the countries with fewer districts (4, 14 and 10, respectively), and almost flat in countries with a single district (Moldova, the Netherlands, Israel, San Marino, Serbia and Timor-Leste).
Representation Ratios by Country
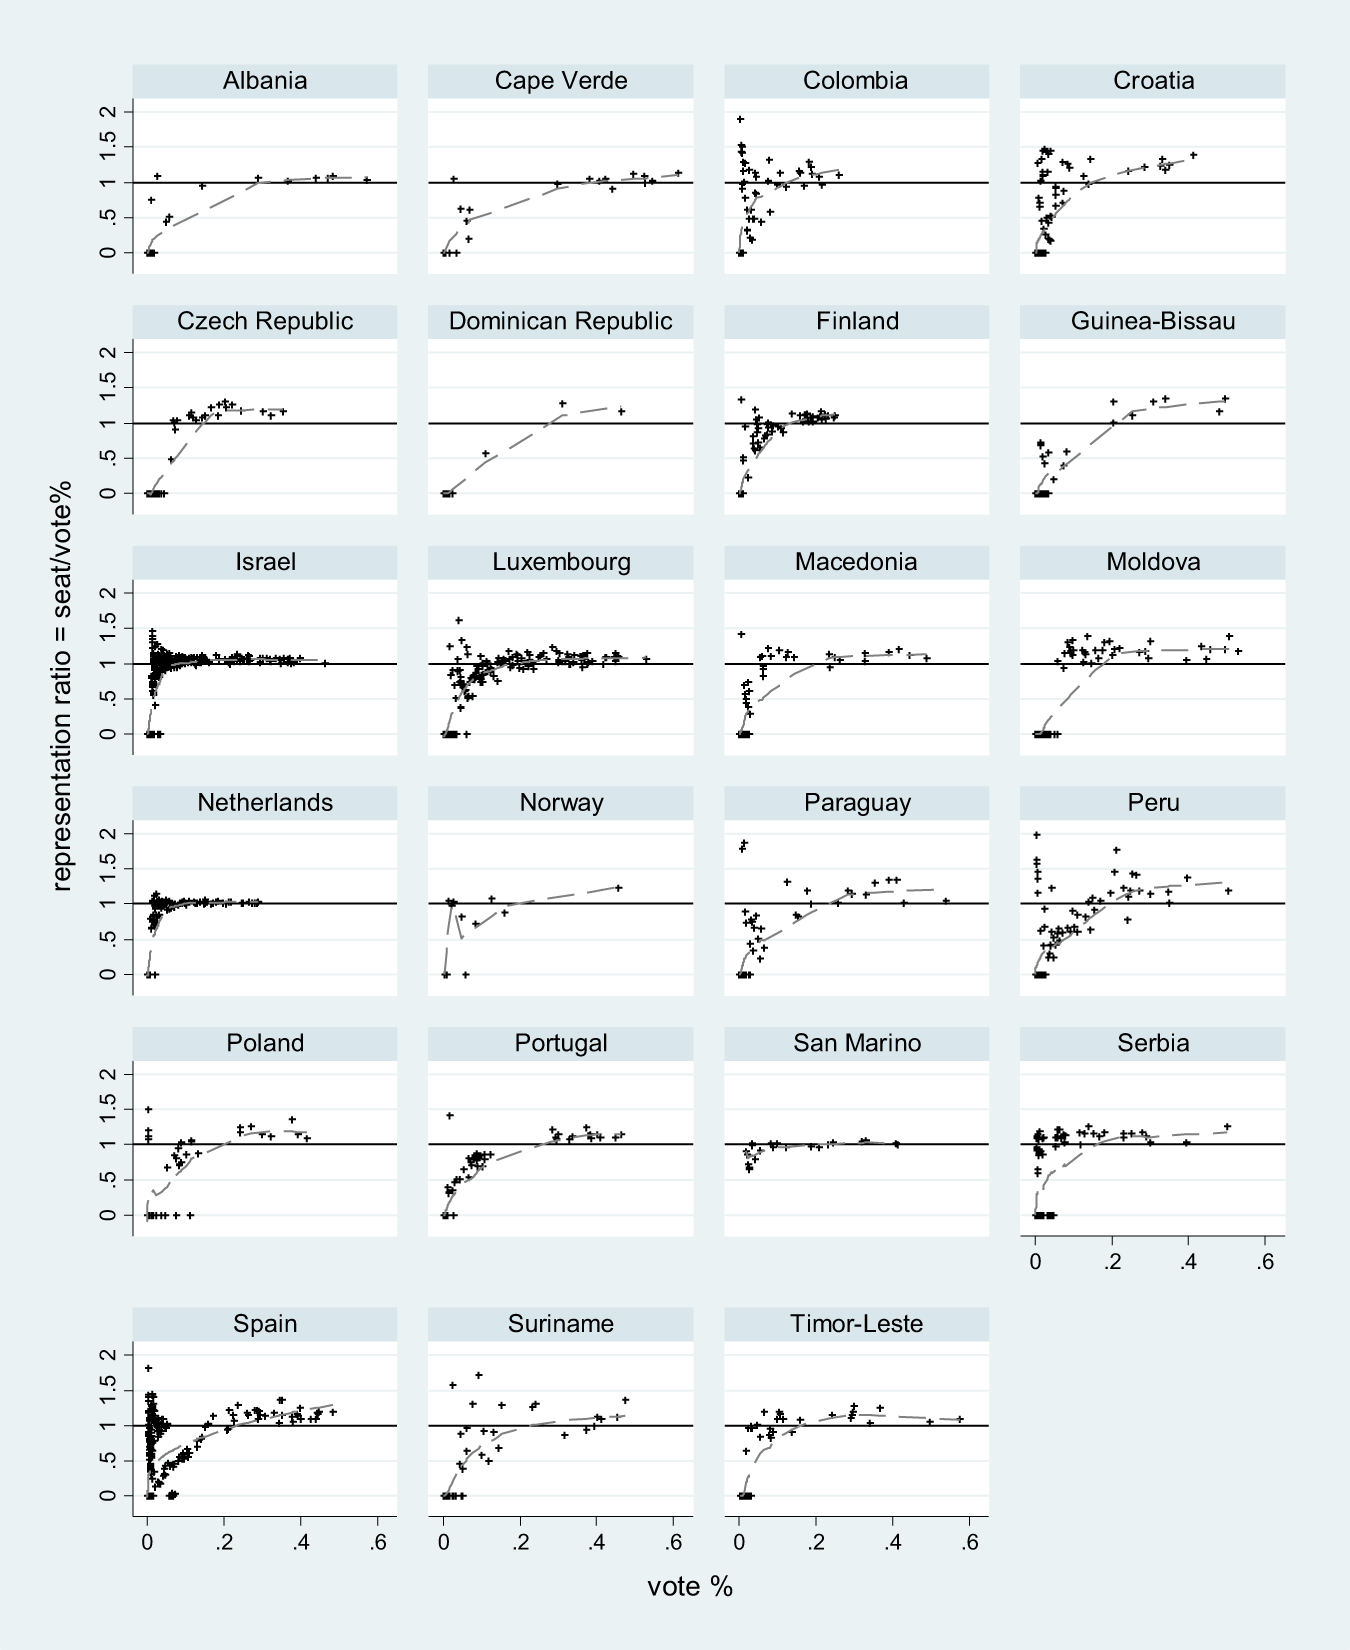
Deviations from proportionality can also be associated with the number of competing parties. However, as the case of the Dominican Republic shows, the reallocation effect will be vastly overestimated if all parties – including those below the threshold of representation – are included in the count (see above, Step 3).
Problem: electoral districts with no electoral coordination
Before moving on to the systematic analysis, I identify a few peculiar parties that gain a tiny national vote share but are vastly overrepresented. Generally, representation ratios range between 0 and 1.3 and reach up to 1.5 for a few very small regional parties. Very few parties reach representation ratios of 7 or 8; these are all tiny, local parties, mostly from Colombia. In the 2006 elections, Afrounincca won one of the two seats in the special constituency for Afro-Colombians, with just 4.3% of the constituency electorate. With 27 parties running, the number of votes to win a seat in this two-seat constituency was very low. I exclude this party and 11 others with a regionally concentrated electorate running in constituencies with a hyper-fractionalised result from further calculations.Footnote 9
Validating the model
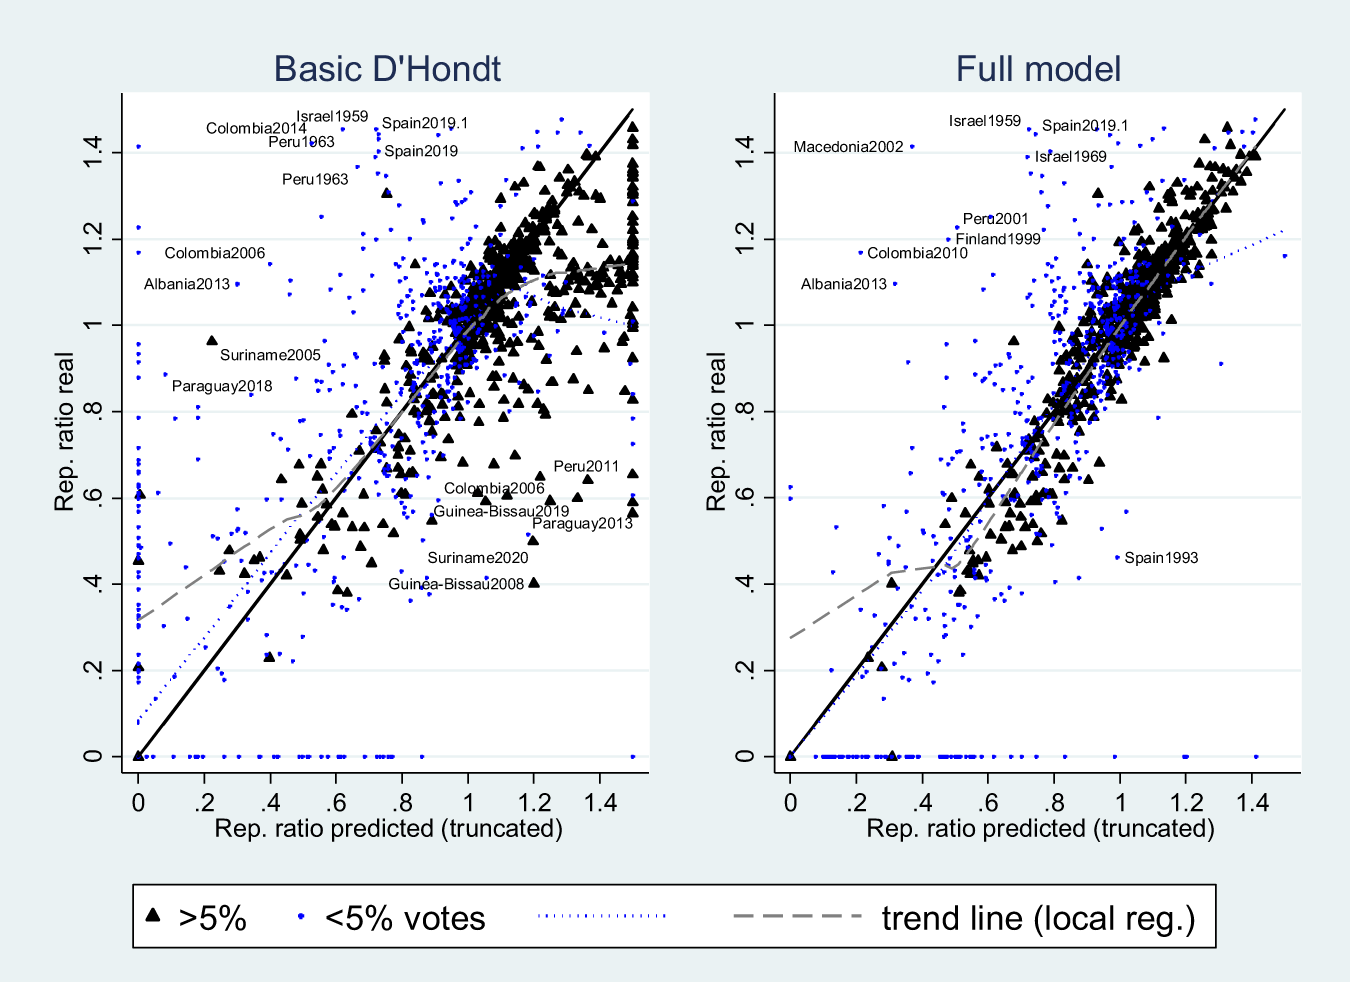
How well does my model explain the deviations from proportionality? And which of Steps 2–7 are relevant for this purpose? Figure 3 provides a visual comparison of the results, both for the basic model (Step 2, left panel) and for the fully developed model (all seven steps, right panel). The x-axis shows the predicted representation ratio, and the y-axis the actual representation ratio. In the left panel, many parties are located around the bisecting line, meaning that the basic D’Hondt rounding rule has some explanatory power, even when applied with no further additions. However, most of the other parties, especially the small parties, are far away. The empirical fit is much better for the full model (right panel).
Representation Ratios, Predictions and Empirical Values: Basic D’Hondt Model and Full Model

To assess the contribution of these elements more systematically, I have run these models for all 26 combinations of explanatory elements and calculated the explanatory power for each of these models. Since the different elements of the model affect the success of small or large parties in winning seats in parliament differently, I analyse two subsamples with parties below 5% and above 5% of the national vote. Small parties, with a vote share of no more than 5% of the national vote, make up the bulk of the data, accounting for 2,931 out of 3,641 cases, and thus dominate the results when the full sample is analysed.
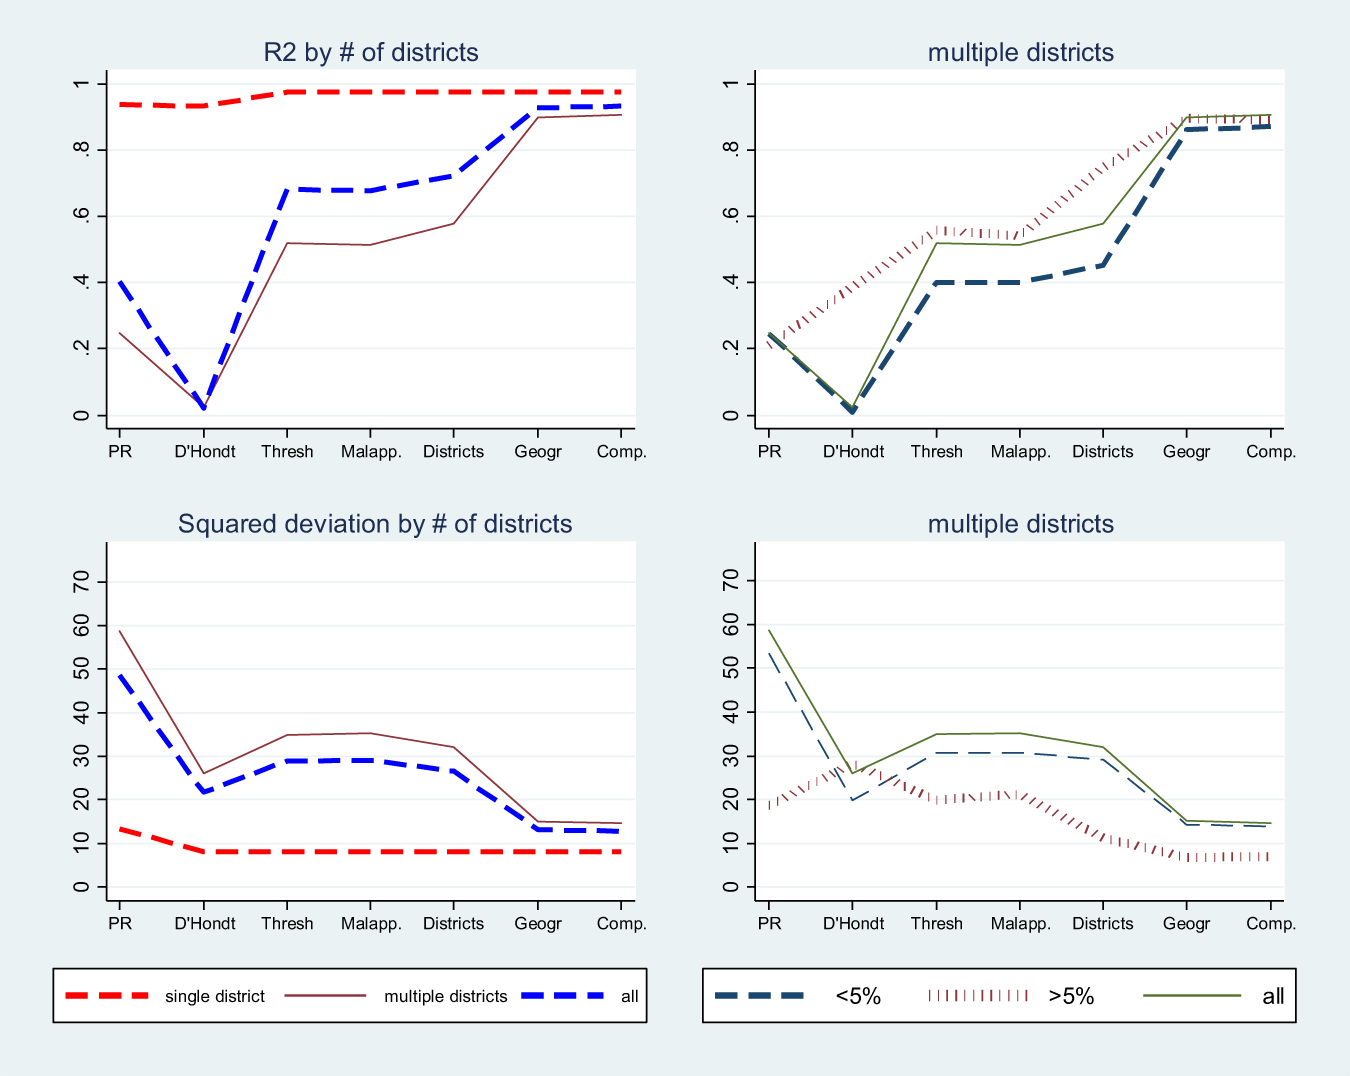
Figure 4 plots the empirical explanation for all steps of the explanatory model. On the left-hand side of Figure 4, I distinguish between single-district elections and those with multiple districts. For the latter (panels on the right-hand side), I separate small parties (below 5% of the vote) and non-small parties. I use two different metrics of explanatory power. The first metric, the conventionally used R 2, is shown in the top panel.Footnote 10 Elections in single-district systems are almost perfectly predicted by the proportionality rule and the D’Hondt rounding rule (Steps 1 and 2), which is unsurprising given that these elections involve very large districts, resulting in high proportionality. On the other hand, these elections lack variance in elements associated with uneven districts or electoral geography and are thus, by default, not affected by Steps 4–7. Multi-district elections are, therefore, key to explaining the results. For parties above 5% of the national vote, the full model provides 88% explanatory power in multi-district elections, with the D’Hondt rounding rule and average thresholds of exclusion explaining most of the variance (Steps 2 and 3, R 2 of 0.40 and 0.53), followed by uneven district magnitude and electoral geography (Steps 5 and 6, R 2 of 0.66 and 0.83). Conversely, malapportionment and the number of district competitors add little to the explanatory power.
Fever Curve for R 2 and Cumulative Squared Deviations

The empirical importance of each element of the solution is highly country-specific (see Supplementary Material, Section C, for results by country). This is a result of different institutional rules (district magnitude and its variance), of the party’s electoral geography, and of the context in which it competes (number of relevant competitors, wasted votes). In countries such as Colombia, Finland, Macedonia and Paraguay, because of the large number of small parties, the D’Hondt rounding rule alone, without taking into account thresholds of representation, massively overestimates the benefits for large parties.
I complement the R 2 with a second measure of empirical explanatory power: the index of cumulative squared deviations (Figure 4, lower panel). The classic metric of explanatory power, R 2, has its limitations when used to assess the quality of the model in subsamples with systematic deviations from the prediction. For example, the subsample R 2 fails to detect the substantial overestimation of the large parties’ benefits from the D’Hondt rounding rule (Step 2) when this bias is systematic for the entire subsample. Instead, my second measure is the average deviation from the prediction, and it is calculated for the entire sample and for subsamples (e.g. by country or by party size). The results are broadly in line with the R 2 for the full sample, except for Step 2.
The results for small parties (below 5% of the vote) differ from those for larger parties. The D’Hondt rounding rule itself does little to explain their level of representation. The average penalty (0.5 seats per constituency) is overestimated, even leading to negative seat predictions for 764 out of 3,642 data points (truncated in Figure 3), especially in countries with no legal thresholds and many constituencies. Thus, for small parties, the D’Hondt rounding rule should only be used when there is information about the electoral geography. When including Steps 3 and 6, the model has high explanatory power (R 2 = 0.76 or R 2 = 0.87 for the full model).Footnote 11
Substantial effects (simulation)
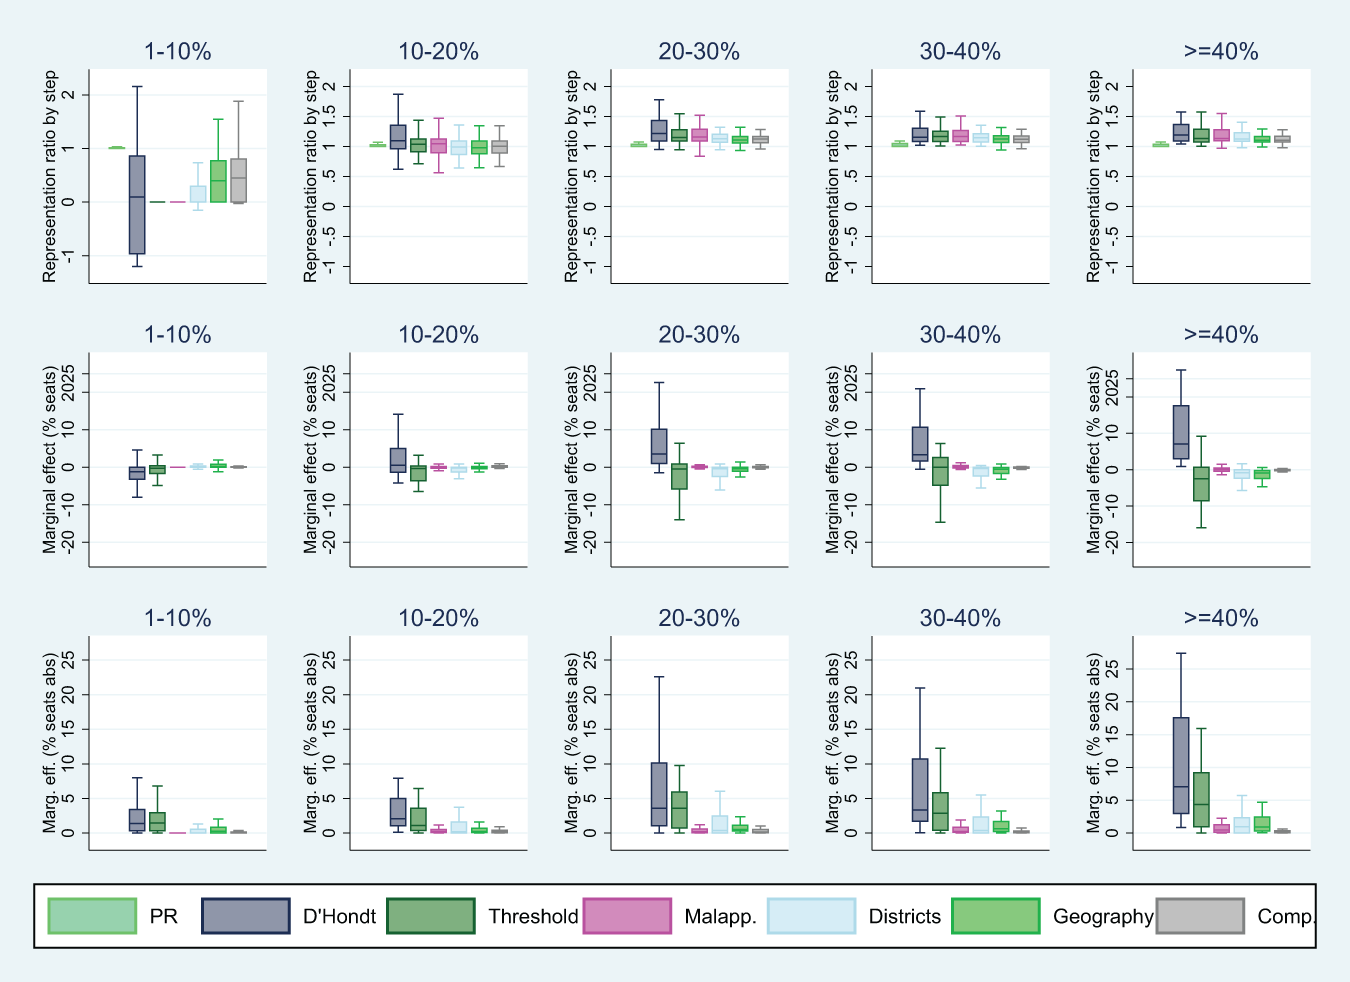
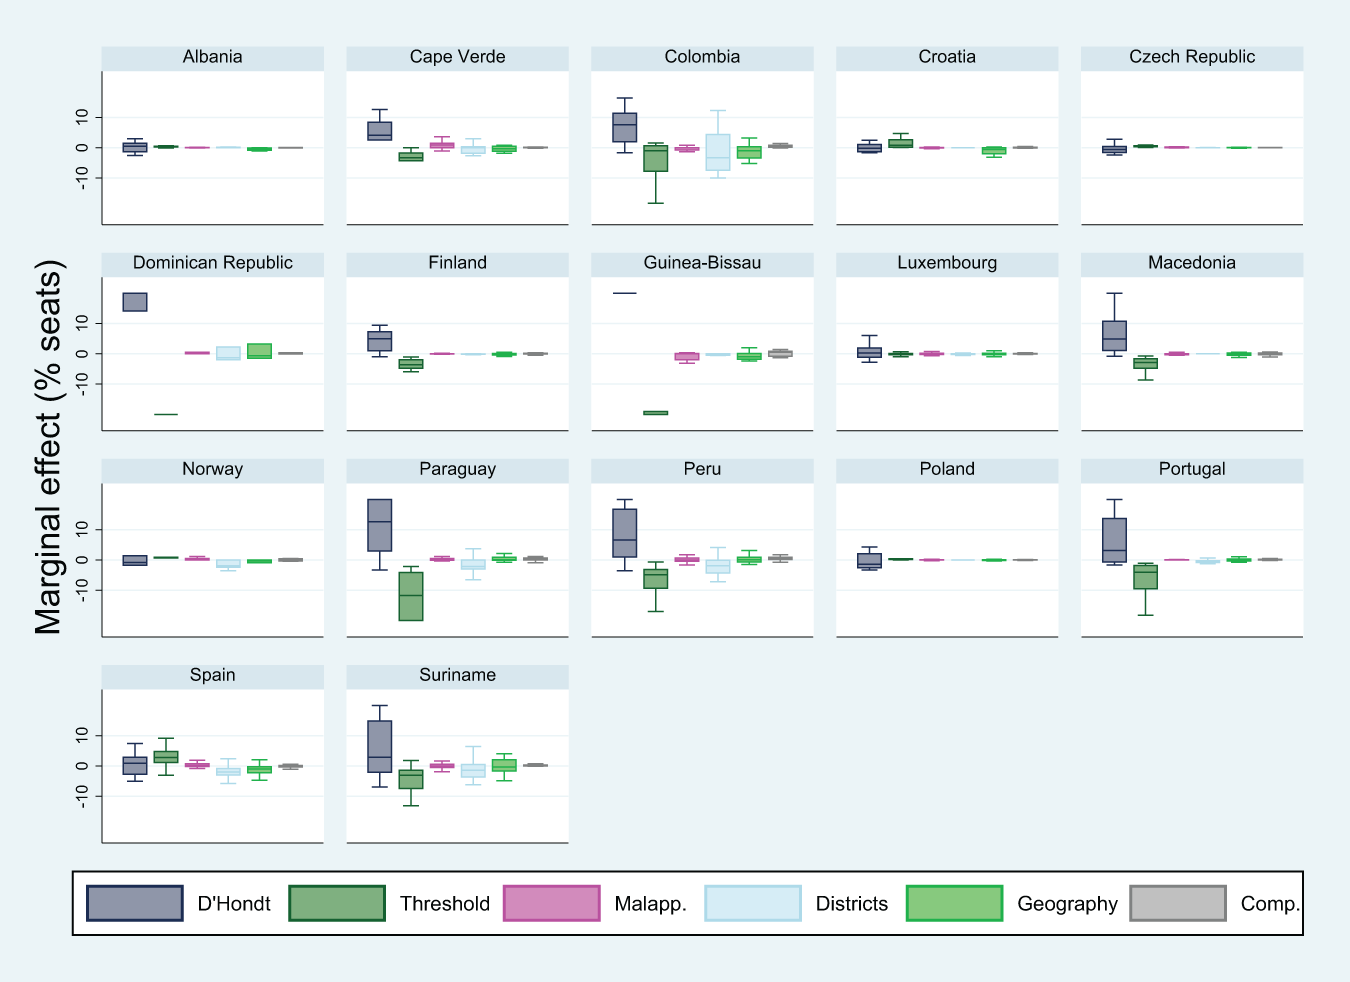
In this section, I discuss the substantial effects of each of the steps of the model for parties of different sizes (multi-district elections only). For each of the seven elements of the model, I simulate how it changes the predicted electoral results of parties according to their size (Figure 5) and between countries (Figure 6).Footnote 12
Representation Ratios for Each of the Seven Steps (First Row) and Marginal Effects (Second and Third Row), Parties by Size. Only Multi-district Elections Included

Marginal Effects by Countries (Only Parties with More Than 5% of the National Vote Share)

The largest substantial effects are associated with the D’Hondt rounding effect (Step 2) and thresholds of representation, which partially reverse the effects of the rounding rule (Step 3). The rounding effect of the D’Hondt rule rewards large parties with more than 10% of the vote and has a negative effect on small parties with less than 10% of the vote. Conversely, when the average thresholds of representation are taken into account, the dividing line between net winners and net losers moves from 10% to 20%.
Malapportionment (Step 4) affects the representation of larger parties above 10%, although the effect is heterogeneous and can be either positive or negative. For small parties, uneven district magnitude (Step 5) and electoral geography (Step 6) are crucial, as they can positively affect small parties’ representation. However, the effect is highly heterogeneous within this category of parties.
Discussion: district magnitude and uneven districts
Surprisingly, the model presented in this articledoes not include district magnitude, the variable most frequently addressed to characterise the proportional effects of PR and other electoral systems (Rae et al. Reference Rae, Hanby and Loosemore1971; Taagepera and Shugart Reference Taagepera and Shugart2017). Nor does other similar work either (Schuster et al. Reference Schuster, Pukelsheim, Drton and Draper2003: 658).
One explanation for this is that several other variables are either correlated with or transformed from district magnitude. First, the rounding effect of the D’Hondt formula is multiplied by the number of districts, and district magnitude is the ratio of seats in parliament to the number of districts. The number of seats in parliament largely reflects a country’s population size (Taagepera Reference Taagepera1972). Thus, smaller district magnitudes result in more districts and amplify the rounding effect. Second, the threshold of representation, which determines which parties are viable competitors, is a transformation of district magnitude. These are direct (mechanical) effects of the seat allocation rule.
Furthermore, district magnitude and the prospect of winning a seat have behavioural implications, also known as the ‘psychological effect’. In the model, this is measured by the number of competitors N, which tends to be lower in low-magnitude districts. A lower N, in turn, increases the break-even point (the vote share determining above which parties become overrepresented).
My results also contrast common beliefs, suggesting that malapportionment plays a somewhat less important role compared to other variables associated with between-district variance. The method used in this article differs conceptually and methodologically from earlier work (Kedar et al. Reference Kedar, Harsgor and Tuttnauer2021; Monroe and Rose Reference Monroe and Rose2002) in that it separates malapportionment from related phenomena, namely the political geography of the party voters and uneven district magnitude. Both factors have a sizeable impact on the seat allocation, the latter in particular for mid-sized and larger parties in countries, even in elections without malapportionment. The method employed allows me to distinguish between the direct (mechanical) effect of malapportionment, i.e. the consequence of some districts being overrepresented, and other indirect (psychological) effects. Notably, unequal district magnitudes are associated with variance in the number of competitors. This, in turn, alters the size of the D’Hondt rounding effect.
Conclusions
This article offers a new, algebra-based approach to understanding deviations from proportionality under the D’Hondt rule of PR. The mathematical model is inspired by Taagepera’s ‘logical models’ (Taagepera Reference Taagepera2008). It builds on the rules on seat allocation under D’Hondt and, based on simple algebra, derives implications about the over- and under-representation of political parties in parliament. Unlike empirical solutions, which may be driven by country-specific effects, it allows for general results. It also incorporates political variables, particularly electoral geography and party competition, to provide a comprehensive model of seat allocation under the D’Hondt rule.
Seats are rounded to integer numbers in every electoral system, creating random deviations from proportionality. However, my model identifies six factors that systematically lead to over- or under-representation and together explain over 90% of the deviations from proportionality. These factors benefit large parties or those that are advantaged by the design and seat allocation of electoral districts or varying competition between them. My model is innovative in that it distinguishes these factors theoretically and empirically and allows for a universal, quantitative prediction of the magnitude of these effects. Second, I achieve this entirely on theoretical grounds, with no empirically estimated parameters. Third, whereas previous algebraic solutions have been applied at the level of electoral districts (Balinski and Young Reference Balinski and Young2001; Bochsler Reference Bochsler2010; Medzihorsky Reference Medzihorsky2019), my model is suited for national-level effects. Fourth, the model is comprehensive: it includes the seven common factors that determine the seat allocation under the D’Hondt formula, and it shows how they are interrelated and conditional on each other. In particular, this algebraic approach allows me to distinguish four dimensions of between-district differences. I quantify the effect of unequal district magnitude, variance in party strength and uneven number of competitors across districts and show that they also play a role, irrespective of malapportionment.
The D’Hondt rounding effect is crucial in explaining the seat gains of larger parties, i.e. those with more than 20% of the national vote. It is also the main reason why medium-sized parties (in a multiparty system with a handful of relevant parties, those with less than 15%–20% of the national vote) tend to be represented below their vote share.
However, the model is sensitive to the operationalisation, particularly with regard to territorial differences. The results vary considerably depending on which parties and which constituencies are considered. The threshold of representation (half the inverted district magnitude) can serve as a straightforward criterion to determine which parties should be included in the calculation and the constituencies in which they count as viable parties.
While most research on national deviations from proportionality or comparative work using information on party representation is based on aggregate measures of disproportionality or institutions that are identical for all parties in elections, this new approach opens the door to more nuanced studies. It shows the differential impact of electoral system effects on different parties, moderated not only by party size but also by institutional unevenness across countries and political geography, and thus allows for a better understanding of PR rules. This may benefit future studies on electoral systems, as well as a wider range of comparative studies that rely on quantitative indicators of the effect of electoral institutions, with political parties as the unit of analysis. Future studies may also build on this model to analyse PR electoral systems with multiple tiers, bonus seats, or other more nuanced electoral rules with elements from PR.
Previous work has simulated the effect of the D’Hondt rule, offering a comprehensive approach for the analysis of party representation with a particular focus on uneven district magnitude. My algebra-based model assesses primarily the direct effects of the D’Hondt rounding rule, which electoral system scholars refer to as the ‘mechanical effect’. However, in this model, party and voter choices matter too: the number of competitors, the vote share for small, non-viable parties, and the geographical distribution of votes – all of which variables are associated with the ‘psychological effect’ of the electoral system – have a moderating effect. These variables impact the magnitude of the rounding effect of D’Hondt. The model may, therefore, also open an avenue for future work on the interplay between behavioural and institutional effects, providing a more refined theoretical framework for this type of study and allowing for a better distinction between behavioural and institutional effects.
Supplementary material
The supplementary material for this article can be found at https://doi.org/10.1017/gov.2026.10042.
Data availability
Replication data for the article are available at: Bochsler, Daniel, 2026, ‘Elections under D’Hondt’, https://doi.org/10.7910/DVN/UKESOH, Harvard Dataverse.
Acknowledgements
I am grateful for helpful comments by Francesc Amat, Albert Falcó-Gimeno, Aina Gallego, Marc Guinjoan, Juraj Medzihorsky and Jordi Muñoz. This article has benefited from invaluable research assistance by Bence Hamrak.
Disclosure statement
The author reports that there are no competing interests to declare.


 Open access

