


1. Motivation
Designing is a mental (cognitive) activity whose output is in the form of some representation. Representations are a means of externalizing thought and serve multiple purposes. They can be a way to offload cognition, or they can be a way to communicate ideas. Offloading cognition occurs when we intentionally represent our thoughts with the aim of reducing the mental workload in maintaining them in our mind (Morrison et al., 2020; Reference Shealy and GeroShealy & Gero, 2024; Wahn et. al., 2023). A common example of offloading cognition is a shopping list of items to be purchased. These items no longer need to be remembered, thus reducing their cognitive load. Designers sketch and draw to both offload cognition and to communicate. A common form of external representation used by designers is drawings. They are not the only form. Textual descriptions are used extensively in planning, and mathematical representations are used extensively in engineering design. However, visual images transcend any particular design domain as a form of externalization of thought.
Often, design ideas are represented in multiple media. In engineering, architectural, and product design, ideas may be represented as sketches, rapid prototyped physical objects, and mathematical models. Representing ideas from one medium in another medium is a form of ekphrasis (Gero, 2017). Ekphrasis is the expression of a concept that is represented in the medium of one domain in the medium of another domain. Different representations allow or facilitate different cognitive actions (Reference Scaife and RogersScaife & Rogers, 1996; Reference ZhangZhang, 1997). This is representational affordance (Reference Gero and KannengiesserGero & Kannengiesser, 2012). Thus, representations play an important and significant role in the design process.
The introduction of technology has produced a variety of media in which sketches and drawings can be displayed. It is known that different media can produce different interpretations of the same idea in different representations. This has been studied qualitatively and to a lesser extent using eye-tracking methods (Reference Gero, Shields, Yu, Chien, Choo, Schnabel, Nakapan, Kim and RoudavskiGero et al., 2016; Reference Park, Jin, Ahn and LeePark et al., 2019; Reference Yu and GeroYu & Gero, 2017). Much of the studies on representation have been qualitative. This has resulted in a gap in our quantitative knowledge of the effect that different representations of the same idea have on the designer’s brain. In this paper, we present quantitative results from a study of brain responses to the representation of the same design using two different media
2. Aim and significance
The research reported in this paper aims to determine whether brain responses differ for different representation media for the same design.
Different representations afford different interpretations and different forms of measurement. Brain activations and their resulting brain-derived neural networks provide a grounded, commensurable, objective response to a representation that can be used to compare differences in representations. This brain behavior is a consequence of visual perception. In the past, visual perception of scenes has been described subjectively. Here, we present an approach that allows for objective measurements of the response. Once we have these objective measurements, we are in the position of using them to distinguish the effects of different representations.
3. Background
External representations can be categorized as: iconic (they appear visually similar to the object being modelled); symbolic, including mathematical (symbols represent features of what is being modelled); and sub-symbolic (units connected as networks that represent symbols or features).
Recent studies have explored the neural mechanisms activated by different media using EEG analyses. Virtual Reality (VR) offers distinct advantages in experimental research by immersing participants in realistic 3D environments, enhancing both engagement and ecological validity. VR has also been widely used to assess design effectiveness through evidence-based approaches (Reference Jung, Kim and KimJung et al., 2023).
Reference Slobounov, Ray, Johnson, Slobounov and NewellSlobounov et al. (2015) demonstrated that immersive 3D environments demand greater allocation of brain and sensory resources for cognitive and motor control tasks compared to 2D presentations, emphasizing the cognitive intensity of VR experiences. Similarly, Reference Kakkos, Dimitrakopoulos, Gao, Zhang, Qi and MatsopoulosKakkos et al. (2019) revealed that increased alpha band efficiencies and beta band local efficiency correlated with higher mental workload levels. Moreover, the beta band global efficiency exhibited distinct developmental trends between 2D and 3D interfaces, highlighting key differences in cognitive processing across these media.
Kim & Gero (2022) examined neurophysiological responses in virtual classrooms, comparing monitor displays and immersive VR. They reported significant effects of media type and brain hemisphere on alpha power, as well as complex interactions between classroom design conditions, participant design backgrounds, and beta power.
What is missing from these studies is the recognition that brain networks are the underlying mechanism of brain activity rather than region activations. It is this gap in our knowledge that is addressed in this paper. Accordingly, brain network examines functional connectivity by correlating electrode-measured activity, treating electrodes as nodes and significant correlations as edges (Reference Rubinov and SpornsRubinov & Sporns, 2010). This method is increasingly used because it captures how brain regions collectively respond to stimuli, offering a model beyond strict localization (Reference Craddock, Tungaraza and MilhamCraddock et al., 2015). Moreover, it mitigates signal-to-noise issues by analyzing data dynamically rather than averaging responses, which often compromises the large amount of data collected. This is particularly relevant for design neurocognition, where tasks’ periods are extended (sometimes to hours). This may detect subtle activity changes that traditional activation methods may miss, providing a more detailed view of brain function (Reference Chiarion, Sparacino, Antonacci, Faes and MesinChiarion et al., 2023).
4. Research design
In this within-subjects study, we compared EEG-based neural networks from two different media representations of the same classroom: (1) monitor and (2) VR. Participants explored the architectural prototypes of both 3D-rendered images and VR stimuli in a random order. The experimental procedure was pre-tested to ensure reliability.
4.1. Participants
The study recruited 23 healthy, right-handed male undergraduate students from various majors via an online system in Seoul, South Korea. During the screening process, we selected only participants with prior VR experience. All participants had normal or corrected-to-normal vision, no neurological impairments, and voluntarily participated in the study for a $20 compensation.
Ethical approval was obtained from the Institutional Review Board of Yonsei University, and all participants provided written consent before the experiment. Due to motion sickness, two participants could not complete the VR experience. Additionally, due to technical issues with recording EEG signals, data from four participants were excluded. In the end, data from 13 participants were used for EEG analysis after excluding incomplete or noisy data. The final cohort had a mean age of 21.34 years (SD = 1.44).
4.2. Architectural prototype
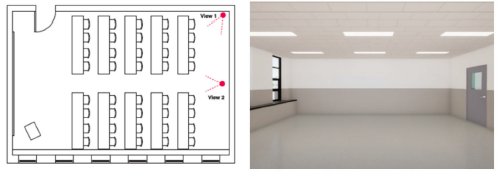
The experiment utilized a 3D model of a university lecture room with dimensions of 7.6m (W) × 11.5m (D) × 2.7m (H), as shown in Figure 1.
The virtual classroom incorporated a biomorphic design, which drew inspiration from natural forms and structures. This design approach emphasizes the use of organic shapes, such as curves and wavy patterns, to evoke the aesthetics and functionality found in nature. In this specific prototype, the ceiling featured a wavy, undulating form, mimicking the flow of natural elements like waves or clouds.
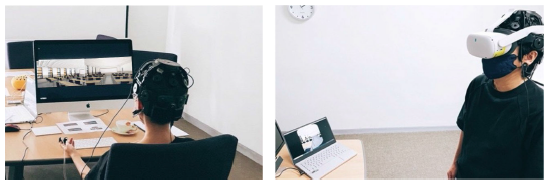
The stimuli were pre-modelled in Rhino (version 6.0) and rendered in real time using Twinmotion (version 2021.1). While the monitor provided a static representation, the VR experience allowed participants to freely explore the virtual classroom, offering a higher level of immersion. They could navigate the space using a controller, moving from the entrance to the back of the classroom. This classroom was represented in two formats: 3D-rendered image and a VR environment, Figure 2.
Classroom layout and 3D model

3D rendering images (top) and VR representation (bottom)

4.3. Media as experimental conditions: monitor vs VR
The equipment details for the two different representation media were associated with two distinct experimental conditions, as follows:
-
Experimental condition 1 - Monitor (as desktop) display:
-
The monitor condition used an iMac with a 27-inch screen and a resolution of 5120 × 2880 pixels. In this setting, two static, perspective-rendered images of the classroom were sequentially displayed to the participants.
-
Experimental condition 2 - VR display:
-
The VR condition utilized the Oculus Quest 2 head-mounted display (HMD), which features an LCD screen resolution of 1832 × 1920 pixels per eye. Participants were immersed in a real time VR representation of the classroom environment using this device. The VR content was rendered and displayed using Twinmotion (version 2021.1, Epic Games, USA) and streamed to the headset.
Figure 3 shows the two experimental conditions related to the two media
Experiment procedure (left: monitor, right: VR HMD condition)

4.4. Experiment procedure
Each session lasted approximately 30 minutes and was conducted individually in a controlled laboratory setting. Prior to the experiment, participants provided informed consent as approved by the IRB and were briefed on the experimental procedure. Detailed instructions were given to ensure participants understood the protocol. Participants were fitted with an EEG headset, and initial setup procedures included calibrating the device and verifying signal quality. To minimize artifacts and ensure accurate data collection, participants were instructed to relax and remain seated comfortably while the researcher monitored the EEG signal.
The experiment consisted of two conditions (monitor vs. VR) presented in the same order. First, participants viewed the monitor condition for 30 seconds while seated, followed by a 10-second blackout period. They then wore the VR headset and proceeded with the VR condition for 30 seconds while standing to reduce arousal. Upon completing both conditions, participants were compensated and debriefed regarding the experiment’s purpose and procedure.
4.5. Data collection and EEG preprocessing
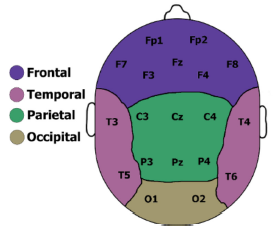
EEG data were collected and recorded using a research-grade, wireless, dry-electrode EEG headset (DSI-24, Wearable Sensing, USA). The electrodes were positioned according to the 10-20 International System, ensuring standardized sensor placement for data acquisition. The 19 electrode locations were Fp1, Fp2, Fz, F3, F4, F7, F8, Cz, C3, C4, T3, T4, T5, T6, P3, P4, Pz, O1, and O2. The disposition of the electrodes and the different brain areas are depicted in Figure 4.
Electrodes disposition and brain regions

EEG data were processed using EEGLAB, an open-source MATLAB toolbox (Reference Delorme and MakeigDelorme & Makeig, 2004). Signals were band-pass filtered (4–50 Hz) and divided into 1-second epochs. Epochs with significant noise were manually excluded, and Independent Component Analysis (ICA) was used to remove artifacts (e.g., eye blinks, muscle activity). Conditions with fewer than 18 usable epochs were excluded from the statistical analyses.
EEG frequency power analysis was conducted using Fast Fourier Transform (FFT). Power values for the theta (4–8 Hz), alpha (9–12 Hz), beta (13–30 Hz), and gamma (31–50 Hz) bands were calculated by averaging across epochs. Relative power, representing the proportion of power in a specific band relative to total power, was computed and standardized using Z-scores. A Gaussian distribution with a 95% confidence level (Z = -1.96 to 1.96) was applied, following established methods (Reference Thatcher, Walker, Biver, North and CurtinThatcher et al., 2003).
4.6. Data analysis method using brain network
We analyzed group data from each trial using graph theory to study how brain networks change over time. For each frequency band, we calculated the correlation between each pair of electrodes using Pearson correlation. The resulting correlation matrix was the basis for selecting significant correlations, identified with values higher than 0.675, as a standard trade-off between sensitivity (true positive) and significance (false positive) (Reference Adamovich, Zakharov and TabuevaAdamovich et al., 2022). This generates a binary correlation matrix with 1 for significant correlations and 0 for no significant correlation. Only significant correlations were used to develop the brain networks. In these networks, each electrode was represented as a node, and the connections between electrodes were represented as edges.
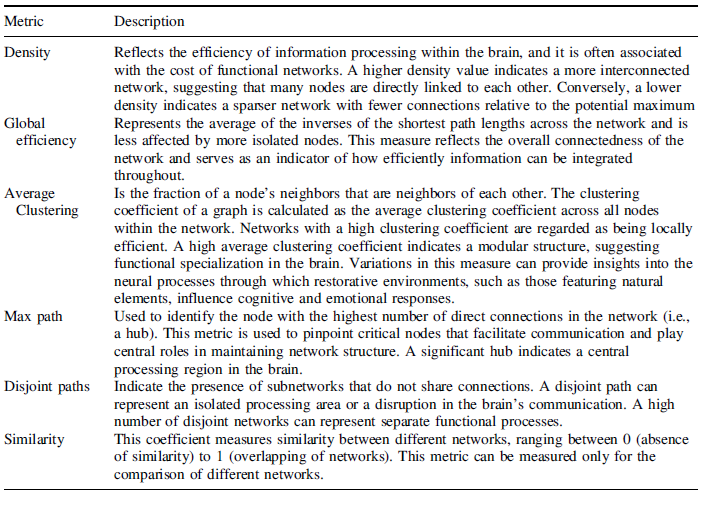
We then calculated several key network metrics, including network density, global efficiency, average clustering coefficient (average clustering), maximum number of connected nodes (max path), number of disconnected parts (disjoint path), and Jaccard similarity (similarity). Table 1 describes these metrics.
Brain network metrics (Reference Rubinov and SpornsRubinov & Sporns, 2010; Reference Duda, Cook and GeeDuda et al., 2014; Reference Chung, Miasojedow, Startek and GambinChung et al., 2019)

Two-sample t-tests were performed on network parameters (density, efficiency, clustering, connectivity) to identify condition-specific differences. Data processing and analysis were performed in Python using Numpy, Pandas, and NetworkX.
5. Results
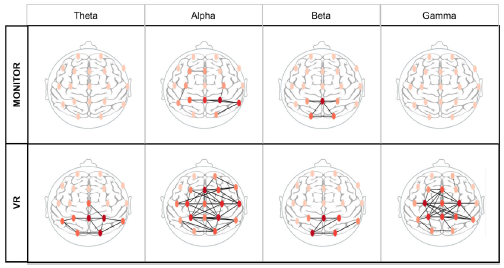
Brain network analysis showed distinct brain activity patterns when participants were exposed to design representations on a monitor or in a VR setting. Differences in these networks were observed across the alpha, beta, gamma, and theta brainwave frequencies. The brain network structures identified for each setup and frequency band are shown in Figure 5, where higher intensity of red represents nodes with higher correlations.
In the Monitor setting, brain networks exhibited limited connectivity. Specifically, no significant interactions were observed in the gamma and theta bands. However, in the alpha band, the correlations revealed a high connectivity pathway in the parietal and occipital regions, bridging the two hemispheres. Additionally, the alpha band displayed smaller and weaker connections in the left central and frontal regions of the brain. For the beta band, correlations were primarily concentrated in the occipital-central area.
In contrast, the VR setting showed significantly enhanced network activity across all frequency bands, indicating that VR promotes more extensive and intense brain engagement. In both the alpha and gamma bands, the correlations demonstrated a wide range of interactions, forming complex networks with multiple arcs connecting the right and left hemispheres. For the alpha band, these activations were distributed across almost the entire scalp, except for the frontal left area. In the gamma band, however, interactions were largely absent in the frontal regions. Similar to the monitor condition, beta band correlations in the VR setting remained concentrated in the occipital area, with a slight lateralization toward the right hemisphere. The theta band, on the other hand, exhibited strong connectivity in the posterior regions of the brain, with a broad distribution spanning from the left to the right hemisphere.
Brain network analysis of Monitor vs VR settings for theta, alpha, beta, and gamma bands

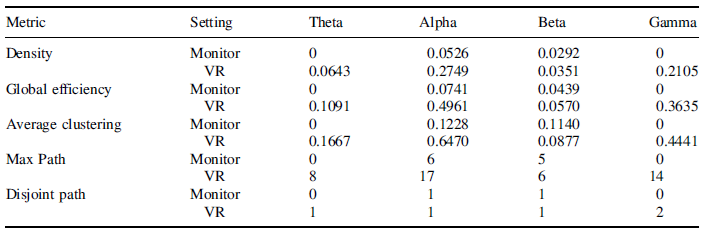
The brain network metrics for each of the two settings are shown in Table 2. The findings derived from visual analysis, discussed above, are supported by the metric values. Except for the disjoint path measure, all metrics indicate higher values in the VR setting compared to the Monitor setting across the alpha, gamma, and theta bands. Notably, the beta band exhibited very similar values in the two settings.
In the VR condition, the alpha and gamma bands demonstrate significant interconnectivity, with the alpha band showing the highest density value (0.2749). Specific electrodes, such as Fz and P4 in the alpha band and C3 in the gamma band, reveal multiple connections (e.g., eight arcs), indicating larger scale network activity. In contrast, the Monitor condition shows much lower density across all frequency bands, with alpha again recording the highest density value (0.0526). Both the beta and theta bands display low interconnectivity in both settings, consistent with their minimal density values.
Global efficiency is notably higher in the VR setting. The alpha band shows the highest value (0.4961), followed by the gamma band (0.3635), reflecting strong communication and integration within these networks. The monitor condition, however, demonstrates significantly lower global efficiency, with the alpha band achieving the highest value (0.0741). Once again, the beta and theta bands exhibit limited efficiency in both conditions, aligning with their low-density values.
The VR condition also yields substantially higher average clustering coefficients in the alpha (0.6470) and gamma (0.4441) bands, indicative of modular network structures and localized efficiency. The theta band under VR has a moderate clustering coefficient (0.1667), while the beta band shows the lowest value (0.0877). By comparison, the monitor condition exhibits much lower clustering coefficients across all frequency bands, with the alpha band again showing the highest value (0.1228). This suggests limited local efficiency and modularity in the monitor environment.
The VR setting results in the presence of a number of hubs, particularly in the alpha and gamma bands, with maximum connected nodes of 17 and 14, respectively. These hubs encompass nearly all electrodes. The monitor condition, on the other hand, shows far fewer connected nodes, with a maximum of six in the alpha band, highlighting reduced connectivity compared to VR.
Disjoint paths, which indicate subnetworks without shared connections, reveal some differences between the two settings. In the VR condition, the gamma band shows two disjoint paths, and the theta band exhibits one, suggesting isolated functional processes that may arise in response to immersive environments. In contrast, disjoint paths are absent in these bands under the monitor condition. Both alpha and beta bands consistently have one disjoint path across both settings, representing a single isolated subnetwork in these frequencies.
Overall, the differences between VR and Monitor settings are substantial across most metrics, particularly in the alpha and gamma bands. These findings underscore the VR setting’s production of connectivity compared to the monitor environment.
Brain network metrics of Monitor and VR settings for theta, alpha, beta, and gamma bands

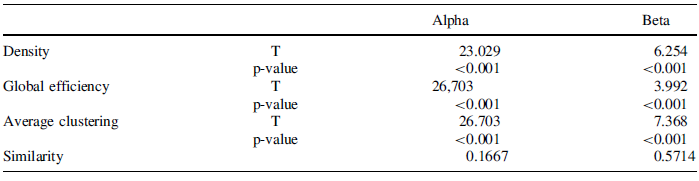
Table 3 illustrates the results of statistical analysis, confirming significant differences between the VR and monitor settings, particularly in the alpha and beta frequency bands. The gamma and theta bands were excluded due to their limited activity in the monitor condition. The overall findings reveal that the VR environment consistently induces higher values across brain network metrics.
For key metrics like density, global efficiency, and average clustering coefficients, the VR setting produces networks with higher valued metrics than the Monitor condition across all frequency bands. For example, in the alpha band, the VR condition exhibits substantially higher values for density (T = 23.029, p < 0.001), global efficiency (T = 26.703, p < 0.001), and clustering coefficient (T = 26.703, p < 0.001) compared to the monitor setting. A similar pattern emerges for the beta band, where VR consistently shows higher values, although with smaller effect sizes (e.g., density T = 6.254, p < 0.001).
Additionally, the Jaccard similarity coefficient further highlights the enhanced connectivity in the VR setting, with higher values observed for both alpha (0.1667) and beta (0.5714) bands. This reflects a greater overlap and integration of functional brain networks in the immersive VR environment.
Overall, compared to the sparse and less interconnected networks observed under the monitor setting, the VR environment fosters more neural connected engagement.
Brain network metrics comparisons between Monitor and VR settings

6. Discussion and conclusions
The findings of this study provide significant insights into how different media representations (e.g., Monitor and immersive VR) of the same design influence brain activity, specifically through neural network analyses.
6.1. Differences in neural networks by media type
In the beta band, the settings show similar activations in the occipital area, more lateralized on the right for the VR condition. This band in the occipital areas is frequently associated with the dorsal visual stream, considered the vision-to-action area, generally active in tasks requiring spatial reorganization of visual inputs (Reference Di Dona and RonconiDi Dona and Ronconi, 2023). This confirms the general engagement of participants elaborating the visual inputs as space where actions are possible.
The higher density, global efficiency, and clustering coefficient in VR suggest higher information processing and integration (Reference Rubinov and SpornsRubinov and Sporns, 2010). This indicates that immersive environments demand greater cognitive integration, consistent with findings by Reference Slobounov, Ray, Johnson, Slobounov and NewellSlobounov et al. (2015). In contrast, monitor display elicited less cognitively intense but more targeted neural patterns, aligning with their utility for detail-focused tasks.
Generally, VR networks had longer maximum path lengths and fewer isolated components, suggesting a more interconnected neural structure. In the VR setting, the higher average clustering coefficient in the alpha and gamma bands suggests functional specialization and the potential influence of immersive environments on cognitive and emotional processing (Reference RicciRicci, 2023). This can be an indicator of higher cognitive load. This could be linked to the immersive nature of VR, where participants engage more holistically with the design.
Alpha and beta band differences further illustrate the cognitive implications of media type. Increased alpha connectivity in VR reflects heightened sensory engagement, while beta activity patterns correspond to mental workload and attention allocation. The higher levels in the alpha and beta bands can be correlated with their involvement in cognitive activities related to attention, sensory processing, and executive function. These results highlight how immersive VR promotes holistic evaluations, while monitor representations streamline analytical tasks, consistent with prior studies (Reference Kakkos, Dimitrakopoulos, Gao, Zhang, Qi and MatsopoulosKakkos et al., 2019).
The no significant interaction detected in gamma and theta bands suggests that these frequencies are not involved in monitor settings, which could indicate that their role in brain activity may be affected by the monitor representation, developed on a 2D space. The exclusive presence of gamma and theta band significant correlation in the VR condition suggests that these neural oscillations may be specifically associated with immersive environments. This aligns with previous research indicating that VR, compared to traditional media, has shown increased theta and gamma activity, reflecting heightened cognitive processing and sensory integration unique to these environments (Reference Malinowska, Wojciechowski, Waligóra and RogalaMalinowska et al., 2024).
6.2. Implications for design practice
From a practical perspective, these findings underscore the importance of selecting media representations aligned with cognitive objectives. VR’s immersive nature fosters experiential engagement, enhancing holistic design evaluations, while monitor displays support efficiency in precision-driven tasks.
In classroom design, prior studies (Kim and Gero, 2025) demonstrated increased visual engagement with biomorphic ceiling designs, evidenced by longer dwell times and more saccades when tracking eye gaze. This suggests that biophilic elements in virtual classrooms are more effective at capturing attention than non-biophilic settings. Combined with the present findings on neural activation, these results provide actionable insights for incorporating biophilic elements into indoor learning spaces.
6.3. Contributions
Methodologically, this study advances design cognition research by applying graph theory to analyze brain networks. This quantitative approach moves beyond regional brain activations, providing a deeper understanding of the neural interactions underlying design cognition. These insights enrich the growing field of neuroarchitecture by linking media types to distinct cognitive processes.
6.4. Limitations and future research
Despite its contributions, this study has limitations. The small sample size and focus on male participants and the order of stimuli limit the generalizability of the findings, warranting future studies with larger, more diverse samples. Additionally, the analysis was confined to two media types; exploring augmented reality or haptic interfaces could yield further insights.
While short-term exposure to media representations allows for controlled measurement, it may not fully capture sustained cognitive effects. Temporal variations in brain activity, such as those influenced by circadian rhythms, remain unexplored. Future studies could address these gaps with longer exposure and incorporate other measures, such as fNIRS, eye-tracking, or galvanic skin response, to provide a more comprehensive understanding of design cognition.
Moreover, the study did not account for task complexity or individual differences in design expertise, factors that likely influence cognitive outcomes. Future research should investigate these dimensions to refine our understanding of the effects of media representation.
Finally, our findings imply that certain neural processes, such as gamma and theta oscillations, are uniquely triggered by immersive VR environments, highlighting the need for further investigation into how these different activations contribute to the perception and processing of design representations.
6.5. Conclusion
This study demonstrates that media representations significantly shape brain network activity, reflecting distinct cognitive and perceptual processes. By employing brain network analysis, this research deepens our understanding of neural mechanisms in design cognition and offers insights for evidence-based design practices. These findings suggest that VR can increase brain activity, particularly in the beta bands, promoting higher cognitive integration and sensory engagement.
These findings offer guidance for designing more effective VR experiences, especially in the context of architectural and design evaluations. Furthermore, the use of immersive VR in design practice can be optimized for tasks requiring holistic engagement, while monitor displays remain for precision-focused tasks. This study contributes to the growing body of evidence on design neurocognition, offering architects and designers actionable insights into representation media and methodologies that can improve cognitive outcomes.
Acknowledgements
This work was supported by Basic Science Research Program through the National Research Foundation of Korea (NRF) funded by the Ministry of Education (NRF- 2020R1I1A1A01073447). Part of this research was funded by a grant from the US National Science Foundation (NSF) to J. S. G., grant number EEC-1929896.


 Open access