


1. INTRODUCTION
Triple-frequency or multi-frequency Global Navigation Satellite Systems (GNSS) is the trend for almost all satellite systems, including the United States (US) modernised Global Positioning System (GPS), the Russian modernised Globalnaya Navigatsionnaya Sputnikovaya Sistema (GLONASS), the European Galileo system and the Chinese BeiDou System (BDS). At present, some GPS, GLONASS or Galileo satellites can already transmit real triple-frequency signals, but there are only a small number of triple-frequency or multi-frequency satellites available. In contrast, there are 14 BDS satellites in orbit, which all transmit triple-frequency signals centred at B1 (1,561·098 MHz), B2 (1,207·140 MHz) and B3 (1,268·520 MHz). Extensive research has been done in the past 15 years to exploit the benefits from triple-frequency signals (Forssell et al., Reference Forssell, Martin-Neira and Harrisz1997; Vollath et al., Reference Vollath, Birnbach, Landau, Fraile-Ordoñez and Martí-Neira1999; Hatch et al., Reference Hatch, Jung, Enge and Pervan2000; Teunissen et al., Reference Teunissen, Joosten and Tiberius2002; Richert and El-Sheimy, Reference Richert and El-Sheimy2007; Feng, Reference Feng2008; Li et al., Reference Li, Feng and Shen2010; Wang and Rothacher, Reference Wang and Rothacher2013; Tang et al., Reference Tang, Deng, Shi and Liu2014). These researches mainly focus on the utilisation of additional phase signal to speed up the integer Ambiguity Resolution (AR), especially for the Extra-Wide-Lane (EWL) or Wide-Lane (WL) ambiguities, which can be reliably fixed almost instantaneously. Although many researchers have proved that triple-frequency signals perform better than dual-frequency signals in narrow ambiguity resolution, however, instantaneous and reliable narrow ambiguity resolution is still a severe challenge for narrow-lane ambiguity resolution, especially for medium or long baselines (Li et al., Reference Li, Feng and Shen2010; Tang et al., Reference Tang, Deng, Shi and Liu2014; Zhang and He, Reference Zhang and He2015; Gao et al., Reference Gao, Gao, Pan, Wang and Wang2015).
On other hand, most GNSS users are in the navigation market for (sub) metre-level accuracy. Compared with centimetre-level accuracy, they prefer the faster (even instantaneous), more continuous and more reliable positioning or navigation service. Many researchers have studied using BDS, standalone or integrated, to obtain rapid centimetre-level positioning, even instantaneously for short baselines (Guo et al., Reference Guo, He, Li and Wang2011; Teunissen et al., Reference Teunissen, Odolinski and Odijk2014; Deng et al., Reference Deng, Tang, Liu and Shi2014; He et al., Reference He, Li, Yang, Xu, Guo and Wang2014). However, as previously mentioned, instantaneous narrow-lane AR-based positioning is still a severe challenge for medium or long baselines, either with triple-frequency or dual-frequency signals. Some researchers also studied using pseudorange, EWL or WL observations from three frequency GNSS singles for real-time kinematic positioning, and the results have shown that sub-decimetre, decimetre or sub-metre positioning is feasible (Hernandez-Pajares et al., Reference Hernández-Pajares, Zomoza, Subirana and Colombo2003; Feng and Li, Reference Feng and Li2010; Li et al., Reference Li, Shen and Zhang2013). However most of these studies used only simulated data, which tends to produce optimistic results compared to using real observations. Now that the practical use of BDS triple-frequency observations is feasible, it is important to investigate its corresponding navigation performance and its benefit to users’ decision-making. In this paper we will investigate single-epoch navigation performance using real BDS triple-frequency observations, especially the navigation performance using EWL and WL observations since the EWL and WL ambiguities can be resolved very reliably with a single epoch. Pseudorange precision and the single-epoch EWL and wide-lane WL AR are both analysed. Positioning accuracy and reliability in each single-epoch navigation model are identified.
The rest of this paper is organised as follows. Section 2 mainly introduces the basic observation equations and EWL/WL AR model for BDS. In Section 3 the noises of the three pseudoranges of BDS are analysed. Section 4 gives several single-epoch models using BDS triple-frequency observations. Then in Section 5, the experiments are carried out, which assess the single-epoch EWL/WL AR performance and positioning accuracy and reliability. Finally findings are summarised in Section 6.
2. FUNDAMENTAL EQUATIONS AND SINGLE-EPOCH EWL/WL AR MODEL
2.1. Basic Observation Equations and Definitions
Without loss of simplicity, the combined Double-Difference (DD) carrier phase and pseudorange observation equations in metres can be described as (Feng and Rizos, Reference Feng and Rizos2005; Urquhart, Reference Urquhart2009; Li et al., Reference Li, Feng and Shen2010; Tang et al., Reference Tang, Deng, Shi and Liu2014):
 $$\Delta {\phi _{(i,j,k)}} = \Delta \rho + \Delta T - {\eta _{(i,j,k)}}\Delta I + {\lambda _{(i,j,k)}}\Delta {N_{(i,j,k)}} + \Delta {\varepsilon _{{\phi _{(i,j,k)}}}}$$
 $$\Delta {P_{[\alpha, \beta, \gamma ]}} = (\alpha + \beta + \gamma ) \cdot (\Delta \rho + \Delta T) + {\eta _{[\alpha, \beta, \gamma ]}}\Delta {I_1} + \Delta {\varepsilon _{{P_{[\alpha, \beta, \gamma ]}}}}$$
Where the combined DD carrier phase Δφ (i,j,k) and pseudorange ΔP [α,β,γ] are defined
 $$\Delta {\phi _{(i,j,k)}} = \displaystyle{{i \cdot {\,f_1} \cdot \Delta {\phi _1} + j \cdot {\,f_2} \cdot \Delta {\phi _2} + k \cdot {\,f_3} \cdot \Delta {\phi _3}} \over {i \cdot {\,f_1} + j \cdot {\,f_2} + k \cdot {\,f_3}}}$$
 $$\Delta {P_{[\alpha, \beta, \gamma ]}} = \alpha \cdot \Delta {P_1} + \beta \cdot \Delta {P_2} + \gamma \cdot \Delta {P_3}$$
In Equations (1) to (4), Δ is the Double-Difference (DD, station- and satellite-difference) operator; the symbol ρ represents geometric distance from satellite to receiver; T is the tropospheric delay; I 1 is the first-order ionospheric delay on B1 carrier (‘first-order’ will be omitted for brevity of notation below); i, j, k are integer coefficients; Δφ i and ΔP i represents the DD carrier and pseudorange measurement in distance for the ith frequency of BDS; α, β, γ are arbitrary real numbers. The combined wavelength λ (i,j,k) and integer ambiguity N (i,j,k) are respectively defined as
 $${\lambda _{(i,j,k)}} = \displaystyle{c \over {i \cdot {\,f_1} + j \cdot {\,f_2} + k \cdot {\,f_3}}}$$
 $${N_{(i,j,k)}} = i \cdot {N_1} + j \cdot {N_2} + k \cdot {N_3}$$
The combined ionospheric scale factors, η (i,j,k) for carrier phase and η [α,β,γ] for pseudorange are defined respectively as
 $${\eta _{(i,j,k)}} = \displaystyle{{\,f_1^2 (i/{\,f_1} + j/{\,f_2} + k/{\,f_3})} \over {{\,f_{(i,j,k)}}}}$$
 $${\eta _{[\alpha, \beta, \gamma ]}} = \alpha + \beta \cdot \displaystyle{{\,f_1^2} \over {\,f_2^2}} + \gamma \cdot \displaystyle{{\,f_1^2} \over {\,f_3^2}} $$
It is generally acknowledged that the three carrier measurements have the same precisions, i.e. ${\sigma _{\Delta {\phi _1}}} = {\sigma _{\Delta {\phi _2}}} = {\sigma _{\Delta {\phi _3}}} = {\sigma _{\Delta \phi}} $
, so the variance of combined DD phase noise Δε
φ(i,j,k) is given as
${\sigma _{\Delta {\phi _1}}} = {\sigma _{\Delta {\phi _2}}} = {\sigma _{\Delta {\phi _3}}} = {\sigma _{\Delta \phi}} $
, so the variance of combined DD phase noise Δε
φ(i,j,k) is given as
 $${\sigma _{\Delta {\phi _{(i,j,k)}}}} = \displaystyle{{\sqrt {{{(i \cdot {\,f_1})}^2} + {{(\,j \cdot {\,f_2})}^2} + {{(k \cdot {\,f_3})}^2}}} \over {{\,f_{(i,j,k)}}}}{\sigma _{\Delta \phi}} = {\mu _{(i,j,k)}} \cdot {\sigma _{\Delta \phi}} $$
For the pseudoranges of BDS, the code chipping rate on B3 is ten times faster than those on B1 and B2, which means the noise of P3 is smaller than that of P1 and P2. Consider the differences in noise levels among P1, P2 and P3, the assumption for pseudorange noises $\Delta {\varepsilon _{{P_{[\alpha, \beta, \gamma ]}}}}$
becomes
$\Delta {\varepsilon _{{P_{[\alpha, \beta, \gamma ]}}}}$
becomes
 $${\sigma _{\Delta {P_2}}} = {q_1} \cdot {\sigma _{\Delta {P_1}}},\quad {\sigma _{\Delta {P_3}}} = {q_2} \cdot {\sigma _{\Delta {P_1}}}$$
so the variance of combined DD pseudorange noise is
 $$\sigma _{\Delta {P_{[\alpha, \beta, \gamma ]}}}^2 = \left[ {{\alpha ^2} + {{({q_1} \cdot \beta )}^2} + {{({q_2} \cdot \beta )}^2}} \right] \cdot \sigma _{\Delta {P_1}}^2 = \mu _{[\alpha, \beta, \gamma ]}^2 \cdot \sigma _{\Delta {P_1}}^2 $$
In Equation (9) and Equation (11), μ (i,j,k) and μ [α,β,γ] represent the noise scale factor of Δφ (i,j,k) and ΔP [α,β,γ] respectively.
2.2. EWL and WL AR Models for BDS
The resolution of BDS triple-frequency EWL and WL ambiguities has been verified to be easy and reliable (Tang et al., Reference Tang, Deng, Shi and Liu2014; Zhao et al., Reference Zhao, Dai, Hu, Sun, Shi and Liu2015; Li et al., Reference Li, Feng, Gao and Li2015). ΔN (0,−1,1) and ΔN (1,−1,0) are commonly recommended as the solved EWL and WL ambiguity of BDS respectively for medium baselines. The resolution models of ΔN (0,−1,1) and ΔN (1,−1,0) are directly given as Equation (12) and Equation (13), which are geometry-free and geometry-based respectively:
 $$\Delta {N_{(0, - 1,1)}} = \left[ {\displaystyle{{\Delta {\phi _{(0, - 1,1)}} - \Delta {P_{(0,1,1)}}} \over {{\lambda _{(0, - 1,1)}}}}} \right]$$
 $$\left[ {\matrix{ {{{v^{\prime}}_{{\rm EWL}(0, - 1,1)}}} \cr {{v_{{\rm WL}(1, - 1,0)}}} \cr}} \right] = \left[ {\matrix{ B & 0 \cr B & {I \cdot {\lambda _{(1, - 1,0)}}} \cr}} \right]\left[ {\matrix{ a \cr b \cr}} \right] - \left[ {\matrix{ {{{l^{\prime}}_{{\rm EWL}(0, - 1,1)}}} \cr {{l_{{\rm WL}(1, - 1,0)}}} \cr}} \right]$$
Where [·] in Equation (12) indicates the rounding operation. ΔP (0,1,1) can be derived using the same form with Equation (3). The symbol v′EWL(0,−1,1) denotes the residual vector of ambiguity-fixed DD (0, −1,1) EWL carrier observations. v WL(1,−1,0) denotes the residual vector of DD (1, −1,0) WL carrier observations. I is the identity matrix. The unknown parameters a and b are the vectors of baseline components and the DD WL ambiguities, respectively. The last terms l′EWL(0,−1,1) and l WL(1,−1,0) are the Observed Minus Computed (OMC) vectors of the corresponding observations. The WL integer ambiguities estimated in Equation (13) can be searched and determined using the LAMBDA method (Teunissen, Reference Teunissen1995). A note here is that the baselines used in the paper are medium baselines, so we allow the biased resolution caused by slight ionosphere delays since the WL observation has a long wavelength. The (1,−1,0) WL observation has much lower noise levels, so we fix the (1,−1,0) WL ambiguity with a geometry-based model to get a higher success rate. The PAF strategy will also be used to avoid the influence of ionospheric delay and guarantee the AR reliability. However, for long baselines, two EWL ambiguities are suggested (as in Li et al., Reference Li, Feng, Gao and Li2015). Once the two EWL/WL ambiguities above are solved, we can fix any EWL/WL ambiguity, for instance, we can obtain ΔN (2,−1,−1) by the equation
 $$\Delta {N_{(2, - 1, - 1)}} = 2\Delta {N_{(1, - 1,0)}} - \Delta {N_{(0, - 1,1)}}$$
2.3. Partial Ambiguity Fixing (PAF) Strategy
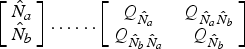
In the WL ambiguity resolution described above, the extreme low-elevation satellites may still suffer from considerable atmospheric effects, the observation noises or others. It is therefore impossible to fix all ambiguities simultaneously at times. For this problem, (see Li et al., Reference Li, Shen, Feng, Gao and Yang2014), we introduce a PAF strategy with the ambiguity subset adaptively selected based on the successively increased elevations. From the procedures described in Section 2.2, we can get the float DD WL ambiguities together with their corresponding vc-matrix. We can divide the ambiguities into two parts, of which some are assumed to be able to be reliably fixed, and others are not or may not be fixed reliably. As shown in Equation (15), we suppose that ${\hat N_a},\;{Q_{{{\hat N}_a}}}$
and
${\hat N_a},\;{Q_{{{\hat N}_a}}}$
and ${\hat N_b},\;{Q_{{{\hat N}_b}}}$
are the ambiguities and the corresponding vc-matrix of the two parts respectively
${\hat N_b},\;{Q_{{{\hat N}_b}}}$
are the ambiguities and the corresponding vc-matrix of the two parts respectively
 $$\left[ {\matrix{ {{{\hat N}_a}} \cr {{{\hat N}_b}} \cr}} \right] \ldots \ldots \left[ {\matrix{ {{Q_{{{\hat N}_a}}}} & {{Q_{{{\hat N}_a}{{\hat N}_b}}}} \cr {{Q_{{{\hat N}_b}{{\hat N}_a}}}} & {{Q_{{{\hat N}_b}}}} \cr}} \right]$$
If we can fix ${\hat N_a}$
reliably and the number of ambiguities in
${\hat N_a}$
reliably and the number of ambiguities in ${\hat N_a}$
is enough, we can use the fixed ambiguities for positioning calculation. Of course we can also use the fixed ambiguities to improve the accuracies of the remaining ambiguities and their vc-matrix (Teunissen et al., Reference Teunissen, Joosten and Tiberius1999). In this paper we just consider the former, since the low-elevation ambiguities probably suffer more from the un-modelled atmospheric biases. The important thing is how to determine the subset. Here, we obtain the subset by the following steps:
${\hat N_a}$
is enough, we can use the fixed ambiguities for positioning calculation. Of course we can also use the fixed ambiguities to improve the accuracies of the remaining ambiguities and their vc-matrix (Teunissen et al., Reference Teunissen, Joosten and Tiberius1999). In this paper we just consider the former, since the low-elevation ambiguities probably suffer more from the un-modelled atmospheric biases. The important thing is how to determine the subset. Here, we obtain the subset by the following steps:
-
Step (1): Sort the elevations of all satellites in an ascending order, and we can get a new elevation set such as Equation (16):
(16)Where e i represents the elevation at the ith order. $$E = \left\{ {{e_1},{e_2}, \cdots, {e_n} \vert {e_1} \lt {e_2} \lt \cdots \lt {e_n}} \right\}$$
-
Step (2): Set the starting elevation for ambiguity selection (e c ) at e 1, and we can obtain the subset
${\hat N_a}({e_1})$
and
${Q_{{{\hat N}_a}}}({e_1})$
. Then the LAMBDA method is applied into the ambiguity search process. If the search results meet the following three conditions, the fixed ambiguities can be considered to pass the acceptance test and be introduced into the following positioning calculation.
-
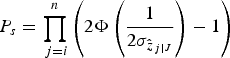
a) The bootstrapping AR success rate P s , calculated according to Equation (17) from the decorrelated vc-matrix (Teunissen, Reference Teunissen1998) is larger than the set threshold, P 0
(17)Where
$${P_s} = \prod\limits_{\,j = i}^n {\left( {2\Phi \left( {\displaystyle{1 \over {2{\sigma _{{{\hat z}_{\,j \vert J}}}}}}} \right) - 1} \right)} $$
$\Phi (x) = \;\int_{ - \infty} ^x {\displaystyle{1 \over {\sqrt {2\pi}}} \exp \left\{ { - \displaystyle{1 \over 2}{\nu ^2}} \right\}d\nu} $
and
${\sigma _{{{\hat z}_{j\vert J}}}} = (j = i, \ldots, n,\;J = \{ j + 1, \ldots, n\} )$
denote the conditional standard deviations of the decorrelated ambiguities.
-
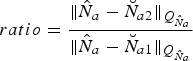
b) The ratio of the second minimum quadratic form of integer ambiguities residuals and the minimum one (Teunissen and Verhagen, Reference Teunissen and Verhagen2009; Verhagen and Teunissen, Reference Verhagen and Teunissen2013), which is shown in Equation (18), is larger than the set threshold, t 0
(18)Where
$$ratio = \displaystyle{{\Vert {{\hat N}_a} - {\breve N}_{a2} {\Vert_{{Q_{{\hat N}_a}}}}} \over {\Vert {{\hat N}_a} - {\breve N}_{a1}{\Vert_{{Q_{{\hat N}_a}}}}}}$$
${{\breve N}_{a1}}$
and
${{\breve N}_{a2}}$
are the ambiguity candidates with the minimum and second minimum quadratic form respectively;
$\Vert \cdot {\Vert _{{Q_{{{\hat N}_a}}}}} = {\left( \cdot \right)^{\rm T}}Q_{{{\hat N}_a}}^{ - 1} \left( \cdot \right)$
.
-
c) The number of ambiguities in the subset is larger than the set minimum threshold n 0. This condition is set to ensure the selected satellites are sufficient to obtain reliable positioning results, since too few satellites are adverse to the positioning stability.
-
-
Step (3): If the conditions in Step (2) cannot be met, the starting elevation for ambiguity selection will be set at e 2. Then Step (2) will be repeated. Of course if the starting elevation at e 2 is still unable to pass the acceptance test, the procedure will be continued with a larger starting elevation. But if it cannot meet the condition c) in Step (2), the circulation will be stopped and the current epoch keeps the ambiguities floating.








In the experiments later in Section 5, P 0 is set at 0·95 considering the single-epoch mode; t 0 and n 0 are set at 3·0 and 5 respectively.
3. ANALYSIS OF BDS TRIPLE-FREQUENCY PSEUDORANGE NOISE
In order to investigate the precision differences among the three pseudoranges of BDS, we adopt an Epoch-Difference (ED) method to obtain the relative levels. Assuming that the change of ionospheric delays between the adjacent two epochs can be neglected and there are no cycle slips, the ED DD pseudorange observations are expected to be approximately the same with corresponding carrier observations similar in distance, since carrier observations have much smaller noise levels:
 $${\rm Exp}(\Delta {P_{i,t + 1}} - \Delta {P_{i,t}}) \approx \Delta {\phi _{i,t + 1}} - \Delta {\phi _{i,t}}$$
Where Exp(·) represents the mathematical expectation. Considering that the carrier observations have much higher precision relative to pseudorange observations, the ED carrier observations can be treated as truth values. The pseudorange noises in ED form can be derived as
 $${\varepsilon _{\Delta {P_{i,(t,t + 1)}}}} = {\varepsilon _{\Delta {P_{i,t + 1}}}} - {\varepsilon _{\Delta {P_{i,t}}}} = \Delta {\phi _{i,t + 1}} - \Delta {\phi _{i,t}} - (\Delta {P_{i,t + 1}} - \Delta {P_{i,t}})$$
Although the absolute pseudorange noises cannot be obtained directly, we can get the equivalent pseudorange precisions by using the law of error propagation
 $$\sigma _{\Delta {P_{i,(t,t + 1)}}}^2 = \sigma _{\Delta {P_i}(t)}^2 + \sigma _{\Delta {P_i}(t + 1)}^2 - 2{\rho _{\Delta {P_i}(t),\Delta {P_i}(t + 1)}} \cdot \sigma _{\Delta {P_i}(t)}^2 \sigma _{\Delta {P_i}(t + 1)}^2 $$
Where ρ
ΔP
i
(t), ΔP
i
(t + 1)
represents the time correlation of observations between two adjacent epochs. In Equation (21·1), we can assume ${\sigma _{\Delta {P_i}(t)}} = {\sigma _{\Delta {P_i}(t + 1)}} = {\sigma _{\Delta {P_i}}}$
, and when ignoring the time correlation, Equation (21·1) can be simplified as Equation (21·2)
${\sigma _{\Delta {P_i}(t)}} = {\sigma _{\Delta {P_i}(t + 1)}} = {\sigma _{\Delta {P_i}}}$
, and when ignoring the time correlation, Equation (21·1) can be simplified as Equation (21·2)
 $${\sigma _{\Delta {P_{i,(t,t + 1)}}}} = \sqrt 2 {\sigma _{\Delta {P_i}}}$$
In fact, the time correlation in Equation (21·1) of observations will have no influence on the calculation of ratios among the three pseudorange precisions which can be derived according to Equation (21·2). We calculate the actual results using a real baseline data with 51·9 km length, which contains BDS triple-frequency pseudorange and carrier observations. Figure 1 gives the ED pseudorange noises in the three frequencies from two BDS satellites, C02 and C14, as examples. We can see there exist obvious differences among the three pseudorange precisions. P3 has the highest precision, followed by P2, and P1 has the lowest precision. The Root Mean Square (RMS) values of all visible satellites in the period are calculated and shown in Figure 2, and the precision ratios between P2 and P1, P3 and P1 are shown in Figure 3. From Figures 2 and 3, we can see that although any two satellites have different RMS, there are still similar ratios between P2 and P1, or between P3 and P1 of all satellites. The mean values are 0·595 and 0·280 respectively, so the values q 1 and q 2 described in Section 2.1 will be assigned with these two values.
ED DD pseudorange noises of two BDS satellites.

RMS of ED DD pseudorange noises of each satellite.

Ratios of pseudorange noises between P2 and P1, and between P3 and P1.

4. POSITIONING MODELS USING BDS TRIPLE-FREQUENCY OBSERVATIONS
Using triple-frequency observations, we have more choices for single-epoch navigation. Besides the pseudorange observations, the ambiguity-fixed EWL and WL observations are also treated the same as pseudorange observations. According to whether the ionospheric effect is eliminated, we can divide these methods into two categories. One is the ionosphere-fixed model, which ignores the ionospheric effect and generally has smaller observation noise levels. The other is the ionosphere-float model, which eliminated the ionospheric effect by using the so-called ionosphere-free observations.
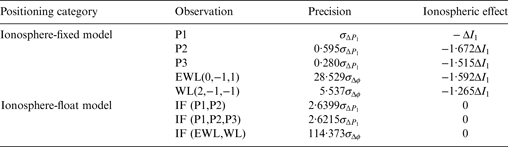
Category 1: Ionosphere-fixed model. The three pseudoranges can be used for positioning with a single-frequency model. The (0,−1,1) ambiguity can be resolved instantaneously and very reliably and then the ambiguity-fixed EWL observation Δφ (0,−1,1) can also be used directly in positioning, with a ionospheric scale factor at −1·5915, which is close to that in P3. However Δφ (0,−1,1) has higher precision compared with any pseudorange. This is the significant advantage in the triple-frequency case. As described in Section 2.2, the ambiguity-fixed Δφ (0,−1,1) can also be used to assist the resolution of (1,−1, 0) WL ambiguity. The single-epoch (1,−1,0) WL AR may not be as reliable as the (0,−1,1) EWL AR, but once it passes the reliability test (e.g. the ratio test), we may get more precise observations. As stated before, when the two EWL/WL ambiguities above are solved, any EWL/WL ambiguity can be derived. Thus it needs to search for the optimal EWL or WL observation for better positioning. By setting the range [−20, 20] for the combination coefficients i, j, k, we get the series of ionospheric scale factor η (i,j,k) and noise scale factor μ (i,j,k) from all WL or EWL combinations, as are shown in Figure 4. We need to balance the ionospheric effects and the observation noises. However it is hard to make a decision as the ionospheric effects can hardly be foreseen. In this study, considering that the medium baseline is used, we prefer to consider the observation noises more. Δφ (2,−1,1) is chosen here, related information of which can be seen in Table 1.
 $$(i,j,k \in [ - 20,20],\;i + j + k = 0)$$
Ionospheric and noise scale factors from all WL or EWL combinations.

Observation and corresponding noise, ionospheric effect in each positioning model.
Category 2: Ionosphere-float model. In the dual-frequency case, the ionosphere-free pseudorange can be combined to eliminate the ionospheric effect. In the triple-frequency case, the three pseudoranges can be combined together to obtain the optimal ionosphere-free pseudorange. This can be determined by the following equations (Gao et al., Reference Gao, Gao, Pan, Wang and Deng2015; Zhao et al., Reference Zhao, Dai, Hu, Sun, Shi and Liu2015):
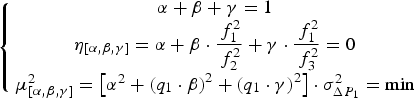 $$\left\{ {\matrix{ {\alpha + \beta + \gamma = 1} \cr {{\eta _{[\alpha, \beta, \gamma ]}} = \alpha + \beta \cdot \displaystyle{{\,f_1^2} \over {\,f_2^2}} + \gamma \cdot \displaystyle{{\,f_1^2} \over {\,f_3^2}} = 0} \cr {\mu _{[\alpha, \beta, \gamma ]}^2 = \left[ {{\alpha ^2} + {{({q_1} \cdot \beta )}^2} + {{({q_1} \cdot \gamma )}^2}} \right] \cdot \sigma _{\Delta {P_1}}^2 = \min} \cr}} \right.$$
From Equation (22), we can obtain the coefficients α, β and γ by using the minimum-norm method to realise the minimum noise of the combined pseudorange. When we adopt q
1 = 0·595 and q
2 = 0·280, α, β and γ can be calculated as 2·3622, −1·8942 and 0·5320 respectively. Then the noise becomes 2·6215 ${\sigma _{\Delta {P_1}}}$
, which is slightly superior to that in the dual-frequency case (seen in Table 1).
${\sigma _{\Delta {P_1}}}$
, which is slightly superior to that in the dual-frequency case (seen in Table 1).
Besides the pseudorange, if the WL ambiguities can be solved successfully, we can also use the ambiguity-fixed EWL and WL observations to combine the ionosphere-free carrier observation
 $$\eqalign{&\Delta {\phi _{IF}} = {{\left( {\displaystyle{{\Delta {\phi _{(1, - 1,0)}} - {\lambda _{(1, - 1,0)}}\Delta {N_{(1, - 1,0)}}} \over {{\eta _{(1, - 1,0)}}}} - \displaystyle{{\Delta {\phi _{(0, - 1,1)}} - {\lambda _{(0, - 1,1)}}\Delta {N_{(0, - 1,1)}}} \over {{\eta _{(0, - 1,1)}}}}} \right)} }\cr & \qquad / {\left( {\displaystyle{1 \over {{\eta _{(0, - 1,1)}}}} - \displaystyle{1 \over {{\eta _{(1, - 1,0)}}}}} \right)}}$$
Then according to Equation (23), we can calculate the noise of the combined ionosphere-free carrier observation using Equation (24), and the precision can also be derived by using the law of error propagation, as Equation (25):
 $${\varepsilon _{\Delta {\phi _{IF}}}} = \displaystyle{1 \over {{\,f_1} - {\,f_3}}} \cdot \left[ {\displaystyle{{\,f_1^2} \over {{\,f_1} - {\,f_2}}}{\varepsilon _{\Delta {\phi _1}}} - \left( {\displaystyle{{{\,f_1}{\,f_2}} \over {{\,f_1} - {\,f_2}}} - \displaystyle{{{\,f_2}{\,f_3}} \over {{\,f_3} - {\,f_2}}}} \right){\varepsilon _{\Delta {\phi _2}}} - \displaystyle{{\,f_3^2} \over {{\,f_3} - {\,f_2}}}{\varepsilon _{\Delta {\phi _3}}}} \right]$$
 $${\sigma _{\Delta {\phi _{IF}}}} = \displaystyle{1 \over {{\,f_1} - {\,f_3}}} \cdot \sqrt {{{\left( {\displaystyle{{\,f_1^2} \over {{\,f_1} - {\,f_2}}}} \right)}^2} + {{\left( {\displaystyle{{{\,f_1}{\,f_2}} \over {{\,f_1} - {\,f_2}}} - \displaystyle{{{\,f_2}{\,f_3}} \over {{\,f_3} - {\,f_2}}}} \right)}^2} + {{\left( {\displaystyle{{\,f_3^2} \over {{\,f_3} - {\,f_2}}}} \right)}^2}} \cdot {\sigma _{\Delta \phi}} $$
The noise scale factor of Δφ IF is 114·373 (seen in Table 1). One thing to note here is that the combinations using any two EWL/WL observations will lead to the same precision (Li et al., Reference Li, Shen and Zhang2009; Feng and Li, Reference Feng and Li2010). The noises are further amplified, so the positioning using this observation suffers more from noise compared with the EWL and WL observations. However the remarkable advantage is that the ionospheric delay can be eliminated.
Table 1 summarises the positioning models with the various observations mentioned above. The effects of observation noises using the results in Figure 3 and ionospheric delays are also listed. The positioning performance using each kind of observation will be tested in detail in Section 5.
5. EXPERIMENTS AND ANALYSIS
In this section, we demonstrate navigation performance using BDS triple-frequency observations. The triple-frequency BDS data includes a 51·9 km baseline with 5 s sampling interval and a 45·1 km baseline with 15 s sampling interval. The two baseline data lasted for about 11·1 h and 24 h respectively, and were all collected using the receivers produced by Shanghai Compass Navigation Co. Ltd. All the computations are implemented in single-epoch mode. For the 51·9 km baseline we will analyse the navigation performance with each model in Table 1 in detail. While for the 45·1 km baseline, we will directly give the statistical results of positioning since the two baselines have similar performance.
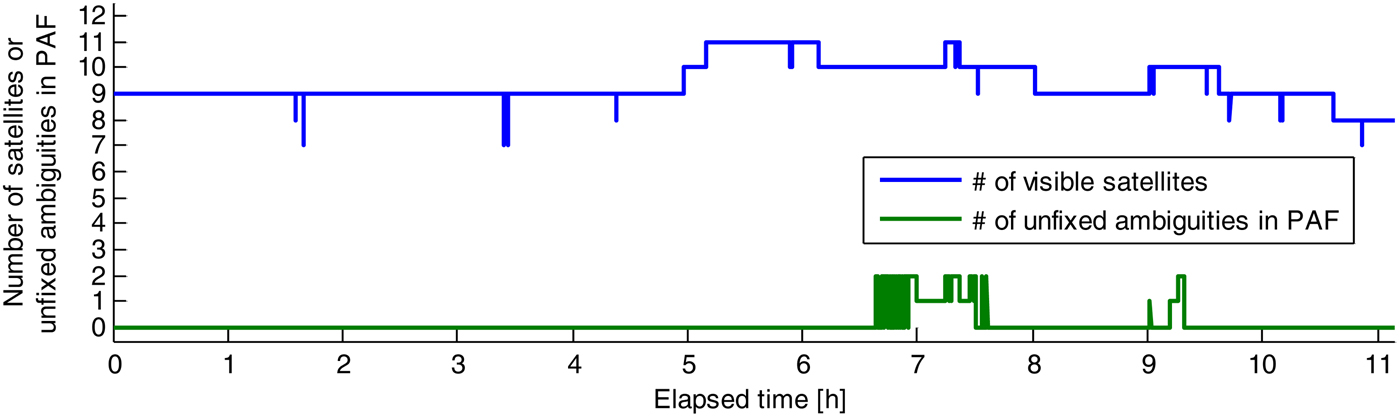
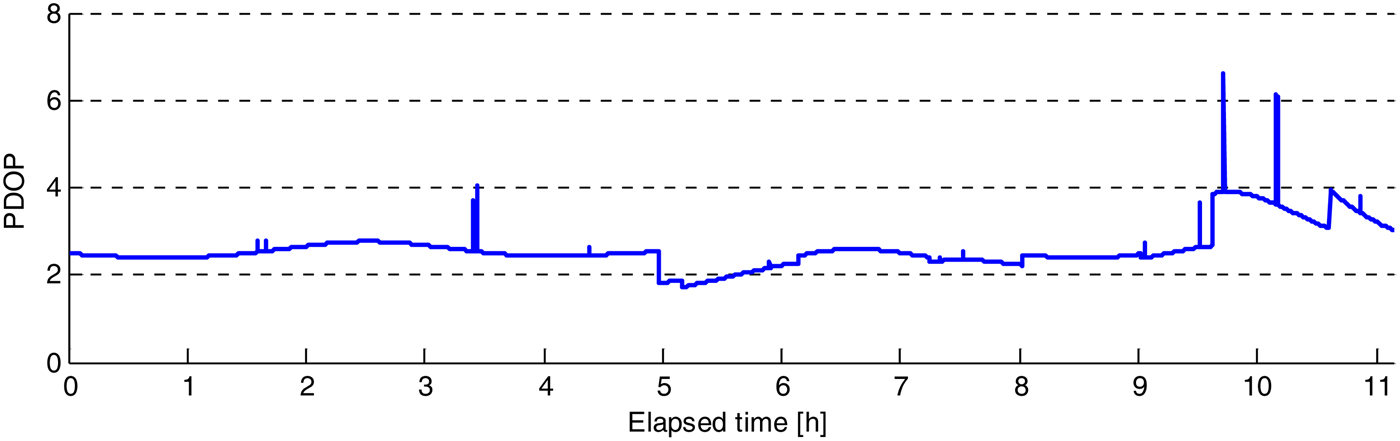
Firstly we investigate the results of the 51·9 km baseline. Figure 5 shows the number of visible satellites in the period and the number of unfixed ambiguities in PAF. We can see that for most of the time, there are still over seven satellites that can be used, even though 1–2 ambiguities cannot be fixed in PAF for some epochs. Figure 6 shows the Position Dilution Of Precision (PDOP) during the period. As we can see for most of the time, the PDOPs are between 2 and 4. The current BDS satellites mainly consist of GEO and IGSO satellites, so in China most visible satellites are in the southern part on the skyplot. As more MEO satellites are launched, the satellite geometry will no doubt become better.
Number of visible satellites and the number of unfixed ambiguities in PAF.
PDOP over the period.
We first investigate the single-epoch EWL and WL AR performance. Figure 7 shows the biases of single-epoch (0,−1,1) EWL AR. We can see all the biases are within ±0·4 cycle with the RMS of 0·0648 cycle. Over 99·97% of the biases are in the ±0·3 cycle region, so we can reliably resolve the (0,−1,1) ambiguities instantaneously. Also the (0,−1,1) EWL AR is baseline-length independent, since it has eliminated the tropospheric error, ionospheric error and orbital errors, etc. Figure 8 gives the ratios of WL AR both in FAF and PAF mode. For most of the time, we can directly get ratios larger than 3·0. However at some times, the ratios in PAF cannot reach the threshold, so we cannot decide whether the ambiguities are correct or not. This is mainly caused by low-elevation satellites, which suffer severely from atmospheric errors and high noise levels. After the PAF strategy is used, we can get the ideal ratios, since the ambiguity subset which can be fixed reliably is adaptively selected.
Results of (0,−1,1) EWL AR.

Ratios of (1,−1,0) WL AR.

In the positioning aspect, we investigate the positioning performances using all the observations in Table 1. Figure 9 shows the horizontal and vertical positioning results using P1, P2 and P3 with the single-frequency mode. We can see, corresponding to the observation precisions, that the positioning results using the three pseudorange observations have obvious differences. The results using P3 have the smallest errors, followed by that using P2, and results using P1 have the largest errors. The statistics of the positioning results are listed in Table 2. It can be seen that for medium baselines, using single-frequency pseudorange observations, we can get sub-metre navigation performance in general (except in the up direction using P1).
Positioning errors using P1, P2 and P3 with the single-frequency mode. (a) to (c) represent the scatter-plots of horizontal positioning errors using P1, P2 and P3 respectively. (d) to (f) represent the corresponding vertical positioning errors.

Positioning results using each kind of observation of 51·9 km baseline.
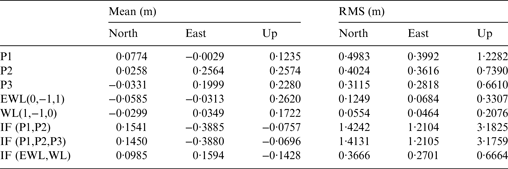
Figure 10 shows the horizontal and vertical positioning results using (0,−1,1) EWL and (2,−1,−1) WL carrier observations. In these two models, the positioning results are much more concentrated when compared with those in pseudorange observations, since the observation noises are observably smaller. The ionospheric effects still exist, so we can see obvious biases in positioning results, especially in the vertical direction. From Table 2 we can see that decimetre and sub-decimetre horizontal positioning results can be obtained using (0,−1,1) EWL and (2,−1,−1) WL carrier observations respectively. In the vertical direction, decimetre-positioning performance can be obtained using both observations.
Positioning errors using EWL and WL observations. (a) and (b) respectively represent the scatter-plots of horizontal positioning errors using EWL and WL observations. (c) and (d) represent the corresponding vertical positioning errors.

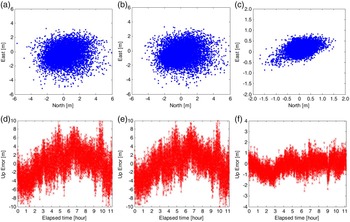
For long baselines, the ionospheric effects cannot be neglected. Figure 11 shows the performance of using the three kinds of ionosphere-free observations. From Table 1, we know that the noises in IF (P1,P2) and IF (P1,P2,P3) have no apparent differences, so the positioning accuracies are similar. Also, the combination coefficient on P3 is just 0·5320, which is much smaller than that on P1 or P2, so the differences between the positioning errors using the two observations seems indistinct. As the observation noises of the two ionosphere-free pseudorange observation are amplified over 2·6 times, the influences of observation noises are much more serious compared with the single-frequency cases. As we can see from Table 2, the positioning accuracies in the three directions (north, east and up) are all worse than 1 m. So, although the ionospheric effects are eliminated, the ionosphere-free pseudorange observations are still not adoptable for single-epoch sub-metre navigation. Figure 11(c) and (f) gives the positioning errors using the ionosphere-free carrier observations combined by ambiguity-fixed EWL and WL observations. We can see the positioning accuracies improve significantly when compared with using ionosphere-free pseudorange observations, to 0·3666 m, 0·2701 m and 0·6664 m in the three directions respectively. Although the noises are also amplified compared with (0,−1,1) EWL or (2,−1,−1) WL observations, decimetre to sub-metre navigation demand can still be satisfied. So it should be an ideal approach for the long-baseline cases, but one thing to note is that some seconds may be needed to obtain reliable WL ambiguities.
Positioning errors using the three ionosphere-free observations. (a) to (c) represent the scatter-plots of horizontal positioning errors using IF (P1,P2), IF (P1,P2,P3) and IF (EWL,WL) respectively. (d) to (f) represent the corresponding vertical positioning errors.
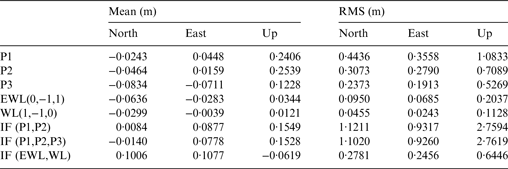
To be more convincing, the statistical results calculated from the 45·1 km baseline are also shown, as in Table 3. We can see the performance is consistent with that of the 51·9 km baseline in general, so it is not further analysed in this paper.
Positioning results using EWL/WL observations of 45·1 km baseline.
6. CONCLUSIONS
In this paper we have investigated single-epoch navigation performance using real BDS triple-frequency pseudorange and EWL/WL observations. Several single-epoch navigation models are described and the corresponding positioning precision and reliability are assessed. Based on the experimental results, we can conclude that P3 has the highest precision among the three pseudoranges of BDS, followed by P2 and P1 in order. For the medium baselines tested in the paper, when using the three pseudorange observations in single-frequency mode, sub-metre single-epoch navigation performances are obtained in general (except in the up direction using P1). We can also conclude that the (0,−1,1) EWL ambiguities can be reliably resolved instantaneously. So the ambiguity-fixed (0,−1,1) EWL observations can be directly used in position calculation. Single-epoch decimetre navigation performance is possible. Also, assisted by the ambiguity-fixed (0,−1,1) EWL observations and the PAF strategy, the WL ambiguities can also be resolved successfully within a single epoch for medium baselines. Using the optimal EWL/WL observations by balancing the ionospheric effects and noises, we can get better positioning results, even down to sub-decimetre in the horizontal direction.
The ionosphere-free pseudorange observations are very noisy, even for the optimal combination, so they are not adoptable for single-epoch sub-metre navigation. Although the noise of ionosphere-free carrier observations combined with ambiguity-fixed EWL and WL observations are also greatly amplified compared with (0,−1,1) EWL or (2,−1,−1) WL observations, decimetre to sub-metre navigation demand can still be satisfied. So it should be an ideal approach for long-baseline cases, but one thing to note is that several seconds may be needed to obtain the second reliable WL or EWL ambiguities.
Finally, we would point out that some numerical results in this paper are computed from the data used in the experiments, and there may be some differences from some other cases (e.g. for different receivers or different observation conditions). However, the general conclusions should be consistent.
ACKNOWLEDGEMENTS
The authors thank the anonymous reviewers for their valuable comments on the manuscript. This work was supported by the National Natural Science Foundation of China (Grant No. 41574026) and the Fundamental Research Funds for the Central Universities of China (Grant No. CXLX13_108).



