


Introduction
Growth is a key outcome for democratic capitalism as it increases its stability and governability. Furthermore, growth improves the politicians’ chances of re‐election (Bellucci & Lewis‐Beck, Reference Bellucci and Lewis‐Beck2011; Lewis‐Beck & Stegmaier, Reference Lewis‐Beck and Stegmaier2013). A new theoretical framework in the comparative political economy thus puts growth at the centre of analysis (Baccaro & Pontusson, Reference Baccaro and Pontusson2016; Baccaro et al., Reference Baccaro, Blyth and Pontusson2022; Hassel & Palier, Reference Hassel and Palier2021).
Drawing on post‐Keynesian macroeconomics (e.g., Bhaduri & Marglin, Reference Bhaduri and Marglin1990, Lavoie & Stockhammer, Reference Lavoie and Stockhammer2013; Stockhammer, Reference Stockhammer2015), the growth model approach identifies different modalities of economic growth across countries (Baccaro & Pontusson, Reference Baccaro and Pontusson2016). While wage‐led growth was predominant in the post‐war period (Onaran & Galanis, Reference Onaran and Galanis2014), a global shift in the balance of power between labour and capital later undermined this model (Blyth & Matthijs, Reference Blyth and Matthijs2017; Glyn, Reference Glyn2006; Lavoie & Stockhammer, Reference Lavoie and Stockhammer2013). Faced with a tendency towards economic stagnation (Storm, Reference Storm2017; Summers, Reference Summers2014), countries relied on alternative growth drivers, with growth being primarily pulled by exports in some cases; in others, by credit (Baccaro et al., Reference Baccaro, Blyth and Pontusson2022; Hassel & Palier, Reference Hassel and Palier2021; Stockhammer, Reference Stockhammer2015).
What factors determine the extent of political support for growth strategies? While the literature on the economic functioning of growth models is growing quickly, research on their politics is in its infancy. This implies that we know little about the political foundations of growth strategies. In particular, we lack information on: (1) whether citizens have coherent preferences for growth strategies; (2) the extent to which these preferences are determined by class positions and economic sectors of employment as emphasized by various strands of comparative political economy research (Baccaro et al., Reference Baccaro, Blyth and Pontusson2022; Beramendi et al., Reference Beramendi, Häusermann, Kitschelt and Kriesi2015); and (3) what growth strategies citizens want their government to pursue.
Addressing these questions is important for various reasons. The defining feature of democratic legitimacy is that government policy tracks the will of the people (Pitkin, Reference Pitkin1967). Yet, we are unable to assess whether this is the case for growth strategies because we do not know what people want in this crucial domain. Political contestation around growth strategies can be expected to be structured by class and sector, but again, we do not know which role, if any, these factors play.
In this paper, we thus break new ground by studying preferences towards growth strategies for the first time. To answer the above three questions, we conducted a new survey in four European countries that capture diversity in growth models (Germany, Italy, Sweden and the United Kingdom). Given that existing cross‐national surveys (e.g., the European Social Survey, the Eurobarometer) do not include questions about growth strategies, we explicitly designed the survey around them. In particular, we presented respondents with stylized descriptions of wage‐led growth, profit‐led growth, export‐led growth and credit‐led growth and we asked them which strategy the government should pursue.
We find that preferences for growth strategies are consistent with preferences for other policies that are linked to them, such as preferences for unions’ role in wage determination, full employment, government deficits and trade imbalances. However, respondents do not clearly distinguish between profit‐led, export‐led and credit‐led growth. As a result, the clearest axis of differentiation is between wage‐led growth, on the one hand, and alternative growth strategies, on the other hand. Preferences for growth strategies mostly reflect the traditional capital‐labour conflict, with employers, self‐employed and small business owners more likely to favour profit‐led growth. The sector of employment also influences preferences, with manufacturing workers being more inclined to select export‐led growth.
Despite these differences, a majority of respondents across countries and class segments favour wage‐led growth. A partial exception is retired individuals, who are considerably more likely to oppose wage‐led growth and to express a preference for a deflationary growth regime like export‐led growth (Vlandas, Reference Vlandas2018). Still, it is only among people in the highest income decile who are self‐employed or report income from investments that support wage‐led growth becomes a minority position. For all other groups, a majority would like the government to pursue wage‐led growth, and even though this strategy is no longer being pursued by governments (Hein, Reference Hein2012; Lavoie & Stockhammer, Reference Lavoie and Stockhammer2013; Palley, Reference Palley2012), they also believe that such a strategy would be effective at generating growth. This dovetails with literature on redistribution, the welfare state, taxation of the rich or the minimum wage, which also show large majorities having preferences that do not translate into actual policy (Cova, Reference Cova2022; Dimick et al., Reference Dimick, Rueda and Stegmueller2018; Schechtl & Tisch, Reference Schechtl and Daria Tisch2024).
The paper makes several contributions. First, it contributes to a growing literature in comparative political economy exploring preferences for macroeconomic policies (e.g., Barnes & Hicks, Reference Barnes and Hicks2018; Bremer, Reference Bremer2023; Ferrara et al., Reference Ferrara, Haas, Peterson and Sattler2022; Haffert et al., Reference Haffert, Redeker and Rommel2021). Yet, it addresses an important blind spot in this literature by examining the overall macroeconomic strategy of countries (as opposed to individual policies) and by focusing on growth. Both topics have been under‐researched in recent decades after they had been at the core of debates in political science in the twentieth century (Hibbs, Reference Hibbs1977; Hicks, Reference Hicks1988; Lange & Garrett, Reference Lange and Garrett1985).
Second, this allows us to contribute to research on the politics of growth models, which has hypothesized that voters’ preferences are relevant for growth strategies in some circumstances but has not yet examined them empirically. This stands in contrast to a large literature on preferences for redistribution and social policies. Our results show that many of the central variables identified by this latter literature are also important for the study of growth models, as they correlate with preferences for different growth strategies. However, the pattern of results suggests that the overall link between growth strategies and citizen preferences is weak. Citizens clearly support wage‐led growth even though this growth model is in deep crisis everywhere, as attested by declining labour power, stagnant real wages and rising inequality. Our findings thus hint at another example of a ‘representation gap’ or ‘unequal representation’ (Bartels, Reference Bartels2008; Elsässer et al., Reference Elsässer, Hense and Schäfer2021; Gilens, Reference Gilens2012; Gilens & Page, Reference Gilens and Page2014; Page et al., Reference Page, Bartels and Seawright2013; Schakel, Reference Schakel2021).
Finally, and due to these findings, our paper suggests that electoral politics may be less important for explaining the politics of growth models than it is for other policy areas (Beramendi et al., Reference Beramendi, Häusermann, Kitschelt and Kriesi2015). There is little evidence that electoral majorities explain cross‐country variation in the dominant growth models. This conclusion lends support to approaches that emphasize producer groups and economic elites when studying the politics of growth models.
The diversity of growth strategies
In the past 20 years, comparative political economy has tried to explain capitalist diversity by focusing on the supply side of the economy. Varieties of capitalism (VoC), which has been the dominant perspective since the beginning of the twentieth century, focuses on the way industrial relations institutions, welfare states, vocational training systems and corporate governance arrangements affect the competitive strategies of key firms (Hall & Soskice, Reference Hall and Soskice2001). This emphasis on capitalist diversity is an important corrective to mainstream economic analysis, but it largely neglects the demand side of the economy.
The growth model literature shifts the focus of analysis. Drawing on post‐Keynesian economics (Lavoie & Stockhammer, Reference Lavoie and Stockhammer2013; Palley, Reference Palley2012; Stockhammer, Reference Stockhammer2022) and the French Régulation School (Aglietta, Reference Aglietta1979; Boyer & Saillard, Reference Boyer and Saillard2002), it conceives growth as being primarily determined by aggregate demand, not just in the short‐run, as argued by New Keynesian macroeconomics (Carlin & Soskice, Reference Carlin and Soskice2015) but also in the long‐run. Furthermore, post‐Keynesian economics maintains that aggregate supply is at least partly endogenous to demand conditions (Storm & Naastepad, Reference Storm and Naastepad2012). Differently from VoC, which concentrates on interlocking institutions generating different production regimes (coordinated vs. liberal market economies), post‐Keynesian economics directs its attention to the structural parameters of aggregate demand (e.g., propensity to consume, sensitivity of investment to demand and profitability, price sensitivity of exports and imports), which determine a country's growth model.Footnote 1
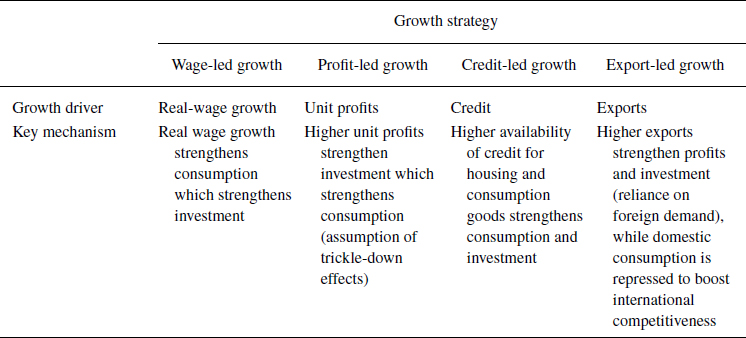
Actual growth results from the interaction between a country's underlying growth model and the growth strategies that governments pursue (Hein et al., Reference Hein, Meloni and Tridico2021; Kohler & Stockhammer, Reference Kohler and Stockhammer2022). Thus, in a wage‐led growth model, a distributional shift to the benefit of wages expands consumption and simultaneously leads to an increase in capacity utilization, to which firms respond by expanding investment and potential output. The stimulation of investment also has a positive impact on productivity since new capital incorporates the latest generation of technical progress and labour productivity benefits from economies of scale.
When the government's wage‐oriented growth strategy is consistent with the underlying wage‐led growth model, the economy will grow, at least until problems emerge, both endogenously and exogenously. A wage‐led growth strategy aims to boost real wage growth in line with and possibly slightly above productivity growth. The policy levers can be multiple, for example, the reinforcement of wage bargaining and labour market institutions, a minimum wage raise and more generous public sector pay determination that reverberates across the economy. Furthermore, labour strength and protective labour institutions create incentives for firms to use labour more efficiently and to increase capital intensity, which positively affects labour productivity (Storm & Naastepad, Reference Storm and Naastepad2012).
However, a wage‐led growth strategy has two endogenous sources of instability, which became especially salient in the 1970s and 1980s. First, the wage push may lead to inflation, especially when it is combined with an exogenous rise in oil or energy prices (Armstrong et al., Reference Armstrong, Glyn and Harrison1991). Second, it produces a ‘profit squeeze’, which may negatively affect investments and bring about a political and regulatory backlash (Glyn, Reference Glyn2006; Kalecki, Reference Kalecki1943; Marglin & Schor, Reference Marglin and Schor1990).
A very different growth strategy centres on the stimulation of unit profits (Bhaduri & Marglin, Reference Bhaduri and Marglin1990). This is brought about by policies that reduce labour power, for example, through de‐unionization and labour market liberalization. A profit‐led growth strategy has a positive impact on growth if the underlying demand regime is profit‐led too. This happens if investments are highly sensitive to unit profits and consumption propensities vary little across income groups, such that an increase in the profit share does not depress consumption very much. Developments in the past 40 years have brought about more favourable conditions for profit‐led growth everywhere (Blyth & Matthijs, Reference Blyth and Matthijs2017). For example, the shareholder value revolution has augmented the profit sensitivity of investment (Hein, Reference Hein2012), and international capital mobility has increased the benchmark rate of return on investment. In a finance‐led variant, household consumption also becomes highly sensitive to the wealth effect of increasing asset prices, which depend positively on profits (Boyer, Reference Boyer2000). In these circumstances, a profit‐led strategy sets in motion a process of trickle‐down growth, stimulating investment and employment, and possibly consumption, too.
However, profit‐led growth may run into the Marxian problem of overaccumulation and underconsumption (Marx, Reference Marx1885/1996; Bleaney, Reference Bleaney1976) and give rise to highly unstable and unequal patterns of growth. An alternative growth strategy relies on facilitating access to debt in order to generate credit‐led growth through the stimulation of consumption and investment (in housing) (Crouch, Reference Crouch2009; Mian & Sufi, Reference Mian and Sufi2011; Rajan, Reference Rajan2010). Like the wage‐led strategy, this growth strategy emphasizes domestic demand. However, wages are no longer the key growth driver, but (at best) an outcome of favourable labour market conditions when domestic demand is thriving (Baccaro & Pontusson, Reference Baccaro and Pontusson2016). Asset bubbles and growing household indebtedness characterize this type of growth, contributing to its inherent instability. Furthermore, for the growth model to be sustainable beyond the short run, ‘monetary power’ is necessary to relax the current account constraint and ensure a steady influx of foreign capital to finance current account deficits (Schwartz, Reference Schwartz2009).
Finally, growth may be brought about by policies that stimulate export‐led growth. In countries with a large export sector and non‐trivially price‐sensitive exports, policies and institutions that repress wages and domestic consumption, have an expansionary effect on total demand (Höpner, Reference Höpner2019). However, this growth model can only exist as an exception. If all countries try to boost exports by restraining domestic consumption, a fallacy of composition leads to generalized stagnation.
Table 1 summarizes the different growth strategies discussed above, their growth drivers and the key mechanisms through which growth is stimulated.
Overview of growth strategies

Why study preferences for growth strategies?
This paper studies preferences for growth strategies for the first time. Before proceeding further, however, we need to discuss why this investigation is worthwhile. Macroeconomic policies and growth strategies are highly technical issues on which citizens may not have well‐defined preferences.Footnote 2 Even if they do, these preferences may not matter practically because in many countries the formulation of the most important macroeconomic policies, the planks of growth strategies, is not at the disposal of democratic majorities, having been devolved to technocratic institutions and international organizations.
According to the influential volume by Beramendi et al. (Reference Beramendi, Häusermann, Kitschelt and Kriesi2015), voter preferences are of paramount importance for understanding public policy. These authors posit that voter choice in competitive elections is the primary mechanism for policy selection, which results from the interaction between political demand (the preferences of voters) and political supply (party programmes). This is also shaped by preferences because parties have clear and powerful incentives to minimize the distance from their electorate. In contrast to a Downsian (Downs, Reference Downs1957) median voter perspective; however, in this framework, parties have programmatic commitments that prevent them from fully adjusting their political supply to shifts in the position of the median voter (Hooghe & Marks, Reference Hooghe and Marks2018). Ultimately, the type of policies implemented by governments in different countries depends on the configuration and size of the electoral groups supporting them.
Despite these premises, the volume by Beramendi et al. (Reference Beramendi, Häusermann, Kitschelt and Kriesi2015) neglects macroeconomic and growth policies entirely. They argue that these policies are not in the ‘feasibility set’ of governments, particularly in the Eurozone (Beramendi et al., Reference Beramendi, Häusermann, Kitschelt and Kriesi2015, ft. 23, p. 64) and that there is a ‘limitation of the policy space’. Yet, this limitation is not a fact of nature but a political outcome that needs to be explained.
A research tradition associated primarily with Mair (Reference Mair2010) and Streeck (Reference Streeck2014) sees this limitation of the policy space as part and parcel of a process of hollowing out substantive democracy and of a trend towards restricting the scope of democratic decisions.Footnote 3 In particular, macroeconomic policies are excluded from the remit of democratic assemblies and entrusted to non‐majoritarian institutions. Another literature underlines the distributive impact of delegating macroeconomic policy to technocratic institutions or strict rules. The actions of central banks have distributive consequences. For example, an independent central bank may pre‐empt any attempt of workers and unions to improve their distributional outcomes by hiking interest rates (Carlin & Soskice, Reference Carlin and Soskice2015). This makes it more difficult to implement a wage‐led growth strategy. Furthermore, the implementation of monetary policy disproportionately benefits specific groups while disadvantaging others. For example, the introduction of quantitative easing programmes by independent central banks is not a purely technical solution to the problem of deflation but has contributed to increasing inequality by favouring the class segments who own financial assets, that is, the rich (Fontan et al., Reference Fontan, Claveau and Dietsch2016). Moreover, fiscal austerity implemented to meet fiscal rules in the wake of the global financial crisis, often in the form of cuts in social transfers and public services, has had clear negative distributive effects on middle‐ and working‐class people (Bulfone & Tassinari, Reference Bulfone and Tassinari2021; Hopkin, Reference Hopkin2020; Perez & Matsaganis, Reference Perez and Matsaganis2018). In brief, the ‘limitation of the policy space’ serves some interests to the detriment of others, which dovetails with recent literature on unequal democracy.
This literature maintains that policies do not reflect the preferences of the majority of the voting population, but rather the preferences of a selected elite (Bartels, Reference Bartels2008; Gilens, Reference Gilens2012; Gilens & Page, Reference Gilens and Page2014; Hacker & Pierson, Reference Hacker and Pierson2010; Page et al., Reference Page, Bartels and Seawright2013). Originally stemming from the United States, research shows that the most affluent individuals in society hold very distinct preferences from the rest of the population. Not only are preferences different, but there is also a difference in political influence. Parliamentary votes are found to be most in line with the preferences of individuals with high incomes (Bartels, Reference Bartels2008) and the preferences of low and average incomes are hardly reflected in actual policy choices (Gilens, Reference Gilens2012; Gilens & Page, Reference Gilens and Page2014). Recent contributions show that this pattern of unequal representation also applies to Western democracies more generally and that it is reflected not only in unequal representation by income but also by education and occupational class (Elsässer et al., Reference Elsässer, Hense and Schäfer2021; Persson, Reference Persson2021; Peters & Ensink, Reference Peters and Ensink2015; Schakel, Reference Schakel2021; Schakel et al., Reference Schakel, Burgoon and Hakhverdian2020). This leads to ‘representation gaps, that is, a systematic mismatch between the preferences of the majority of voters and the policies that governments implement.
An emerging literature on the politics of growth models pays more attention to the politics of macroeconomic and growth policies than other research frameworks but it, too, tends to underplay public opinion and electoral politics, focusing instead on sectoral ‘growth coalitions’ composed of corporate owners and executive managers and workers with sector‐specific skills (Baccaro et al., Reference Baccaro, Blyth and Pontusson2022; see also Iversen & Soskice, Reference Iversen and Soskice2019). This coalitional perspective argues that election results are unlikely to lead to significant changes in growth strategies for two main reasons. First, macroeconomic policy lends itself more to the ‘quiet politics’ of technical agencies and committees than to the ‘noisy politics’ of electoral competition (Busemeyer et al., Reference Busemeyer, Garritzmann and Neimanns2020; Culpepper, Reference Culpepper2011). Second, mainstream parties in well‐defined growth models tend to converge on policies that are crucial for the growth model, thereby limiting electoral competition to non‐threatening issues (Hopkin & Voss, Reference Hopkin, Voss, Baccaro, Blyth and Pontusson2022; Hübscher & Sattler, Reference Hübscher, Sattler, Baccaro, Blyth and Pontusson2022).
However, the growth model approach accepts that the conditions that favour the depoliticization of growth model policies are likely to change in times of crisis, whether due to external shocks or the accumulation of endogenous dysfunctionalities. Under these conditions, anti‐system parties and political entrepreneurs within established parties are likely to politicize them, making them more salient (Hopkin, Reference Hopkin2020; Rathgeb & Hopkin, Reference Rathgeb and Hopkin2023). When this happens, it becomes more difficult for the growth coalition to insulate itself from electoral competition, which becomes more significant and may lead to a change in growth strategy.
The upshot of this discussion is that there are strong normative and empirical reasons for studying preferences for growth strategies. Knowing what citizens want and whether there are gaps between government policies and the preferences of the majority is important for democratic legitimacy. Preferences are commonly found to be relatively stable over time, but the salience of these preferences is more likely to react to external circumstances (Dennison, Reference Dennison2019, p. 439). This implies that even though citizen preferences remain latent in periods of normal politics, they may become manifest and salient during crises. It is thus important to study them and their political determinants.
Determinants of preferences for growth strategies
In this section, we derive expectations about the determinants of preferences for growth strategies from three different perspectives – the electoral perspective, the growth model approach and the unequal democracy perspective – all relying on material self‐interest as the central mechanism influencing preferences. The relative importance of the different determinants will be determined empirically.
First, the electoral perspective provides several testable implications for our study. Although the volume by Beramendi et al. (Reference Beramendi, Häusermann, Kitschelt and Kriesi2015) only focuses on social and labour market policies, interpreted as being located in a two‐dimensional policy space of investment and consumption‐oriented policies (also see Häusermann et al., Reference Häusermann, Pinggera, Areas and Enggist2022), their logic can also be applied to macroeconomic policies and growth strategies (Hall, Reference Hall2020). In fact, in line with this electoral perspective, a growing literature studies preferences towards different macroeconomic policies (e.g., Barnes & Hicks, Reference Barnes and Hicks2018; Bremer & Bürgisser, Reference Bremer and Bürgisser2023b; Haffert et al., Reference Haffert, Redeker and Rommel2021; Hübscher et al., Reference Hübscher, Sattler and Wagner2021; Scheve, Reference Scheve2004).
Social class is commonly regarded as a central characteristic determining voter preferences in this framework. Following this perspective, workers should be more likely to support wage‐led growth than capital owners, who, in turn, should be more likely to prefer profit‐led growth.Footnote 4 Salaried workers in ‘contradictory class locations (managers, technicians, etc.) (Wright, Reference Wright1997) should be more closely aligned to the preferences of capital owners than of wage earners. While their main source of income is labour income, they exercise authority on behalf of capital owners and benefit from an increase in profits.
Beramendi et al. (Reference Beramendi, Häusermann, Kitschelt and Kriesi2015) also distinguish between an old working class, more male‐oriented and centred on manufacturing and a new working class, more female and service‐based, positing that they do not necessarily have the same preferences. They also highlight a distinct group of ‘socio‐cultural professionals’ (Oesch, Reference Oesch2006). These are ‘individuals with high education in social and cultural services, typically working in non‐profit or public organizations with flat hierarchies and with extensive work autonomy and client interaction, [who] are characterized by decisively universalistic positions but are somewhat conflicted on questions of economic distribution’ (Beramendi et al., Reference Beramendi, Häusermann, Kitschelt and Kriesi2015, p. 21). The socio‐cultural professionals are regarded as the main constituency of the new left (Gingrich & Häusermann, Reference Gingrich and Häusermann2015, Kitschelt, Reference Kitschelt1994), with progressive preferences on the cultural/value axis (particularism vs. universalism of individual rights) and mixed preferences on the economic axis (in favour of state intervention and redistribution but preferring social investment to the subsidization of consumption). It is an empirical question of which growth strategies are favoured by this group and whether the preferences of service‐based workers differ significantly from those of the old working class.
Other expectations can be derived from the growth model literature. This perspective posits that sectors have different ‘requirements’ which shape preferences towards macroeconomic and structural policies for both labour and capital groups, thus bringing about cross‐class convergence within sectors. For example, manufacturing is exchange rate‐sensitive and benefits from a competitive real exchange rate (Frieden, Reference Frieden2014), while construction and other domestic demand‐oriented sectors are interest rate‐sensitive and profit from low real interest rates (Baccaro et al., Reference Baccaro, Blyth and Pontusson2022). This implies opposite preferences towards inflation and its main determinant, the growth of unit labour costs. While exchange rate‐sensitive actors should be favourable to low inflation and wage moderation because they tend to bring about real exchange rate depreciation, interest rate‐sensitive actors prefer a more expansionary monetary policy that lowers real interest rates. In particular, workers with sector‐specific skills, whose income is more tightly linked to sectoral conditions than for highly educated workers (Iversen & Soskice, Reference Iversen and Soskice2001), should have distinct preferences for growth strategies. For example, workers with intermediate skills (often associated with industry‐specific vocational training programmes) employed in manufacturing are likely to have a higher preference for export‐led and a lower preference for wage‐led growth strategies than workers with similar skills employed in sectors that are mostly relying on domestic demand (see also Frieden & Rogowski, Reference Frieden, Rogowski, Keohane and Milner1996, Garrett & Way, Reference Garrett and Way1999).
Similar implications can be drawn for intermediately skilled workers in sectors for which growing profits and easy access to credit are important prerequisites for economic prosperity, such as finance, construction and real estate. The finance sector generally benefits from permissive regulation allowing for credit expansion. Furthermore, a large chunk of credit usually flows into the housing sector, which implies a symbiotic relationship between finance, construction and real estate. Given that growth in highly financialized and leveraged countries may originate both from credit‐led consumption and from higher profit shares (Ban & Helgadóttir, Reference Ban, Helgadóttir, Baccaro, Blyth and Pontusson2022), workers with sector‐specific skills employed in these sectors should be expected to prefer profit‐ or credit‐led growth. Moreover, they should be less supportive of wage‐led growth than workers employed in, for example, the public sector at large, for which credit availability and profit shares are less important sectoral drivers.
Finally, the unequal democracy perspective posits fundamentally different preferences between the rich and the rest of the voters (Page et al., Reference Page, Bartels and Seawright2013). Since very wealthy individuals draw their income primarily from profits and from the control of assets, we should observe a dislike for wage‐led growth strategies among these individuals. Rather they are likely to prefer alternative growth strategies, centring first and foremost on profits but possibly also on exports, due to the deflationary bent of export‐led growth.
The survey
To disentangle the relative merit of the various explanations about the politics of growth strategies, we need information about individual preferences. However, existing cross‐national surveys do not include questions on them. For this reason, we designed a new cross‐country survey, which we conducted in early 2020. Specifically, we sampled citizens aged 18 and higher in Germany (n = 4107), Italy (n = 4087), Sweden (n = 4082) and the United Kingdom (n = 5063), using large online access panels provided by YouGov in each country.Footnote 5
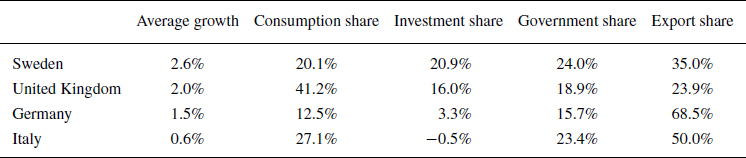
Following Baccaro and Pontusson (Reference Baccaro and Pontusson2016), the country selection represents different growth models: export‐led growth (Germany), credit‐financed consumption‐led growth (Britain), balanced growth (Sweden) and stagnation (Italy). Table 2, which presents import‐adjusted demand contributions to growth, confirms that between 1995 and 2018 exports account for the lion's share of growth in Germany, while consumption is the most dynamic demand component in the United Kingdom. In Sweden, both exports and domestic demand are important contributors to growth (with the latter as the main driver). After the sovereign debt crisis, the only positive contributions to Italy's growth came from exports. However, the Italian economy is in a state of stagnation, as evidenced by its near‐zero growth rate.
Average annual growth rates and demand contributions to growth (1996–2018)

Note: The table records import‐adjusted demand contributions to growth based on Baccaro and Hadziabdic (Reference Baccaro and Hadziabdic2022).
In each country, we employed a quota sampling approach based on age and gender (interlocked) as well as employment status to ensure that the sample in each country was nationally representative. To further correct for sampling bias, we calculated post‐stratification weights for age, gender and education using population targets obtained by Eurostat. We also calculated post‐stratification weights that factor in voting intention in addition to socio‐demographic characteristics, because individuals with particular political views may be less likely to be included in the panels or to respond to the survey. However, the results we obtain do not depend on the use or the type of weights. For more information about our survey and the sample, see the Online Appendix.
Questions and measurement
The centrepiece of the survey is a set of stylized representations of four different growth strategies – wage‐led, profit‐led, export‐led and credit‐led growth – in the form of short vignettes presented in random order. Each vignette attempts to capture the essence of the respective growth strategy (highlighted in Table 1) while keeping it as short and simple as possible to facilitate comprehension. In each vignette, the government stimulates one growth driver (wages, profits, exports and credit, respectively) and the key mechanisms are indicated. All growth strategies are framed positively as having the capacity to improve employment and standards of living.Footnote 6
After respondents read and assessed all vignettes, we asked them which strategy the government should pursue, ranking the strategies from the most desirable to the least desirable. We use responses regarding the most desirable growth strategy as our main dependent variable. The Online Appendix includes the text of the vignettes as well as full details about the survey.
To ensure the growth strategy vignettes were meaningful and comprehensible by survey respondents, we implemented three rounds of pre‐testing. The first pre‐test involved researchers and staff members of the authors’ research institutions (50 responses). A second pre‐test relied on a convenience sample of 1843 individuals recruited through paid advertisements on Facebook. Finally, a third pre‐test was conducted by YouGov a few weeks before the main fieldwork in each of the four countries (350 responses in total). The goal of the first two pilot studies was to solicit feedback with regard to question comprehension, complexity and response time. We also obtained detailed feedback through open‐ended questions, which helped us to improve the comprehensibility of the vignettes and the questions. The third pre‐test allowed us, once again, to collect respondents´ feedback and provided a final check for a sub‐sample that was representative of the YouGov panel respondents. Moreover, this pre‐test allowed us to test the attention check question as well as a set of quality control questions used by YouGov for pre‐testing survey instruments.
One advantage of studying preferences for growth strategies is that they refer to themes that respondents are more familiar with than individual macroeconomic policies. Whether higher wages or higher profits are required to stimulate growth, used to divide unions and employers as well as the public at large in industrialized countries (Blyth & Matthijs, Reference Blyth and Matthijs2017; Hall, Reference Hall2020). Also, research shows that the links between exports and price competitiveness, and credit and household expenditure, are prominently discussed in the media (Ferrara et al., Reference Ferrara, Haas, Peterson and Sattler2022; Polyak, Reference Polyak2022). Therefore, respondents should be able to provide meaningful responses to our questions about growth strategies. However, to further probe whether preferences for growth strategies are meaningful and informed, in the empirical section we assess their correlation with preferences for specific economic policies.
Our main independent variables are social class and sector of employment. There are different ways to operationalize class, and all of them emphasize labour market position, occupation, skills and labour market power (e.g., Erikson & Goldthorpe, Reference Erikson and Goldthorpe1992; Wright, Reference Wright1997). We use the Oesch 8‐class scheme (Reference Oesch2006; see Table A.1 in the Online Appendix), which is a refinement of Erikson and Goldthorpe's class scheme. It distinguishes between different kinds of ‘work logic’ and emphasizes the socializing environment of work, suggesting that the type of interaction prevailing on the job shapes the way people conceive their interests and formulate their preferences. Importantly, the Oesch scheme postulates a testable difference between old ‘Fordist’ occupations in industry, where technical skills and hierarchical control are more prevalent, and ‘service’ occupations, where the nature of tasks puts workers in close contact with several different people, favouring the development of attitudes of tolerance and care (Kitschelt & Rehm, Reference Kitschelt and Rehm2014). Here, we also code individuals in retirement as a separate category. This choice reflects the possibility that weaker reliance on the labour market and stronger reliance on returns to assets and savings could be more decisive for the growth model policy preferences of the retired than the social class position derived from past employment (Vlandas, Reference Vlandas2018).Footnote 7
Our second key independent variable is the respondent's sector of employment. This is coded based on the European Union's classification of economic activities (NACE rev. 2). To avoid group sizes becoming too small and building upon the classification in Baccaro and Hadziabdic (Reference Baccaro and Hadziabdic2022), we combine sectors based on workers’ skill content and distinguish between (1) manufacturing (NACE C), (2) construction and real estate (NACE F, L), (3) finance and insurance (NACE K), 4 low‐end services (NACE G, H, I, N, S), (5) high‐end services (NACE J, M, R, T), (6) education and health (NACE P, Q), (7) and public administration (NACE O). Because the class and sectoral schemes are partially overlapping, we replace the class variable with educational attainment in models including sector. Furthermore, since we are interested in the role of sectors for employed workers, we drop self‐employed individuals (or those working for a family business) from the sample in models focusing on sectors.
We control for gender, economic knowledge (to control for the respondents’ ability to understand and process the vignettes), and labour market status (through dummies for ‘unemployed’, ‘in education’, ‘housework’ and ‘other and not in paid work’) to account for possible confounders of the effects of class and sector. A preliminary descriptive analysis (presented below) suggests that there are no large differences across countries in patterns of growth strategy selection. Thus, we pool responses from the four countries, including country‐fixed effects to control for unobserved idiosyncratic factors. This allows us to have sufficiently large cells for class and sector analysis. Tables A.1 and A.2 in the Appendix provide further details about all variables as well as the summary statistics for our sample.
Results
We present our results in four steps: First, we introduce some descriptive statistics about preferences towards growth strategies. Second, we run regressions to test the extent to which preferences for growth strategies are correlated with other policy preferences. Third, we analyse the impact of class and sector on preferences for growth strategies. Fourth, we zoom in on the richest respondents in our sample.
Descriptive analysis
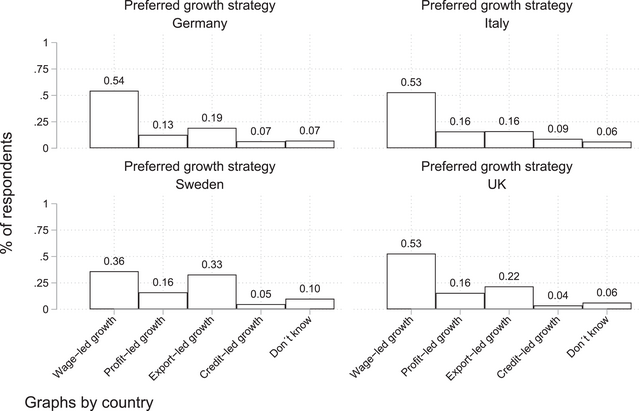
Figure 1 shows the share of respondents who chose a given growth strategy as their first priority.Footnote 8 With more than 50 per cent of responses in Italy, the United Kingdom and (more surprisingly) Germany, wage‐led growth is clearly the most preferred strategy. Export‐led and profit‐led are much less popular, while support for credit‐led growth is negligible. This pattern is consistent across countries. Sweden constitutes a partial exception with a higher level of support for export‐led growth than in other countries (33 per cent of respondents) but also in Sweden, a relative majority of respondents (36 per cent) choose wage‐led growth as their first choice. Compared to the other three countries, Swedish respondents seem to have internalized the need for a small open economy to rely on export‐led growth (Katzenstein, Reference Katzenstein1985).
Average support for growth strategies.
Note: The figure shows the share of respondents who ranked the respective growth model first. Survey weights applied.

Furthermore, we asked respondents to assess on a scale from 0 (not at all effective) to 10 (very effective) how effective, in their view, each growth strategy would be to stimulate growth. This item allows us to assess whether support for wage‐led growth could reflect respondents expecting to benefit personally from higher wages, irrespective of the consequences for their countries’ economic growth. Figure C.1 in the Online Appendix shows that, on average, respondents evaluate wage‐led growth to be the most effective strategy to achieve economic growth. Averaged across countries, perceived effectiveness is 7.0, whereas it ranges from 5.1 to 5.8 for the other three growth strategies. This finding demonstrates that support for wage‐led growth does not merely reflect narrow material self‐interest, but respondents also believe that it would be the most effective way to stimulate growth.
Consistency of preferences across policy issues
Growth strategies are policy bundles as they involve a set of policies, such as wage bargaining, fiscal policies, trade policies and sectoral policies. A meaningful preference for any growth strategy should thus be consistent with preferences across these policy domains. To assess whether this is the case, we run exploratory multinomial logistic regressions in which the dependent variable is a respondent's preferred growth strategy (including the don't know option). The independent variables include the following questions, measuring policy preferences: (1) a strong role of unions in wage bargaining; (2) support for price stability versus full employment; (3) support for public deficits as needed to achieve full employment; (4) support for finance both in absolute terms and as compared to manufacturing; (5) support for trade deficits or surpluses; 6) support for easier or more difficult access to loans (see Table A.1 for the exact question wording and response scales). If preferences for growth strategies reflect meaningfully informed choices, they should correlate with compatible economic policies.
We run multinomial logistic regressions to estimate our models because preferences for growth strategies are linked to each other. The models thus involve different pairwise comparisons among the discrete categories of the dependent variable. Since the coefficients are subject to change depending on which category is chosen as the reference category, and the interpretation of coefficients and odds ratios from multinomial logistic regressions is not as straightforward as in linear models, we report results based on predicted probabilities and average marginal effects.
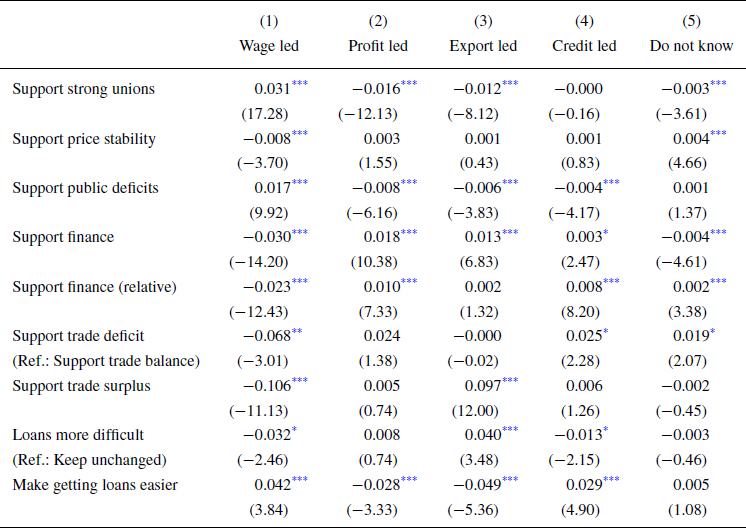
The results suggest that preferences for growth strategies are meaningfully bundled with preferences for other economic policies (Table 3). For example, a preference for wage‐led growth is associated positively with support for a strong role of unions in wage determination and with support for budget deficits to ensure full employment, and negatively with a preference for inflation minimization versus full employment and with support for finance. A preference for wage‐led growth also correlates negatively with support for trade surpluses and positively with support for making loans easier to obtain.Footnote 9 The other three wage strategies are less distinctive. For example, they are all negatively correlated with support for strong unions and with support for public deficits and positively correlated with support for finance. This may imply that respondents do not clearly distinguish between profit‐led, export‐led and credit‐led and that the clearest axis of differentiation is between support for wage‐led growth, on the one hand, and support for other growth strategies, on the other hand.
Associations between support for growth strategies and preferences for economic policies (average marginal effects based on multinomial logistic regressions)

Note: For each economic preference item, one separate model is estimated. All models control for gender, age, education, work status, economic knowledge and country. The first five macroeconomic preference items are measured on a 0–10 scale and are included as continuous variables, the latter two are based on three response categories and are included as categorical variables. t statistics are in parentheses.
* p < 0.05,
** p < 0.01,
*** p < 0.001.
The role of class and sector
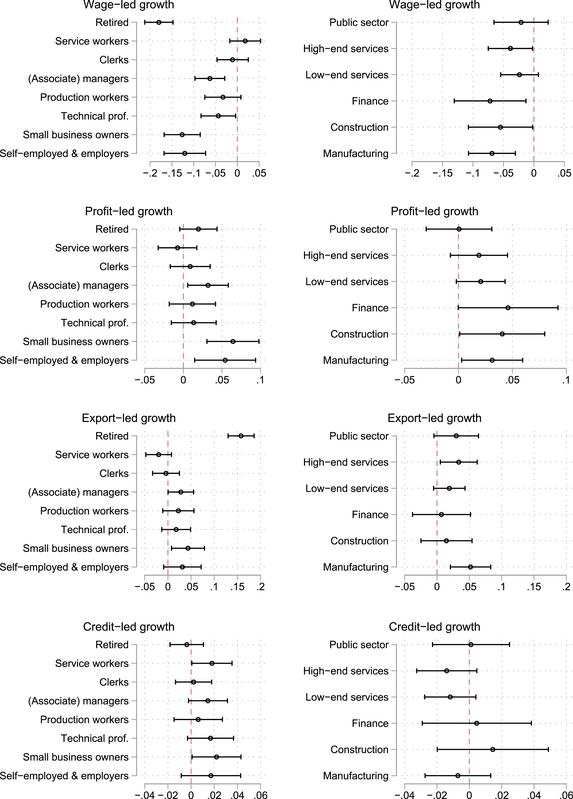
In the next step, we examine to what extent preferences for growth strategies are shaped by class and sector. Our dependent variable is the respondents’ choice of growth strategy. We report average marginal effects in Figure 2 and predicted probabilities in Figure B.1 in the Online Appendix.Footnote 10
Average marginal effects support growth strategies by social class (left; reference category: socio‐cultural professionals) and sector (right; reference category: education and health).
Note: The figure shows average marginal effects for different social classes and sectors with respect to the reference categories to rank the respective growth strategy first. Estimates are based on multinomial logistic regression results shown in Tables B.1 and B.2 in the Online Appendix. Ninety‐five per cent confidence intervals are shown. Models for sector exclude self‐employed respondents.

The results for class (left side of Figure 2) show that employers, self‐employed and small business owners are significantly less likely to express a preference for wage‐led growth (by about 10 percentage points) and significantly more likely to opt for profit‐led growth (by about 5 percentage points) than the reference category of socio‐cultural professionals. As expected, (associate) managers and to a lesser extent technical professionals have similar preferences to capital owners. Instead, service workers, socio‐cultural professionals (the reference category) and clerks are more likely to support wage‐led and less likely to support profit‐led growth. We do not observe clear class effects for the other two growth strategies.Footnote 11
The class of the retired has particular preferences for growth strategies. They are more likely to support export‐led growth (by 16 percentage points) and less likely to support wage‐led growth (by 18 percentage points). Although pensions are linked to wage and price dynamics through indexation mechanisms in all four countries considered (OECD, 2021, p. 127), retired people seem to be attracted to a growth strategy, export‐led, with a clear deflationary bias (Vlandas, Reference Vlandas2018).Footnote 12
With regard to sector (right side of Figure 2), the effects are smaller and less precisely estimated than those for class. However, workers employed in finance, high‐end services and manufacturing are less likely to support wage‐led growth than workers in education and health (the reference category). Manufacturing workers are, instead, significantly more likely to support export‐led and profit‐led growth.
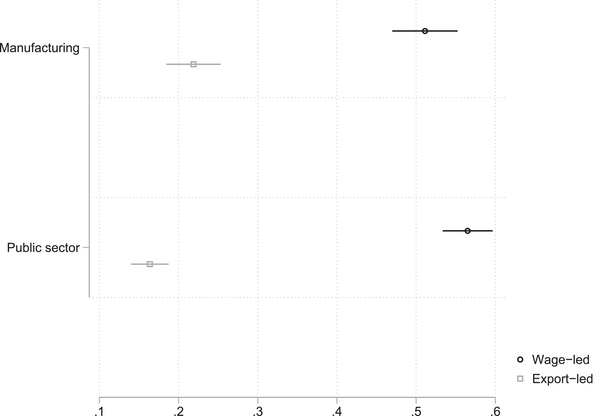
We also test for an interaction effect between sector and education to examine whether the sectoral differences are greater for workers with more specific skills as anticipated by Baccaro et al. (Reference Baccaro, Blyth and Pontusson2022) following Iversen and Soskice (Reference Iversen and Soskice2001). Figure 3 reports predicted levels of support for growth strategies for workers with intermediate skills (based on the International Standard Classification of Education (ISCED), ≥ ISCED3 and ≤ ISCED5) as a proxy for sector‐specific skills.Footnote 13 Figure 3 compares predicted probabilities for wage‐led and export‐led growth between manufacturing and the public sector (public administration, education and health).
Predicted support for growth strategies by sector for workers with intermediate skills; the role of the exchange rate‐sensitive sectors.
Note: The models including sector in Figure 2 are used. The sectoral categories are chosen to highlight the differences between an exchange rate‐sensitive sector (manufacturing) and the public sector (education, health and public administration); self‐employed are excluded; other sectors and the retired are included as residual categories of the sectoral classification but not shown. (See Table B.3 for the full models in the Online Appendix.)

Wald tests of the estimates reported in Figure 3 reveal that workers with intermediate skills employed in manufacturing are significantly less likely to choose wage‐led growth and more likely to choose export‐led growth than public sector workers with similar skills. These effects are likely due to different degrees of exposure to trade (Baccaro & Neimanns, Reference Baccaro and Neimanns2022; Frieden & Rogowski, Reference Frieden, Rogowski, Keohane and Milner1996, Garrett & Way, Reference Garrett and Way1999).Footnote 14 In fact, there are no significant differences between manufacturing workers not exposed to trade and public sector workers (see Figure C.2 in the Online Appendix). To test whether we can observe a similar pattern for workers with intermediate skills working in interest rate‐sensitive sectors, we compare preferences for profit‐led and credit‐led growth between the finance‐construction‐real estate complex on the one hand and the public sector on the other. Although intermediate‐skill workers in finance, construction, and real estate tend to show greater support for profit‐led growth than their counterparts in the public sector, the differences are statistically insignificant (Figure B.2 in the Online Appendix).
The preferences of the rich
One striking result of our analysis is that for all class segments, including employers and self‐employed, small business owners, and pensioners, wage‐led emerges as the preferred growth strategy (see Figure B.1 in the Online Appendix). This level of support should in principle be reflected in governments’ growth strategies, which should lean towards wage‐led growth. Yet, as the literature on unequal democracy points out the preferences of the majority hardly matter for the selection of policies. Much more important are the preferences of the rich, which are likely to be different from the rest of the electorate (Bartels, Reference Bartels2008; Gilens & Page, Reference Gilens and Page2014; Page et al., Reference Page, Bartels and Seawright2013).
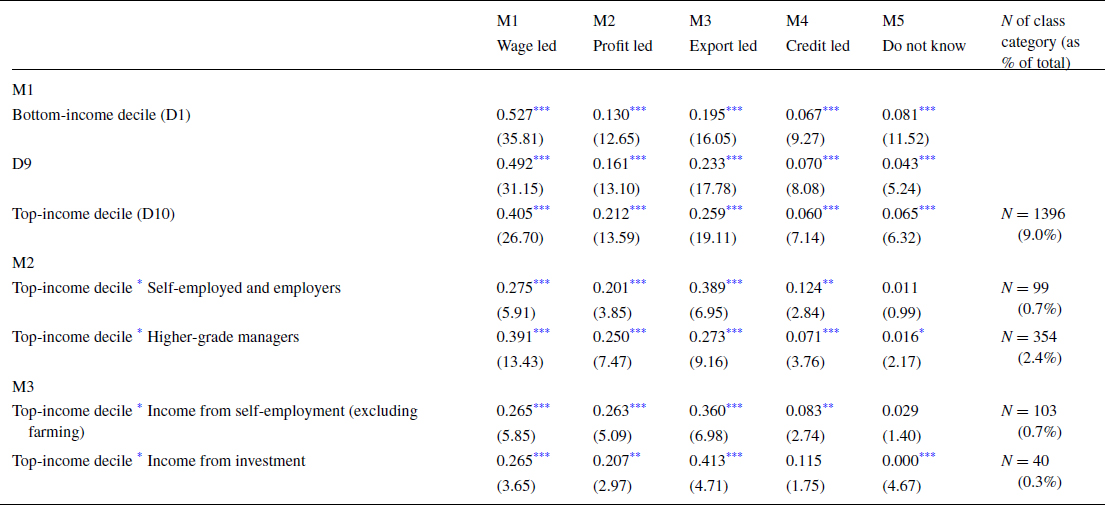
With a general public opinion survey like ours, we are unable to solve the notorious problem of getting a truly accurate picture of the richest citizens. Nonetheless, we are able to zoom in on the preferences of, roughly put, the top 1 per cent of our sample, by combining information on respondents’ income, source of income and class. Table 4 reports predicted probabilities of support for different growth strategies for individuals: (a) in the top income decile, (b) in the top income decile who are simultaneously located in one of the upper social class positions and (c) in the top income decile who simultaneously report that their main source of income is either self‐employment or investment, savings, insurance or property. Moving from (a) to (c) reduces the size of the group from 9.0 to 3.1 (0.7 + 2.4) to 1.0 (0.7 + 0.3) per cent of the total sample, respectively (see the last column, Table 4).
Predicted support for growth strategies among top‐income earners

Notes: The models include the same variables as the model reported in Figure 2 for social class, with the following modifications: M1 and M3 replace the Oesch class variable with a categorical measure of income deciles, education, age and age squared. M2 interacts class with a dummy variable for the top income decile; higher‐grade managers only include higher‐grade managers and administrators from the Oesch‐16 class scheme. M3 interacts top income decile with the main source of income; being unemployed is dropped to avoid multicollinearity. See Tables B.4‐B.6 for the full results. t statistics in parentheses.
Table 4. p < 0.05,
Table 4. p < 0.01,
Table 4. p < 0.001.
The results in Table 4 show that as we move towards a narrower definition of the upper class, majority support for wage‐led growth disappears. A (close to) absolute majority of individuals in the lowest nine income deciles support wage‐led growth. For the highest decile, the predicted level of support is reduced to 0.42, which is still a relative majority. Support for wage‐led growth drops markedly, however, if we combine information on income with the source of income. Among the self‐employed and employers in the top decile of income, we find a relative majority in favour of export‐led growth (0.39 in Model 2). Similarly, people in the top decile of the income distribution who report that they primarily rely on income from self‐employment or income from the investment are also most likely to favour export‐led growth (0.36 and 0.41, respectively, in Model 3). Surprisingly, profit‐led growth is never a majority strategy, no matter how thin we cut our sample. This suggests that economic elites may sense that the pursuit of a profit‐led growth strategy may cause problems of profit realization (Marx, Reference Marx1885/1996).
Discussion and conclusion
This paper has broken new ground by focusing on preferences for growth strategies for the first time. Studying what type of growth strategies citizens want is important for both normative and empirical reasons. It allows gauging the distance between government policy and the will of the people in a crucial domain, which is important for democratic legitimacy but is also foundational for other policy domains, given growth strategies' potential to either ease or intensify the trade‐offs in other policy areas, such as the choice to prioritize investment versus consumption in welfare state policy (Bremer & Bürgisser, Reference Bremer and Bürgisser2023a). Furthermore, although preferences for growth strategies may be relatively unimportant in periods of quiet politics, they are likely to become salient and consequential in periods of crisis.
Based on a new survey, our study has revealed that preferences for growth strategies are consistent across policy domains: A person who chooses wage‐led growth is also more likely to support a set of compatible policies such as a strong union role in wage determination, a preference for full employment over low inflation and for fiscal deficits in order to ensure full employment. Moreover, they are less likely to support trade surpluses and to prioritize finance over manufacturing. Conversely, a respondent who selects export‐led or profit‐led growth as their preferred government strategy is also more likely to reject a large union involvement and fiscal deficits and to endorse the expansion of finance. This shows that the most important dividing line is between wage‐driven growth and other growth strategies. The credit‐led growth strategy, which attempts to encourage economic growth by easing access to credit, is chosen by a very small proportion of respondents.
Class helps to structure preferences for growth strategies along the classic labour‐capital dimension. The upper classes – employers, self‐employed, and managers – are significantly less likely to select wage‐led as their preferred choice and significantly more likely to opt for profit‐led growth. Interestingly, support for wage‐led growth is stronger among the new service sector‐based working class than the old one. Furthermore, despite their mixed feelings about consumptive social expenditures (Beramendi et al., Reference Beramendi, Häusermann, Kitschelt and Kriesi2015), socio‐cultural professionals are, along with service workers, the strongest supporters of wage‐led growth and they are also the least favourable to profit‐led growth. Moreover, confirming the insights of Vlandas (Reference Vlandas2018), individuals in retirement have highly specific growth preferences, partly conflicting with those of workers: They have a strong affinity for export‐led growth, which is probably due to their dislike for inflation.
Compared to class, the effect of the sector of employment is less distinctive but non‐negligible, nonetheless. For example, manufacturing workers are less likely to endorse wage‐led growth and more likely to favour export‐led growth. In particular, this applies to intermediate‐skill workers in manufacturing when compared with public sector workers with similar skills, and the difference is due to manufacturing workers’ greater exposure to international competition. This finding corroborates arguments about the interaction of class, sector and skills in shaping preferences for growth strategies (Baccaro et al., Reference Baccaro, Blyth and Pontusson2022; Iversen & Soskice, Reference Iversen and Soskice2001).
Yet one of our most striking results is that across countries, classes, sectors and income deciles, citizens always select wage‐led as their preferred growth strategy. In contrast, profit‐led growth does not receive the highest level of support in any social group, not even among employers and self‐employed. These preferences are clearly at odds with policy developments over the past several decades. The bargaining power of workers has declined, real wages have stagnated and the link with labour productivity has weakened considerably in advanced countries (Mishel, Reference Mishel2015; Paternesi Meloni & Stirati, Reference Paternesi Meloni and Stirati2023; Stansbury & Summers, Reference Stansbury and Summers2020). As a result, wage‐led growth is in crisis everywhere (Baccaro et al., Reference Baccaro, Blyth and Pontusson2022; Lavoie & Stockhammer, Reference Lavoie and Stockhammer2013). Just like in other policy domains – such as redistribution, taxation of the rich or the minimum wage (Cova, Reference Cova2022; Dimick et al., Reference Dimick, Rueda and Stegmueller2018; Schechtl & Tisch, Reference Schechtl and Daria Tisch2024) – the domain of growth strategies thus sees a mismatch between the preferences of the majority and actual policy. If citizens overwhelmingly want wage‐led growth, why do we not see more attempts to implement it?
The literature on unequal democracy suggests that the preferences that matter for policy are those of the very rich, which are significantly different from those of the majority in matters of economic policy (Bartels, Reference Bartels2008; Gilens, Reference Gilens2012; Hacker & Pierson, Reference Hacker and Pierson2010; Page et al., Reference Page, Bartels and Seawright2013). Our results buttress this thesis as we find a reversal of preference ordering when we restrict our sample to roughly the top 1 per cent or less. Surprisingly, for this select group, the preferred growth strategy is export‐led, not profit‐led.
Relatedly, we find that cross‐country differences in growth models are not explained by differences in citizen preferences for growth strategies. For example, only 19 per cent of German citizens choose export‐led as their preferred growth strategy, less than in Sweden and even in the United Kingdom. Yet, export‐led growth accounts for the lion's share of German growth since the mid‐1990s. These findings lend support to approaches that emphasize producer groups and economic elites as determinants of growth model diversity, as opposed to public opinion and electoral competition (Baccaro et al., Reference Baccaro, Blyth and Pontusson2022).
The research presented in this paper opens up several opportunities for further research. First, future research should explore the preferences of economic elites with a dedicated elite survey. Relatedly, it suggests examining the role of policymakers and experts. Economic ideas may lead them to consider wage‐led growth unfeasible or undesirable and block its implementation as has been the case for Keynesian macroeconomic policies (Blyth, Reference Blyth2013; Bremer, Reference Bremer2023; Hall, Reference Hall1989; Mudge, Reference Mudge2018). Second, research should consider to what extent popular preferences for growth strategies are robust to the provision of information about their possible adverse effects (e.g., Giger & Nelson, Reference Giger and Nelson2013). For example, do preferences change significantly when respondents receive information about the possible inflationary bias of a wage‐led growth strategy? Survey experiments would be helpful to answer this question. Finally, recent literature posits that the source of income (labour or capital‐related) is not the sole determinant of economic preferences, but asset ownership, and especially homeownership, increasingly plays a role (Ansell, Reference Ansell2014, Reference Ansell2019; Chwieroth & Walter, Reference Chwieroth and Walter2020). Future research should test whether asset ownership imparts a similar deflationary bias to preferences for growth strategies as retirement status, undermining support for wage‐led growth.
Acknowledgements
Ethics approval was granted by the Institutional Review Board of the Max Planck Society (application number: 2022_33). Previous versions of this paper were presented at workshops at the University of Cologne, the Max Planck Institute for the Study of Societies and Manchester Metropolitan University. We are grateful for comments from Dorothee Bohle, Alison Johnston, Julian Garritzmann, Peter Hall, Jonas Pontusson, Aidan Regan and Till Van Treeck. We are also grateful to Kostas Gemenis for his help with the design of the survey, and to Cassandra Fuchs and Robin Hetzel for excellent research assistance.
Open access funding enabled and organized by Projekt DEAL.
Data availability statement
The full data set will be made publicly available after an embargo period. Replication material (Stata data file and do file) is included in the Supporting Information.
Online Appendix
Additional supporting information may be found in the Online Appendix section at the end of the article:
Online Appendix
Replication Data


 Open access