


A large scholarly literature has drawn attention to the restructuring of party competition across European democracies (e.g., Bornschier, Reference Bornschier2010; Dalton, Reference Dalton2018; Hooghe et al., Reference Hooghe, Marks and Wilson2002; Jackson & Jolly, Reference Jackson and Jolly2021; Kriesi et al., Reference Kriesi, Grande, Lachat, Dolezal, Bornschier and Frey2006). This work provides robust evidence of the rising salience of socio‐cultural and identitarian issues and, potentially, the emergence of a new political cleavage that divides voters on these issues. However, the micro‐foundations of this restructuring are less well understood. In this paper we theorize how the emergence of a new cleavage should structure voters’ views and propensities to vote for different parties.
The presence of a cleavage implies an opposition, with parties representing clearly articulated alternatives. Most research that has studied the emergence and importance of the new cleavage for explaining party system change focuses on the social bases of party support (e.g., Bornschier et al., Reference Bornschier, Häusermann, Zollinger and Colombo2021; Marks et al., Reference Marks, Attewell, Hooghe, Rovny and Steenbergen2022) or assesses the weight of different kinds of issues for vote choice (e.g., De Vries, Reference De Vries2018). Here we extend a spatial approach to the rise of a new cleavage and assess how voters view opposition between parties. Specifically, we are seeking to understand the spatial sources of voters’ party preferences across the economic left/right and GAL‐TAN dimensions of political competition. We break this down into the following questions: (1) To what extent do voters use a dimensional lens to evaluate their willingness to vote for alternative parties? (2) How does the association between dimensions vary across political parties and over time?
To examine how party competition is reflected in voters’ views of parties, we make use of the 1999, 2009, 2014 and 2019 voter surveys of the European Election Study (EES) project and combine these individual‐level datasets with information on the characteristics and positions of parties as documented by the Chapel Hill Expert Surveys (CHES).Footnote 1 We leverage the EES surveys’ measures of citizens’ self‐reported propensity to vote (PTV) for alternative political parties in order to map electoral affinity and opposition among party families. This variable allows us to estimate whether the electorates of parties on one side of a cleavage give low PTVs to parties at the opposing pole and vice versa. In comparison to measures of vote intention, PTVs provide more refined information – which is particularly useful for detecting whether a new, transnational cleavage shapes voters’ electoral choices.
Empirically, our focus is on two ideological dimensions. The economic left–right dimension taps party positioning on the role of government in the economy, redistribution, and taxation; this corresponds most closely to the traditional class cleavage. Second, we examine positions on a socio‐cultural dimension that we label GAL‐TAN. The GAL‐TAN dimension distinguishes parties on socio‐cultural issues, from green, alternative, libertarianism (GAL) to traditionalism, authoritarianism and nationalism (TAN).Footnote 2 GAL‐TAN positioning captures most closely the content of the transnational cleavage which pits those who embrace open societies, multiculturalism and international governance against those who conceive these as a threat to their way of life and their national community (Häusermann & Kriesi, Reference Häusermann, Kriesi, Beramendi, Häusermann, Kitschelt and Kriesi2015; Hobolt et al., Reference Hobolt, Leeper and Tilley2021; Hooghe & Marks, Reference Hooghe and Marks2018; Stubager, Reference Stubager2010).
Our results provide evidence of substantial over‐time shifts in voters’ views of the structure of party competition. We find that the structure of respondents’ propensities to vote reflects the relative location of political parties in a two‐dimensional space composed of an economic left–right dimension and a socio‐cultural (GAL‐TAN) dimension.
Further, we detect that over the past two decades this GAL‐TAN dimension has gradually gained weight for how citizens evaluate their propensities to vote for competing parties. We also observe that radical‐right parties are quite isolated – especially in recent times – and that the electorates most opposed to each other are those of the parties at the extreme poles of the transnational cleavage: radical‐right and green. Finally, our analyses point to the limitations of spatial dynamics to explain opposition between the GAL and TAN sides of the transnational cleavage. TAN parties, in particular, generate more polarization than would be expected based on their ideological positions relative to the other parties they are in competition with.
The emergence of the transnational cleavage
Across established democracies, and notably in Western Europe, party competition is fundamentally changing. This is evident from work on party positioning on different issues. Kriesi et al. (Reference Kriesi, Grande, Lachat, Dolezal, Bornschier and Frey2006, p. 950), for example, rely on newspaper content analysis of electoral campaign coverage in the 1970s, the 1990s, and the 2000s to show that ‘the cultural dimension has been gaining in importance as it has become the primary basis on which new parties or transformed established parties seek to mobilize their electorate’. It has been theorized that this party system change comes in the form of ‘challenger parties’ (De Vries & Hobolt, Reference De Vries and Hobolt2020) that, by emphasizing issues outside the left–right dimension, restructure party competition.
This work is complemented by individual‐level studies revealing that citizens’ preferences on the left–right dimension are increasingly disconnected from their preferences on socio‐cultural issues (De Vries, Reference De Vries2018). A growing literature documents a fundamental shift in the determinants of vote choice and the social basis of voting. Stubager (Reference Stubager2010, Reference Stubager2013) was one of the first to establish the increased importance of educational background for vote choice, which appears particularly consequential for distinguishing GAL and TAN electorates (Marks et al., Reference Marks, Attewell, Hooghe, Rovny and Steenbergen2022; Oesch & Rennwald, Reference Oesch and Rennwald2018). Other studies focus on shifting issues and issue dimensions. Using data from the Dutch context, for example, De Vries (Reference De Vries2018, p. 1542) observes that, ‘Positions on the cosmopolitanism–parochialism divide now structure people's party choice in both European and national parliamentary elections’. Jackson and Jolly (Reference Jackson and Jolly2021) show that individuals’ positions on the transnational dimension – operationalized by combining preferences on European integration and immigration – structure voting behavior across a wide range of European countries.
It has been argued that these changes reflect the emergence of a new cleavage, which we refer to as a transnational cleavage expressed in the opposition between GAL and TAN parties (Hooghe & Marks, Reference Hooghe and Marks2018). Scholars of cleavage politics highlight that the concept of cleavage should be used to describe divisions that meet certain conditions. Bartolini and Mair (Reference Bartolini and Mair1990) theorize that cleavages include a socio‐structural element (i.e., the relevant groups have distinct social locations), an identity component (i.e., citizens are conscious of the groups they belong to) as well as an organizational element (Deegan‐Krause, Reference Deegan‐Krause, Dalton and Klingemann2007). These conditions appear to be present in the case of the transnational cleavage. There is evidence that electoral support for GAL and TAN parties comes from different social groups (Marks et al., Reference Marks, Attewell, Hooghe, Rovny and Steenbergen2022), that these groups develop a group‐consciousness that matches this structural division (Bornschier et al., Reference Bornschier, Häusermann, Zollinger and Colombo2021) and that the cleavage is gaining an organizational basis (Sass & Kuhnle, Reference Sass and Kuhnle2022).
In summary, research has shown that a new transnational cleavage has entered party competition and that positions on this cleavage inform electoral choice. To be sure, there is debate on whether the opposition between GAL and TAN parties is better understood as a new cleavage, or perhaps as a re‐activation of older cleavages described by Lipset and Rokkan (Reference Lipset, Rokkan, Lipset and Rokkan1967, see also Flora Reference Flora1999).Footnote 3 Either way, it is clear that party competition has altered over time, and this motivates our inquiry into how voters use a dimensional lens to evaluate the party offer. In particular, are voters who support a party on one end of the transnational cleavage more strongly opposed to alternatives at the other end? More generally, our theoretical concern is to examine the extent to which the spatial positions of parties inform voters’ views of party competition, and whether cleavage‐based opposition between parties is reflected in how electorates assess their propensity to vote for parties on the ballot.Footnote 4
Cleavages and vote propensities: Hypotheses
Several measures can inform an analysis of how citizens construe the structure of party competition. Here, we focus on voters’ self‐reported electoral propensities – captured by how likely they are to ever vote for various contending political parties – rather than their affective like or dislike.Footnote 5 By tapping citizens’ propensity to ‘ever vote’ for a party (see full wording below) we seek to detach evaluations of parties from the particular circumstances of a given election with its specific issues and personalities. Because the term ‘ever’ is left unspecified, the respondent's choice is ‘not related to a particular upcoming or recent election or to a given time period’ (Van der Eijk et al., Reference Van der Eijk, Van der Brug, Kroh and Franklin2006, p. 433). Hence it can help shed light on the underlying structure of political competition as perceived by voters.
Our prior is that a rearticulation of political space should be observable in citizens’ propensities to vote for alternative political parties (Costello et al., Reference Costello, Thomassen and Rosema2012; Dalton et al., Reference Dalton, Farrell and McAllister2011; De Sio & Weber, Reference De Sio and Weber2014; Ferland & Dassonneville, Reference Ferland and Dassonneville2021). This premise is informed by Downsian theory which expects that voters prefer candidates and parties who are ideologically close to their ideal points (Boatright, Reference Boatright2008). The question that guides our research is whether, over time, this distance increasingly reflects distance on the GAL‐TAN dimension.
The claim that the political space is observable in citizens’ views of parties requires not only that citizens have an affinity to a particular political party that can be conceptualized in spatial terms, but that they also conceive each alternative party as having a spatial location in relation to their preferred party. Furthermore, the distance between their preferred party and each alternative party should be inversely related to their estimation of the probability they would ever vote for that party. These claims underpin the following baseline hypothesis about how the structure of party competition is reflected in citizens’ propensities to vote for different parties:
Hypothesis 1: The vote propensity of a citizen for an alternative party is inversely related to the distance between the spatial location of a citizen's preferred party and that of their alternative party.
Our main objective is to shed light on how the transformation of party competition in Western Europe is reflected in citizens’ conceptions of the political space. Our theoretical point of departure here is cleavage theory which conceives party system change as a geological process in which a new political divide overlays, rather than replaces, a prior one (Hooghe & Marks, Reference Hooghe and Marks2018; Lipset & Rokkan, Reference Lipset, Rokkan, Lipset and Rokkan1967). This is arguably reflected in the changing dimensionality of party competition in Europe. Many have described the emergence of a distinct socio‐cultural dimension in Western democracies in response to conflict over immigration, European integration, and trade. These issues engage citizens’ conceptions of community and national sovereignty. A variety of concepts summarize this dimension: left–libertarian versus right‐authoritarian (Kitschelt, Reference Kitschelt1988); integration versus demarcation (Kriesi et al., Reference Kriesi, Grande, Lachat, Dolezal, Bornschier and Frey2006, Reference Kriesi, Grande, Dolezal, Helbling, Höglinger, Hutter and Wüest2012); libertarian‐universalistic versus traditionalist‐communitarian (Bornschier, Reference Bornschier2010); universalism versus particularism (Beramendi et al., Reference Beramendi, Häusermann, Kitschelt and Kriesi2015); and cosmopolitan versus communitarian (Teney et al., Reference Teney, Lacewell and De Wilde2014). The terms we use here are aptly composite: GAL (green‐alternative‐libertarian) versus TAN (traditional‐authoritarian‐nationalist) (Hooghe et al., Reference Hooghe, Marks and Wilson2002).
The expectation that a GAL‐TAN dimension has come into play alongside an economic left–right divide allows one to give Hypothesis 1 substantive content. If the conceptual chain described in Hypothesis 1 does, in fact, exist in the mind of the voter, our substantive expectations are that a citizen's vote propensities are a function of the inverse Euclidian distances between the economic left–right location and the GAL‐TAN location of their preferred party and the alternative party, and that the statistical power of GAL‐TAN location in this model has increased over time. This leads to our second hypothesis:
Hypothesis 2: The relative weight of GAL‐TAN location in explaining vote propensity has increased relative to economic left–right location over the past two decades.
Cleavage theory predicts that the grievances produced by transnationalism are unevenly distributed across society. This has two implications. One is that, as this new cleavage becomes salient, older ones may lose bite across society. And indeed, conflict on GAL‐TAN issues appears sharper today than that over economic left–right issues (Gidron et al., Reference Gidron, Adams and Horne2020; Harteveld, Reference Harteveld2021). The other is that new political parties rise on the new cleavage to give voice to the most intensely affected social groups. The expectation, then, is that those who vote for political parties taking outspoken positions on the GAL‐TAN divide are least inclined to vote for a party at the opposite pole. Hence, we expect the main opposition to be between voters of green parties and those voting for TAN parties:
Hypothesis 3: Vote propensity is lowest between TAN supporters evaluating green parties and green supporters evaluating TAN parties.
We also expect there to be asymmetry between the two poles of the GAL‐TAN cleavage. Indeed, we anticipate TAN parties to be most alienated. These parties are often considered illegitimate by mainstream parties and voters, and this may underpin their lack of appeal beyond their core support. Yet there is reason to believe that the alienation of TAN goes deeper, and that it finds expression in both the extreme unwillingness of TAN supporters to consider voting for alternative parties and the extreme unwillingness of supporters of alternative parties to vote for TAN parties.
It is TAN parties that most vocally mobilize the grievances of the losers of the transformation of capitalist democracies over the past three decades (Kriesi et al., Reference Kriesi, Grande, Lachat, Dolezal, Bornschier and Frey2006). These parties find disproportionate support among the economically vulnerable and culturally alienated, including those who lack the educational qualifications to compete in the knowledge economy, semi‐skilled workers threatened by automation, those living in towns by‐passed by the information revolution and men who feel their status is threatened by GAL values (Abou‐Chadi & Kurer, Reference Abou‐Chadi and Kurer2021; Im et al., Reference Im, Mayer, Palier and Rovny2019; Pardos‐Prado, Reference Pardos‐Prado2020). TAN parties are reactionary, and like reactionary movements of the past, these parties and their supporters are defined by what they reject: in this case, immigration, European integration and the mainstreaming of ecological, feminist and libertarian values (Abou‐Chadi et al., Reference Abou‐Chadi, Cohen and Wagner2022; Anduiza & Rico, Reference Anduiza and Rico2022; Beramendi et al., Reference Beramendi, Häusermann, Kitschelt and Kriesi2015; Hooghe & Marks, Reference Hooghe and Marks2018). Correspondingly, these parties tend to have an ‘anti‐establishment identity’ (Melendez & Kaltwasser, Reference Meléndez and Kaltwasser2019). The distinctly reactionary character of TAN parties motivates our final hypothesis:
Hypothesis 4: TAN is the most distanced group in vote propensity in both directions: TAN as a subject (i.e., how TAN voters evaluate other parties) and as an object (how other voters evaluate TAN).
Data and method
To test these hypotheses, we make use of data from the 1999 (van der Eijk et al. Reference Van der Eijk, Franklin, Schoenbach, Schmitt, Semetko, van der Brug, Holmberg, Mannheimer, Marsh, Thomassen and Wessels1999), 2009 (van Egmond et al., Reference Van Egmond, van der Brug, Hobolt, Franklin and Sapir2013), 2014 (Schmitt et al. Reference Schmitt, Hobolt, Popa and Teperoglou2016) and the 2019 European Election Study voter surveys (Schmitt et al. Reference Schmitt, Hobolt, van der Brug and Popa2020). Because party competition in Central/Eastern Europe is distinctive (Rovny Reference Rovny2014) and the salience of GAL‐TAN conflict on immigration and European integration is of more recent vintage (Lancaster Reference Lancaster2022), the sample is limited to countries in Western Europe. We also exclude Cyprus, Luxembourg and Malta from the estimation sample. The countries that are included in the analyses are thus: Austria, Belgium, Denmark, Finland, France, Germany, Greece, Ireland, Italy, the Netherlands, Portugal, Spain, Sweden and the United Kingdom.
In the recent EES voter surveys, the samples for different countries all include roughly the same number of observations. In contrast, there is huge variation in sample sizes in the 1999 EES voter survey. We correct for this imbalance by applying a weight that ensures all countries in the 1999 data receive the same weight.Footnote 6
The dependent variable is a respondent's reported propensity to vote (PTV) for a party. Typically for the countries in our sample, respondents were asked to indicate their propensity for five to nine parties. The exact question wording for the PTV items is:
We have a number of parties in [country] each of which would like to get your vote. How probable is it that you will ever vote for the following parties? Please answer on a scale where 0 means ‘not at all probable’ and 10 means ‘very probable’.Footnote 7
For each survey wave, the data are stacked in long format so that the dataset includes as many rows for each respondent as the number of parties for which that respondent is asked to indicate their PTV. Conceptually, we are interested in studying how voters consider parties that are not their most preferred choices, and how their views are structured. Our focus is therefore on dyads that capture the connection between (1) the party a respondent voted for and (2) a party they are rating. We add to the dataset information about both parties, including the party family a party belongs to, as well as its positions on an economic left–right and a GAL‐TAN dimension. Information on these party‐level characteristics comes from the 1999, 2010, 2014 and 2019 waves of the Chapel Hill Expert Survey (Jolly et al., Reference Jolly, Bakker, Hooghe, Marks, Polk, Rovny, Steenbergen and Vachudova2022).Footnote 8 The dataset provides information on party ideology that we use to estimate the ideological distance between the political parties that respondents evaluate.Footnote 9
For analyses that focus specifically on differences between party families, we limit the dataset to seven party families: TAN, conservative, liberal, Christian‐democratic (including confessional), socialist, radical left and green. We exclude agrarian/centrist, regionalist and no‐family parties because these are only present in a few countries. Details on the parties that are included in the analyses and their coding in party families can be found in Supporting Information Appendix D.
To determine what party a respondent voted for, information on the reported vote in the European Parliament election is used. The advantage of using the EP vote measure is that the timing between the vote and the interview is similar across countries, which is not the case when using the recalled vote choice in the most recent national election. Even so, we verify whether our conclusions hold when we use the reported vote in the most recent national election to determine a respondent's party. We also test our results with partisanship as the indicator for a respondent's in‐party. As can be seen from Supporting Information Appendices E and F respectively, the findings are robust. Because the focus is on how electorates of specific parties view other parties, abstainers are excluded from the analyses.
Finally, even though the PTV has become an established measure for tapping citizen attitudes about parties (Paparo et al., Reference Paparo, De Sio and Brady2020), we verify whether our main conclusions hold when using like/dislike ratings of parties available in the Comparative Study of Electoral Systems (CSES) Integrated Module Dataset (CSES, 2020). These ratings tap affect towards parties, and serve as the foundation of much comparative work on affective polarization (Gidron et al., Reference Gidron, Adams and Horne2020; Reiljan, Reference Reiljan2020; Wagner, Reference Wagner2021). The results with CSES data are reported in Supporting Information Appendix B. While both PTVs and like/dislike ratings are strongly correlated (van der Eijk et al., Reference Van der Eijk, Van der Brug, Kroh and Franklin2006), we prefer PTVs because they provide a more direct measure of the extent to which voters would consider acting on their preferences by voting for alternative parties. This, we claim, sheds a sharper light on the extent to which the electorates of different parties have sorted into opposing camps.
The main findings reported in the next section rely on OLS estimations to explain respondents’ propensity to vote for specific parties. The data have a hierarchical structure, with dyads nested in respondents, cross‐nested in specific parties, and nested in countries. Correspondingly, standard errors are double‐clustered to account for correlated error terms at the individual‐ and the country‐levels (Yoo, Reference Yoo2020). To account for unobserved country‐level variation, the models include country fixed effects. For the analyses of change over time, we pool the data across EES waves and include an interaction term between the survey year and the distance variables of interest.
Results
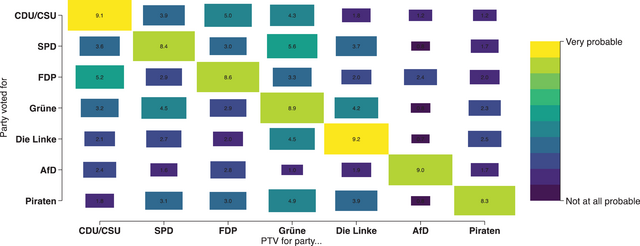
Before proceeding with the regression analyses, we present descriptives using the 2019 EES voter survey to illustrate the structure of the data. Figure 1 shows a heat plot that visualizes the voting propensities of German voters. The numbers in the boxes indicate the mean PTV score for a specific party combination. Larger boxes and lighter colors represent higher values.
Heat plot that shows the average PTV by electorate‐party combination, Germany 2019. [Colour figure can be viewed at wileyonlinelibrary.com]
Note: The heat plot is based on data from the 2019 EES voter survey. Rows are based on responses on the EP vote choice question and columns refer to the different party‐specific PTV variables included in the questionnaire. This visualization follows Harteveld (Reference Harteveld2021).

There are two ways of summarizing this information which inform our analyses. First, each row in Figure 1 conveys PTVs provided by voters for a particular party. So, for example, the row for the CDU/CSU conveys the propensity of CDU/CSU voters to ever vote for the array of competing parties. The PTV for CDU/CSU voters for the SPD is 3.9 and for Die Linke it is 1.8.
Second, each column conveys PTVs received by a particular party. For example, the column for the Grüne conveys the propensity of those who voted for all other parties to ever vote for the Grüne. As Figure 1 shows, the mean PTV for AfD voters rating their propensity to ever vote for the Grüne is 1.0, and the equivalent PTV for SPD voters rating their propensity to ever vote for the Grüne is 5.6.
Self‐evidently, the highest values are situated on the main diagonal of the plot in Figure 1 – which represents voters’ reported PTVs for the party they just voted for in the EP elections. The heat plot also clarifies that there is substantial variation in how voters evaluate out‐parties. This is the variation that concerns us, and which we theorize should reflect the structure of party competition in a specific country.
The PTVs for German respondents in the 2019 EES that are shown in Figure 1, provide some initial indication that the dimensions that structure party competition also inform how voters view the political space. For example, SPD voters rate as fairly high the probability they would ever vote for die Grüne – a party that is on the same side as the SPD on both the economic and the GAL‐TAN dimensions. In contrast, SPD voters rate as very low the likelihood that they would ever vote for the AfD. Furthermore, both the column and the row that include the smallest boxes are associated with the AfD, which is in line with our expectation that TAN is the most distanced party family.
Of course, the German case is just one specific context, and we now turn to comparative analysis to verify whether these patterns generalize. We consider each of our four hypotheses in turn.
Spatial location and voters’ views on party competition
We start with a test of the hypothesis that party location in the dimensional space informs how likely voters ever are to vote for an alternative party (H1). In line with spatial theory, the expectation is that spatial distance is negatively associated with vote propensity. We estimate the spatial distance between a respondent's party and each of the other parties with CHES estimates for party positioning on the economic left–right and GAL‐TAN dimensions.
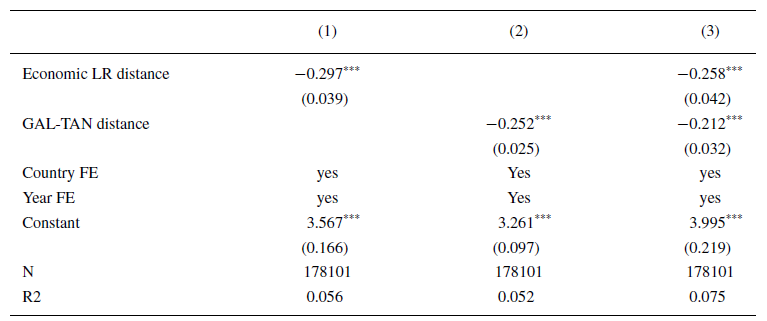
Table 1 reports the results using the fully pooled data of the four EES voter surveys (i.e., 1999, 2009, 2014 and 2019). In each model, a voter's PTV for each of the parties they did not vote for is regressed on spatial distance between the party that the respondent voted for in the previous European Parliament election and each alternative party.
Explaining PTV with ideological distance between party voted and party evaluated, pooled data

Note: EES 1999, 2009, 2014 and 2019 survey data for 14 countries. Estimates from OLS estimations with country and year fixed effects (not shown) and cluster standard errors by respondent and country. PTVs for a voter's own party are not included. Significance levels:
* p < 0.05,
** p < 0.01,
*** p < 0.001.
Model 1 estimates the linear effect of distance on economic left–right and Model 2 does this for GAL‐TAN. In line with our first hypothesis, distance on both dimensions is strongly and negatively associated with PTVs, with the effect of GAL‐TAN distance somewhat weaker than economic left–right. This is further confirmed in Model 3 which simultaneously assesses the association between PTVs and economic left–right and GAL‐TAN distance. To ease interpretation, the scales for PTVs have the same 0–10 format as those for economic left–right and GAL‐TAN party positioning. Based on Model 2, for example, a party that is one GAL‐TAN unit further from the party that a respondent voted for in the prior EP election will, on average, receive a PTV 0.25 points lower, plus or minus 0.03. When we specify the two dimensions in Model 3, both have a significant effect, again with GAL‐TAN being slightly weaker.Footnote 10
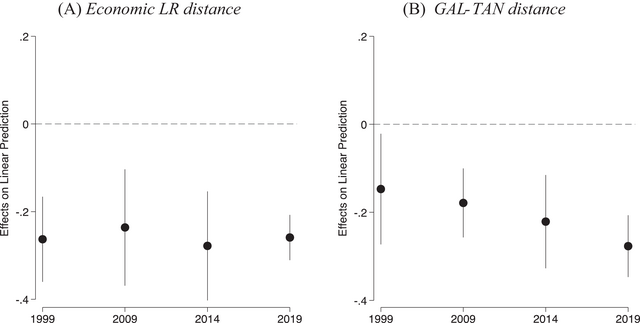
To evaluate the hypothesis that the GAL‐TAN dimension has gained strength relative to the economic left–right dimension over the past two decades (H2), we add, to the estimation, interactions between the survey years and the two indicators of spatial distance. The estimates of this analysis are visualized in Figure 2 and reported in detail in the Supporting Information Appendix H. The left–hand panel in Figure 2 shows the average marginal effect of a one unit increase in economic left–right distance between parties, on respondents’ propensity to vote for a party, by election year. The right‐hand panel shows the estimates for GAL‐TAN distance. Starting with the effect of economic LR distance on PTVs, it is very stable over time – fluctuating around an effect of about −0.25 across the EES rounds. The implication is that in a fairly constant fashion, between 1999 and 2019, a one unit increase in economic left–right distance between the party citizens vote for and the party they are evaluating is associated with a quarter of a point lower PTV for the party that is being evaluated.
Average marginal effect of distance on PTVs, change over time.
Note: EES 1999, 2009, 2014 and 2019 survey data for 14 countries. Estimates indicate the average marginal effect of a one unit change in distance on the PTV for a party. Estimates from OLS models that include interactions between survey‐year and the distance variables. Spikes indicate 95 per cent confidence intervals. Supporting Information Appendix H reports detailed estimates.

In line with our second hypothesis, the right‐hand panel in Figure 2 provides more evidence of change in the impact of GAL‐TAN distance. And the changes are substantively quite important. In the 1999 EES survey, the estimated average marginal effect of a one‐unit increase in GAL‐TAN distance is −0.15. This effect is statistically distinguishable from zero but moderate in size, and smaller than the effect of economic left–right distance. Over time, the effect of GAL‐TAN distance gains strength. In the 2009 survey, the estimated AME of GAL‐TAN distance is −0.17, which further increases to −0.22 in 2014 and −0.28 in 2019 – about twice the size of 1999. To be sure, the change is gradual, but as the estimates in Supporting Information Appendix H confirm, by 2019, the effect of GAL‐TAN reaches a point whereby it differs significantly from the effect at the start of the time series.
Green versus TAN
Green and TAN parties take polar positions on the transnational cleavage, and we expect to see this reflected in voters’ PTVs. Specifically, we anticipate vote propensity to be lowest between TAN voters and green voters (H3).
This becomes apparent when we compare the PTVs for different party family combinations. The focus is on differences between party families, using the party family categorizations from the CHES data. To assess the role of party families, we include a series of dummy variables in an OLS estimation of respondents’ PTVs. These variables identify party family combinations, based on the family of the party a respondent voted for and the family of the party for which they are indicating their PTV. The estimations thus tell us how the electorates of different parties, categorized by party family, assess all other parties in the party system.
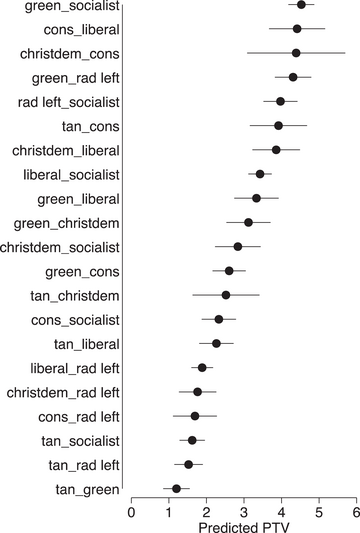
Here we focus on the results using the data from the 2019 EES voter survey.Footnote 11 The estimates are in Supporting Information Appendix I, and we visualize the results here in terms of predicted PTVs by party dyad. Each row in Figure 3 averages vote propensities between two party families. For example, in the first row of Figure 3 the propensity of green voters to ever vote for the TAN party is averaged with the propensity of TAN voters to ever vote for a green party.Footnote 12 Party‐dyads are arrayed from high to low PTV.
Predicted PTV by party family dyad.
Note: EES data for 2019. Circles indicate the predicted PTV level for all voters. Estimates obtained from the OLS estimation with country fixed effects and cluster standard errors by respondent and country (reported in Supporting Information Appendix I). Spikes indicate 95 per cent confidence intervals.

The combined PTV for the TAN/green dyad is at 1.20 on a 10‐point scale – the lowest among all party family dyads (H3). As one would expect if a transnational cleavage is taking root, TAN parties are most distanced from all other party families. The three dyads with the lowest PTVs all involve TAN parties. The second most distanced party family is the radical left, the extreme left party family on the older class cleavage.
Distanced TAN
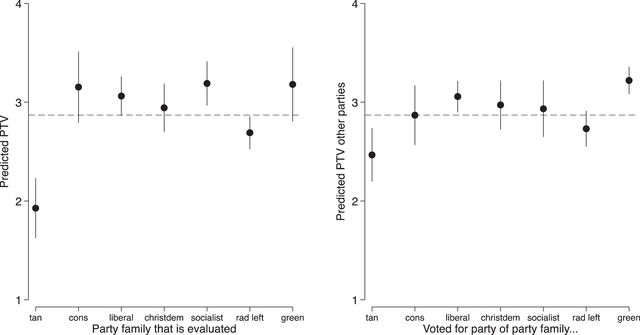
A corollary of the rise of a transnational cleavage is that the chief challengers – TAN parties – should be most distanced from all others (H4). There are two parts to the hypothesis. The first part focuses on vote propensities aggregated by political party. This tells us which parties have the highest vote propensities for all voters, excluding parties for which a respondent actually voted. Here our expectation is that TAN parties should have the lowest PTVs because these parties are the most radical threat to the status quo. The second focuses on vote propensities aggregated by party constituency. This tells us which parties have constituencies with the highest, middling, or lowest propensities to vote for other parties. Here our expectation is that TAN voters have the lowest propensity to vote for other parties. We again focus on the results using the 2019 EES voter survey, the point in time the transnational cleavage is most firmly rooted.
We find that TAN parties and their voters are most distant in both respects. We begin with the left graph in Figure 4, which plots the propensity of all respondents to vote for a party based on an OLS estimation that includes country fixed effects and clusters standard errors by respondent and country. The estimation includes a series of dummy variables that identify the party family of the party for which the PTV is reported. PTVs for the party a respondent voted for in the EP elections are excluded from the estimation. The average PTV for a party that respondents did not vote for is 2.87, which is indicated by the dashed horizontal line in the graph. TAN parties stand out as on average the least likely party to be voted for, with a PTV of 1.92 (± 0.30) that is significantly lower than any other party family, including the radical left.
Predicted vote propensity (PTV) for party families and their voters.
Note: EES data for 2019. Left panel = how voters from other party families evaluate a particular party family; right panel = how a particular party family constituency evaluates political parties in other party families. OLS regression with country dummies and cluster standard errors by respondent and country. Spikes indicate 95 per cent confidence intervals. The dashed horizontal line indicates the sample average.

The right‐hand panel in Figure 4 depicts the same information from the perspective of the voting constituencies of parties. It shows that TAN voters have the lowest propensity to vote for other political parties at 2.46 (± 0.29). This is in line with H4 though TAN voters are not significantly different from all other party family constituencies. Interestingly, voters for green parties attest the highest propensity to vote for other parties, which places in sharp relief the earlier finding that green and TAN parties are most distant from each other. Remarkably, green voters are relatively favourably disposed to voting for alternative parties with one glaring exception – TAN parties.
In Supporting Information Appendix L, we report the results of equivalent estimations using earlier EES voter surveys. These analyses show that the electorates of other parties consistently give the lowest PTVs to TAN parties. In terms of the views of the TAN electorate, it appears that the self‐isolation of TAN voters can be discerned in 2019 but not in earlier EES waves. It could be that only by 2019 was the salience of the GAL‐TAN cleavage sufficiently high to lead TAN voters to distance themselves from other parties. Without evidence from more recent election surveys, we cannot exclude the possibility that the 2019 survey data constitute an outlier.
Party family or spatial location?
So far, our analyses suggest that voters report their vote propensities as if they have a reasonably structured idea of the ideological space. Our results also provide evidence of substantial shifts in voters’ views of the structure of party competition between 1999 and 2019. We find an increased weight of parties’ positions on the GAL‐TAN dimension, and that this is particularly pronounced for the parties that anchor the new cleavage, TAN and green parties.
Here we bring these strands together to clarify how both spatial location and party family inform a voter's perspective on party competition. The approach taken here is to assess to what extent the differences between party family dyads can be explained by spatial location, and how this has changed over the past two decades. We select the earliest and most recent data point and estimate four OLS models for 1999 and four models for 2019Footnote 13 in which we focus on the changes in the size of the coefficients of the party family dyad dummies. For both years, we estimate four models: one model with party family alone; one controlling for spatial distance on the economic left–right; one controlling for spatial distance on GAL‐TAN; and one that controls for both dimensions. All models include country dummies and cluster standard errors by respondent and country. We are interested in assessing by how much the coefficients for the party dyad dummies are reduced when we account for the different measures of distance.
The reference category in all models is the green‐socialist dyad, which is the party family dyad for which PTVs are highest overall. We thus assess by how much the difference between a specific party family dyad and the green‐socialist dyad is reduced when we account for the economic left–right distance between parties, the GAL‐TAN distance, and both – this results in three sets of comparisons of coefficients between the baseline model and a model that accounts for one or both indicators of spatial locations.
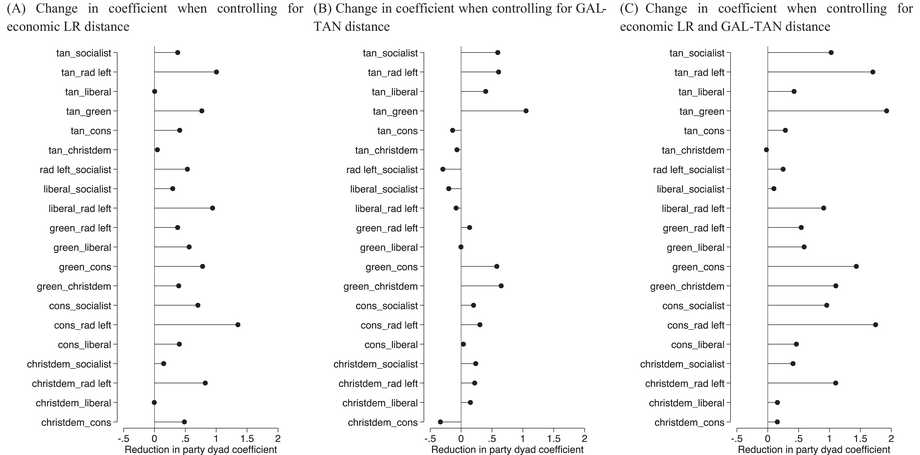
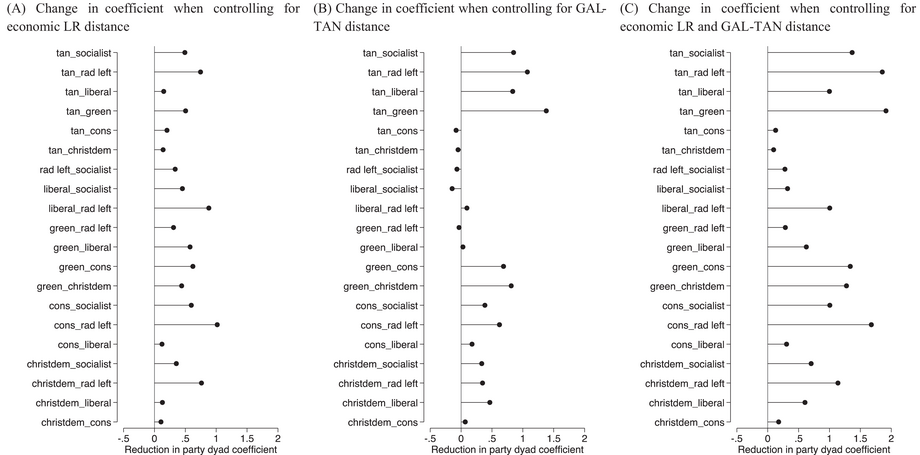
Figures 5 and 6 visualize the main results in the form of dropline plots for the 1999 and 2019 survey waves, respectively. In each panel, the dots indicate by how much the coefficient of a specific party family dyad is reduced when controlling for ideological distance. For example, the left–hand panels in Figures 5 and 6 indicate how much smaller each of the party family dyad‐coefficient becomes in a model that accounts for economic left–right distance vis‐à‐vis a model that only includes party family dyad dummies. Full results for all estimations can be consulted in Supporting Information Appendix N.
Change in the coefficients of party family dyads when accounting for economic left–right and GAL‐TAN distance, 1999 EES. (A) Change in coefficient when controlling for economic LR distance. (B) Change in coefficient when controlling for GAL‐TAN distance. (C) Change in coefficient when controlling for economic LR and GAL‐TAN distance.

Change in the coefficients of party family dyads when accounting for economic left–right and GAL‐TAN distance, 2019 EES. (A) Change in coefficient when controlling for economic LR distance. (B) Change in coefficient when controlling for GAL‐TAN distance. (C) Change in coefficient when controlling for economic LR and GAL‐TAN distance.

Three things stand out. First, spatial location is instrumental in explaining why voters from one party are unlikely to ever vote for another party family. This is apparent from the fact that in a large majority of cases, the dots in Figures 5 and 6 are to the right of the zero line – signifying a reduction in the coefficient of the party family dyad dummies when controlling for dimensional distance. Overall, in 1999, information about spatial location narrowed the difference between the predicted PTVs of the baseline model by 0.81 points, a 39 per cent reduction on average. In 2019, spatial location narrowed the difference by 1.14 percentage points, a 70 per cent reduction on average.
Second, GAL‐TAN has strengthened as a spatial cue for vote preference. In the 1999 data, the coefficients of the party family dyads are on average 0.20 smaller when the GAL‐TAN distance between parties is controlled for. In 2019, the reduction is almost double the size, of 0.39 points on average. Hence the rise of GAL‐TAN in party competition appears to be reflected in the rising power of GAL‐TAN distance in voter decision making. Visually, this is apparent by comparing the length of the lines in panel (b) of Figure 6 (2019) with those in panel (b) of Figure 5 (1999).
Third, party family remains a strong predictor of PTV under spatial controls. If party family differences could be reduced to spatial distance, none of the lines in the panels (c) would be close to the zero line. This is clearly not the case.Footnote 14 Furthermore, in some instances the estimate for the reduction in coefficient size is to the left of the zero line, meaning the effect of specific party families increases when accounting for the spatial distance between parties. What this suggests is that these PTVs differ more strongly from the reference (the green/socialist dyad) than we would expect based on the spatial distance between the parties in the dyad. A cleavage approach does not foresee that every party family will structure voting equally; rather, it guides one to identify the partisan challengers to the status quo. On the transnational cleavage, these are TAN parties, and the estimates in Supporting Information Appendix N show that five of the seven party dyads with the greatest residual PTV gap in both 1999 and 2019 involve TAN parties.
Challenges
The results of our analyses, as summarized in the previous section, are broadly consistent with the predictions from cleavage theory. We find evidence that the relative weight of the GAL‐TAN dimension gradually increases over time; that the opposition between parties on the GAL and TAN ends of the transnational cleavage is strongest; and that views of TAN parties stand out. Even though the results fit our theoretical expectations, they can be challenged in several ways.
A first challenge relates to the particular role of TAN parties in driving the results. Specifically, while the results fit our theoretical expectations of an emerging transnational cleavage, an alternative account would be that the patterns are entirely driven by a stigmatization of TAN parties. For a number of reasons, we think that stigmatization is at best only part of the story. First, if stigmatization were driving the results, we would find that TAN parties are isolated, but not that there is an especially strong opposition between TAN parties and parties on the GAL‐side of the transnational cleavage. Second, in an additional analysis in which we exclude PTVs for green and TAN parties from the estimation, we still find indications of GAL‐TAN distance gaining weight over time. The results of this analysis, which are reported in Supporting Information Appendix O, suggest that the growing importance of the transnational cleavage in voters’ views of party competition is not entirely driven by a change in the party offer and even affects views of parties that are not taking extreme positions on the transnational cleavage. Third, we conducted an in‐depth analysis of citizens’ views of political parties in the Danish context – a precursor in terms of the emergence of the transnational cleavage and the rise of TAN parties, and a setting where TAN representation has been normalized (McDonnell et al. Reference McDonnell, Werner and Karlsson2021). The results of our analyses of the Danish case, which can be consulted in Supporting Information Appendix P, show patterns that are consistent with those reported based on our analysis of EES voter survey data. That is, the opposition between parties on the GAL and TAN sides of the transnational cleavage is particularly pronounced.
Next, some of the methodological choices could be a source of concern. In response, we conducted a number of additional analyses to reassure readers that our results are not driven by method. First, it is worth recalling that our findings are not specific to the dependent variable of choice: respondents’ self‐reported propensities to vote for different parties. Using citizens’ like/dislike ratings of parties by means of the data from the CSES project, we also find evidence of a strong impact of GAL‐TAN distance, and of much opposition between parties on the GAL and TAN ends of the cleavage (see Supporting Information Appendix B). Second, we have verified that our results with respect to over‐time change are not driven by a single country. As can be seen from Suporting Information Appendix Q, a jackknife test in which we drop one country at a time from the analyses, consistently shows the largest effect of GAL‐TAN distance in 2019. Third, one of our main findings concerns the fact that party family remains a strong predictor of citizens’ views of parties even after the spatial distance between parties is accounted for. In our main analyses, we operationalize distance by means of expert information on the positions of parties on different ideological dimensions. However, it could be argued that citizens’ perceptions of where parties are positioned differ from how experts view party positions and that this difference results in a limited explanatory effect of the CHES‐based distance indicators in Figure 5. Fortunately, the Danish election study data that we referred to before, also include measures of citizens’ perceptions of party positions on different issues, allowing for a replication of the analyses based on perceptual distance measures. As shown in Supporting Information Appendix P, these supplementary analyses also lead to the conclusion that party family effects cannot be accounted for by the spatial distance between parties.
Finally, our inquiry could be broadened to include additional dimensions, such as positions on European integration, which may also structure voting (Bakker et al. Reference Bakker, Jolly and Polk2012). Supportin Information Appendix R shows that distance between parties on European integration appears to shape PTVs, though it is (a) weaker than distance on economic left–right and GAL‐TAN, (b) relatively constant over time. Moreover, the coefficients for economic left–right and GAL‐TAN are robust in models that include European integration.
Conclusion
Across Western Europe, the transnational cleavage is leaving a deep imprint on how parties position themselves. One implication is that the structure of party‐political conflict has become two‐dimensional, with a rising salience of GAL‐TAN issues alongside economic left–right issues. Does this mean, though, that voters also see party competition through the lens of these dimensions? Our purpose in this article is to shed light on the implications of cleavage theory for voters’ party preferences. We seek to uncover to what extent voters evaluate the dimensional location of alternative parties when they consider their electoral choice, and if so, whether they do so increasingly through a GAL‐TAN lens.
We assess the validity of three expectations grounded in cleavage theory: (1) GAL‐TAN has come to shape citizens’ views of party competition, and the economic left–right dimension is declining; (2) political parties that take polar positions on the transnational cleavage are most distanced in terms of voting preferences; and (3) the party most associated with the rise of the new cleavage is least preferable to other voters, and its voters are the least willing to vote for alternative parties.
Using information on respondents’ PTVs from EES voter surveys, we find strong support for each of these claims. Our empirical analyses testify to the gradual emergence of the transnational cleavage across Western Europe as the weight of GAL‐TAN positions for citizens’ views of party competition strengthens over time. We also find that green and TAN electorates are polar opposites in terms of their voting propensities. Finally, we detect that TAN parties and their voters stand out as the most isolated in their respective party systems. Each of these should be expected outcomes if the restructuring of party systems across Western Europe is indeed visible to voters and consequential for their electoral choice.
The thrust of this paper is to examine how cleavages inform citizen views of the party offer. However, we are fully cognizant that the connection between citizen perceptions and cleavages is bi‐directional. While cleavages constrain how voters perceive parties, voters are also active participants in cleavage formation and reproduction. Cleavages demarcate ‘the constellations of alternatives; in which voters seek voice for their grievances and parties articulate—and shape—voter preferences (Lipset & Rokkan, Reference Lipset, Rokkan, Lipset and Rokkan1967, p. 2). Future work should examine this interaction explicitly. Our analysis suggests that voters do indeed think about politics in dimensional terms and are responsive to a changing cleavage structure. This reinforces E.E. Schattschneider's (Reference Schattschneider1960, 65, 66) point that ‘conflicts compete with each other. …Politics deals with the domination and subordination of conflicts’.
Acknowledgements
Previous versions of this paper were presented at the Aarhus Party Politics Seminar, at the SPARC Seminar at the University of Lisbon and at the ‘Affective Polarization: A Challenge for Electoral Democracy’ workshop at SciencesPo Paris. We thank all participants for insightful suggestions and feedback and are especially grateful to Christoffer Green‐Pedersen, Henrik Seeberg, Rune Stubager and Eelco Harteveld for suggestions that have strengthened the paper. We also thank the editors and anonymous reviewers at the European Journal for Political Research for their comments and suggestions. Ruth Dassonneville thanks the EUI's Robert Schuman Centre for the excellent research conditions they provided through a Jean Monnet Fellowship. Liesbet Hooghe and Gary Marks acknowledge financial support by the Advanced ERC grant TRANSNATIONAL #885026.
Online Appendix
Additional supporting information may be found in the Online Appendix section at the end of the article:


 Open access