
[A] complete study must not confine itself to the group, but must especially notice the environment: the physical environment of the city, sections and houses, the far mightier social environment—the surrounding world of custom, wish, whim and thought which envelopes this group and powerfully influences its social development.
—W. E. B. Du Bois, “The Problem,” The Philadelphia Negro: A Social Study (1899, p. 5)
INTRODUCTION
Over a century ago, sociologist W. E. B. Du Bois documented the physical and social environments in which “the Philadelphia Negro” lived, worked, and sought to maintain health and well-being. Recognizing the role of historical and contemporary processes that contributed to social, economic, and political marginalization, Du Bois’s comprehensive study used mapping and social and economic data to examine multiple dimensions of what are now commonly referred to as social determinants of health, including, for example: education; employment opportunities; income; and “suffrage,” or political participation, among residents of Philadelphia’s Seventh Ward between 1896-1897. Du Bois expressed his belief that the role of scientific research was to inform efforts to address social problems, noting that “until [the student] has prepared the ground by intelligent and discriminating research, the labors of philanthropists and statesmen must continue to be, to a large extent, barren and unfruitful” (1899, p. 47).
Du Bois’s systematic research to quantify characteristics of social and physical environments and to locate them within the context of broader social, economic, and political processes remains relevant today, over 100 years later. There is growing interest in the role of “place” in generating and sustaining persistent inequities in health, building on evidence that communities of color and low-income communities are not only disproportionately exposed to hazardous physical environments, but also less likely to have access to social, economic, and political resources with which to mitigate the adverse health effects of those exposures (Collins et al., Reference Collins, Grineski, Chakraborty, Montgomery and Hernandez2015; Huang and London, Reference Huang and London2012; Mohai et al., Reference Mohai, Lantz, Morenoff, House and Mero2009). The uneven distribution of exposures that may harm health as well as lack of resources needed to promote health are associated with health inequities and are reflected in differential rates of morbidity and mortality across racial, ethnic, and socioeconomic groups (Commission on the Social Determinants of Health 2008; Dankwa-Mullan et al., Reference Dankwa-Mullan, Rhee, Williams, Sanchez, Sy, Stinson and Ruffin2010; Mujahid et al., Reference Mujahid, Diez Roux, Morenoff, Raghunathan, Cooper, Ni and Shea2008).
In addition to differential risks of exposure, there is also evidence that some groups experience more adverse health effects than others when exposed to hazards in the physical environment. For example, children breathe in a greater volume of air—and therefore air pollutants—per unit of body weight than adults, and thus are more vulnerable to adverse health effects at any given level of air pollution (Agency for Toxic Substances and Disease Registry 2012). Similarly, elderly people tend to experience more adverse health effects, due in part to increased prevalence of conditions such as cardiovascular disease and impaired lung function. Thus, identifying geographic areas with greater proportions of such vulnerable populations and prioritizing those areas for interventions and policies to mitigate adverse effects of physical environmental exposures may be an important priority in reducing the adverse health effects of environmental exposures (Fann et al., Reference Fann, Lamson, Anenberg, Wesson, Risley and Hubbell2012).
Recognition of the multiple ways in which characteristics of places, and the populations residing in those places, may contribute to health inequities has spurred efforts to move beyond scientific and regulatory frameworks that focus on a single aspect of the physical environment (e.g., particulate matter) toward those that examine combinations of physical environmental exposures (e.g., multiple air pollutants), as well as the social and individual characteristics of populations residing in those areas that may place them at heightened risk (e.g., air pollution plus poverty) (Huang and London, Reference Huang and London2012; Sadd et al., Reference Sadd, Pastor, Morello-Frosch, Scoggins and Jesdale2011; Su et al., Reference Su, Morello-Frosch, Jesdale, Kyle, Shamasunder and Jerrett2009). These efforts hold promise as approaches to identify and address cumulative risks. In this paper, we apply two such approaches (described in detail below) to examine the patterning of exposure to air pollution and its associated health risks by racial and socioeconomic characteristics of Census tracts in the Detroit metropolitan area.
BACKGROUND
Among the most segregated regions in the nation, the Detroit metropolitan area is comprised of three Michigan counties: Macomb, Oakland, and Wayne County (see Figure 1). As of 2010, there were 3,863,924 people living within this tri-county area and 713,777 people residing within the city of Detroit, located on the eastern corner of Wayne county (U.S. Census Bureau 2010). Numerous factors have contributed to this racial segregation. Detroit and the surrounding region once ranked among the nation’s largest metropolises, with industrial jobs drawing African Americans from Canada and the South, and residents from Mexico in the early 1900s (Farley et al., Reference Farley, Danziger and Holzer2000). Restrictive agreements that prohibited racial and ethnic groups from living in certain parts of the city were prominent in Detroit prior to 1948 (Sugrue Reference Sugrue2014). “White flight” from the city to suburbs was fostered by federal investments through highway funds and business tax incentives that led many businesses to move to suburban communities (Sugrue Reference Sugrue2014). As central city factories relocated to suburban areas, racial discrimination in the real estate market, including federally-backed home mortgages available to Whites but not African Americans, perpetuated segregation and reduced African Americans’ access to suburban employment opportunities (Farley et al., Reference Farley, Danziger and Holzer2000; Sugrue Reference Sugrue2014).
Proportion people of color at the Census tract level—Detroit Metropolitan Area.
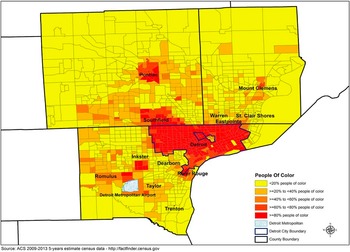
Today’s tri-county area reflects these historical processes, with Oakland and Macomb counties maintaining populations that are 76.5% and 82.9% White, respectively. Substantial proportions of African American residents are clustered in the urban communities of Pontiac, Southfield, and Oak Park in Oakland County, and Centerline, Eastpointe, Mount Clemens, Roseville, and Warren in Macomb County. Wayne County is 54.8% White, with 85% of its African American population located in Detroit City, and sizable populations of African Americans in the cities of Taylor and Inkster in central Wayne County (see Figure 1). Southwest Detroit is home to a long-standing Latino community, with roots extending back nearly a century (Rodriguez Reference Rodriguez2011), comprising about 7% of Detroit’s population in 2010 (U.S. Census Bureau 2010). African Americans and Latinos across the tri-county area make up a significantly larger proportion of households below the federal poverty line. Over 50% of Detroit’s children live in households below the poverty line (Data Driven Detroit 2010), compared to 37%, 20%, and 13% in Wayne (including Detroit), Macomb, and Oakland counties, respectively (U.S. Census Bureau 2010).
While historical processes initiated these patterns, it is the contemporary unequal distribution of resources and opportunities at the regional level that currently reinforces the segregation of African American and Latino residents in aging, urban areas where they disproportionately experience economic divestment along with limited educational and employment opportunities (Bell and Lee, Reference Bell and Lee2011; Pastor et al., Reference Pastor, Dreier, Grisby and Lopez-Garza2000; Sugrue Reference Sugrue2014). Recent findings that Black residential dissimilarity and spatial isolation, two measures of racial segregation, were powerful predictors of foreclosures across U.S. metropolitan areas suggest the continued relevance of race-based residential segregation in shaping patterns of economic disinvestment and in the impoverishment of disproportionately African American and Latino urban residents (Rugh and Massey, Reference Rugh and Massey2010). A substantial literature documents the increased vulnerability of residents of low- to moderate-income urban communities and communities with high levels of race-based residential segregation to environmental risks (for a recent example, see Clark et al. Reference Clark, Millet and Marshall2014). Others have suggested additional characteristics that may contribute to increased vulnerability—for example, low levels of education or linguistic isolation—that may reduce the ability of residents to access information about adverse effects of pollutants, thus reducing the ability to respond in ways that are protective (e.g., reducing physical activity during periods of peak pollutants) or to advocate with policy- and decision-makers for health-protective actions. Relatively few studies have examined combined exposures to physical environmental risks and social and economic vulnerabilities (Morello-Frosch et al., Reference Morello-Frosch, Zuk, Jerrett, Shamasunder and Kyle2011).
In this paper, we apply and extend approaches used by Du Bois to examine the implications of these historical processes for the contemporary distribution of multiple environmental risks by race, ethnicity, and socioeconomic status in the Detroit metropolitan area. In particular, we examine: (1) physical environmental exposures at the Census tract level; (2) their distribution according to indicators of social, economic, and physical vulnerabilities of residents; and (3) the distribution of combined physical environmental exposures and social, economic, and physical vulnerabilities in the Detroit metropolitan area. Our first aim is primarily descriptive, mapping the distribution of proximity of populations to hazardous land uses (e.g., railroads, freeways), exposure to air pollutants and associated health risks, and vulnerabilities (e.g., poverty, young age), across Census tracts in the Detroit metropolitan area. Our second aim is to measure the extent to which there are inequalities in exposure and health risks by the racial composition of Census tracts in the Detroit metropolitan area. We also measure inequalities in exposure and health risks by socioeconomic and age-related characteristics of Census tracts, and associations between socioeconomic and age-related characteristics of Census tracts with racial composition, in order to disentangle their individual and joint associations. Finally, we measure the extent to which there are inequalities in cumulative risk, defined as the combination of physical environmental exposures and health risks with cumulative vulnerability, by racial and ethnic composition at the Census tract level. Together, pursuit of these research aims contributes to an understanding of the contemporary distribution of cumulative environmental risk and vulnerability in relation to racial and ethnic composition of Census tracts within the Detroit metropolitan area.
METHODS
The study was conducted as part of Community Approaches to Promoting Healthy Environments, a community-based participatory research (CBPR) partnership designed to equitably engage community, academic, and health service provider organizations in research and the translation of results from that research into action to promote health equity. Footnote 1 The University of Michigan granted institutional review board approval for this study on January 24, 2013.
Data
Data for the analyses described below are drawn from a number of sources, informed by methods developed by Rachel Morello-Frosch and colleagues (Reference Morello-Frosch, Zuk, Jerrett, Shamasunder and Kyle2011). Information on hazardous facilities and land uses were drawn from: the Toxic Release Inventory (EPA 2015c); addresses of chrome platers (Yellow Pages 2015); the Department of Environmental Quality (2015) (treatment, storage, and disposal facilities); the U.S. Department of Commerce (2015a) (railroad tracks and facilities); the Michigan Department of Transportation (2015b) (ports); the U.S. Department of Commerce (2015b) (major freeways, roads); the South East Michigan Council of Government (SEMCOG 2008) (airports); the Michigan Department of Environmental Quality (2015) (refineries); and the Michigan Department of Transportation (2015a) (intermodal facilities). Information on health risks and exposures to air pollutants were drawn from the EPA’s National-Scale Air Toxics Assessment for Diesel Particulate Matter (non-cancer; a mixture of particles that is a component of diesel exhaust) (EPA 2015b) and the EPA’s Cancer Risk and Respiratory Risk assessments (EPA 2015a). Demographic data were drawn from the 2009-2013 American Community Survey (U.S. Census Bureau 2013) to assess social and physical vulnerabilities (described below).
Measures
The Cumulative Risk Index (CRI) is adapted from an index created by a California-based team (Morello-Frosch et al., Reference Morello-Frosch, Zuk, Jerrett, Shamasunder and Kyle2011; Sadd et al., Reference Sadd, Pastor, Morello-Frosch, Scoggins and Jesdale2011). Items in the index are grouped into three areas: hazardous facilities and land uses; exposure and health risks; and vulnerabilities. We describe each below, including adaptations made to indices. Indices used in this analysis were constructed for the Detroit metropolitan (tri-county) area.
The initial step involves construction of a base map that indicates residential areas and land uses where sensitive populations may be present (e.g., child care facilities, health care facilities, schools, urban playgrounds). These indicators aid identification of areas (or polygons) where people live or where sensitive populations are found. Strictly industrial or commercial areas are not included in the base map. Polygons are roughly the size of a city block. The base map is used to geographically link residential and sensitive land use polygons with Census tract-level metrics in each of the three categories of cumulative exposure and risk described below (hazardous facilities and land uses, exposure and health risks, and vulnerabilities) to create a cumulative impact (CI) score for each polygon. As described below, the CI score is used to rank neighborhoods within a region according to their level of cumulative or combined risk across the three categories. Henceforth, the residential and sensitive land use polygons are referred to as CI polygons.
Hazardous Facilities and Land Uses. This category captures the location of stationary hazardous land uses in relation to residential areas and sensitive land uses (e.g., schools, hospitals). Following the California methodology (Morello-Frosch et al. Reference Morello-Frosch, Zuk, Jerrett, Shamasunder and Kyle2011; Sadd et al., Reference Sadd, Pastor, Morello-Frosch, Scoggins and Jesdale2011), we used the following indicators: hazardous facilities (Toxic Release Inventory [TRI], chrome platers, and hazardous waste sites); and hazardous land uses (railroad facilities, ports, roads, airports, refineries, and intermodal transportation facilities). To create this measure, 1000-, 2000-, and 3000-foot buffers were constructed around each CI polygon in the base map. The number of hazardous facilities and land uses within each buffer distance was determined for each CI polygon. Drawing on James Sadd and colleagues (Reference Sadd, Pastor, Morello-Frosch, Scoggins and Jesdale2011), the 1000-foot buffer accounts for proximate threats to health, as effects are generally greatest within 300m-500m of such facilities (Health Effects Institute 2010). The larger buffer distances (i.e., 2000, 3000 feet) recognize that commercial transportation corridors and hazardous facilities may burden resident health beyond the radius of 1000 feet in diverse ways, for example, noise pollution, injury, and general impacts on quality of life. A distance weighted score was calculated for each polygon, with those within the 1000-foot buffer assigned a weight of 0.6, those > 1000 feet but < 2000 feet assigned a weight of 0.3, and those > 2000 feet but <= 3000 feet assigned a weight of 0.1. These weights modify the California methodology to derive weights that sum to 1 (Kish Reference Kish1986). Tract-level scores were then created that rank ordered exposure to hazardous land uses for each CI polygon. The rank ordered CI polygons were divided into quintiles according to exposure to hazardous land uses, with each CI polygon receiving a score of 1 (low) to 5 (high) indicating its relative exposure to hazardous land uses compared to other CI polygons in the group.
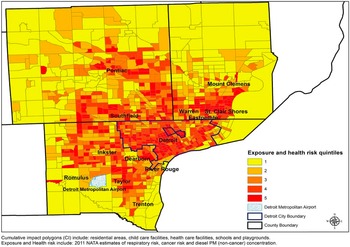
Pollution Exposure and Health Risk. The second component of the CRI includes three metrics of air pollution and health risk: Diesel PM (non-cancer results), estimated respiratory hazard, and estimated cancer risks. Each of these exposures was calculated at the Census tract level. Raw measures were weighted by the proportion of the Census tract that was residential or sensitive land use. Intermediate scores for each health risk and exposure metric were calculated based on quintile distribution rankings, ranging from 1 (low) to 5 (high), and applied to each tract in the study area.
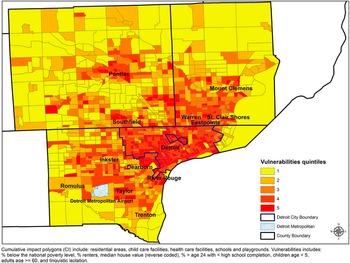
Vulnerability Index. The vulnerability index, also constructed at the Census tract level, is made up of items reflecting social and economic indicators that are often associated with increased likelihood of proximity to hazardous land uses or exposure to air pollutants and their associated health risks (Bullard et al., Reference Bullard, Mohai, Saha and Wright2007, Huang and London, Reference Huang and London2012), and indicators associated with heightened or more adverse responses to pollutant exposures. These include: percent of households below poverty; mean median home value (reverse coded); percent of homes occupied by renters; percent of population over age twenty-four with less than a high school education; linguistic isolation (percent of residents who live in households with no adults who speak English); percent of population under age five; and percent of population over age sixty, at the Census tract level. The California methodology incorporated percent people of color (total non-White population/total population) in their vulnerability index, along with the items above (Sadd et al., Reference Sadd, Pastor, Morello-Frosch, Scoggins and Jesdale2011), reflecting literature suggesting that Census tracts with greater proportions people of color are more likely to be exposed to environmental hazards (Clark et al., Reference Clark, Millet and Marshall2014). Because of our interest in addressing specifically the question of the extent to which indicators of cumulative risk were disproportionately distributed in areas with greater concentrations of people of color, our version of the vulnerability index included all of the items above with the exception of proportion of people of color. This allowed us to explicitly test the question of the extent to which cumulative vulnerability and cumulative risk were (in)equitably distributed by Census tract proportion people of color. These analyses are described in greater detail below. In addition, we also conducted analyses of inequality using individual indicators of social, economic, and age-related vulnerability separately. As above, Census tracts were rank ordered according to their vulnerability indicators scores, and scored as quintiles ranging from 1 (low) to 5 (high).
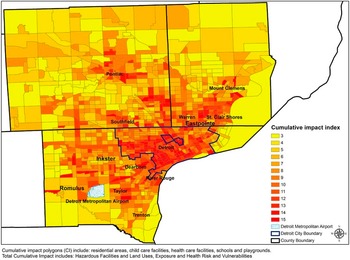
Cumulative Risk Index. Following construction of each of the components of the CRI (hazardous land uses, exposure and health risk, and vulnerability), a single aggregated index was created to represent the combined score or cumulative risk. This index is the sum of the three rank ordered components, with values ranging from 3 (low) to 15 (high), reflecting the sum of the scores for the three separate indices, each scored from 1-5. We also mapped, separately, Census tracts by proportion of people of color.
Analyses
To address our first research aim, maps were created by proportion of people of color for each of the three component indices described above and for the composite CRI. These maps allow a visual inspection of the distribution of each component and of the composite risk captured in the CRI, including identification of Census tracts that experience the highest levels of exposure and vulnerability.
To address our second aim, to measure the extent to which environmental exposures and health risks are (in)equitably distributed across geographic areas (Census tracts) with differing racial compositions, as well as economic and age-related vulnerabilities, we draw on work conducted by Jason Su and colleagues (Reference Su, Morello-Frosch, Jesdale, Kyle, Shamasunder and Jerrett2009) assessing inequalities in the distribution of environmental hazards and health risks. We used the environmental exposure and health risk index as an indicator of exposure and examined the extent to which exposures were distributed across Census tracts with differences in racial composition and socioeconomic characteristics, and with age groups more susceptible to the adverse effects of environmental exposures (age < 5, age >= 60). Similarly, we estimated racial and ethnic inequalities in the distribution of cumulative vulnerability at the Census tract level. Finally, we estimated variations in cumulative risk by the racial composition of Census tracts. Specific analytic methods are described below.
To estimate the extent to which an exposure or vulnerability index was equitably distributed in a population, the cumulative proportion of the population, ordered by area-based percentage of the vulnerability indicator of interest (e.g., proportion of people of color) was plotted against the cumulative share of the exposure or vulnerability index. In the case for which each population group in the comparison has the same share of the impact of the environmental hazard or vulnerability, the curve coincides with the equality line. If the curve lies above the equality line, the inequality index is negative, indicating that more disadvantaged groups encounter greater environmental exposure or vulnerability burdens. If the curve lies below the equality line, then more advantaged groups carry a higher proportion of cumulative environmental exposure or vulnerability burdens. A summary measure of inequality is defined as twice the area between the curve and the equality line:
 $$I = 1 - 2\mathop \smallint \limits_1^n e(s)ds$$
This measure gives a quantitative summary of inequality among groups. In order to assess the integral we used the “trapezoidal rule” (Atkinson Reference Atkinson1989) to approximate the region under the graph of the function e(s). The value of 0 is the lowest level of inequality where all groups have the same exposure to the variable of interest. When the inequality score is negative, it indicates that less advantaged groups bear a disproportionate burden of exposure: The highest level of inequality where disadvantaged groups bear the burden of all the exposure is -1 (Kakwani et al., Reference Kakwani, Wagstaff and van Doorslaer1997).
RESULTS
Table 1 shows descriptive statistics for each of the indicators included in the CRI, with Census tract as the unit of analysis. The mean percent population of color for Census tracts in the Detroit metropolitan area is 40.8% (s.d. = 35.3%). For items included in the hazardous facilities and land uses index, the proportion of Census tracts in the Detroit metropolitan area with at least one airport (1.4%), intermodal facility (1.1%), refinery (0.2%), railroad (33.1%), and major freeways (22.6%) is shown, along with the mean number per Census tract of chrome plating facilities (0.1, s.d. = 0.3), waste management facilities (0.1, s.d. = 0.4), and TRI facilities (0.6, s.d. = 1.8). For items included in the exposure and health risk index, mean diesel particulate matter is 1.1 µg/m3 (s.d .= 0.4); mean respiratory risk is 1.6 (s.d. = 0.5); and mean cancer mortality risk is 36.4 per million people (s.d. = 5.6 per million).
Descriptive statistics for hazardous facilities and land uses, pollution exposure and health risks, and social and physical vulnerability indicators included in the cumulative risk index for Census tracts in the Detroit Metropolitan Area

Descriptive results for indicators of vulnerability show a mean percent below poverty of 9.5% (s.d. = 9.9%), a mean percent unemployed of 9.7% (s.d. = 5.8%), and the mean of median home values at the Census tract level at $121.7K (s.d. = $87.2K). The mean proportion of housing occupied by renters is 32.4% (s.d. = 21.6%), and the mean proportion with less than a high school education is 13.7% (s.d. = 10.2%). The mean proportion of residents who are linguistically isolated is 0.4% (s.d. = 1.1%). The mean proportion of children under the age of 5 is 6.0% (s.d. = 2.7%), and the mean proportion of adults over 60 is 19.5% (s.d. = 6.6%).
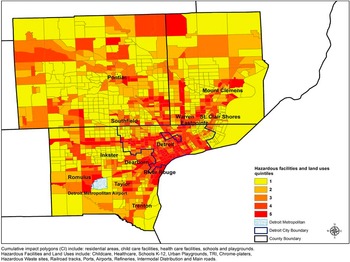
Figures 2–4 show the distribution of each of the three components of the CRI index: hazardous facilities and land uses (Figure 2), exposure and health risk (Figure 3), and vulnerability (Figure 4). As shown in Figure 2, areas with high hazardous facilities and land use scores tend to cluster in more densely populated areas and major industrial centers, and to follow transportation corridors. The highest scores typically appear in areas characterized by concentrated industrial activity.
Hazardous facilities and land use quintile scores at the tract level (mapped on CI polygons)—Detroit Metropolitan Area.
Exposure and health risk quintile scores at the tract level (mapped on CI polygons)—Detroit Metropolitan Area.
Vulnerabilities quintile score at the tract level (mapped on CI polygons)—Detroit Metropolitan Area.
The distribution of the exposure and health risk index (Figure 3) shows widespread risk associated with diesel particulate matter (non-cancer), respiratory hazards, and cancer risks associated with air pollutants clustered in areas that are heavily industrial, including the cities of Detroit, Dearborn, Taylor, and Pontiac. Lower scores are apparent in less populated and more rural outlying areas shown in this map.
Figure 4 shows the distribution of the cumulative vulnerability index. This map illustrates areas with the greatest levels of cumulative vulnerability (social, economic, and age-related), with the greatest clustering in the city of Detroit and adjacent urban areas, including Pontiac, River Rouge, Southfield, Taylor, and Warren.
When the three component indices are summed into a cumulative risk index (CRI, Figure 5), the resulting map similarly suggests a convergence of Census tracts with high scores on the CRI in Detroit, the near suburbs, and in industrial, urban communities in outlying areas.
Cumulative risk index (CRI) at the tract level (mapped in CI polygons)—Detroit Metropolitan Area.
To examine the significance of the differences in exposure, risk, and vulnerability reflected in these indices, we turn to results from analyses addressing our second aim. Here we assess the extent to which exposure and health risks are (in)equitably distributed according to the racial composition of Census tracts, economic and age-related indicators of vulnerability, and indicators of cumulative vulnerability. As shown in Table 2, scores on the cumulative environmental exposure and health risk index are significantly higher in Census tracts with higher scores on the cumulative vulnerability index (-0.19, p < 0.001).
Significance tests of inequality in cumulative exposure and health risks for indicators of vulnerability, and inequality in cumulative economic and age vulnerability by proportion people of color at the Census tract level
1 Cumulative Vulnerability Index using additive approach, including socioeconomic and age indicators of vulnerability
2 Cumulative Risk Index includes Cumulative Hazardous Facilities and Land Uses, Cumulative Environmental Exposures and Health Risks, and Cumulative Vulnerability Index
*0.1 <p <0.05, ** 0.05 <p <0.001, *** p <0.001
Similarly, Census tracts with greater proportions of people of color experience a heightened burden of environmental exposures and health risks (-0.12, p < 0.001 ). We also find that exposure and health risks are significantly higher in Census tracts with a higher proportion of households below poverty (-0.16, p < 0.001), renters (-0.13, p < 0.001), and residents under the age of twenty-four who have not completed high school (-0.15, p < 0.01). There is no significant excess burden of environmental exposures across Census tracts with lower median home values (-0.04, p > 0.1) or those with higher levels of linguistic isolation (-0.05, p > 0.1). Census tracts with higher proportions of children under the age of five (-0.05, p < 0.01) and adults aged sixty and older (-0.06, p < 0.01) showed small but significant excess environmental exposures and health risks.
Finally, Table 2 also shows results from tests of inequality in vulnerability, cumulative hazardous land uses and facilities, and the cumulative risk index by the proportion of people of color at the Census tract level. Census tracts with a greater proportion of people of color are disproportionately exposed to greater cumulative hazardous land uses and facilities (-0.11, p < .001), cumulative vulnerabilities (-0.18, p < 0.001), and ultimately to higher cumulative risk (-0.18, p < 0.001).
The findings above suggest that Census tracts with higher proportions of people of color experience both greater burden of environmental exposures and health risks and greater economic and age-related vulnerability. A subset of the inequality curves are shown in Figures 6a-d. The distribution of the curve above the diagonal line that connotes equity illustrate that Census tracts with higher proportions of people of color (6a), people below poverty (6b), renters (6c), and adults with less than high school education (6d), respectively, each experience a greater share of air pollution and health risk compared with those with lower proportions of vulnerable populations. Together, these findings suggest that Census tracts with higher proportions of people of color are disproportionately impacted by excess environmental exposures and associated health risks, while simultaneously having greater likelihood of experiencing multiple vulnerabilities that may exacerbate the adverse health effects of those exposures.
Inequality curves for cumulative share of Environmental Exposure and Health Risks by proportion people of color, percent living below the poverty line, percent renters, and percent over age 24 with less than a high school education*.
*Note: The diagonal line indicates the equality line in the distribution of the environmental hazard by the racial, ethnic, or socioeconomic indicator. The negative inequality curve (above the diagonal line) indicates that Census tracts with greater disadvantage experience greater exposure to the environmental hazard. A curved line below the diagonal line would indicate that Census tracts with greater advantage experience greater exposure to the environmental hazard.
DISCUSSION
In 1896, Du Bois used maps and statistical evidence to document social, economic, and physical environmental characteristics experienced by “the Philadelphia Negro,” including housing, occupation, literacy, and suffrage among residents of Philadelphia’s predominantly African American Seventh Ward. At that time, Du Bois described Philadelphia’s African Americans as “a large group of people . . .—a city within a city—who do not form an integral part of the larger social group” with “particularly pressing social problems” (Du Bois Reference Du Bois1899, p. 5). In the century since the completion of that study, evidence has continued to link race-based residential segregation, including but not limited to segregation of African Americans, with economic disinvestment, differential economic and political opportunities, and differences in environmental exposures—ultimately linked to persistent and unequal health outcomes and length of life (Beckles and Chou, Reference Beckles and Chou2013; Bullard et al., Reference Bullard, Mohai, Saha and Wright2007; Fann et al., Reference Fann, Lamson, Anenberg, Wesson, Risley and Hubbell2012; Gillepsie et al., Reference Gillespie, Wigington and Hong2013; Huang and London, Reference Huang and London2012; MacDorman and Matthews, Reference MacDorman and Matthews2013; Mujahid et al., Reference Mujahid, Diez Roux, Morenoff, Raghunathan, Cooper, Ni and Shea2008; Sugrue Reference Sugrue2014). The findings reported above are consistent with and extend this research by examining the contemporary and unequal distribution of environmental exposures and associated health risks across communities with differing racial and socioeconomic characteristics in the Detroit metropolitan area.
In Detroit, African Americans comprise not so much a “city within a city” (Du Bois Reference Du Bois1899, p. 5) but a majority population in this city within the larger metropolitan area. The maps presented in this study provide visual evidence of the unequal distribution of environmental exposures and associated health risks by racial composition. Results from tests of inequality quantify the extent to which Census tracts with higher proportions of people of color experience heightened burdens of environmental exposures and associated health risks, as well as higher burdens of economic- and age-related vulnerabilities. These findings are consistent with evidence suggesting that patterns of White flight and economic disinvestment from many urban communities, such as those described above for Detroit, Footnote 2 have contributed to disproportionate representation of African Americans and Latinos in neighborhoods that experience multiple exposures and vulnerabilities (Farley et al., Reference Farley, Danziger and Holzer2000; Sugrue Reference Sugrue2014). By highlighting, both visually and quantitatively, the unequal distribution of risk, these findings reinforce concerns regarding the extent to which all people are treated fairly in the implementation and enforcement of environmental regulations, laws, and policies. Specifically, they both confirm concerns about environmental justice in this area, as in similar communities across the country, and suggest that environmental exposures are likely contributors to persistent racial inequities in health outcomes (Bullard et al., Reference Bullard, Mohai, Saha and Wright2007; Fann et al., Reference Fann, Lamson, Anenberg, Wesson, Risley and Hubbell2012).
Perhaps not surprisingly, given the heightened probability that households with young children have low incomes (Jiang et al., Reference Jiang, Econo and Skinner2015), Census tracts with larger proportions of children under the age of five—who are developmentally more vulnerable to the adverse effects of exposure to air pollution—experience a small but statistically significant greater exposure to air pollutants and health risks relative to Census tracts with smaller proportions of children. Similarly, Census tracts with a greater proportion of residents aged sixty and older, another population at increased risk of more adverse health outcomes, also experience heightened exposure relative to those with smaller proportions of those over sixty. These findings raise concerns that Census tracts with higher levels of air pollution and associated health risks also disproportionately contain higher proportions of residents who are more susceptible to adverse health effects from environmental exposures.
Together, our findings suggest that environmental exposures and associated health risks throughout the Detroit metropolitan area disproportionately affect the health of communities of color, those with heightened economic vulnerability, and those with heightened age-related susceptibility. Following consideration of strengths and limitations of this study, we discuss the ways in which it may, in Du Bois’s words, prepare “the ground for the labors of philanthropists and statesmen” (1899, p. v).
Strengths and limitations. There are a number of limitations associated with this study. First, the exposure index used drew upon publically-available data from the Environmental Protection Agency’s National Air Toxics Assessment database. Released in 2015, these modeled estimates are based on data from 2011 (the most recent data available). Future estimates made with monitored data or more recently-modeled data would provide more current and precise estimates of air pollution exposure. However, publically available air quality data is an inexpensive, accessible, and replicable approach for assessing cumulative risk that can be readily used by local governments and community-based groups without requiring expensive data collection and handling.
The indices used in these analyses are created by rank ordering Census tracts along various dimensions of risk and vulnerability. This allows us to combine variables constructed from differing measurement scales (e.g., dollars, deaths per million in population) into a single indicator of aggregate risk, and is therefore a strength of the study. However, the rank ordering is sensitive to the other Census tracts included in the set, and is likely to change based on the geographic scale selected for analysis (e.g., Detroit city, Tri-County). Following Morello-Frosch and colleagues (Reference Morello-Frosch, Zuk, Jerrett, Shamasunder and Kyle2011), we have used a regional scale which allows variations to be visible and identifies areas in which risk is clustered. Selection of different geographic areas (e.g., statewide) would result in adjustments in the rank ordering of the included tracts.
The social, economic, and age-related vulnerabilities included in these analyses encompass multiple indicators of vulnerability. Racial, ethnic, and socioeconomic characteristics of areas have been previously associated with proximity to hazardous waste facilities and air pollutants (Bullard et al., Reference Bullard, Mohai, Saha and Wright2007; Collins et al., Reference Collins, Grineski, Chakraborty, Montgomery and Hernandez2015; Mohai et al., Reference Mohai, Lantz, Morenoff, House and Mero2009). These vulnerabilities may operate through housing discrimination and/or limited access to economic resources which shape the ability to buy or rent homes in other communities with lower environmental exposures (Collins et al., Reference Collins, Grineski, Chakraborty, Montgomery and Hernandez2015; Roscigno et al., Reference Roscigno, Karafin and Tester2009; Seitles Reference Seitles1996). Vulnerabilities also include young and old age, which are associated with heightened adverse effects of exposure to air pollution—sometimes called susceptibility—and suggest that young children and elderly residents of predominantly African American communities may be particularly at risk given heightened exposure to air pollutants. Future research might continue to disentangle these dimensions of vulnerability, with particular attention to those groups with larger proportions of more susceptible populations. Such studies might include additional vulnerability indicators, for example, proportion of the population with asthma, or those with existing cardiovascular disease, both conditions which enhance adverse health effects of air pollutants.
The cross-sectional nature of the analysis presented here allows examination of geographic or spatial variations but does not illuminate how these variations unfolded over time. The latter would allow consideration of historical patterns and processes in the associations between exposure and vulnerability that are not visible in this cross sectional rendering of the data.
Finally, the analyses reported here allow analysis of separate dimensions of vulnerability, as well as cumulative risk. We found that multiple dimensions of economic risk are associated with disproportionate exposures and health risks, as well as with the proportion of people of color. Thus, by creating cumulative risk scores that capture multiple dimensions of vulnerability, we are able to capture correlations as well as differences in these measures.
Implications. Despite these limitations, the results presented here provide substantial evidence that in the Detroit metropolitan area today, as in Philadelphia over a century ago, geographic areas with higher proportions of people of color experience greater exposure to physical environmental exposures and associated health risks. These same communities also disproportionately experience economic disadvantages and age-related vulnerabilities that can exacerbate the adverse health effects of exposures. There are a number of implications for understanding race and the environment, and for actions to address persistent inequalities in environmental exposures and health outcomes.
First, methods similar to those used in this paper can and have been used to identify communities that experience higher cumulative risk and to direct resources toward those communities that can be used to reduce exposures or mitigate their adverse effects. For example, California’s Senate Bill 535 specifies the distribution of funds from a tax on facilities that emit carbon-pollutants into the air to communities with the highest cumulative risk scores (California Environmental Protection Agency 2014). The goal is to assure that resources derived from air pollution emissions are channeled to communities disproportionately affected in order to mitigate their adverse effects. Similar legislation, enacted in other areas, could be used to fund emissions reductions efforts (e.g., placing more efficient scrubbers on emissions stacks) or reduce residents’ exposure to those emissions (e.g., fund relocation of homes within 1000 feet of emissions sources, install air filtration systems in homes).
Municipalities, community-based organizations, or community-based participatory research partnerships, such as the one that conducted this study, may similarly draw upon publically available data to identify Census tracts adversely affected by air pollutants and associated health risks and to guide local decision making and investments (Corburn Reference Corburn2009). Such mapping may help guide prioritization of local level interventions and investments to protect disproportionately exposed or vulnerable populations. These maps can also be used to identify areas experiencing heightened cumulative risk, offering an example of the strategic use of research to inform policy and planning decisions. Partnerships such as CAPHE that bring together community, academic, environmental, and health service partners are uniquely positioned to support the effective translation of research into policy and to practice solutions to promote environmental justice and health equity.
Such information can also be used by policy and decision makers to assess excess health risks and associated medical care costs or savings that may be accrued through changes in emissions levels. These can be incorporated in requests for emissions permits and used to identify areas in which increases in emissions may have particularly adverse health effects, or in which reductions may be particularly beneficial, due to the susceptibility of populations affected. Health impact assessments may be used strategically in communities that experience high levels of cumulative risk to identify potential positive, as well as adverse, health effects of new developments or land uses (Gilhuly et al., Reference Gilhuly, Purciel, Farhang, Lucky, Harris, Heller and Seto2011). Such assessments may lead to recommendations that reduce or limit new emissions or that limit adverse health effects of those emissions (e.g., installing filters in schools proximate to emissions sources) (Pastor et al., Reference Pastor, Carter, Sanchez-Lopez and Chlala2015; Salkin and Lavine, Reference Salkin and Lavine2008).
CONCLUSION
These results provide substantial evidence that in the Detroit metropolitan area today, as in Philadelphia over a century ago, geographic areas with higher proportions of people of color experience greater exposure to air pollutants and associated health risks. Residents of those same areas also disproportionately experience economic disadvantages and age-related susceptibilities that can exacerbate the adverse effects of those exposures. Census tracts with high proportions of people of color disproportionately contain greater concentrations of susceptible populations and simultaneously experience heightened exposure to air pollutant risks.
Recognition of the structural factors that shape the risk of physical environmental exposures and economic vulnerability along racial lines today, as with over a century ago, is a critical step as the United States continues to work toward a more equitable distribution of risk and opportunity. Legislative, regulatory, or policy actions focused within communities most adversely affected by the accumulative burden of physical environmental exposures and social and economic vulnerabilities will further environmental justice and reduce persistent health inequities in the United States.
ACKNOWLEDGMENT
We thank the members of the CAPHE Steering Committee for their contributions to the work presented here, including representatives from: Community Action Against Asthma (CAAA), the Detroit Healthy Environments Partnership (www.hepdetroit.org), the Detroit Community-Academic Urban Research Center (www.detroiturc.org), Detroit Hispanic Development Corporation, Detroit Future Cities, Detroiters Working for Environmental Justice, Green Door Initiative, Michigan Department of Environmental Quality, Sierra Club Detroit, Southwest Detroit Environmental Vision, University of Michigan School of Public Health, and the Wayne State University Transnational Environmental Law Clinic. The study and analysis were supported by the National Institute of Environmental Health Sciences (NIEHS) (R01ES022616 and P30ES017885). The results presented here are solely the responsibility of the authors and do not necessarily represent the views of NIEHS, its directors, officers, or staff. We thank our funders for support for this manuscript, and also thank Samantha Kreklau for critical support in its preparation. Finally, we acknowledge those whose seminal work on race and environment have paved the way for this research, including W. E. B. Du Bois and the United Church of Christ Justice and Witness Ministries (UCC), Toxic Wastes and Race at Twenty, 1987-2007 (Bullard et al., Reference Bullard, Mohai, Saha and Wright2007).


