

1. Introduction
Automated deception detection builds on years of research in interpersonal psychology, philosophy, sociology, communication studies, and computational models of deception detection (Vrij Reference Vrij2008a; Granhag et al. Reference Granhag, Vrij and Verschuere2014). Textual data of any form, such as consumer reviews, news articles, social media comments, political speeches, witnesses’ reports, etc., are currently in the spotlight of deception research (Granhag et al. Reference Granhag, Vrij and Verschuere2014). What contributed to this vivid interest is the enormous production of textual data and the advances in computational linguistics. In many cases, text is either the only available source for extracting deception cues or the most affordable and less intrusive one, compared to approaches based on magnetic resonance imaging (Lauterbur Reference Lauterbur1973) and electrodermal activity (Critchley and Nagai Reference Critchley and Nagai2013). In this work, we exploit natural language processing (NLP) techniques and tools for automated text-based deception detection and focus on the relevant cultural and language factors.
As many studies suggest, deception is an act that depends on many factors such as personality (Fornaciari et al. Reference Fornaciari, Celli and Poesio2013; Levitan et al. Reference Levitan, Levine, Hirschberg, Nishmar, Guozhen and Rosenberg2015), age (Sweeney and Ceci Reference Sweeney and Ceci2014), gender (Tilley et al. Reference Tilley, George and Marett2005; Toma et al. Reference Toma, Hancock and Ellison2008; Fu et al. Reference Fu, Evans, Wang and Lee2008), or culture (Taylor et al. Reference Taylor, Larner, Conchie and van der Zee2014; Taylor et al. Reference Taylor, Larner, Conchie and Menacere2017; Leal et al. Reference Leal, Vrij, Vernham, Dalton, Jupe, Harvey and Nahari2018). All these factors affect the way and the means one uses to deceive. The vast majority of works in automatic deception detection take an “one-size-fits-all” approach, failing to adapt the techniques based on such factors. Only recently, research efforts that take into account such parameters started to appear (Pérez-Rosas and Mihalcea Reference Pérez-Rosas and Mihalcea2014; Pérez-Rosas et al. Reference Pérez-Rosas, Bologa, Burzo and Mihalcea2014).
Culture and language are tightly interconnected since language is a means of expression, embodiment, and symbolization of cultural reality (Kramsch Reference Kramsch2011) and as such differences among cultures are reflected in language usage. According to previous studies (Rotman Reference Rotman2012; Taylor et al. Reference Taylor, Larner, Conchie and van der Zee2014; Taylor et al. Reference Taylor, Larner, Conchie and Menacere2017; Leal et al. Reference Leal, Vrij, Vernham, Dalton, Jupe, Harvey and Nahari2018), this also applies to the expression of deception among people belonging to different cultures (a detailed analysis related to this point is provided in Section 2.2). The examination of the influence of cultural properties in deception detection is extremely important since differences in social norms may lead to misjudgments and misconceptions and consequently can impede fair treatment and justice (Jones and Newburn Reference Jones and Newburn2001; Taylor et al. Reference Taylor, Larner, Conchie and van der Zee2014). The globalization of criminal activities that employ face-to-face communication (e.g., when illegally trafficking people across borders) or digital communication (e.g., phishing in e-mail or social media), as well as the increasing number of people passing interviews in customs and borders all over the world are only some scenarios that make the incorporation of cultural aspects in the research of deception detection a necessity. Since the implicit assumption made about the uniformity of linguistic indicators of deception comes in conflict with prior work from psychological and sociological disciplines, our three research goals are
-
(a) Can we verify the prior body of work which states that linguistic cues of deception are expressed differently, for example, are milder or stronger, across cultures due to different cultural norms? More specifically, we want to explore how the individualism/collectivism divide defines the usage of specific linguistic cues (Taylor et al. Reference Taylor, Larner, Conchie and van der Zee2014; Reference Taylor, Larner, Conchie and Menacere2017). Individualism and collectivism constitute a well-known division of cultures, and concern the degree in which members of a culture value more individual over group goals and vice versa (Triandis et al. Reference Triandis, Bontempo, Villareal, Asai and Lucca1988). Since cultural boundaries are difficult to define precisely when collecting data, we use data sets from different countries assuming that they reflect at an aggregate level the dominant cultural aspects that relate to deception in each country. In other words, we use countries as proxies for cultures, following in that respect Hofstede (Reference Hofstede2001). We also experiment with data sets originating from different text genres (e.g., reviews about hotels and electronics, opinions about controversial topics, transcripts from radio programs, etc.).
-
(b) Explore which language indicators and cues are more effective to detect deception given a piece of text and identify if a universal feature set, that we could rely on for detection deception tasks exists. On top of that, we investigate the volatility of cues across different domains by keeping the individualism/collectivism and language factors steady, whenever we have appropriate data sets at our disposal.
-
(c) In conjunction with the previous research goal, we create and evaluate the performance of a wide range of binary classifiers for predicting the truthfulness and deceptiveness of text.
These three research goals have not been addressed before, at least from this point of view. Regarding the first goal, it is particularly useful to confirm some of the previously reported conclusions about deception and culture under the prism of individualism/collectivism with a larger number of samples and from populations beyond the closed environments of university campuses and small communities used by the original studies. For the other two research goals, we aim at providing an efficient methodology for the deception detection task, exploring the boundaries and limitations of the options and tools currently available for different languages.
To answer our first and second research goals, we performed statistical tests on a set of linguistic cues of deception already proposed in bibliography, placing emphasis on those reported to differentiate across the individualism/collectivism divide. We conducted our analysis on datasets originating from six countries, namely United States of America, Belgium, India, Russia, Romania, and Mexico, which are seen as proxies of cultural features at an aggregate level. Regarding the third research goal, the intuition is to explore different approaches for deception detection, ranging from methodologies that require minimal linguistics tools for each language (such as word n-grams), to approaches that require deeper feature extraction (e.g., syntactic features obtained via language-specific parsers) or language models that require training on large corpora, either in separation or in combination. One of our challenges is the difficulty to collect and produce massive and representative deception detection data sets. This problem is amplified by the diversity of languages and cultures, combined with the limited linguistic tools for under-researched languages despite recent advances (Conneau et al. Reference Conneau, Rinott, Lample, Williams, Bowman, Schwenk and Stoyanov2018; Alyafeai et al. Reference Alyafeai, AlShaibani and Ahmad2020; Hu et al. Reference Hu, Ruder, Siddhant, Neubig, Firat and Johnson2020; Hedderich et al. Reference Hedderich, Lange, Adel, Strtgen and Klakow2020). To this end, we exploit various widely available related data sets for languages with adequate linguistic tools. We also create a new data set based on transcriptions from a radio game. For each language under research, we created classifiers using a wide range of n-gram features from several levels of linguistic analysis, namely, phonological, morphological, and syntactic, along with other linguistic cues of deception and token embeddings. We provide the results of the experiments from logistic regression classifiers, as well as fine-tuned BERT models. Regarding BERT, we have experimented with settings specific to each particular language, based on the corresponding monolingual models, as well as with a cross-language setting using the multilingual model (Devlin et al. Reference Devlin, Chang, Lee and Toutanova2019).
In the remainder of this paper, we first present the relevant background (Section 2), including both theoretical work and computational work relevant to deception and deception detection, with emphasis on the aspects of culture and language. We then proceed with the presentation of the data sets that we utilized (Section 3), the feature extraction process (Section 4), and the statistical evaluation of linguistic cues (Section 5). Subsequently, we present and discuss the classification schemes and the evaluation results, comparing them with related studies (Section 6). Finally, we conclude and provide some future directions for this work (Section 7).
2. Background
2.1 Deception in psychology and communication
Several theories back up the observation that people speak, write, and behave differently when they are lying than when they are telling the truth. Freud was the first who observed that the subconscious feelings of people about someone or something are reflected in how they behave and the word choices they make (Freud Reference Freud1914). The most influential theory that connects specific linguistic cues with the truthfulness of a statement is the Undeutsch hypothesis (Undeutsch Reference Undeutsch1967; Undeutsch Reference Undeutsch1989). This hypothesis asserts that statements of real-life experiences derived from memory differ significantly in content and quality from fabricated ones, since the invention of a fictitious memory requires more cognitive creativity and control than remembering an actually experienced event.
On this basis, a great volume of research work examines which linguistic features are more suitable to distinguish a truthful from a deceptive statement. These linguistic features can be classified roughly into four categories: word counts, pronoun use, emotion words, and markers of cognitive complexity. The results for these dimensions have been contradictory and researchers seem to agree that cues are heavily context-dependent. More specifically, the importance of specific linguistic features tends to change based on many parameters such as the type of text, for example, dialogue, narrative (Picornell Reference Picornell2013), the medium of the communication, for example, face-to-face, computer-mediated (Zhou et al. Reference Zhou, Burgoon, Nunamaker and Twitchell2004; Hancock et al. Reference Hancock, Curry, Goorha and Woodworth2007; Zhou and Zhang Reference Zhou and Zhang2008; Rubin Reference Rubin2010), deception type (Frank and Ekman Reference Frank and Ekman1997), how motivated the deceiver is (Frank and Ekman Reference Frank and Ekman1997), etc. There is also a volume of work that examines how the conditions that the experiments were performed in, for example, sanctioned, unsanctioned, influence the accuracy results, and the behavior of the participants (Feeley and deTurck Reference Feeley and deTurck1998; Dunbar et al. Reference Dunbar, Jensen, Burgoon, Kelley, Harrison, Adame and Bernard2015; Burgoon Reference Burgoon2015).
Given the volatility of the results within even the context of a specific language, the implicit assumption made about the universality of deception cues can lead to false alarms or misses. Differences in social norms and etiquette, anxiety, and awkwardness that may stem from the language barrier (when speakers do not use their native languages) can distort judgments. A reasonable argument is that, since the world’s languages differ in many ways, the linguistic cues which might have been identified as deceptive in one language might not been applicable to another. For example, a decrease in first person personal pronoun use is an indicator of deception in English (Hauch et al. Reference Hauch, Blandn-Gitlin, Masip and Sporer2015). What happens though in languages where personal pronoun use is not always overt such as in Italian, Spanish, Greek and Romanian (i.e., null subject languages)? In addition, modifiers (i.e., adjectives and adverbs), prepositions, verbs are also commonly examined cues. But not all languages use the same grammatical grammatical categories; for example, Russian and Polish have no articles (Newman et al. Reference Newman, Pennebaker, Berry and Richards2003; Zhou et al. Reference Zhou, Burgoon, Nunamaker and Twitchell2004; Spence et al. Reference Spence, Villar and Arciuli2012).
All psychology and communication studies that involve participants from different cultural groups, asking them to identify truth and fabrications within the same and different cultural group, conclude to the same result about the accuracy rate of predictions. More specifically, as Table 1 indicates, the accuracy rate in all the studies dropped to chance when judgments were made across cultures, whereas for within culture judgments, it was in line with the rest of the bibliography, that places accuracy to be typically slightly better than chance (DePaulo et al. Reference DePaulo, Stone and Lassiter1985). Indeed, deception detection turns out to be a very challenging task for humans. It is indicative that even in studies that involve people who have worked for years at jobs that require training in deception detection, such as investigators or customs inspectors, the results are not significantly better (Ekman and O’Sullivan Reference Ekman and O’Sullivan1991). These results are usually attributed to truth bias, that is, the tendency of humans to actively believe or passively presume that another person is honest, despite even evidence to the contrary (DePaulo et al. Reference DePaulo, Stone and Lassiter1985; Vrij Reference Vrij2008b). The further impairment in accuracy in across culture studies is attributed to the norm violation model. According to this model, people infer deception whenever the communicator violates what the receiver anticipates as being normative behavior, and this is evident in both verbal and nonverbal communication (Taylor et al. Reference Taylor, Larner, Conchie and van der Zee2014).
Social psychology studies on within and across culture deception detection

2.2 Culture and language
The correlation and interrelation between cultural differences and language usage has been extensively studied in the past. The most influential theory is the Sapir–Whorf hypothesis that is also known as the theory of the linguistic relativity (Sapir Reference Sapir1921; Whorf Reference Whorf1956). This theory suggests that language influences cognition. Thus every human views the world by his/her own language. Although influential, the strong version of the Sapir–Whorf hypothesis has been heavily challenged (Deutscher Reference Deutscher2010). However, neo-Whorfianism that is a milder strain of the Sapir–Whorf hypothesis is now an active research topic (West and Graham Reference West and Graham2004; Boroditsky Reference Boroditsky2006), stating that language influences a speaker’s view of the world but does not inescapably determine it.
Another view of the relationship between language and culture is the notion of linguaculture (or languaculture). The term was introduced by linguistic anthropologists Paul Friedrich (Reference Friedrich1989) and Michael Agar (Reference Agar1994). The central idea is that a language is culture bound and much more than a code to label objects found in the world (Shaules Reference Shaules2019).
Early studies (Haire et al. Reference Haire, Porter and Ghiselli1966; Whitely and England Reference Whitely and England1980) support that language and cultural values are correlated in the sense that the cross-cultural interactions that account for similarity in cultural beliefs (geographic proximity, migration, colonization) also produce linguistic similarity. Haire et al. (Reference Haire, Porter and Ghiselli1966) found Belgian-French and Flemish-speakers held values similar to the countries (France and the Netherlands) with which they shared language, religion, and other aspects of cultural heritage. In such cases, parallel similarities of language and values can be seen because they are part of a common cultural heritage transmitted over several centuries.
2.3 Deception and culture
The individualism/collectivism dipole is one of the most viable constructs to differentiate cultures and express the degree to which people in a society are integrated into groups. In individualism, ties between individuals are loose and individuals are expected to take care of only themselves and their immediate families, whereas in collectivism ties in society are stronger. The individualism/collectivism construct strongly correlates with the distinction between high and low-context communication styles (Hall Reference Hall1976). The low-context communication style, which is linked with more individualist cultures, states that messages are more explicit, direct, and the transmitter is more open and expresses true intentions. In contrast, in a high context communication messages are more implicit and indirect, so context and word choices are crucial in order for messages to be communicated correctly. The transmitter in this case tries to minimize the content of the verbal message and is reserved in order to maintain social harmony (Wrtz Reference Wrtz2017). Some studies from the discipline of psychology examine the behavior of verbal and nonverbal cues of deception across different cultural groups based on these constructs (Taylor et al. 2014, Reference Taylor, Larner, Conchie and Menacere2017; Leal et al. Reference Leal, Vrij, Vernham, Dalton, Jupe, Harvey and Nahari2018).
In the discipline of psychology, there is a recent work from Taylor et al. (Reference Taylor, Larner, Conchie and van der Zee2014, Reference Taylor, Larner, Conchie and Menacere2017) that comparatively examines deceptive lexical indicators among diverse cultural groups. More specifically, Taylor et al. (Reference Taylor, Larner, Conchie and van der Zee2014) conducted some preliminary experiments over 60 participants from four ethnicities, namely White British, Arabian, North African, and Pakistani. In Taylor et al. (Reference Taylor, Larner, Conchie and Menacere2017), the authors present an extended research work, over 320 individuals from four ethnic groups, namely Black African, South Asian, White European, and White British, who were examined for estimating how the degree of the individualism and collectivism of each culture, influences the usage of specific linguistic indicators in deceptive and truthful verbal behavior. The participants were recruited from community and religious centers across North West England and were self-assigned to one of the groups. The task was to write one truthful and one deceptive statement about a personal experience, or an opinion and counter-opinion in English. In the study, the collectivist group (Black African and South Asian) decreased the usage of pronouns when lying and used more first-person and fewer third-person pronouns to distance the social group from the deceit. In contrast, the individualistic group (White European and White British) used fewer first-person and more third-person pronouns, to distance themselves from the deceit.
In these works, Taylor stated the hypothesis that affect in deception is related to cultural differences. This hypothesis was based on previous related work that explored the relation between sentiment and deception across cultures, which is briefly summarized in Table 2. The results though refute the original hypothesis, showing that the use of positive affect while lying was consistent among all the cultural groups. More specifically, participants used more positive affect words and fewer words with negative sentiment when they were lying, compared to when they were truthful. Based on his findings, emotive language during deception may be a strategy for deceivers to maintain social harmony.
Studies from social psychology discipline on the expression of sentiment in individualism and collectivism

According to the same study, the use of negations is a linguistic indicator of deception in the collectivist group, but is unimportant for the individualist group. Negations have been studied a lot with respect to differences among cultures and the emotions they express. Stoytcheva et al. (Reference Stoytcheva, Cohen and Blake2014) conclude that Asian languages speakers are more likely to use negations than English speakers, due to preference to the indirect style of communication. Moreover, Mafela (Reference Mafela2013) states that for South African languages the indirect style of communication leads to the usage of negation constructs for the expression of positive meanings.
Contextual details is a cognition factor also examined in Taylor’s works. According to the related literature, contextual details such as the spatial arrangement of people or objects, occur naturally when people describe existing events from their memory. The key finding of this study suggests that this is actually true for the relatively more individualistic participants, for example, European. For the collectivist groups though, spatial details were less important while experiencing the event at the first place and subsequently during recall. As a result, individualist cultures tend to provide fewer perceptual details and more social details when they are lying a trend that changes in collectivist cultures. Table 3 summarizes all the above findings.
Summary of differences in language use between truthful and deceptive statements across the four cultural groups examined in the work of Taylor et al. (Reference Taylor, Larner, Conchie and van der Zee2014); Taylor et al. (Reference Taylor, Larner, Conchie and Menacere2017). Differences in pronoun usage and perceptual details were confirmed when participants lied about experiences, whereas affective language differences were confirmed when participants lied about opinions

( $\uparrow$
) more in deceptive, (
$\uparrow$
) more in deceptive, ( $\downarrow$
) more in truthful, (–) no difference, (I) individualism, (C) collectivism, (
$\downarrow$
) more in truthful, (–) no difference, (I) individualism, (C) collectivism, ( $\uparrow\uparrow$
,
$\uparrow\uparrow$
, $\downarrow\downarrow$
) suggest larger differences between truthful and deceptive statements.
$\downarrow\downarrow$
) suggest larger differences between truthful and deceptive statements.
It is important to mention that the discrepancies on linguistic cues between individualist and collectivist groups were not confirmed for all types of examined lies, namely lies about opinions and experiences. In more details, the analysis showed that pronoun use and contextual embedding (e.g., the “circumstances”) varied when participants lied about experiences, but not when they lied about opinions. By contrast, the affect-related language of the participants varied when they lied about opinions, but not experiences. All the above findings indicate that it does not suffice to conceptualize liars as people motivated “to not get caught”, since additional factors influence the way they lie, what they do not conceal, what they have to make up, who they want to protect, etc.
Leal et al. (Reference Leal, Vrij, Vernham, Dalton, Jupe, Harvey and Nahari2018) investigate if differences in low and high context culture communication styles can be incorrectly interpreted as cues of deceit in verbal communication. Through collective interviews, they studied British interviewees as a representatives of low-context cultures, and Chinese and Arabs as representatives of high-context cultures. The key findings of this work revealed that indeed differences between cultures are more prominent than differences between truth tellers and liars, and this can lead to communication errors.
2.4. Automated text-based deception detection
From a computational perspective, the task of deception detection that focuses on pursuing linguistic indicators in text is mainly approached as a classification task that exploits a wide range of features. In this respect, most research work combines psycholinguistic indicators drawn from prior work on deception (DePaulo et al. Reference DePaulo, Stone and Lassiter1985; Porter and Yuille Reference Porter and Yuille1996; Newman et al. Reference Newman, Pennebaker, Berry and Richards2003) along with n-gram features (mainly word n-grams), in order to enhance predictive performance in a specific context. As already stated, the psycholinguistic indicators seem to have a strong discriminating power in most of the studies, although the quantitative predominance in truthful or deceptive texts is extremely sensitive to parameters, such as how motivated the deceiver is, the medium of communication and the overall context. The number of words that express negative and positive emotions, the number of pronouns, verbs, and adjectives, and the sentence length are among the most frequently used features.
Hirschberg et al. (Reference Hirschberg, Benus, Brenier, Enos, Hoffman, Gilman, Girand, Graciarena, Kathol, Michaelis, Pellom, Shriberg and Stolcke2005) obtain psycholinguistic indicators by using the lexical categorization program LIWC (Pennebaker et al. Reference Pennebaker, Francis and Booth2001) along with other features to distinguish between deceptive and non-deceptive speech. In the work of Gîrlea et al. (Reference Grlea, Girju and Amir2016), psycholinguistic deception and persuasion features were used for the identification of deceptive dialogues using as a data set dialogues taken from the party game Werewolf (also known as Mafia)Footnote a . For the extraction of the psycholinguistic features, the MPQA subjectivity lexiconFootnote b was used, as well as manually created lists. Various LIWC psycholinguistic, morphological, and n-gram features for tackling the problem of the automatic detection of deceptive opinion spamFootnote c are examined by Ott et al. (2011; Reference Ott, Cardie and Hancock2013). These feature sets were tested in a linear Support Vector Machine (SVM) (Cortes and Vapnik Reference Cortes and Vapnik1995). In these two works, Ott et al. (2011 Reference Ott, Cardie and Hancock2013) provide two data sets with deceptive and truthful opinions, one with positive sentiment reviews (Ott et al. Reference Ott, Choi, Cardie and Hancock2011) and one with negative sentiment (Ott et al. Reference Ott, Cardie and Hancock2013). These data sets, either in isolation or combined, have been used as a gold standard in many works. Kleinberg et al. (Reference Kleinberg, Mozes, Arntz and Verschuere2018) examined the hypothesis that the number of named entities is higher in truthful than in deceptive statements, by comparing the discriminative ability of named entities with a lexicon word count approach (LIWC) and a measure of sentence specificity. The results suggest that named entities may be a useful addition to existing approaches.
Feng et al. (Reference Feng, Banerjee and Choi2012) investigated how syntactic stylometry can help in text deception detection. The features were obtained from Context Free Grammar (CFG) parse trees and were tested over four different data sets, spanning from product reviews to essays. The results showed improved performance compared to several baselines that were based on shallower lexico-syntactic features.
Discourse and pragmatics have also been used for the task of deception detection. Rhetorical Structure Theory (RST) and Vector Space Modeling (VSM) are the two theoretical components that have been applied by Rubin and Vashchilko (Reference Rubin and Vashchilko2012) in order to set apart deceptive and truthful stories. The authors proposed a two-step approach: in the first step, they analyzed rhetorical structures, discourse constituent parts and their coherence relations, whereas in the second, they applied a vector space model to cluster the stories by discourse feature similarity. Pisarevskaya and Galitsky (Reference Pisarevskaya and Galitsky2019) also explored the hypothesis that deception in text should be visible from its discourse structure. They formulated the task of deception detection as a classification task using discourse trees, based on RST. For evaluation reasons, they created a data set containing 2746 truthful and deceptive complaints about banks in English, where the proposed solution achieved a classification accuracy of 70%.
The motivation of Hernández-Castañeda et al. (Reference Hernández-Castañeda, Calvo, Gelbukh and Flores2017) was to build a domain-independent classifier using SVM. The authors experimented with different feature sets: a continuous semantic space model represented by Latent Dirichlet Allocation (LDA) topics (Blei et al. Reference Blei, Ng and Jordan2003), a binary word-space model (Sahlgren Reference Sahlgren2006), and dictionary-based features in five diverse domains (reviews for books and hotels; opinions about abortion, death penalty, and best friend). The results revealed the difficulties of building a robust cross-domain classifier. More specifically, the average accuracy of 86% in the one-domain setting dropped to a range of 52% to 64% in a cross-domain setting, where a data set is kept for testing and the rest are used for training. LDA was also used by Jia et al. (Reference Jia, Zhang, Wang and Liu2018) along with term frequency and word2vec (Mikolov et al. Reference Mikolov, Sutskever, Chen, Corrado and Dean2013) for the feature extraction step in a supervised approach to distinguish between fake and non-fake hotel and restaurant reviews. These different features types were examined both separately and in combination, while three classifiers were trained, namely logistic regression, SVM, and multilayer perceptron (MLP) (Rumelhart and McClelland Reference Rumelhart and McClelland1987). The evaluation was performed using the Yelp filter data setFootnote d (Mukherjee et al. Reference Mukherjee, Venkataraman, Liu and Glance2013a), and the experimental results showed that the combinations of LDA with logistic regression and LDA with MLP performed better with 81% accuracy. The work of Martinez-Torres and Toral (Reference Martinez-Torres and Toral2019) focuses on how features may change influenced by the nature of the text in terms of content and polarity. The proposed method examines three different features types based on a bag of words representation. The first type uses all the words in a vocabulary (after a preprocessing step), the second one selects word features that are uniquely associated with each class (deceptive, truthful), while the third one further extends the classes to four, also adding the sentiment polarity factor. The data set of Ott et al. (2011 Reference Ott, Cardie and Hancock2013) was used for the evaluation of the six classifiers (i.e., k-NN, logistic regression, SVM, random forest, gradient boosting, and MLP) that were employed.
Fontanarava et al. (Reference Fontanarava, Pasi and Viviani2017) proposed combining a large number of reviews along with reviewer features for the detection of fake reviews. Some of the features were newly introduced for the task inspired by relevant research in fake news. Features were fed to a random forest classifier which was evaluated on the Yelp filter data set. The results show that the combined features were beneficiary for the task studied.
Finally, various kinds of embeddings (e.g., token, node, character, document, etc.) and deep learning approaches have been applied to the deception detection task. One of the first works is that of Ren and Ji (Reference Ren and Ji2017) that employs a Bidirectional Long Short-Term Memory network (BiLSTM) (Graves et al. Reference Graves, Jaitly and Mohamed2013) to learn document-level representations. A semi-supervised approach is employed in Yilmaz and Durahim (Reference Yilmaz and Durahim2018) for the detection of spam reviews, by using a combination of doc2vec (Le and Mikolov Reference Le and Mikolov2014) and node2vec (Grover and Leskovec Reference Grover and Leskovec2016) embeddings. These embeddings are then fed into a logistic regression classifier to identify opinion spam. Zhang et al. (Reference Zhang, Du, Yoshida and Wang2018) proposed a deceptive review identification method that uses recurrent convolutional neural networks (Liang and Hu Reference Liang and Hu2015) for opinion spam detection. The basic idea is that since truthful reviews have been written by people in the context of the real experience, while the deceptive ones are not, this contextual information can be exploited by the model. Aghakhani et al. (Reference Aghakhani, Machiry, Nilizadeh, Kruegel and Vigna2018) adopted Generative Adversarial Networks (GANs) (Goodfellow et al. Reference Goodfellow, Pouget-Abadie, Mirza, Xu, Warde-Farley, Ozair, Courville and Bengio2014) for the detection of deceptive reviews.
Non-English and multilanguage research
Without a doubt, the English language engrosses the majority of the research interest for the task of deception detection, due to the bigger pool of English speaking researchers, the interest of industry for commercial exploitation and the abundance of linguistic resources. However, analogous approaches have been utilized also in other languages.
In the work of Verhoeven and Daelemans (Reference Verhoeven and Daelemans2014), the task of deception detection from text for the Dutch language is explored by using an SVM with unigram features. In the absence of any related data set, the authors proceeded with the construction of their own data set. SVMs have also been used for deception detection in opinions written in Spanish with the use of the Spanish version of the LIWC (Almela et al. Reference Almela, Valencia-Garca and Cantos2012).
Similarly, in the work of Tsunomori et al. (Reference Tsunomori, Neubig, Sakti, Toda and Nakamura2015), a dialogue corpus for the Japanese language is presented and subsequently a binary classification based on decision trees over this corpus is performed using acoustic/prosodic, lexical, and subject-dependent features. The comparison with a similar English corpus has shown interesting results. More specifically, while in the prosodic/acoustic features, there were no differences between the two languages, in lexical features the results were greatly different. In English, noise, third person pronoun, and features indicating the presence of “Yes” or “No” were effective. In Japanese the lexical features used in this research were largely ineffective; and only one lexical feature, the one that indicated the presence of a verb base form, proved effective.
For the Chinese language, one of the first studies is that of Zhou and Sung (Reference Zhou and Sung2008) who examined the computer-mediated communication of Chinese players engaged in the Werewolf game. Having as starting point prior research for English, they ended up with a list of features (e.g., number of words, number of messages, average sentence length, average word length, total number of first-person and third person singular/plural pronouns) and they performed statistical analysis. Results revealed that, consistent with some studies for English speakers, the use of third person pronouns increased during deception. In Chinese though, there were no significant differences between the proportional use of first pronouns.
For spam detection in Arabic opinion texts an ensemble approach has been proposed by Saeed et al. (Reference Saeed, Rady and Gharib2019). A stacking ensemble classifier that combines a k-means classifier with a rule-based classifier outperforms the rest of the examined approaches. Both classifiers use content-based features, like n-grams. Given the lack of data sets for fake reviews in Arabic, the authors use for evaluation purposes the translated version of the data set of Ott et al. (Reference Ott, Choi, Cardie and Hancock2011, Reference Ott, Cardie and Hancock2013). They also use this data set for the automatic labeling of a large data set of hotel reviews in Arabic (Elnagar et al. Reference Elnagar, Lulu and Einea2018). A supervised approach is also utilized for deceptive review detection in Persian (Basiri et al. Reference Basiri, Safarian and Farsani2019). In this work, POS tags, sentiment-based features, and metadata (e.g., number of positive/negative feedback, overall product score, review length, etc.) are exploited to construct and compare various classifiers (e.g., naive Bayes, SVMs, and decision trees). A data set with 3000 deceptive and truthful mobile reviews was gathered using customers reviews published in digikala.com. The labeling of the latter data set was performed by using a majority voting on the answers of 11 questions previously designed for spam detection by human annotators.
Last but not least, to the best of our knowledge, the only work toward the creation of cross-cultural deception detection classifiers is the work of Perez-Rosas et al. (2014; 2014). Similar to our work, country is used as a proxy for culture. Using crowdsourcing, the authors collected four deception data sets. Two of them are in English, originating from the United States and from India, one in Spanish obtained from speakers from Mexico, and one in Romanian from people from Romania. Next, they built classifiers for each language using unigrams and psycholinguistic (based on LIWC) features. Then, they explored the detection of deception using training data originating from a different culture. To achieve this, they investigated two approaches. The first one is based on the translation of unigrams features, while the second one is based on the equivalent LIWC semantic categories. The performance, as expected, dropped in comparison with the within-culture classification and was similar for both approaches. The analysis for the psycholinguistic features showed that there are word classes in LIWC that only appear in some of the cultures, for example, classes related to time appear in English texts written by Indian people and in Spanish texts but not in the US data set. Lastly, they observed that deceivers in all cultures make use of negation, negative emotions, and references to others and that truth tellers use more optimism and friendship words, as well as references to themselves.
3. Data sets
We experimented with eleven data sets from six countries, namely United States, Belgium, India, Russia, Romania, and Mexico. We provide a detailed description of each data set below, while Table 4 provides some statistics and summarizes important information for each data set. We put much effort on the collection and the creation of the appropriate data sets. We wanted to experiment with fairly diverse cultures in terms of the degree of individualism/collectivism, having at the same time at our disposal basic linguistic tools and resources for the linguistic features extraction step.
Overview of the used data sets. The corresponding columns are (a) data set, (b) culture, (c) language, (d) type, (e) origin, (f) collection process, (g) number of total, truthful, and deceptive documents, and (h) average length of words in truthful and deceptive documents. (T) stands for truthful and (D) for deceptive, while (I) stands for individualist cultures and (C) for collectivist cultures. Truthful documents tend to be longer than deceptive ones, except in Bluff and Russian collections

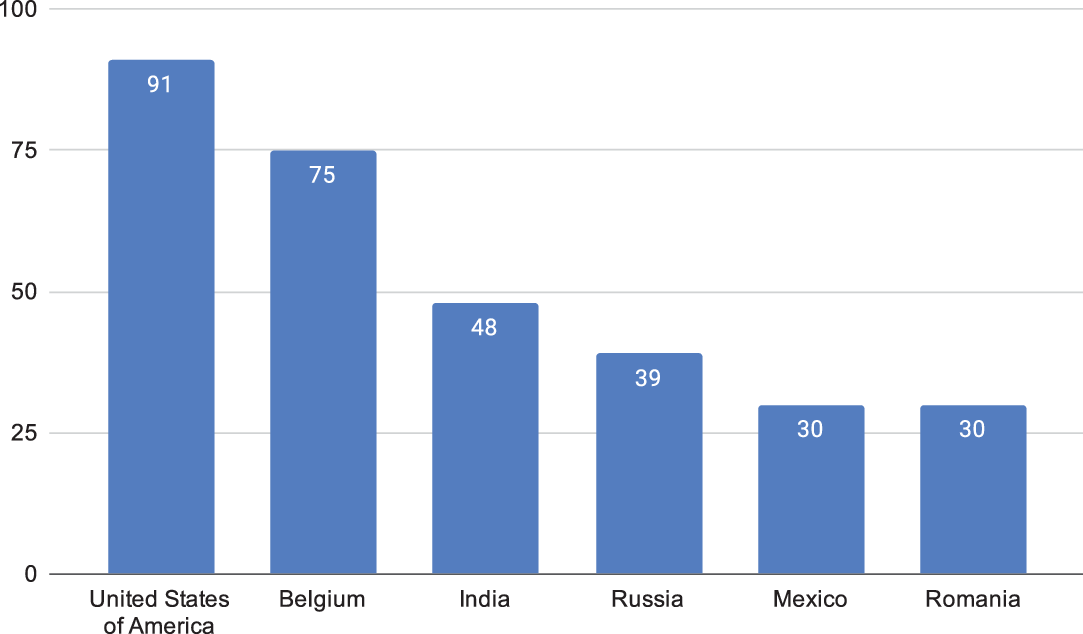
In terms of the quantification of cultural diversity, we based our work on Hofstede’s long-standing research on cultural differences (Hofstede Reference Hofstede2001). Hofstede defined a framework that distinguishes six dimensions (power distance, individualism/collectivism, uncertainty avoidance, masculinity/femininity, long-term/short-term orientation, and indulgence/restraint) along which cultures can be characterized. In his study, as in our work, country has been used as a proxy for culture. For each dimension, Hofstede’s provides a score for each culture. Figure 1 depicts the cultural differences for the six aforementioned countries for the individualism dimension, which is the focus of our work. The individualism scores vary significantly, with United States possessing the highest one and both Mexico and Romania the lowest. We acknowledge that treating entire countries as single points along the individualism/collectivism dimension may be an over-simplification, especially for large countries. In the United States, for example, there is heterogeneity and diversity between regions (e.g., between Deep South and Mountain West) and even in the same region there may be different cultural backgrounds. However, the United States can be considered individualistic at an aggregate level, although there is a measurable variation on the value of this dimension (Vandello and Cohen Reference Vandello and Cohen1999; Taras et al. Reference Taras, Steel and Kirkman2016).
Differences between cultures along Hofstede’s individualism dimension (source: https://www.hofstede- insights.com/product/compare-countries/).
The creation of reliable and realistic ground truth data set for the deception detection task is considered a difficult task on its own (Fitzpatrick and Bachenko Reference Fitzpatrick and Bachenko2012). In our case, the selected corpora have been created using the traditional techniques for obtaining corpora for deception detection research, namely sanctioned and unsanctioned deception. Briefly, a sanctioned lie is a lie to satisfy the experimenter’s instructions, for example, participants are given a topic, while an unsanctioned lie is a lie that is told without any explicit instruction or permission from the researcher, for example, diary studies and surveys in which participants recall lies already uttered. Crowdsourcing platforms, for example, Amazon Mechanical TurkFootnote e , have also been used for the production of sanctioned content. In all sanctioned cases, a reward (e.g., a small payment) was given as a motivation. In addition, apart from the already existing data sets in the bibliography, we created a new data set (see Section 3.4) that concerns spoken text from transcripts of a radio game show.
English – Deceptive Opinion Spam (OpSpam)
The OpSpam corpusFootnote f (Ott et al. 2011 Reference Ott, Cardie and Hancock2013) was created with the aim to constitute a benchmark for deceptive opinion spam detection and has been extensively used as such in subsequent research efforts. The authors approached the creation of the deceptive and truthful opinions in two distinct ways. First, they chose hotel reviews as their domain, due to the abundance of such opinions on the Web and focused on the 20 most popular hotels in Chicago and positive sentiment reviews. Deceptive opinions were collected by using Amazon Mechanical Turk. Quality was ensured by applying a number of filters, such as using highly rated turkers, located in the Unites States and allowing only one submission per turker. Based on these restrictions, 400 deceptive positive sentiment opinions were collected. Second, the truthful opinions were collected from TripAdvisorFootnote g for the same 20 hotels as thoroughly described in Ott et al. (Reference Ott, Choi, Cardie and Hancock2011). Only 5-star reviews were kept to collect reviews with positive sentiment, eliminating all non-English reviews, all reviews with less than 150 characters, and reviews of authors with no other reviews. This was an effort to eliminate possible spam from the online data. Then, 400 truthful comments were sampled to create a balanced data set. The same procedure was followed for negative sentiment reviews, by collecting 400 more deceptive opinions with negative sentiment through Amazon Mechanical Turk, and 400 truthful with 1 or 2 star reviews from various online sites. For more details, see Ott et al. (Reference Ott, Cardie and Hancock2013).
Human performance was assessed with the help of volunteers. They asked three untrained undergraduate university students to read and judge the truthfulness and deceptiveness of a subset of the acquired data sets. An observation from the results is that human deception detection performance is greater for negative (61%) rather than positive deceptive opinion spam (57%). But in both cases, automated classifiers outperform human performance.
In this work, we proceeded with the unification of these two data sets. The corpus contains:
-
400 truthful positive reviews from TripAdvisor (Ott et al. Reference Ott, Choi, Cardie and Hancock2011),
-
400 deceptive positive reviews from Mechanical Turk (Ott et al. Reference Ott, Choi, Cardie and Hancock2011),
-
400 truthful negative reviews from Expedia, Hotels.com, Orbitz, Priceline, TripAdvisor, and Yelp (Ott et al. Reference Ott, Cardie and Hancock2013),
-
400 deceptive negative reviews from Mechanical Turk (Ott et al. Reference Ott, Cardie and Hancock2013).
3.2 English – Boulder Lies and Truth Corpus (Boulder)
Boulder Lies and Truth corpusFootnote h (Salvetti et al. Reference Salvetti, Lowe and Martin2016) was developed at the University of Colorado Boulder and contains approximately 1500 elicited English reviews of hotels and electronics for the purpose of studying deception in written language. Reviews were collected by crowdsourcing with Amazon Mechanical Turk. During data collection, a filter was used to accept US – only submissions (Salvetti Reference Salvetti2014). The original corpus divides the reviews in three categories:
-
Truthful: a review about an object known by the writer, reflecting the real sentiment of the writer toward the object of the review.
-
Opposition: a review about an object known by the writer, reflecting the opposite sentiment of the writer toward the object of the review (i.e., if the writers liked the object they were asked to write a negative review, and the opposite if they did not like the object).
-
Deceptive (i.e., fabricated): a review written about an object unknown to the writer, either positive or negative in sentiment.
This is one of the few available data sets that distinguish different types of deception (fabrications and lies). Since the data set was constructed via turkers, the creators of the data set took extra care to minimize the inherent risks, mainly the tendency of turkers to speed up their work and maximize their economic benefit through cheating. More specifically, the creators implemented several methods to validate the elicited reviews, checking for plagiarism efforts and the intrinsic quality of the reviews. We unified the two subcategories of deception (fabrication and lie), since the focus of this work is to investigate deceptive cues without regard to the specific type of deception.
3.3 English – DeRev
The DeRev data set (Fornaciari and Poesio Reference Fornaciari and Poesio2014) comprises deceptive and truthful opinions about books. The opinions have been posted on Amazon.com. This is a data set that provides “real life” examples on how language is used to express deceptive and genuine opinions, that is, this is an example of a corpus of unsanctioned deception. Without a doubt, manually detecting deceptive posts in this case is a very challenging task, since it is impossible to find definite proof that a review is truthful or not. For that reason a lot of heuristic criteria were employed and only a small subset of the collected data set that had high degree of confidence was accepted to be included in the gold standard data set. In more details, only 236 out of the 6819 reviews that were collected (118 deceptive and 118 truthful) constituted the final data set. The starting point for identifying the deceptive and genuine clues that define the heuristic criteria was a series of articlesFootnote i , Footnote j , Footnote k , Footnote l with suggestions and advice about how to unmask a deceptive review in the Web, as well as specific incidents of fake reviews that have been disclosed. Such clues are the absence of information about the purchase of the reviewed book, the use of nicknames, reviews that have been posted for the same book in a short period of time, and a reference to a suspicious book (i.e., a book whose authors have been accused of purchasing reviews, or have admitted that they have done so). The truthfulness of the reviews was identified in a similar manner by reversing the cues. We performed a manual inspection, which confirmed that all of the 113 reviewers of the 236 reviews we used (excluding 8 reviewers whose accounts were no longer valid) had submitted at least one review marked by the platform as having been submitted in the United States. Hence, it is reasonable to assume that the vast majority of the reviewers were US-based.
3.4 English – Bluff The Listener (Bluff)
The “Wait Wait… Don’t Tell Me!” is an hour-long weekly radio news panel game show produced by Chicago Public Media and National Public Radio (NPR)Footnote m that airs since 1998. One of the segments of this show is called “Bluff the Listener” in which a contestant listens to three thematically linked news reports from three panelists, one of which is truthful and the rest are fictitious. Most of the stories are humorous and somewhat beyond belief, for example, a class to teach your dog Yiddish. The listener must determine the truthful story in order to win a prize, whereas at the same time the panelist that is picked is awarded with a point to ensure the motivation for all the participants. An archive of transcripts of this show is available since 2007 in the official web page of the show. We used these transcripts and we managed to retrieve and annotate 178 deceptive and 89 truthful stories. Consequently, we collected the participant’s replies to calculate the human success rate. Interestingly, the calculated rate was about 68%, which is quite high since in experimental studies of detecting deception, the accuracy of humans is typically only slightly better than chance, mainly due to truth bias as previously mentioned. This might be attributed to the fact that the panelists of the show have remained almost the same, and as a result the listeners might have learned their patterns of deception over time. In addition, we have to stress that the intent of the panelists to deceive is intertwined with their intent to entertain and amuse their audience. Hence, it is interesting to examine if the linguistic cues of deception can be distorted by this double intent, and if they still suffice to discriminate between truth and deception even in this setting.
3.5 English/Spanish/Romanian – Cross-cultural deception
To the best of the authors’ knowledge, this is the only available multicultural data set constructed for cross-cultural deception detectionFootnote n (Pérez-Rosas and Mihalcea Reference Pérez-Rosas and Mihalcea2014; Pérez-Rosas et al. Reference Pérez-Rosas, Bologa, Burzo and Mihalcea2014). It covers four different languages, EnglishUS (English spoken in the US), EnglishIndia (English spoken by Indian people), SpanishMexico (Spanish spoken in Mexico), and Romanian, approximating culture with the country of origin of the data set. Each data set consists of short deceptive and truthful essays for three topics: opinions on abortion, opinions on death penalty, and feelings about a best friend. The two English data sets were collected from English speakers using Amazon Mechanical Turk with a location restriction to ensure that the contributors are from the country of interest (United States and India). The Spanish and Romanian data sets were collected from native Spanish and Romanian speakers using a web interface. The participants for Spanish and Romanian have been recruited through contacts of the paper’s authors. For all data sets, the participants were asked first to provide their truthful responses, and then their deceptive ones. In this work, we use all the available individual data sets. We detected a number of spelling errors and some systematic punctuation problems in both English data sets, with the spelling problems to be more prevalent in the EnglishIndia data set. To this end, we decided to correct the punctuation errors, for example, “kill it.The person”, in a preprocessing step in both data sets. Regarding the spelling errors, we found no correlation between the errors and the type of text (deceptive, truthful), and since the misspelled words were almost evenly distributed among both types of text, we did not proceed to any correction.
3.6. Dutch – CLiPS stylometry investigation (CLiPS)
CLiPS Stylometry Investigation (CSI) corpus (Verhoeven and Daelemans Reference Verhoeven and Daelemans2014) is a Dutch corpus containing documents of two genres namely essays and reviews. All documents were written by students of Linguistics & Literature at the University of AntwerpFootnote o , taking Dutch proficiency courses for native speakers, between 2012 and 2014. It is a multipurpose corpus that serves in many stylometry tasks such as detection of age, gender, authorship, personality, sentiment, and deception, genre. The place that authors grew up is provided in the metadata. On this basis, it is known that only 11.2% of the participants grew up outside Belgium, with the majority of them (9.7% of the total authors) grown up in the neighboring country of the Netherlands.
This corpus, which concerns the review genre, contains 1298 (649 truthful and 649 deceptive) texts. All review texts in the corpus are written by the participants as a special assignment for their course. Notice that the participants did not know the purpose of the review task. For the collection of the reviews students were asked to write a convincing review, positive or negative, about a fictional product while the truthful reviews reflect the authors real opinion on an existing product. All the reviews were written about products from the same five categories: smartphones, musicians, food chains, books, and movies.
3.7. Russian – Russian Deception Bank (Russian)
For the Russian language, we used the corpus of the rusProfilingLabFootnote p (Litvinova et al., Reference Litvinova, Seredin, Litvinova and Lyell2017). It contains truthful and deceptive narratives written by the same individuals on the same topic (“How I spent yesterday” etc.). To minimize the effect of the observers paradox Footnote q , researchers did not explain the aim of the research to the participants. Participants that managed to deceive the trained psychologist who evaluated their responses were rewarded with a cinema ticket voucher. The corpus consists of 113 deceptive and 113 truthful texts, written by 113 individuals (46 males and 67 females) who were university students and native Russian speakers. Each corpus text is accompanied by various metadata such as gender, age, and results of a psychological test.
3.8. English – Native English (NativeEnglish)
Finally, we combined all the data sets that were created from native English speakers (i.e., OpSpam, Boulder, DeRev, Bluff, and EnglishUS) in one data set. The idea is to create one multidomain data set, big enough for training, where the input is provided by native speakers.
4. Features
In this section, we detail the feature selection and extraction processes. Furthermore, we explicitly define the features that we exploited for pinpointing differences between cultures.
4.1. Features extraction
We have experimented with three feature types along with their combinations, namely a plethora of linguistic cues (e.g., word counts, sentiment, etc.), various types of n-grams, and token embeddings. Linguistic indicators are extracted based on prior work, as already analyzed in Sections 2.3 and 2.4. Further, we have evaluated various types of n-grams in order to identify the most discriminative ones. The use of n-grams is among the earliest and more effective approaches for the task of deception detection. Ott et al. (Reference Ott, Choi, Cardie and Hancock2011) and Fornaciari et al. (Reference Fornaciari, Celli and Poesio2013) were among the first to use word n-grams for deception detection, while character n-grams and syntactic n-grams (defined below) have been used by Fusilier et al. (Reference Fusilier, Montes-y Gómez, Rosso and Cabrera2015) and Feng et al. (Reference Feng, Banerjee and Choi2012), respectively. Lastly, due to the absence of a large training corpus, we tried to combine feature engineering and statistical models, in order to enhance the overall performance and get the best of both worlds. This approach is in line with recent research on deception detection that tries to leverage various types of features (Bhatt et al. Reference Bhatt, Sharma, Sharma, Nagpal, Raman and Mittal2018; Krishnamurthy et al. Reference Krishnamurthy, Majumder, Poria and Cambria2018; Siagian and Aritsugi Reference Siagian and Aritsugi2020).
4.2. Linguistic cues
Table 5 presents the complete list of features for each language explored in this work. These features count specific cues in text, aiming to capture characteristics of deceptive and truthful language. These indicators have been conceptually divided into six categories, namely word counts, phoneme counts, pronoun use, sentiment, cognitive complexity, and relativity. The absence of a tick in Table 5 marks the inability to extract the specific feature, given the available linguistic tools and resources for each language while the “N/A” marks the nonexistence of the particular feature in the specific language, that is, articles in Russian.
The list of used features. Features that are examined in Taylor’s work (2014, Reference Taylor, Larner, Conchie and Menacere2017) are marked with an asterisk (*). The dot ( $\bullet$
) marks nonnormalized features. Absence of a tick marks the inability to extract this specific feature for this particular language. The N/A indicates that this feature is not applicable for this particular language
$\bullet$
) marks nonnormalized features. Absence of a tick marks the inability to extract this specific feature for this particular language. The N/A indicates that this feature is not applicable for this particular language

Although we believe that most feature names are self-explanatory, we have to describe further the #hedges and #boosters features. Hedges is a term coined by the cognitive linguist George Lakoff (Reference Lakoff1973) to describe words expressing some feeling of doubt or hesitancy (e.g., guess, wonder, reckon etc.). On the contrary, boosters are words that express confidence (e.g., certainly, apparently, apparent, always). Both are believed to correlate either positively or negatively with deception and thus are frequently used in related research work (Bachenko et al. Reference Bachenko, Fitzpatrick and Schonwetter2008). Regarding the important feature of pronouns, we consider first person pronouns in singular and plural form, for example, I versus we, mine versus ours, etc., third person pronouns, for example, they, indefinite pronouns, for example, someone, anyone, etc., demonstrative pronouns (e.g., this, that, etc.), and the total number of pronouns. The linguistic tools used for the extraction of the features, for example, POS taggers, named entity recognition tools, etc., are shown in Table 8. Some of the features were extracted with handcrafted lists authored or modified by us. Such features include filled pauses (e.g., ah, hmm etc.), motion verbs, hedge words, boosters, etc.
Phoneme connection to sentiment in phonological iconicity studies


Linguistic tools used on each language for the extraction of features

Table 7 lists the sentiment analysis tools used for each language. We exploited, whenever possible, language-specific sentiment lexicons used in the bibliography and avoided the simple solution of automatically translating sentiment lexicons from American English. Related research (Mohammad et al. Reference Mohammad, Salameh and Kiritchenko2016) has shown that mistranslation (e.g., positive words translated as having neutral sentiment in the target language), cultural differences, and different sense distributions may lead to errors and may insert noise when translating sentiment lexicons. Analogously, we maintained the same practice for the rest of the features. When this was not feasible, we proceeded with just the translation of linguistic resources (mostly for the Russian language). For the #spatial words feature that counts the number of spatial references in text, we followed a two-step process. We employed a combination of a named entity recognizer (NER) tool (see Table 8) and spatial lexicons for each language. The lexicons, principally gathered by us, contain spatially related words (e.g., under, nearby, etc.) for each language, while the named entity recognizer extracts location related entities from the corpora (e.g., Chicago, etc.). In the case of the English language, the existence of a spatial word in the text was computed using a dependency parse, in order to reduce false positives. The final value of this feature is the sum of the two values (spatial words and location named entities). For Romanian, we had to train our own classifier based on Conditional Random Fields (CRFs) (Lafferty et al. Reference Lafferty, McCallum and Pereira2001; Finkel et al. Reference Finkel, Grenager and Manning2005) by using as training corpus the RONEC (Dumitrescu and Avram Reference Dumitrescu and Avram2020b) corpus, an open resource that contains annotated named entities for 5127 sentences in Romanian.
The values of the features were normalized depending on their type. For example, the #nasals feature was normalized by dividing with the total number of characters in the document, while the #prepositions with the number of tokens in the document. The features #words, #lemmas, #punctuaction marks, average word length, mean sentence length, and mean preverb length were left nonnormalized. For each sentiment lexicon, except for ANEW, we computed the score by applying the following formula to each document d of $|d|$
tokens and each sentiment s (positive
$|d|$
tokens and each sentiment s (positive $\mid$
negative):
$\mid$
negative):
 \begin{align*}\textrm{sentiment_score}(d, s) =\frac{\sum_{w \in d} \textrm{sentiment_strength}(w, s)} {|d|}\end{align*}
The sentiment_strength for SentiWordNet is a value in the interval [0,1] while for the rest sentiment resources the values are either 0 or 1.
For the ANEW lingustic resource (Bradley and Lang Reference Bradley and Lang1999) that rates words in terms of pleasure (affective valence), arousal, and dominance with values from 0 to 10, we only considered the normalized valence rating that expresses the degree of positivity or negativity of a word. The applying formula in this case is
 \begin{align*}\textrm{ANEW-sentiment_score}(d) =\frac{\sum_{w \in d} \textrm{(ANEW_valence}(w)-5)} {|d|\cdot5}\end{align*}
Lastly, we included phoneme-related features in our analysis. Our hypothesis was that phonological features, captured by phonemes for text, will be more discriminative in spoken data sets, since the deceiver will put extra care to sound more truthful to the receiver, even subconsciously. This hypothesis is in line with an increasing volume of work that investigates the existence of non-arbitrary relations between phonological representation and semantics. This phenomenon is known as phonological iconicity and links a word’s form with the emotion it expresses (Nastase et al. Reference Nastase, Sokolova and Shirabad2007; Schmidtke et al. Reference Schmidtke, Conrad and Jacobs2014). Table 6 summarizes such representative works.
4.3. N-grams
We have evaluated several variations of n-grams from various levels of linguistic analysis to encode linguistic information. Given the diversity of the data sets, we used different types of n-grams to identify those that are more effective in discriminating deceptive and truthful content. For each n-gram type and for each data set, we extracted unigrams, bigrams, trigrams, unigrams+bigrams, bigrams+trigrams, and unigrams+bigrams+trigrams. Some examples are shown in Table 9.
-
Phoneme n-grams: These features were extracted from the phonetic representation of texts derived by applying the spelling-to-phoneme module of the espeak-ng speech synthesizer (see Table 8). We examined phoneme n-grams at the level of words.
-
Character n-grams: Consecutive characters that can also belong to different words.
-
Word n-grams: We examined versions with and without stemming and stopword removal.
-
POS n-grams: POS n-grams are contiguous part-of-speech tag sequences, such as adjective-noun-verb, noun-verb-adverb, and so on, that provide shallow grammatical information. We extracted POS n-grams using the appropriate POS-tagger for each language (see Table 8).
-
Syntactic n-grams: syntactic n-grams (sn-grams) are constructed by following all the possible paths in dependency trees and keeping the labels of the dependencies (arcs) along the paths. We used Stanford’s CoreNLP syntactic parser for the construction of dependency trees for the English data sets (see Table 8).
Examples of n-gram features

4.4. BERT embeddings
Regarding token embeddings, we used the contextualized embeddings from the BERT (Devlin et al. Reference Devlin, Chang, Lee and Toutanova2019) model. BERT, which stands for Bidirectional Encoder Representations from Transformers, is a language model based on a stack of transformer encoder layers pretrained on a large unlabeled cross-domain corpus using masked language modeling and next-sentence prediction objectives. Since its introduction, BERT has achieved state-of-the-art results in many NLP tasks. In most cases, the best results are obtained by adding a shallow task-specific layer (e.g., a linear classifier) on top of a pretrained BERT model, and fine-tuning (further training) the pretrained BERT model jointly with the task-specific layer on a labeled task-specific data set. In effect, each encoder layer of BERT builds token embeddings (dense vectors, each representing a particular token of the input text). The token embeddings of each encoder layer are revised by the next stacked encoder layer. A special classification embedding ([CLS]) is also included in the output of each layer, to represent the entire input text. In classification tasks, typically the [CLS] embedding of the top-most encoder layer is passed on to the task-specific classifier, which in our case decides if the input text is deceptive or not. We explore this approach in Section 6.2. We note that BERT uses a WordPiece tokenizerFootnote r (Schuster and Nakajima Reference Schuster and Nakajima2012), which segments the input text in tokens corresponding to character sequences (possibly entire words, but also subwords or even single characters) that are frequent in the large corpus BERT is pretrained on. We also note that BERT’s token embeddings are context-aware, that is, different occurrences of the same token receive different embeddings when surrounded by different contexts. In Table 10, we provide details about the used BERT models. We exploit pretrained models on each language, as well as the multilingual BERT model, which is pretrained over Wikipedia in 104 languages.
BERT pretrained models used for each language

5. Statistical evaluation of linguistic cues
In this section, we conduct a statistical analysis of the linguistic cues (see Section 4.2) per data set. In more details, we conduct a Mann–Whitney U test to identify the statistically significant linguistic features of each data set (the NativeEnglish data set is the unified data set of all native English speakers data sets). Afterward, we apply a multiple logistic regression (MLR) analysis over the statistically important features of each data set. This test shows the distinguishing strength of the important linguistic features. We discuss the results for each data set/culture and try to provide some cross-cultural observations.
5.1. Statistical significance analysis
Since we cannot make any assumption about the distribution of the feature values in each data set, we performed the nonparametric Mann–Whitney U test (two-tailed) with a 99% confidence interval and $\alpha = 0.01$
. The null hypothesis (H0) to be refuted is that there is no statistically significant difference between the mean rank of a feature for texts belonging to the deceptive class and the mean rank of the same feature for texts belonging to the truthful class. The results are available in the Appendix Tables 31 and 32. Below we summarize the main observations.
$\alpha = 0.01$
. The null hypothesis (H0) to be refuted is that there is no statistically significant difference between the mean rank of a feature for texts belonging to the deceptive class and the mean rank of the same feature for texts belonging to the truthful class. The results are available in the Appendix Tables 31 and 32. Below we summarize the main observations.
-
1. No statistically significant features were found in the Russian collection and as a result we ignore this data set in the rest of this analysis. This is probably due to the inappropriateness of the selected features and/or the shortage of language resources for the Russian language, or even because of the intrinsic properties and peculiarities of the data set itself. This suggests that we cannot come to any conclusion about how the linguistic features are used in this data set and compare it with the rest.
-
2. Statistically significant differences were found in most of the data sets for the features: #lemmas, #words, and #punctuation. In more details:
-
The importance of #lemmas is observed in most of the data sets. A large number of lemmas seems to be a signal for truthful texts in most of the examined data sets, with the exception of the DevRev and Bluff data sets, where a large number of lemmas is a signal for deceptive texts. These two data sets are quite distinct from the rest, since the former is an example of unsanctioned deception, while the latter concerns transcriptions of spoken data with notably stylistic elements like humor and paralogism. Although, we cannot characterize it as a universal feature, since it is not observed in the Russian data set, it is a language-agnostic cue that seems to be employed across most cultures.
-
The same observations hold also for the feature #words, with the exception that it is not statistically significant for the OpSpam dataset.
-
Regarding the #punctuation feature, it is rather important for all data sets except for Bluff and DeRev. Since Bluff is a data set created from transcripts, the transcription process might shadow the intonation and emotional status of the original agent with the idiosyncrasies of the transcriber/s, for example, there are almost zero exclamations. Furthermore, the use of punctuation, except in DeRev and Bluff, is an indication of truthful text.
-
-
3. An observation of possibly cultural origin is the fact that sentiment-related features, positive or negative, are notably important for the individualist cultures (US and Dutch). The expression of more positive sentiment vocabulary is linked with the deceptive texts, while negative sentiment is linked to truthful text, except in the EnglishUS case, where the negative sentiment is related to the deceitful texts. For the collectivistic cultures that are more engaged in the high context communication style, sentiment-related features are not distinguishing. As explained earlier, the effort to restrain sentiment and keep generally friendly feelings toward the others in order to protect social harmony might be responsible for this difference. Our findings contradict Taylor’s results and are in agreement with his original hypothesis and related studies like Seiter et al. (Reference Seiter, Bruschke and Bai2002) (see Section 2.3).
-
4. Another important finding of our experiments is that in almost all data sets, the formulation of sentences in past tense is correlated with truth, while in present tense with deception, independently of the individualistic score of the corresponding culture. This can be attributed to the process of recalling information in the case of truthful reviews or opinions. In the case of deception, present tense might be used due to preference to simpler forms, since the deceiver is in an already overloaded mental state. In the US data sets, the only exceptions are the Bluff and the OpSpam data sets, where we observe the opposite. However, in the OpSpam data set, these two features are not statistically significant.
-
5. Furthermore, the #modal verbs is important in the US data sets. Specifically, an increased usage of modal verbs usually denotes a deceptive text.
-
6. Another cross-cultural observation correlated with the degree of individualism is the #spatial words feature. Specifically, for the data sets where this feature is important, we observe a difference in the frequency of spatial details for the deceptive texts in the collectivist data sets and the truthful texts in the individualistic ones. In detail, more spatial features are linked with deception for the Romanian and SpanishMexico data sets, while their frequency is balanced in the case of Dutch and diverges to truthful text for the NativeEnglish data set. These observations are in agreement with Taylor (see Table 3). On top of that, discrepancies in the quantity of spatial details have also been found in different modalities (Qin et al. Reference Qin, Burgoon, Blair and Nunamaker2005). More specifically, deceivers had significantly fewer spatial details than truth-tellers in audio but more in text. This signifies how sensitive this linguistic cue is not only across cultures but also when other parameters such as context or modality vary.
-
7. Regarding the #pronouns, our results show mixed indications about their usage that do not fully agree with Taylor. Notice though that we had only limited tool functionality for pronoun extraction (i.e., no tools for Dutch and SpanishMexico). As a result, we created our own lists for English and used translations for the other languages. Generally, pronouns in various forms seem to be important in most data sets. Third person pronouns are correlated with deceptive texts mainly in EnglishUS and less in the Romanian and EnglishIndia data sets, all of which belong to the same cross-cultural opinion deception detection data set and to truthful ones in the Boulder data set (with a rather small difference though). This is in partial agreement with Taylor’s results, where third-person pronouns are linked with deception in collectivist languages. Regarding first-person pronouns, the observations show mixed results. They are linked with both truthful and deceptive text, in the latter case though only for individualistic data sets (i.e., Bluff and OpSpam). Exploring the use of singular and plural forms sheds a bit more light, since the plural form is linked with truthful text in both collectivistic and individualistic cultures, except in Dutch where the plural form slightly prevails for deceptive. Finally, indefinite and demonstrative pronouns are rarely important.
-
8. The #nasal feature that counts the occurrences of /m/, /n/ and in some languages
 in texts is rather important for the highly collective SpanishMexico and Romanian data sets. It prevails in truthful texts while we observe the opposite in the individualistic NativeEnglish. This is an interesting observation that enriches the relevant research around nasals. Generally, there are various studies (see Table 6) that claim a relation between the occurrence of consonants and the emotion of words based on the physiology of articulation for various languages. Most of the studies link nasals with sadness and plosives with happiness, although there are other studies contradicting these results (see Table 6). Furthermore, nasals have been connected with different semantic classes like iconic mappings, size, and affect as shown by Schmidtke et al. (Reference Schmidtke, Conrad and Jacobs2014). Finally, notice that plosives are not statistically significant in our results. We believe that this is a direction that needs further research with larger data sets and more languages.
 -
9. Finally, the #filled pauses feature, which was incorporated to showcase differences between written and oral deception cues, does not provide any remarkable insight.
A collateral resulting observation is that most of the distinguishing features do not require complex extraction processes but only surface processing like counts on the token level.
EnglishUS and EnglishIndia data sets comparison
The EnglishUS and EnglishIndia data sets are ideal candidates to examine individualism-based discrepancies in linguistic deception cues by keeping the language factor the same. These two data sets are part of the Cross-Cultural Deception data set (see Section 3.5) and were created using the same methodology. Both contain opinions on the same topics (death penalty, abortion, best friend), in the same language, and come from two cultures with a large difference in terms of the individualism index score (91 vs. 48). Initially, to explore differences in the authors writing competence we computed the Flesch reading-ease scoreFootnote s (Kincaid et al. Reference Kincaid, Fishburne, Rogers and Chissom1975) on both data sets. The scores are similar (63.0 for the EnglishIndia data set and 63.6 for EnglishUS data set) and correspond to the same grade level. Notice though that based on Tables 31 and 32 in the Appendix, the native speakers use larger sentences and more subordinate clauses. A possible explanation is that since Indians are not native speakers of English, they might lack in language expressivity and use English similarly whether they are telling the truth or lying.
A crucial observation though is the limited number of statistically important features in the case of the EnglishIndia (only 3) compared to the EnglishUS (15). Furthermore, the pronoun usage differs a lot between the two data sets. In more details, the individualist group employs more #1st person pronouns in truthful text, while in the case of the EnglishIndia first person pronouns are not important. In the case of #3rd person pronouns, both data sets use the same amount of pronouns with a similar behavior. As already mentioned, this might be a difference of cultural origin, since individualist group deceivers try to distance themselves from the deceit, while in the collectivist group deceivers aim to distance their group from the deceit. Finally, we notice again the importance of the sentiment cues for the native English speakers and their insignificance in the EnglishIndia data set, which correlates to our previous observations. For the remaining features, it is risky to make any concluding statements in relation to cultural discrepancies.
5.2. Multiple Logistic Regression (MLR) analysis
To further examine the discriminative ability of the linguistic features and explore their relationship, we conducted a multiple logistic regression (MLR) analysis on the resulting significant features from the Mann–Whitney U test. The null hypothesis is that there is no relationship between the features and the probability of a text to be deceptive. In other words, all the coefficients of the features are considered equal to zero for the dependent variable.
Since MLR presupposes uncorrelated independent variables, we keep only the most significant feature for any set of correlated and dependent features for each data set and manually filter out the rest. For example, we keep only the single most important positive or negative sentiment feature per data set (e.g., in English where we use various lexicons). Also in the case of features that are compositions of more refined features, we keep the most refined ones when all of them are important, for example, we keep the feature pair #first person pronouns (singular) and #first person pronouns (plural) instead of the more general #first person pronouns. Overall, we cannot guarantee that there is no correlation between the features.
In Tables 11 and 12, we present the results of the MLR analysis, reporting the features with p-value < 0.1, for the native English and the cross-language cases, respectively. For each feature in the table, we report the corresponding coefficient, the standard error, the z-statistic (Wald z-statistic), and the p-value. Higher coefficient values increase the odds of having a deceptive text in the presence of this specific feature, while lower values increase the odds of having a truthful text. The Wald (or z-value) is the regression coefficient divided by its standard error. The larger magnitude (i.e., either too positive or too negative) indicates that the corresponding regression coefficient is not 0 and the corresponding feature matters. Generally, there are no features participating in all functions both in the context of the native English data sets and across different languages and cultures, an indication of how distinct the feature sets are both within and across cultures. Among different languages is difficult to conclude how the characteristics of each language (e.g., pronoun-drop languages) and/or the different extraction processes (e.g., sentiment lexicons) affect the analysis. A more thorough analysis is safer to be performed in the context of the same language though. Below, we report some observations from this analysis.
Multiple logistic regression analysis on linguistic features for each US data set. SE stands for standard error. We show in bold p-values < 0.01. Positive or negative estimate values indicate features associated with deceptive or truthful text, respectively

Multiple logistic regression analysis for each data set across cultures. The Russian dataset is absent since no significant features were found in the Mann–Whitney test. SE stands for standard error. We show in bold p-values < 0.01. Positive or negative estimate values indicate features associated with deceptive or truthful text, respectively

Native English data set observations
For the native English language data sets shown in Table 11, we observe high coefficients for the various types of pronouns (especially of the first person ones). Although there is no clear indication about their direction, most of the times they are associated with truthful text. The only exceptions are the #1st person pronouns (singular) in the case of OpSpam, the #demonstrative pronouns in the case of Boulder, and the #3rd person pronouns in the case of EnglishUS. Additionally, we can observe the importance of sentiment, as already noted in the statistical analysis, especially of positive sentiment as captured by MPQA, which highly discriminates deceptive texts in the OpSpam and Boulder data sets. Finally, the #punctuation marks feature is correlated with truthful text in many data sets, although with a lower coefficient.
Notice that in the results there are a number of features with high coefficients that appear to be strong only in one data set, for example, the #boosters, #nasals, and #hedges features that are extremely distinguishing only in the OpSpam collection. This observation indicates differences and variations among various data sets/domains, in accordance with previous considerations in the literature on how some features can capture the idiosyncrasies of a whole domain or only of a particular use case. In the case of the OpSpam, such features might be representative of the online reviews domain or might reflect how mechanical turkers fabricate sanctioned lies (Mukherjee et al. Reference Mukherjee, Venkataraman, Liu and Glance2013b).
Regarding the #spatial details feature, for which we made some interesting observations in the previous statistical analysis, we observe that they are important for discriminating truthful text only in OpSpam. The observation that fake reviews in OpSpam include less spatial language has already been pointed out by Ott et al. (Reference Ott, Choi, Cardie and Hancock2011; Reference Ott, Cardie and Hancock2013) for reviews with both positive and negative sentiment. This is not the case in situations where owners bribe customers in return for positive reviews or when owners ask their employees to write reviews (Li et al. Reference Li, Ott, Cardie and Hovy2014).
Finally, regarding the #lemmas and #words, they were not found to be important in this analysis. The same holds for the used tenses in most data sets with no clear direction.
Per culture and cross-cultural observations
Table 12 reports the per culture and cross-cultural observations. Although the resulting feature sets are quite distinct, we observe some similarities around the usage of pronouns. Again pronouns have very large coefficients in most data sets, and the usage of #1st person pronouns is correlated with truthful text for the individualistic native English and collectivist Romanian speakers, while the usage of #3rd person pronouns is correlated with deception in collectivist EnglishIndia and Romanian data sets. Positive sentiment, as already discussed, prevails in native English speakers for deceptive text, while sentiment features do not play any major role in other cultures. Additionally, the #lemmas and #words do not seem to discriminate between the different classes of text, and the usage of tenses plays a mixed and not significant role. #nasals appear to correlate with deceptive text in native English speakers, while it is the most discriminative feature for truthful text for Spanish. For the EnglishIndia data set, by far the most distinguishing feature is the #negations. This is a finding that agrees with the relevant bibliography in relation to the significance of negations in South Asian languages (see also Section 2.3). A final observation is the absence of features correlated with truthful and deceptive text in the similarly created EnglishIndia and SpanishMexico data sets, respectively.
6. Classification
In this section, we evaluate the predictive performance of different feature sets and approaches for the deception detection task. First, we present and discuss the results of logistic regression, then the results of fine-tuning a neural network approach based on the state-of-the-art BERT model, and finally we provide a comparison with other related works. As a general principle, and given the plethora of different types of neural networks and machine learning algorithms in general, this work does not focus on optimizing the performance of the machine learning algorithms to the specific data sets. Our focus is to explore, given the limited size of training data, which are the most discriminative types of features in each domain and language, and, in succession, if the combination of features is beneficial to the task of deception detection.
We split the data sets into training, testing, and validation subsets with a 70-20-10 ratio. We report the results on test sets, while validation subsets were used for fine-tuning the hyper-parameters of the algorithms. In all cases, we report Recall, Precision, F-measure, and Accuracy. These statistics were calculated according to the following definitions:
 \begin{align*}Precision\ (P): \frac{tp}{tp+fp} && F_{1}: 2\cdot \frac{ Precision\cdot Recall}{Precision+Recall}\\Recall\ (R): \frac{tp}{tp+fn} && Accuracy \ (Accu.): \frac{tp+tn}{tp + tn + fp + fn}\end{align*}
where a true positive (tp) and a true negative (tn) occurs when the model correctly predicts the positive class or negative class, respectively, while a false positive (fp) and a false negative (fn) when the model incorrectly predicts the positive and negative class, respectively.
6.1. Logistic regression experiments
Logistic regression has been widely applied in numerous NLP tasks, among which deception detection from text (Fuller et al. Reference Fuller, Biros and Wilson2009; Popoola Reference Popoola2017). We experimented with several logistic regression models, including one based on linguistic features (i.e., linguistic), various n-grams features (phoneme-gram, character-gram, word-gram, POS-gram, and syntactic-gram), and the linguistic+ model that represents the most performant model that combines linguistic features with any of the n-gram features. For our experiments, we used two implementations of logistic regression of Weka (Hall et al. Reference Hall, Frank, Holmes, Pfahringer, Reutemann and Witten2009) simple logistic (Landwehr et al. Reference Landwehr, Hall and Frank2005; Sumner et al. Reference Sumner, Frank and Hall2005) and logistic (Le Cessie and Van Houwelingen Reference Le Cessie and Van Houwelingen1992). The simple logistic has a built-in attribute selection mechanism based on LogitBoost (Friedman et al. Reference Friedman, Hastie and Tibshirani2000), while the logistic aims to fit a model that uses all attributes. In all cases, we have two mutually exclusive classes (deceptive, truthful), and we use a classification threshold of 0.5. In the case of n-grams, a preprocessing step selects the highest occurring 1000 n-gram features, while when the attribute selection is set on the CfsSubsetEval evaluator of Weka is used. The CfsSubsetEval evaluator estimates the predictive power of subsets of features.
In the following tables (Tables 13, 14, 15, 16, 17, 18, 19, 21, 22, and 23), we present the logistic regression results. We group the native English data sets and seek for differences across them, since they are written in the same language and we assume the same culture for the authors (see Section 6.1.1 and Tables 13, 14, 15, 16, and 17). Then we proceeded with cross-domain data set experiments for native English data sets, by iteratively keeping each native English data set as a testing set and using the rest as the training set (see Section 6.1.2 and Table 20). Lastly, in Section 6.1.3, we present cross-culture experiments. We report only the best performed experimental set-up in the test set based on the accuracy value for each feature type. The measures Precision, Recall, and F1 refer to the deceptive class while in all cases we report a majority baseline that classifies all instances in the most frequent class. We also report AUC (surface area under a ROC curve) measure (Hanley and Mcneil Reference Hanley and Mcneil1982). AUC value shows the probability that a randomly chosen positive instance will be ranked higher than a randomly chosen negative instance. Consequently, the closer the AUC is to 1, the better the performance of the classifier (Ling et al. Reference Ling, Huang and Zhang2003). The description of the experimental set-up uses the following notation:

Results for the OpSpam dataset

Results on the test set for the DeRev dataset

Results on the test set for the Boulder dataset

Results on the test set for the EnglishUS dataset

Results on the test set for the Bluff dataset

A list with top ten discriminating deceptive features for each native English dataset. The features are listed by decreasing estimate value as calculated by the logistic regression algorithm
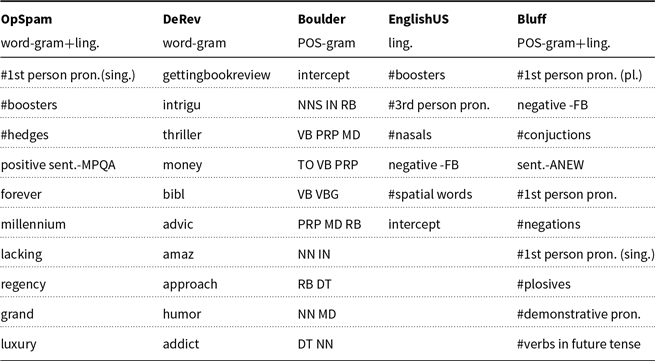
A list with top ten discriminating truthful features for each native English dataset. The features are listed by decreasing estimate value as calculated by the logistic regression algorithm

Cross-data set results for US data sets

A list with top ten discriminating deceptive features for each of the five cross-dataset cases. The features are listed by decreasing estimate value as calculated by the logistic regression algorithm

A list with top ten discriminating truthful features for each of the five cross-dataset cases. The features are listed by decreasing estimate value as calculated by the logistic regression algorithm

Per culture results

6.1.1 Native English data set experiments
Tables 13, 14, and 15 present the results for the US data sets that concern the online reviews domains (i.e., datasets OpSpam, DeRev, and Boulder). Each data set consists of reviews about a particular product category or service, with the exception of the Boulder data set, which covers the wider domain of hotels and electronic products.
In the OpSpam data set (see Section 3.1), the best performance is achieved with the combination of linguistic cues with the word-gram (unigram) configuration (86% accuracy). The other configurations, although not as performant, managed to overshadow the majority baseline (see Table 13). Additionally, the second best performance of the word unigram approach showcases the importance of the word textual content in this collection.
In the DeRev data set (see Section 3.3), the word unigram configuration offers exceptional performance (accuracy of 1.00%). The rest configurations achieve much lower performances. However, as in the case of the OpSpam data set, the performance in all the configurations is a lot better than the majority baseline. Since we were puzzled with the 1.00 value in all measures for the unigram configuration, we ran some additional experiments. Our results show that in this specific data set, there are words that appear only in one class. For example, the word “Stephen” is connected only with the truthful class and the words “thriller”, “Marshall”, “faith”, and “Alan” only with the deceptive class. After thoroughly checking how this collection was created, we found that the above observation is a result of how this data set was constructed. Specifically, the authors have used different items (i.e., books) for the deceptive and truthful cases, and as a result the classifiers learn to identify the different items. To this end, the performance of the linguistic, POS-gram, and syntactic-gram configurations are more representative for this data set, since they are more resilient to this issue.
The Boulder data set is quite challenging, since it includes two domains under the generic genre of online reviews (hotels and electronics), and two types of deception, that is, lies and fabrications (see Section 3.2). Given the above, we observe that the performance of all classifiers is much lower and close to the majority baseline (as shown in Table 15). The best accuracy is provided by the POS (bigrams+trigrams) configuration that achieves with a value of 73%, followed closely by the rest. Notice also the poor performance of the AUC measures, which is an important observation since the data set is not balanced.
The results for the EnglishUS data set, which is based on deceptive and truthful essays about opinions and feelings (see Section 3.5), are presented in Table 16. In this data set, the linguistic model offers the best performance (71% accuracy). The combination of linguistic cues with word unigrams, the POS-gram (unigrams), and the phoneme-gram (unigrams) configurations provide lower but relative close performance.
Lastly, Table 17 contains the results for the Bluff data set, which is the only data set that originates from spoken data and is multidomain (see Section 3.4). All the configurations are equal or below the major baseline which is 69%. Notice that this is a small unbalanced data set with most configurations having a low AUC performance. The inclusion of features that elicit humorous patterns could possibly improve the performance of the classifiers, since an integral characteristic of this data set is humor, a feature that we do not examine in this work.
Tables 18 and 19 present the top ten features in terms of their estimate value for each class, for the configuration with the best performance. We observe that in one-domain data sets, the content in the form of word grams is prevalent and implicitly express deceptive patterns. This is the case for the OpSpam and DeRev data sets. For example, spatial details and verbs in past tense (i.e., told, renovated, updated, based, returned) are associated with the truthful class while positive words (e.g., amazing, luxury, intriguing) are related to deceptive class. In the rest data sets that consist of different topics (i.e., two in the Boulder, three in the EnglishUS, and multiple in the Bluff data set), the best performance is achieved with the use of linguistic cues, more abstract types of n-grams such as POS-grams or with the combination of linguistic cues with n-grams. We also observe the existence of the feature “priceline” in the OpSpam list. This refers to one of the sites from which the truthful reviews were collected (e.g., Yelp, Priceline, TripAdvisor, Expedia etc.). However, since this resembles the problem in the DeRev data set in which particular features mostly are associated with one class we checked that a very small percentage of truthful reviews contain such reference. As a closing remark, we would like to showcase the rather stable performance of the linguistic models in all data sets (except maybe in the case of the Bluff data set in which the performance of all models is hindered). As a result, the linguistic cues can be considered as a valuable information for such classification models that in many cases can provide complementary information and improve the performance of other content or noncontent-based models.
6.1.2 Cross data set experiments for US data sets
In this part, we examine the performance of the classifiers when they are trained on different data sets than those on which they are evaluated. In more details, we used every native English data set once as a testing set for evaluating a model trained over the rest native English data sets.
The setting of these experiments results in highly heterogeneous data sets not only in terms of thematic but also in terms of the collection processes, the type of text (e.g., review, essay), the deception type, etc. These discrepancies seem to be reflected to the results (see Table 20). Overall, the results show that the increased training size, with instances that are connected with the notion of deception but in different context, and without sharing many other properties, are not beneficial for the task. Note also that the configuration in these experiments results in unbalanced data sets both in training and testing sets so the comparison is fairly demanding.
The performance for the linguistic-only setting has an average accuracy of 50%. These result show that there is no overlap between the distinguishing features across the data sets that can lead to an effective feature set, as has already been revealed in the MLR analysis (see Table 12). In the case of the All -Bluff data set, the linguistic cues only configuration has the lowest accuracy of 33% which is quite below the random chance. After a closer inspection, we observed that the classifier identifies only the truthful texts (recall that the Bluff data set has an analogy 2:1 in favour of the deceptive class). This could be explained by the reversed direction of important features such as the #words compared to the rest of the data sets. Moreover, there are features that are statistically significant only in this data set and not on the training collection, for example, the negative sentiment FBS, and vice versa, for example, #demonstrative pronouns. The interested reader can find the details in Table 31 in the Appendix and in Table 11.
Similarly, n-gram configurations are close to randomness in most of the cases. However, topic relatedness seems to have a small positive impact on the results for the All -OpSpam and the All -Boulder data sets, as expected, since the Boulder data set contains hotels and electronics reviews, and the OpSpam data set also concerns hotels. The high recall values for the deceptive class in some of the classifiers depict the low coverage and the differences between the data sets.
The POS-grams and the syntactic-grams settings that are less content dependent, fail to detect morphological and syntactical patterns of deception, respectively, across the data sets. This could be attributed to the fact that such n-gram patterns might not be discriminating across different data sets and due to the fact that such types of n-grams can be implicitly influenced from the unrelated content. Overall and as future work, we plan to remove strongly domain-specific attributes from the feature space, in order for the training model to rely more on function words and content independent notions. In this direction, a hint for a possible improvement is given in Tables 21 and 22, where the most performant models include functions words, auxiliary verbs, and so on.
6.1.3 Per culture experiments
For this series of experiments, we grouped data sets based on the culture of the participants. Specifically, we experiment with individualistic data sets from the US and Belgium (Hofstede’s individualistic scores of 91 and 75) and the collectivist data sets from India, Russia, Mexico, and Romania (individualistic scores of 48, 39, 30, and 30, respectively). For the United States culture, we used the unified NativeEnglish data set. This data set is unbalanced in favor of the deceptive class due to the Boulder and Bluff data sets and consists of 4285 texts in total (2498 deceptive and 1787 truthful). The results are presented in Table 23. We also measured the accuracy of pairs of of the available n-gram feature types, to check if different types of n-grams can provide different signals of deception. The results show only minor improvements for some languages. We provide the results in the Appendix (see Table 33).
Generally and despite the fact that it is safer to examine results in a per data set basis, it is evident that the word and phoneme-grams set-ups prevail in comparison with the rest of the setups. Even when the best accuracy is achieved through a combination of feature types, word, and phoneme n-grams belong to the combination. This is the case for the native English data set and the Romanian data set (see Tables 23 and 33, respectively). Overall, for all the examined data sets, the classifiers surpass the baseline by a lot.
The most perplexing result was the performance of the linguistic cues in the EnglishIndia and EnglishUS data sets (results presented in Tables 16 and 23) that are part of the cross-cultural dataset (see Section 3.5). These data sets have similar sizes, cover the same domains, and were created through an almost identical process. However, we observe that while the feature sets of the EnglishUS achieve accuracy of 71%, and the accuracy drops to 54% in the EnglishIndia. This is surprising, especially for same genre data sets that use the same language (i.e., EnglishUS and EnglishIndia). To ensure that this difference is not a product of the somewhat poor quality of text in the EnglishIndia data set (due to the orthographic problems), we made corrections in both data sets and we repeated the experiments. However, since the differences in the results were minor, it is difficult to identify the cause of this behavior. One hypothesis is that this difference in the performance of the feature sets may be attributed to the different expression of deception between these two cultures, given the fact that almost all other factors are stable. The second hypothesis is that since most Indians are non-native speakers of English, they use the language in the same way while being truthful or deceptive. This hypothesis is also supported by the fact that there are very few statistically important features for EnglishIndia, for example, #negations and the #3rd person pronoun. As a result, the classifiers cannot identify the two classes and exhibit a behavior closer to randomness. Notice that we might be noticing implications from both hypotheses, since the #3rd person pronoun is also important while deceiving for the collectivistic Romanian.
Lastly, to get a visual insight over the above results we present the most valuable features for the configuration that achieved the best accuracy in the logistic regression experiments for all the examined data sets (see Tables 24 and 25). The features are listed by decreasing estimate value. Most of the cases include morphological and semantic information that has been explicitly defined in linguistic cues (e.g., the use of pronouns as in “my room,” tenses, spatial details, polarized words, etc.). As a result, the combination of such n-gram features with linguistic cues do not work in synergy. Moreover, notice the contribution of two features for discriminating deception in the SpanishMexico; the word “mi mejor” and the word “en” both attributed to the deceptive class. A similar behavior with a small resulting feature set is also evident in the Russian data set.
A list with 10 discriminating deceptive features for each dataset. The features are listed by decreasing estimate value as calculated by the logistic regression algorithm. In square brackets is the English translation

A list with 10 discriminating truthful features for each dataset. The features are listed by decreasing estimate value as calculated by the logistic regression algorithm. In square brackets is the English translation

6.1.4 Discussion on features
Among all the variations of n-grams tested in this work, word n-grams achieve the best results across almost all the data sets. The results for the other types of n-grams seem to be a little lower and to fluctuate in a per data set basis. More content-based n-gram types such character-grams and phoneme-grams have an adequate performance while the other variations that bear more abstract and generalized linguistic information, such as POS n-grams and syntactic n-grams achieve lower performance. However, POS-gram seem to perform quite better than the syntactic n-grams. The difference in accuracy decreases in cross-domain experiments in which semantic information is more diverse, and as already discussed, linguistic indications of deception change from one domain to another. Lastly, stemming, stopwords removal, and lowercase conversion are generally beneficiary, so it is a preprocessing step that must be examined. The experimental results show that the discriminative power of linguistic markers of deception is overly better than random baseline and the expected human performance (according to literature slightly better than chance, see Section 2) especially in one domain scenarios (see Tables 13, 14, 15, 16, and 17). More specifically, linguistic markers of deception are struggling in cross-domain settings (see Section 6.1.2). This confirms that linguistic markers of deception vary considerably and are extremely sensitive even within the same culture, let alone across different cultures (see Table 23). Different domains, individual differences, even the way the texts were collected seem to influence the behavior of linguistic markers and indicate how complex the deception detection task is. In the native English case in which the employed feature set is richer and in general the linguistic markers are more well-studied, we can observe better results. This might signal that there are opportunities for enhancement.
Lastly, the combination of linguistic features with n-gram variations does not enhance the performance in a decisive way in most of our experiments. N-grams and more often word-grams or phoneme-grams in an indirect way can capture information that has been explicitly encoded in the linguistic cues. However, there are cases when this combination can improve the performance of the classifier. In such cases, the resulting feature space succeeds to blend content with the most valuable linguistic markers.
6.2 BERT experiments
In these experiments, we use BERT (Devlin et al. Reference Devlin, Chang, Lee and Toutanova2019) with a task-specific linear classification layer on top, using the sigmoid activation function, as an alternative to the logistic regression classifiers of the previous experimentsFootnote t . As already discussed in Section 4.4, BERT is already pretrained on a very large unlabeled corpus. Here it is further trained (‘fine-tuned’) jointly with the task-specific classifier on deception detection data sets to learn to predict if a text is deceptive or not. BERT produces context-aware embeddings for the tokens of the input text, and also an embedding for a special classification token ([CLS]), intended to represent the content of the entire input text. Here the input to the task-specific linear classifier is the embedding of the [CLS] token. We do not ‘freeze’ any BERT layers during fine-tuning, that is, the weights of all the neural layers of BERT are updated when fine-tuning on the deception detection data sets, which is the approach that typically produces the best results in most NLP tasks. We use categorical cross entropy as the loss function during fine-tuning and AdamW as the optimizer (Loshchilov and Hutter Reference Loshchilov and Hutter2019). Finally, we exploit monolingual BERT models for each language (see Table 10), as well as the multilingual mBERT model. The BERT limitation of processing texts up to 512 wordpieces does not affect us, since the average length of the input texts of our experiments is below this boundary (see Table 4). However, due to batching and GPU memory restrictions, the upper bound of the used text length was 200 wordpieces, so there is some loss of information due to text truncation, though it is limited overall. More specifically, the truncation affects 5.6% of the total number of texts of all the data sets used in our experiments (506 texts out of a total of 8971). The effect of truncation is more severe in the Bluff, OpSpam, and Russian data sets, where 41% (109 out of 267), 21% (332 out of 1600), and 29% (65 out of 226) of the texts were truncated, respectively; the average text length of the three data sets is 190, 148, and 160 wordpieces, respectively. In the other data sets, the percentage of truncated texts was much smaller (10% or lower). We note that valuable signals may be lost when truncating long texts, and this is a limitation of our BERT experiments, especially those on Bluff and OpSpam, where truncation was more frequent. For example, truthful texts may be longer, and truncating them may hide this signal, or vice versa. Deceptive parts of long documents may also be lost when truncating. In such cases, models capable of processing longer texts can be considered, such as hierarchical RNNs (Chalkidis et al. Reference Chalkidis, Androutsopoulos and Aletras2019; Jain et al. Reference Jain, Kumar, Singh, Singh and Tripathi2019) or multi instance learning as in (Jain et al. Reference Jain, Kumar, Singh, Singh and Tripathi2019). No truncation was necessary in our logistic regression experiments, but long texts may still be a problem, at least in principle. For example, if only a few small parts of a long document are deceptive, features that average over the entire text of the document may not capture the deceptive parts. We leave a fuller investigation of this issue for future work.
In addition, we combined BERT with linguistic features. To this end, we concatenate the embedding of the [CLS] token with the linguistic features and pass the resulting vector to the task-specific classifier. In this case, the classifier is a multilayer perceptron with one hidden layer, consisting of 128 neurons with ReLU activations. The MLP also includes layer normalization (Ba et al. Reference Ba, Kiros and Hinton2016) and a dropout layer (Srivastava et al. Reference Srivastava, Hinton, Krizhevsky, Sutskever and Salakhutdinov2014) to avoid overfitting. Hyperparameters were tuned by random sampling 60 combinations of values and keeping the combination that gave the minimum validation loss. Early stopping with patience 4 was used on the validation loss to adjust the number of epochs (the max number of epochs was set to 20). The tuned hyperparameters were the following: learning rate (1e-5, 1.5e-5, 2e-5, 2.5e-5, 3e-5, 3.5e-5, 4e-5), batch size (16, 32), dropout rate (0.0, 0.05, 0.1, 0.15, 0.2, 0.25, 0.3, 0.35, 0.4, 0.45), max token length (125, 150, 175, 200, and average training text length in tokens), and the used randomness seeds (12, 42, and a random number between 1 and 100).
Tables 26 and 27 present the results for these experiments. The former presents the results for each native English data set, while the latter for the cross-culture data sets. For the US culture, we used the unified data set NativeEnglish. We explored both the BERT model alone and the BERT model augmented with the whole list of linguistic cues of deception studied in this work. For the native English cases, we used the BERT model for the English language, while for the per culture experiments, we experimented with both the language monolingual models and the multilingual version of the BERT model. The data set subscript declares the experimental set-up, for example, $_{bert+linguistic,en}$
uses the English language BERT model along with the linguistic cues. Exactly what types of linguistic or world knowledge BERT-like models manage to capture (or not) and the extent to which they actually rely on each type of captured knowledge is the topic of much current research (Rogers et al. Reference Rogers, Kovaleva and Rumshisky2020). It has been reported that the layers of BERT probably capture different types of linguistic information, like surface features at the bottom, syntactic features in the middle and semantic features at the top (Jawahar et al. Reference Jawahar, Sagot and Seddah2019). Fine-tuning seems to allow retaining the most relevant types of information to the end task, in our case deception detection.
$_{bert+linguistic,en}$
uses the English language BERT model along with the linguistic cues. Exactly what types of linguistic or world knowledge BERT-like models manage to capture (or not) and the extent to which they actually rely on each type of captured knowledge is the topic of much current research (Rogers et al. Reference Rogers, Kovaleva and Rumshisky2020). It has been reported that the layers of BERT probably capture different types of linguistic information, like surface features at the bottom, syntactic features in the middle and semantic features at the top (Jawahar et al. Reference Jawahar, Sagot and Seddah2019). Fine-tuning seems to allow retaining the most relevant types of information to the end task, in our case deception detection.
Results on fine tuning BERT model for US datasets

Per culture results for: a. the fine-tuned BERT model b. the fine-tuned BERT model along with the linguistic features. Results are reported both for the monolingual and the multilingual BERT models

Overall, the experiments show similar, and in some cases improved results, compared to the logistic regression ones and the available related work (see Section 6.3). As shown in Table 26, this is the case for the OpSpam, Boulder, and EnglishUS data sets, while the performance drops a bit in the case of the DeRev data set for the plain BERT model (the excellent 98% accuracy drops to 94% for the plain BERT model, rising again to 96% for the combined BERT with the linguistic features). An interesting point is that for the Bluff data set, the plain BERT model offers better performance to the logistic classifier (83% accuracy compared to 75%), which drops to 77% when combined with the linguistic features. This is the only case where the addition of the linguistic features drops the performance of the classifier. The reason might be that the plain BERT model possibly manages to capture humor, which is an internal feature of this data set and a feature not captured by the linguistic features.
Regarding the per culture data sets shown in Table 27 and compared to the logistic regression experiments, there are clear gains in the accuracy of most of the models for the NativeEnglish, EnglishIndia, and CLiPS data sets. However, this is not the case for the SpanishMexico and the Russian data sets. Especially in the case of the peculiar Russian data set, out of the four experimental set-ups, only the BERT alone set-up with the dedicated Russian BERT model slightly surpassed the statistical random baseline of 50%. Recall that similar low performance is not only evident in our logistic experiments but also in the related work. The low performance in the case of BERT, where there are no feature extraction steps that can propagate misfires of the used tools or a problematic handling from our side, showcases that this is an intrinsically problematic collection.
A rather important finding is the contribution of the linguistic features. The addition of the linguistic features to the BERT models leads to better performance in many of the experiments, such as in the case of EnglishUS, DeRev, NativeEnglish, SpanishMexico, Romanian, and EnglishIndia data sets. This showcases their importance compared to the corresponding logistic regression experiments, where the linguistic cues improved the n-grams approaches only in the case of the SpanishMexico and the Russian data set. The linguistic features seem to work better when combined with the BERT classifier, which might be the result of the model learning nonlinear combinations of the features. As already mentioned, in the case of the DeRev data set, the addition of the linguistics cues greatly improves the performance of the classifier, leading to almost excellent performance. Even though we have not made explicit experiments to identify that are the helpful linguistic cues in the case of BERT models, we can speculate that they are phoneme related features, for example, #fricatives, #plosives, #nasals, and the punctuation feature. These are significant features, which either the BERT models cannot capture or exploiting their explicit counts seems to be more effective (see Tables 31 and 32 in the Appendix).
A rather important finding is the contribution of the linguistic features. The addition of the linguistic features to the BERT models leads to better performance in many of the experiments, such as in the case of EnglishUS, DeRev, NativeEnglish, SpanishMexico, Romanian, and EnglishIndia data sets. This showcases their importance compared to the corresponding logistic regression experiments, where the linguistic cues improved the n-grams approaches only in the case of the SpanishMexico and the Russian data set. The linguistic features seem to work better when combined with the BERT classifier, which might be the result of the model learning nonlinear combinations of the features. As already mentioned, in the case of the DeRev data set, the addition of the linguistics cues greatly improves the performance of the classifier, leading to almost excellent performance. Even though we have not made explicit experiments to identify that are the helpful linguistic cues in the case of BERT models, we can speculate that they are phoneme related features, for example, #fricatives, #plosives, #nasals, and the punctuation feature. These are significant features, which either the BERT models cannot capture or exploiting their explicit counts seems to be more effective (see Tables 31 and 32 in the Appendix).
Table 28 provides a comparison between the monolingual BERT models and mBERT. In particular, monolingual BERT models seem to perform better, except in Dutch and Romanian. Despite the lower performance of the mBERT model, the difference is not prohibitive.
Comparison between the monolingual BERT models and the multilingual model. We report the average accuracy of the monolingual BERT model among the BERT-only and the BERT+linguistic setups and for the mBERT model respectively. With bold font we mark the best accuracy. St. sign. stands for statistical significance. We performed a 1-tailed z-test with a 99% confidence interval and $\alpha = 0.01$

6.2.1 Cross-language experiments
In this section, we proceed with cross-language experiments due to the adequate performance of the mBERT model. The idea of the experiment is to fine-tune a BERT model over one language and test its performance over another language, trying to exploit similarities in the morphological, semantic and syntactic information encoded in BERT layers, across cultures. Our main focus is on cultures that are close in terms of the individualism dimension, thus could possibly share similar deceptive patterns that BERT can recognize. We are also interested in cross-cultural experiments to evaluate to what extent BERT can distinguish between deceptive and truthful texts in a crosslingual setting. Finally, we have also added the EnglishUS data set to experiment with same domain and alike collection procedure but cross-language data sets (i.e., Romanian, SpanishMexico, EnglishIndia, and EnglishUS). We also performed experiments with the NativeEnglish minus the EnglishUS collection to explore the effectiveness of a large training dataset to a different domain (EnglishUS) and to different cultures (Romanian, SpanishMexico, EnglishIndia). For each experiment, we trained a model over the 80% of a language-specific data set, validated the model over the rest 20% of the same data set, and then tested the performance of the model over the other data sets. Notice that these experiments are not applicable for the NativeEnglish and EnglishUS data sets, since the former is a superset of the latter.
For most of the experiments, the results are close to randomness. For example, this is the case when Russian and Dutch (CLiPS) are used either as testing or training sets with any other language and when the combined NativeEnglish data set is used for testing on any other language. For the Russian language this is quite expected given the performance in the monolingual experiments. However, on the Dutch data set, the situation is different, since the fine-tuned BERT model manages to distinguish between deceptive and truthful texts in the monolingual setting but when the mBERT is trained on the Dutch data set, it does not perform well on the other data sets.
The Romanian, SpanishMexico, EnglishUS, and EnglishIndia data sets that are part of the Cross-Cultural Deception data set (see Section 6.3) show a different behavior. A model trained on one data set offers an accuracy between 60% and 70% on the other set using the mBERT, with SpanishMexico exhibiting the best performance when is is used as testing set for the EnglishUS trained model. This indicates that the domain is an important factor that alleviates the discrepancies in terms of culture and language in the crosslingual mBERT setting. A reasonable explanation might be vocabulary memorization or lexical overlap, which occurs when word pieces are present during fine-tuning and in the language of the testing set. However, according to Pires et al. (Reference Pires, Schlinger and Garrette2019), mBERT has the ability to learn even deeper multilingual representations.
Another important observation is the performance whenever the NativeEnglish is used as training set. The domain similarity is rather small in this case, since NativeEnglish is a largely diverse data set. The results show that mBERT can possibly reveal connections in a zero-shot transfer learning setting when the training size is quite adequate. This has been observed also in other tasks, like the multilingual and multicultural irony detection in the work of Ghanem et al. (Reference Ghanem, Karoui, Benamara, Rosso and Moriceau2020). In this case instead of the mBERT model, the authors applied an alignment of monolingual word embedding spaces in an unsupervised way. Zero-shot transfer learning for specific tasks based on mBERT is also the focus of other recent approaches (Pires et al. Reference Pires, Schlinger and Garrette2019) (Libovický et al. Reference Libovický, Rosa and Fraser2019) that show promising results. Removing the EnglishUS data set from the NativeEnglish data set reduces considerably the performance in the Romanian, SpanishMexico, and EnglishIndia datasets, showcasing the importance of domain even for cross-lingual data sets. Notice though that for the SpanishMexico and the Romanian data sets, the performance is greater than that of a random classifier, indicating cues of the zero-shot transfer connection hypothesis at least for this data set. On the other hand, the random performance for the EnglishUS and EnglishIndia data sets that have the same language with the trained model and which additionally belong to the same domain with the SpanishMexico and Romanian data sets, showcases that it is difficult to generalize.
6.3. Comparison with other works
Table 30 provides an overall comparison between our best experimental set-up and results, with those presented in other studies on the same corpora. The comparison was based on the accuracy scores reported in those studies. In addition, we report human accuracy whenever it is available. For comparison purposes, we set a p-value of 0.01 and performed a 1-tailed z-test evaluating if the differences between two proportions are statistically significant. By comparing absolute numbers only, the comparison is not so straightforward and cannot easily lead to conclusions, since the studies employed different model validation techniques and set difference research goals.
Comparison for the multilingual model when a model is trained over one language and then tested on another one. With bold are the accuracy values over 60%. Rom. is Romanian, SpanMex. is SpanisMexico

Comparison with other works on the same corpora. Bold values denote models studied in this work and the best scores. Accu. stands for Accuracy and St. Sign. marks cases where a statistically significant difference between this work and related work was found

To the best of our knowledge, the only computational work that addresses cross-cultural deception detection is the work of Pérez-Rosas et al. (Reference Pérez-Rosas, Bologa, Burzo and Mihalcea2014). In that work the authors build separate deception classifiers for each examined culture and report a performance ranging between 60% and 70%. Then they build cross-cultural classifiers by applying two alternative approaches. The first one was through the translation of unigrams and the second one by using equivalent LIWC semantic categories for each language. Both approaches resulted in lower performances. All the approaches were tested on the Cross-Cultural Deception data set, which was created by the authors (Pérez-Rosas and Mihalcea Reference Pérez-Rosas and Mihalcea2014; Pérez-Rosas et al. Reference Pérez-Rosas, Bologa, Burzo and Mihalcea2014), and which we also used in this work (see Section 6.3). The treatment is different since each sub-domain data set (death penalty, abortion, best friend) is separately examined. However, since average scores are also reported we compare this work with those scores. In addition, since the EnglishUS data set has been extensively used in other works in the same way, we also report the average accuracy for these cases.
The comparison in Table 30 shows that BERT outperforms other approaches in most of the cases. BERT’s performance is mostly surpassed in the relatively smaller sized data sets, indicating the need for fine-tuning BERT over a large number of training samples. In particular, BERT achieves state-of-the-art performance for the OpSpam data set, that is the gold standard for opinion spam detection. In addition, for the CLiPS data set, the BERT model outperforms the other models studied in this work, as well as another unigram approach in the bibliography (Verhoeven and Daelemans Reference Verhoeven and Daelemans2014). For the Cross-Cultural Deception data set (see Section 3.5), BERT outruns other approaches that are based on feature engineering for the Romanian and the EnglishIndia datasets. In the case of SpanishMexico data set, the combination of linguistic cues with word n-grams seems to have a strong discriminative power and in the EnglishUS data set the combination of latent Dirichlet allocation topics (LDA) with a word-space model achieves the highest accuracy. Lastly, in comparison with human judgments, for the two data sets that we have numbers (i.e., OpSpam and Bluff), the automatic detection approaches significantly outperform human performance with respect to the accuracy measure.
7. Conclusions
This study explores the task of automated text-based deception detection within cultures by taking into consideration cultural and language factors, as well as limitations in NLP tools and resources for the examined cases. Our aim is to add a larger scale computational approach in a series of recent interdisciplinary works that examine the connection between culture and deceptive language. Culture is a factor that is usually ignored in automatic deception detection approaches, which simplistically assume the same deception patterns across cultures. To this end, we experimented with data sets representing six cultures, using countries as culture proxies (United States, Belgium, India, Russia, Mexico, and Romania), written in five languages (English, Dutch, Russian, Spanish, and Romanian). The data sets cover diverse genres, ranging from reviews of products and services to opinions in the form of short essays and even transcripts from a radio game show. To the best of our knowledge, this is the first effort to examine in parallel and in a computational manner, multiple and diverse cultures for the highly demanding deception detection task in text.
We aimed at exploring to what extent conclusions drawn from the social psychology field about the connection of deception and culture can be confirmed in our study. The basic notion demonstrated by these studies is that specific linguistic cues to deception do not appear consistently across all cultures, for example, they change direction, or are milder or stronger between truthful or deceptive texts. Our main focus was to investigate if these differences can be attributed to cultural norm differences and especially to the individualism/collectivism divide. The most closely related work is that of Taylor (Taylor et al. Reference Taylor, Larner, Conchie and van der Zee2014; Taylor et al. Reference Taylor, Larner, Conchie and Menacere2017) from the field of social psychology that studies the above considerations for four linguistic cues of deception, namely negations, positive affect, pronouns usage, and spatial details in texts from individualistic and collectivist cultures. Having as starting point Taylor’s work, we performed a study with similar objectives over a larger feature set that we created that also covers the previously mentioned ones.
The outcome of our statistical analysis demonstrates that indeed there are great differences in the usage of pronouns between different cultural groups. In accordance with Taylor’s work, people from individualistic cultures employ more third person and less first person pronouns to distance themselves from the deceit when they are deceptive, whereas in the collectivism group this trend is milder, signaling the effort of the deceiver to distance the group from the deceit. Regarding the expression of sentiment in deceptive language across cultures, the original work of Taylor hypothesized that different cultures will use sentiment differently while deceiving, a hypothesis that was not supported by the results of his research. The basis for this hypothesis is the observation that in high-context languages, which are related with collectivist cultures, people tend to restrain their sentiment. Our experiments support the original hypothesis of Taylor, since we observe an increased usage of positive language in deceptive texts for individualistic cultures (mostly in the US data sets), which is not observed in more collectivist cultures. In fact, by examining the statistical significant features and the resulting feature sets from the MLR analysis, we notice that generally, there are fewer discriminating deception cues in the high-context cultures. This might be attributed to the fact that the bibliography overwhelmingly focuses on individualistic cultures and to a lesser degree on collectivist cultures, leading to a smaller variation in deceptive cues for the latter. Additionally, it might indicate that during deception, high-context cultures use other communication channels on top of the verbal ones, a hypothesis that needs further research. Moreover, in affirmation of the above considerations, we observed that the strongly distinguishing features are different for each culture. The most characteristic examples are the #negations for the EnglishIndia data set and the phoneme-related features for the SpanishMexico and Romanian datasets (#nasals and #fricatives). Both types of features have been related to the implicit expression of sentiment in previous studies. However, there is a need for a more thorough analysis, in order for such observations to be understood and generalized in other cultures. In relation to spatial details differences, we found that in the cross-cultural deception task, the collectivist groups increased the spatial details vocabulary. The exact opposite holds for the individualist groups, who used more spatial details while being truthful. This result is in accordance with Taylor’s work.
These findings can be analyzed in conjunction with our second research goal which was to investigate the existence of a universal feature set that is reliable enough to provide a satisfactory performance across cultures and languages. Our analysis showed the absence of such a feature set. On top of this, our experiments inside the same culture (United States of America) and over different genres revealed how volatile and sensitive the deception cues are. The more characteristic example is the Bluff data set in which deception and humor are employed at the same time and the examined linguistic features have the reversed direction. Furthermore, another variable in the examined data sets is the type of deception. The examined data sets contain multiple types such as falsifications, oppositions, and exaggerations to name a few. In addition, the data collection extraction process varies from user-generated content (e.g., posts in TripAdvisor, Amazon reviews), crowd-sourced workers, volunteers in controlled environments, and finally cases outside computer-mediated communication (the transcriptions from the Bluff the Listener show). Despite this diversity, we have to note that some features seem to have a broader impact. This is the case for the length of texts (#lemmas and #words features), where deceptive texts tend to be shorter. This was observed independently of the culture and the domain with only one exception, that of the Bluff data set. This is in accordance with previous studies, attributing this behavior to the reduction of cognitive/memory load (Burgoon Reference Burgoon2015) during the deception act.
Our third goal was to work toward the creation of culture/language-aware classifiers. We experimented with varying approaches and examined if we can employ specific models and approaches in a uniform manner across cultures and languages. We explored two classification schemes; logistic regression and fine-tuning BERT. Moreover, the experimentation with the logistic regression classifiers demonstrated the superiority of word and phoneme n-grams over all the others n-gram variations (character, POS, and syntactic). Our findings show that the linguistic cues, even when combined with n-grams, lag behind the single or combined n-gram features, whenever models are trained for a specific domain and language (although their performance surpasses the baselines). In more details, shallow features, like the various n-grams approaches, seem to be pretty important for capturing the domain of a data set, while the linguistic features perform worse. This is the case at least for the native English data sets, where we conducted experiments over various genres and found that the shallow features perform better, even across domains. On the other hand, the linguistic cues seem to be important for the collectivist cultures, especially when combined with swallow features (e.g., in Russian, SpanishMexico, and Romanian data sets). The fine tuning of the BERT models, although costly in terms of tuning the hyperparameters, performed rather well. Particularly, in some data sets (the NativeEnglish, CLiPS, and EnglishIndia data sets), we report state-of-the-art performance. However, the most important conclusion is that the combination of BERT with linguistic markers of deception is beneficial, since it enhances the performance. This is probably due to the addition of linguistic information that BERT is unable to infer, such as phoneme-related information. Indeed, phonemes play an important role in all individual parts of this study. The experimentation with the multilingual embeddings of mBERT, as a case of zero-shot transfer learning, showed promising results that can possibly be improved by incorporating culture specific knowledge or by taking advantage of cultural and language similarities for the least resourced languages. Finally, we observed the importance of domain-specific deception cues across languages, which can be identified by mBERT. Given the promising results of mBERT, other recently introduced multilingual representations may be applied. Alternatives include, for example, MUSE (Chidambaram et al. Reference Chidambaram, Yang, Cer, Yuan, Sung, Strope and Kurzweil2019; Yang et al. Reference Yang, Cer, Ahmad, Guo, Law, Constant, Hernandez Abrego, Yuan, Tar, Sung, Strope and Kurzweil2020), LASER (Artetxe and Schwenk Reference Artetxe and Schwenk2019), and LaBSE (Feng et al. Reference Feng, Yang, Cer, Arivazhagan and Wang2020). XLM (Conneau and Lample Reference Conneau and Lample2019) and its XLM-R extension (Conneau et al. Reference Conneau, Khandelwal, Goyal, Chaudhary, Wenzek, Guzmán, Grave, Ott, Zettlemoyer and Stoyanov2020) have been reported to obtain state-of-the-art performance in zero-shot cross-lingual transfer scenarios, making them appropriate for low resource languages (Hu et al. Reference Hu, Ruder, Siddhant, Neubig, Firat and Johnson2020).
Although this work is focused on deception detection from text using style-based features and without being concerned with a particular domain, we plan to consider additional features that have been used in other domains and other related work. Specifically, we aim to incorporate features used in discourse-level analysis, such as rhetorical relationships (Rubin et al. Reference Rubin, Conroy and Chen2015; Karimi and Tang Reference Karimi and Tang2019; Pisarevskaya and Galitsky Reference Pisarevskaya and Galitsky2019), other properties of deception like acceptability, believability, the reception (Jankowski Reference Jankowski2018) of a deceptive piece of text (e.g., number of likes or dislikes), and/or source-based features such as the credibility of the medium or author using stylometric approaches (Potthast et al. Reference Potthast, Kiesel, Reinartz, Bevendorff and Stein2018; Baly et al. Reference Baly, Karadzhov, Alexandrov, Glass and Nakov2018). Such features are used extensively in fake news detection (Zhou and Zafarani Reference Zhou and Zafarani2020). We also plan to examine the correlation of such features with the perceiver’s culture (Seiter et al. Reference Seiter, Bruschke and Bai2002; Mealy et al. Reference Mealy, Stephan and Carolina Urrutia2007).
We also plan to study deception detection under the prism of culture over other languages and cultures, for example, Portuguese (Monteiro et al. Reference Monteiro, Santos, Pardo, de Almeida, Ruiz and Vale2018), German (Vogel and Jiang Reference Vogel and Jiang2019), ArabicFootnote u , and Italian (Fornaciari and Poesio Reference Fornaciari and Poesio2012; Capuozzo et al. Reference Capuozzo, Lauriola, Strapparava, Aiolli and Sartori2020). We are also interested in exploring different contexts, for example, fake news (Pérez-Rosas et al. Reference Pérez-Rosas, Kleinberg, Lefevre and Mihalcea2017), modalities, for example, spoken dialogues, as well as employing other state-of-the-art deep learning approaches, for example, XLNet (Yang et al. Reference Yang, Dai, Yang, Carbonell, Salakhutdinov and Le2019), RoBERTa (Liu et al. Reference Liu, Ott, Goyal, Du, Joshi, Chen, Levy, Lewis, Zettlemoyer and Stoyanov2019), and DistilBERT (Sanh et al. Reference Sanh, Debut, Chaumond and Wolf2019).
Additionally, we plan to extend the Bluff the Listener data set with new episodes of this game show, in order to further examine the linguistic cues of deception and humor and how they correlate and to enrich the community with relevant gold data sets for nonstudied languages, for example, Greek. Moreover, we plan to investigate the role of phonemes and its relation with the expression of sentiment and incorporate and study phonemes embeddings (Haque et al. Reference Haque, Guo, Verma and Fei-Fei2019). Finally, we will apply and evaluate our models in real-life applications. This will hopefully add more evidence to the generality of our conclusions and eventually lead to further performance improvements and reliable practical applications.
Acknowledgments
We would like to thank the anonymous reviewers, Yannis Tzitzikas and Stasinos Konstantopoulos for their insightful feedback which helped us to improve this paper.
Financial support
This work was supported by the a. Foundation for Research and Technology - Hellas (FORTH) and b. the Hellenic Foundation for Research and Innovation (HFRI) and the General Secretariat forResearch and Technology (GSRT), under grant agreement No 4195.
Appendix A. Mann-Whitney U test
p-value for linguistic cues for the native English datasets based on Mann-Whitney U test. The numbers in brackets denote the mean for truthful and the mean for deceptive texts respectively. With bold font p-values < 0.01

p-value for linguistic cues for datasets from individualistic cultures based on Mann-Whitney U test. The numbers in brackets denote the first number the mean for truthful and the second number the mean for deceptive texts. With bold font p-values < 0.01. With N/A are marked those features that are not applicable for the specific language

Results per culture of logistic regression experiments on various feature types, including combinations of pairs. The accuracy measure is reported and the bold font marks the pair with the best achieved performance. Best n-gram row indicates the best accuracy for the no-paired configuration


 Open access