


Impact Statement
The gram-positive bacterial pathogen Staphylococcus aureus is a major cause of antibiotic-resistant infections. Cell imaging by fluorescence microscopy is an essential tool for studies of bacterial cellular processes that are key for identifying new antimicrobial targets. Here, we describe eHooke, a new image analysis framework optimized for automatic classification and quantification of S. aureus cells’ microscopy images, allowing the user to extract information on morphological features and protein localization in individual cells, in different phases of the cell cycle.
1. Introduction
Automated analysis of microscopy images of bacterial cells has been a booming field, with several tools being developed in recent years. These include general image analysis software and associated plugins, mainly ImageJ( Reference Rueden, Schindelin and Hiner1) or its “batteries-included” distribution, Fiji( Reference Schindelin, Arganda-Carreras and Frise2), but also more specific tools focused on image analysis of bacterial cells, such as Oufti( Reference Paintdakhi, Parry and Campos3) or MicrobeJ( Reference Ducret, Quardokus and Brun4). These approaches can be instrumental in measuring various morphology parameters of bacterial cells. Most of these parameters vary during cell cycle progression, and relevant information can be extracted from their correlation with cell cycle stages. This is particularly important for studying processes at specific cell cycle stages, such as DNA replication, assembly of the divisome, or splitting of a mother cell to originate two daughter cells. Cell length can be used as a proxy for the cell cycle stage in cells with a clear growth axis, such as rods or ovococcoid bacteria. However, this is not the case for cocci, which have a spherical shape. One example of a particularly relevant coccus is the gram-positive pathogen Staphylococcus aureus, a major cause of antibiotic-resistant infections and a powerful model for cell division studies( Reference Lakhundi and Zhang5, Reference Monteiro, Pereira and Reichmann6). However, analysis of S. aureus microscopy images is hampered by the frequent presence of clumps of adjacent or overlapping cells that result from its characteristic mode of division in orthogonal planes( Reference Tzagoloff and Novick7, Reference Saraiva, Sorg and Pereira8). Furthermore, the nearly spherical shape of staphylococcal cells impairs simple analysis of the cell cycle( Reference Monteiro, Fernandes and Vaz9). Therefore, a different approach is required for cell segmentation and cell cycle stage assignment of S. aureus cells, when compared with model organisms that are elongated, such as Escherichia coli, Bacillus subtilis, or Caulobacter crescentus.
The cell cycle of S. aureus can be described as having three different phases: Phase 1, prior to initiation of division septum synthesis; Phase 2, during which the septum is synthesized; and Phase 3, during which cells have a complete septum that divides the mother cell in two, prior to splitting into two daughter cells( Reference Monteiro, Fernandes and Vaz9). Manual classification of the cell cycle phase of individual cells, based on membrane and DNA morphology, is possible but highly time-consuming and prone to user bias. Here, we describe a deep learning strategy for automated classification of the cell cycle stage of S. aureus cells. Deep learning strategies have proved successful in image analysis in various biological contexts, promoting accurate, unbiased quantification of different cellular processes( Reference Eulenberg, Köhler and Blasi10– Reference Shiaelis, Tometzki and Peto13). The developed software, eHooke, can provide relevant information for individual cells in the context of cell cycle progression, including the identification of different cellular regions, measurement of fluorescence in specific subcellular regions, or measurement of morphological parameters such as area, perimeter, length, width, eccentricity, and irregularity.
2. Results
eHooke, developed using Python version 3.6, is a multiplatform framework for the automated analysis of bacterial microscopy images. eHooke also implements a deep learning classification network for classification of the cell cycle phase of individual cells. The software provides a user-friendly interface (Supplementary Figure 1), which allows the user to visualize the results of the different steps performed in eHooke and adjust parameters on the go, to fine-tune image processing. Sections below describe the capabilities of the software, illustrated using specific examples of biological interest.
2.1. Cell segmentation
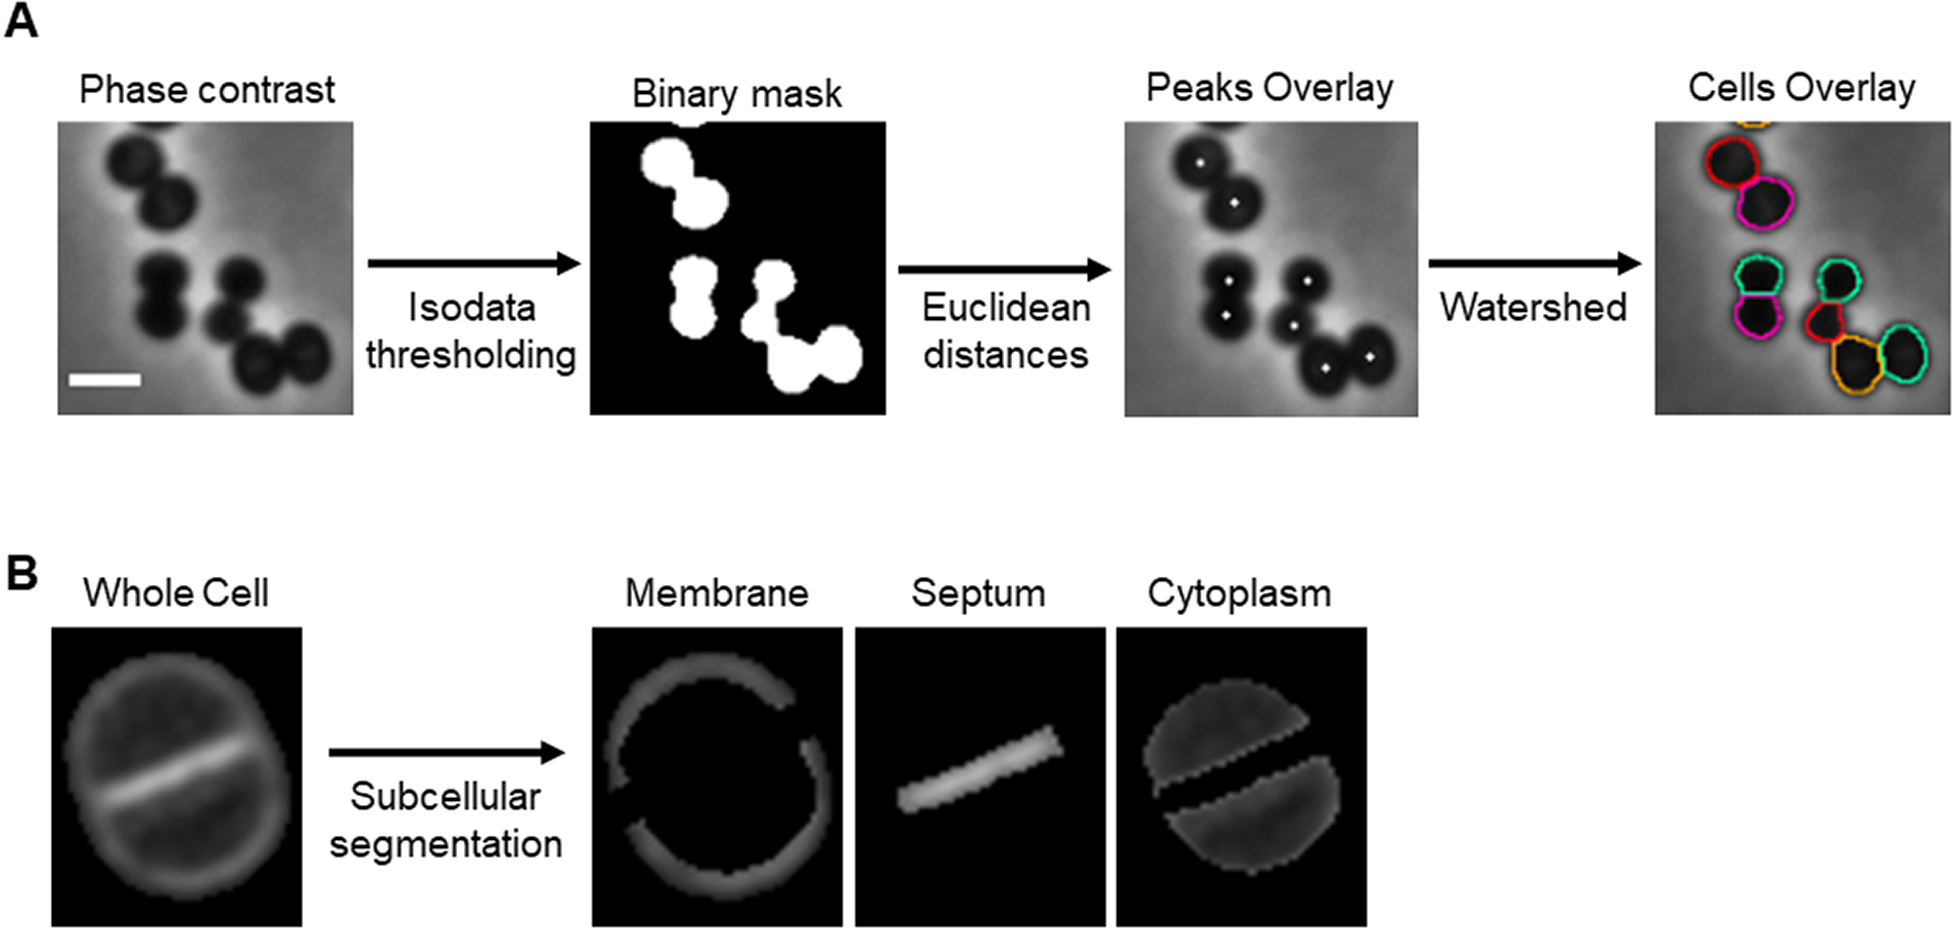
To segment single spherical bacterial cells in phase contrast or fluorescence microscopy images, the background is separated from the cells using an isodata thresholding algorithm( Reference Dias Velasco14). The Euclidean distance of each foreground pixel to the background is measured to find the center of individual cells. This segmentation step can also be performed directly on binary masks obtained with other image analysis tools. Individual cells are defined using the calculated centers and a watershed algorithm( Reference Roerdink and Meijster15) (Figure 1a). eHooke will then determine the subcellular regions of S. aureus cells, namely the cell membrane, the division septum, and the cytoplasm (Figure 1b). Subcellular segmentation is done by expanding each cell’s outline inward, defining the membrane, and then using the isodata thresholding algorithm( Reference Dias Velasco14) to identify the brightest region inside the cell as the septum. The remaining pixels are considered the cytoplasm. At this point, the user has the option to select cells to be included in further analysis and discard inadequately segmented cells.
Cell segmentation. (a) Schematic representation of the cell segmentation workflow performed by eHooke. A base image (phase-contrast or inverted fluorescence image) is loaded, and an isodata thresholding algorithm is applied to create a binary mask. This mask separates the background from the foreground and is then used to find the center of individual cells by measuring each pixel’s Euclidean distance to the background. The pixels with the highest Euclidean distance within their surroundings are considered as peaks, which, together with the binary mask, are used to define individual cells by applying a watershed algorithm. Scale bar: 1 μm. (b) Image of a Staphylococcus aureus cell stained with the membrane dye Nile red and imaged by structured illumination microscopy, segmented by eHooke to define three subcellular regions: membrane, septum, and cytoplasm.
2.2. Automated classification of cell cycle phases
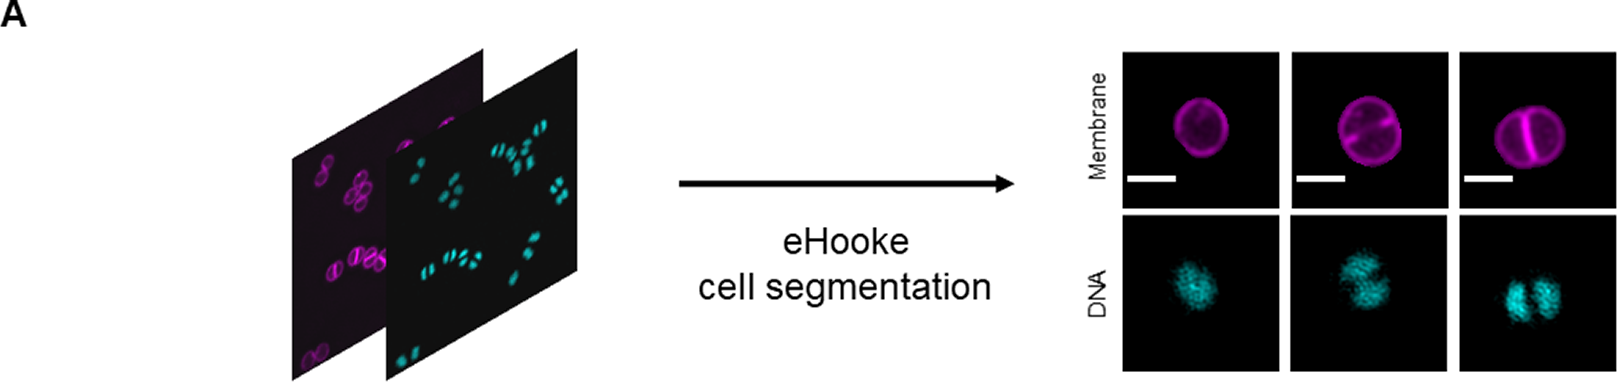
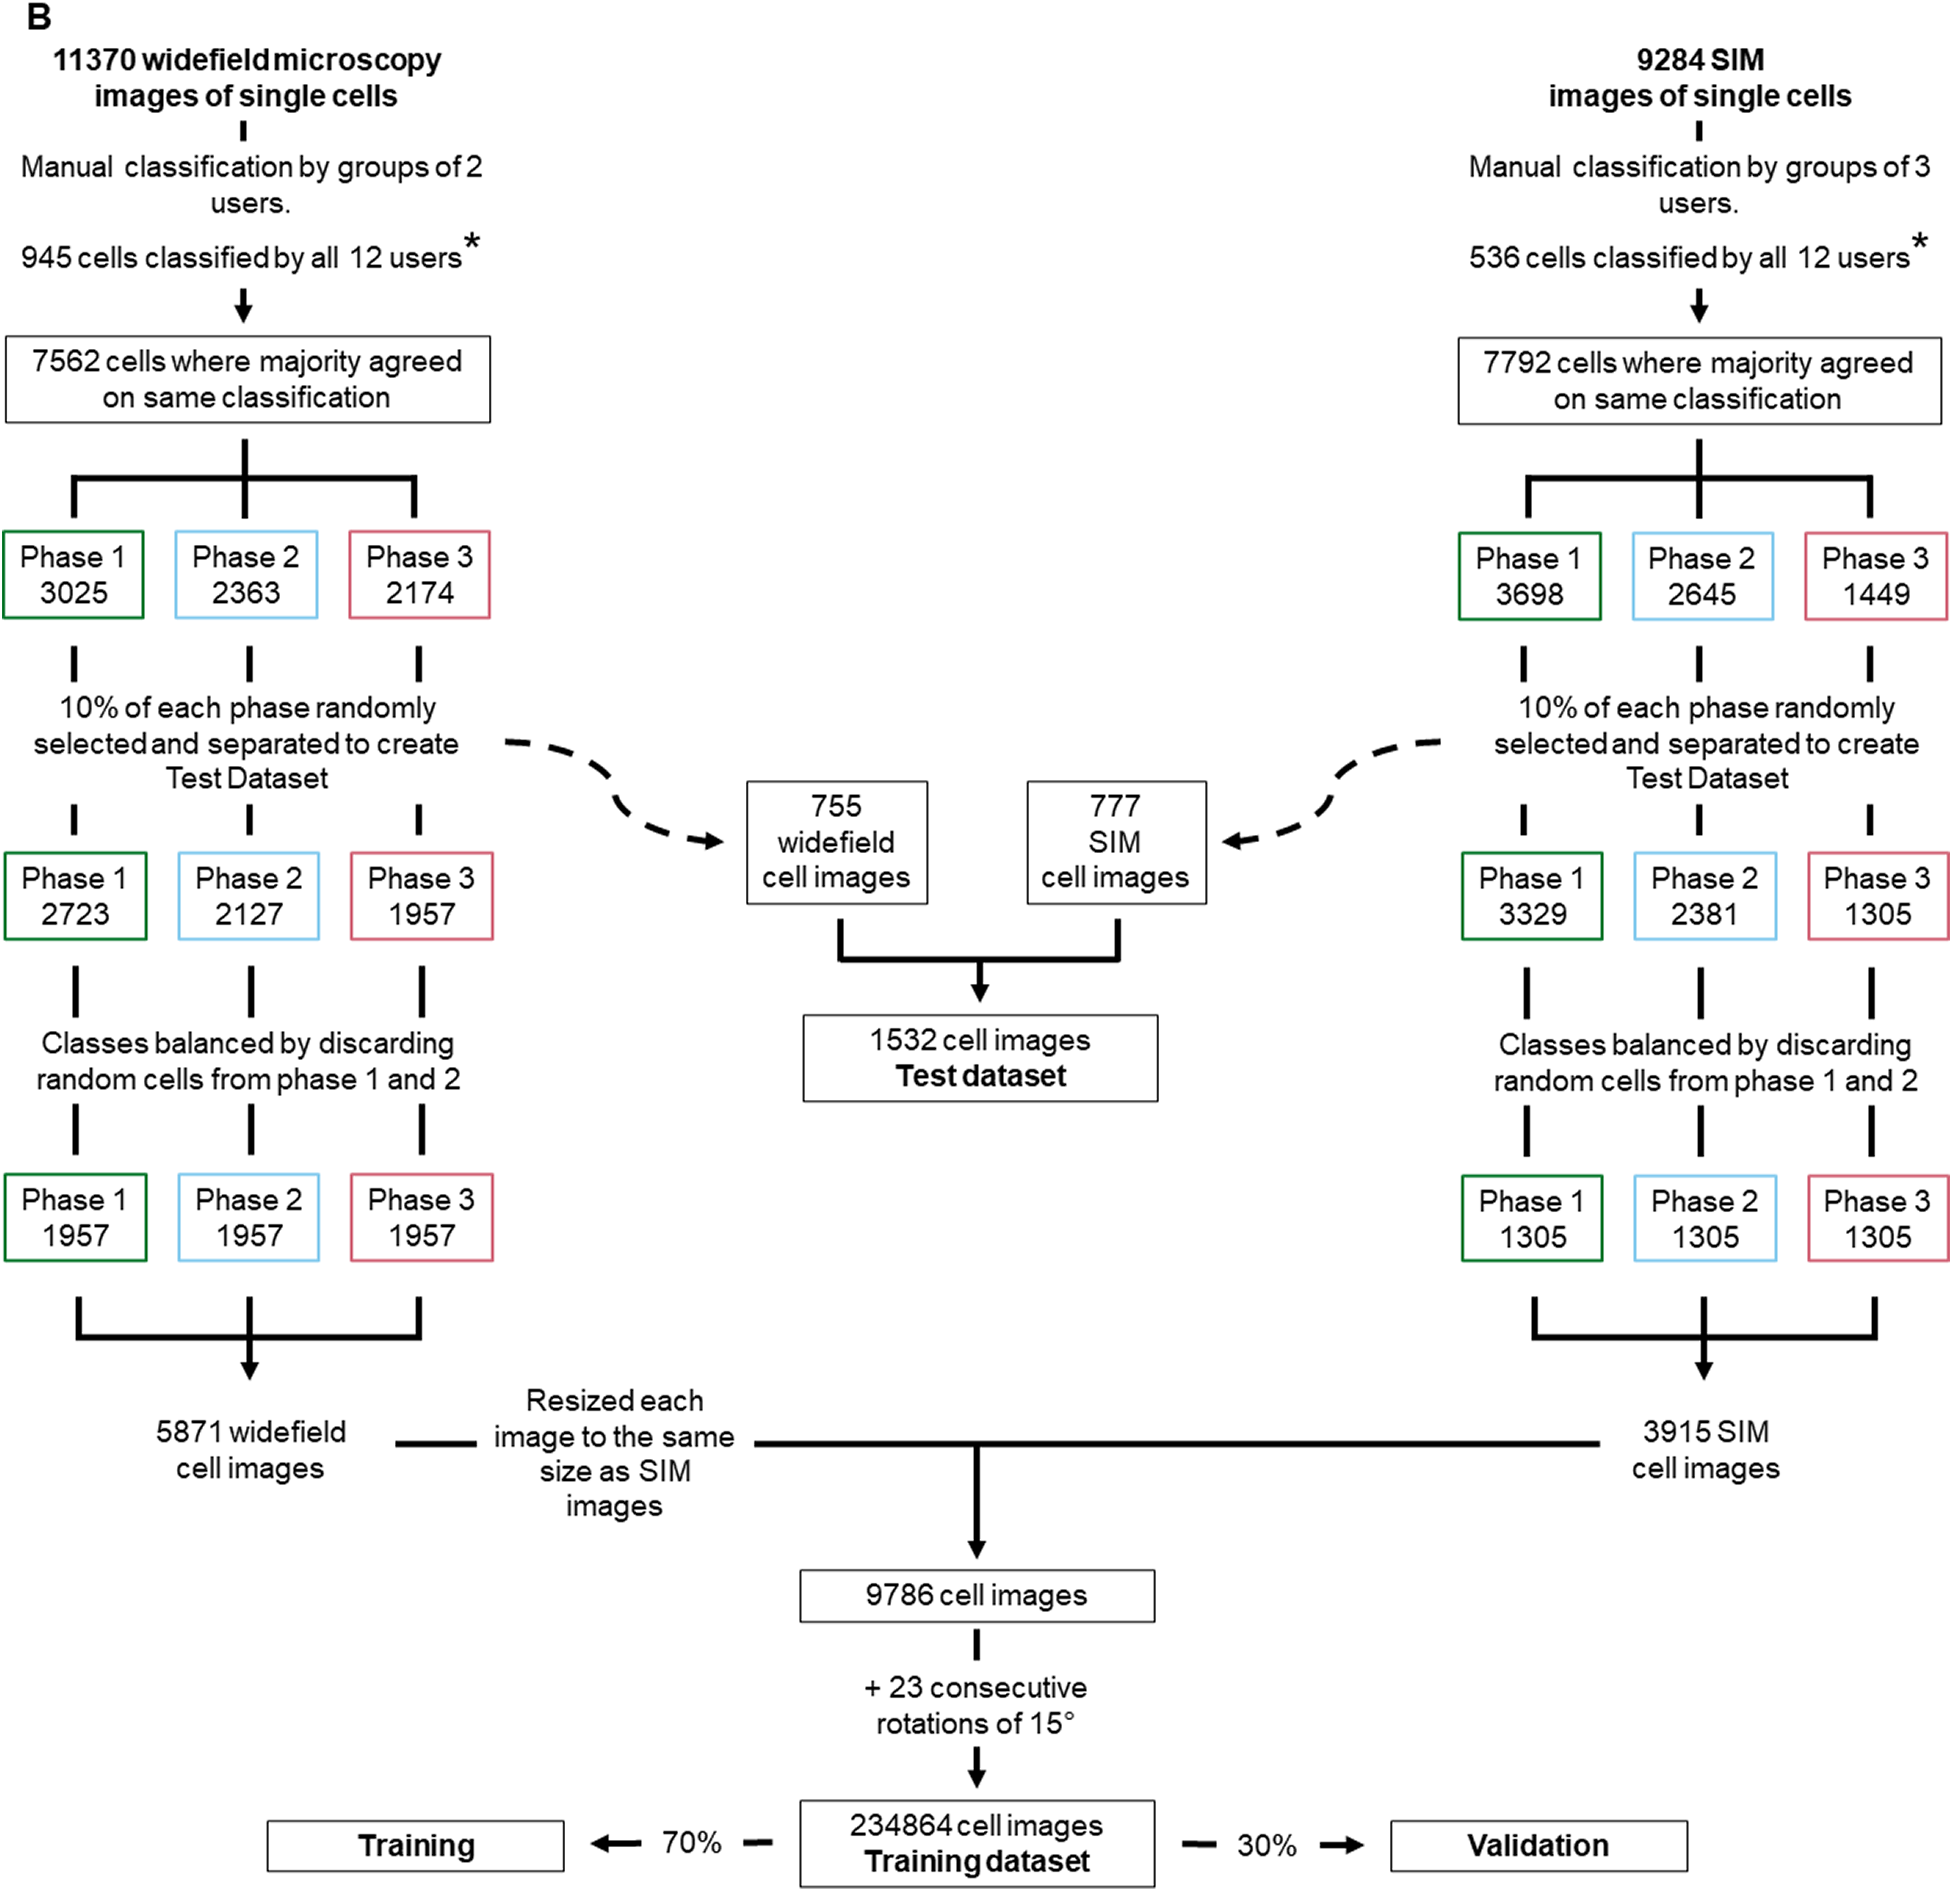
Various cellular processes or cell phenotypes depend on the cell cycle phase of individual cells. Manually assigning a cell cycle phase to large numbers of individual cells can be significantly time-consuming, requires user training, and is subject to user bias (Supplementary Figure 2). Here, we established an artificial neural network (ANN) to automate cell cycle classification. To do so, we trained the ANN with manually annotated cells, imaged with either a fluorescence widefield or a structured illumination microscopy (SIM) microscope. These data enabled the generation of an ANN model to adequately classify the cell cycle phase of cell images acquired in similar settings, with either a widefield or a SIM microscope. To generate the training dataset, we acquired both widefield and SIM images of S. aureus strain JE2( Reference Fey, Endres and Yajjala16), labeled with membrane dye Nile red and DNA dye Hoechst 33342 (Figure 2a) and used eHooke to segment individual cells. A total of 11,370 cells imaged by widefield microscopy and 9,284 cells imaged by SIM were manually classified for the cell cycle phase by groups of two and three users, respectively (Figure 2b). Of those cell images, 945 widefield and 536 SIM imaged cells were classified by all 12 users, who had different levels of experience in microscopy, but were all familiar with the cell cycle of S. aureus, to assess user disagreement during manual classification. Supplementary Figure 2 shows the considerable variation in the results obtained by different users, which was more pronounced for widefield microscopy images. Only correctly segmented cells and where the majority (at least two users of each group or at least seven users for images classified by all users) agreed on the classification were selected for use in datasets (Figure 2b). From those, 10% of cells from each cell cycle phase were randomly selected and separated from the training dataset to be later used as a test dataset for the trained ANN. The remaining 90% of cells were adjusted by randomly discarding cells from the most frequently represented phases (Phases 1 and 2), so that the training set was composed of the same number of cells for each phase, resulting in a total of 9,786 cells for this dataset. The training dataset was further artificially augmented by rotating each cell image in 23 steps of 15°, producing 234,864 individual cell images.
Workflow for generating training and test datasets. (a) Staphylococcus aureus JE2 cells were labeled with a membrane (Nile red, in purple) and a DNA (Hoechst 33342, in cyan) dye and imaged by widefield and structured illumination microscopy (SIM). eHooke was then used for cell segmentation generating 11,370 and 9,284 images of single cells obtained by widefield and SIM microscopy, respectively. Scale bar: 1 μm. (b) Each cell image was manually classified according to the cell cycle phase by groups of two (widefield) or three (SIM) users; 945 widefield and 536 SIM cell images (marked *) were classified by all users and later used to compare classifications between users (see Supplementary Figure 2). Only cells where the majority of users agreed on the classification were selected for use in datasets. From these selected cells, 10% of cells in each cell cycle phase were randomly selected and separated to create a test dataset. For the remaining 90% cells, the number of cells in each cell cycle phase was balanced by randomly discarding cells from Phases 1 and 2, so that each phase had the same number of cells in the training dataset. Widefield cell images were then resized to the same size as SIM images. Resized widefield images were combined with SIM images, resulting in a total of 9,786 cell images. Each of these images was further rotated 23 times, 15° at a time, creating the training dataset with 234,864 cell images. For training, a data split of 70% for training and 30% for validation was used.
The training dataset was then used to train a custom-made ANN, composed of seven convolution layers, each followed by a reLU activation layer with three MaxPooling layers intercalated between the first four sets of convolution and activation layers; the network also has a flatten layer, followed by a dense layer, a reLU activation layer, another dense layer, and a SoftMax activation layer (see Figure 3a for a schematic representation of network architecture). For the training process, a data split of 70% for training and 30% for validation was used. During training, the ANN extracts features only from cells in the training dataset and uses those features to classify cells in both training and validation datasets. The ANN optimizes feature selection on each epoch to maximize the classification accuracy (calculated as the number of correct classifications per total number of cells) of both training and validation cells. To test whether the selected network architecture was appropriate, we performed ablation studies by training different network architectures corresponding to different depth levels (Supplementary Figure 3a): depth 1 corresponds to a network architecture composed of just one convolution layer, followed by a reLU activation layer and the flatten, dense, and SoftMax activation layers that are at the end of every architecture; higher depths correspond to deeper networks with additions of MaxPooling and convolution layers (followed by reLU activation layers); depth 11 corresponds to the initial architecture, where another dense layer (followed by a reLU activation layer) is added between the flatten and the dense layer that are common to all architectures. Then, we tested the classification accuracy of each architecture, corresponding to different depth levels, using the test dataset composed of 755 and 777 individual cell images obtained by widefield and SIM microscopy, respectively, that were not used during the training step (see Figure 2). This showed that depths 7–10 had only minor (up to 1.6%) increases in overall accuracy (Supplementary Figure 3b and Supplementary Table 1), and therefore we decided to keep our original network architecture, which has been robustly tested by laboratory members in various experimental conditions.
Schematic representation and validation of an artificial neural network (ANN) for automated classification of cell cycle phase of Staphylococcus aureus cells. (a) Schematic representation of the structure of the used ANN; n represents the number of neurons in each layer. (b,c) Confusion matrices for the accuracy of the trained ANN using a test dataset of (b) widefield fluorescence microscopy images acquired using a Zeiss Axio Observer Microscope (n = 755; Phase 1: 302 cells, Phase 2: 236 cells, Phase 3: 217 cells), and (c) SIM images acquired using a Zeiss Elyra PS.1 Microscope (n = 777; Phase 1: 369 cells, Phase 2: 264 cells, Phase 3: 144 cells). (d) Fraction of the population of parental S. aureus JE2 cells (n = 748) and sle1 mutant (n = 651), previously described as being enriched in Phase 3 cells( Reference Monteiro, Fernandes and Vaz9), in each phase of the cell cycle. The cell cycle phase of individual cells was assigned automatically using the trained ANN.
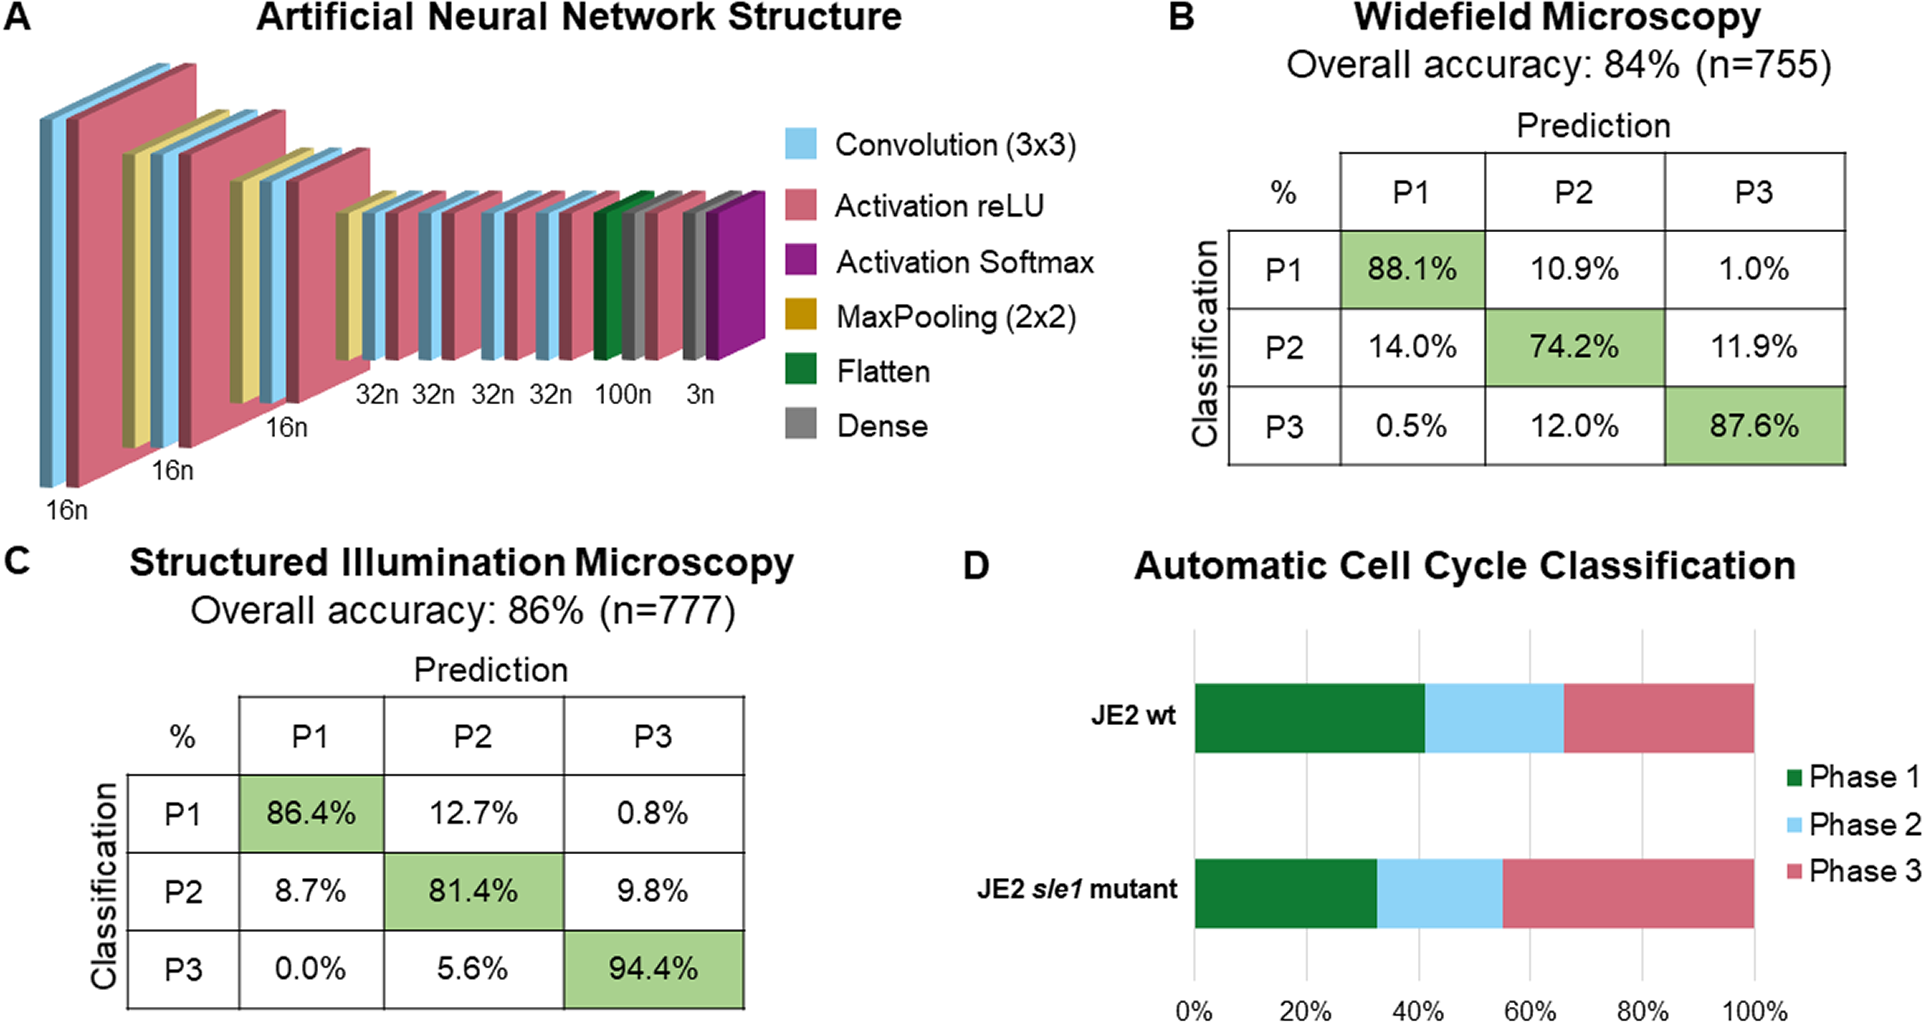
The overall accuracies of the ANN for widefield and SIM images were 84% and 86%, respectively. Confusion matrices for both widefield and SIM images (Figure 3b, c) show that the trained ANN has a higher accuracy for Phase 1 and Phase 3 cells and lower for Phase 2 cells. The trained ANN was then integrated into eHooke, which allows the user to select cells corresponding to a specific phase, as well as to manually correct any misclassification by the trained ANN.
To illustrate the usefulness of our model in a biological setting, we acquired images of S. aureus strain JE2 and of a mutant containing a transposon insertion in the sle1 gene, which encodes for a peptidoglycan hydrolase( Reference Kajimura, Fujiwara and Yamada17) and has been previously shown to have a longer Phase 3 and, therefore, a higher fraction of Phase 3 cells in the population( Reference Monteiro, Fernandes and Vaz9). The trained ANN integrated into eHooke was used to classify the cell cycle phase of each correctly segmented cell. As shown in Figure 3d, 34% of cells from JE2 parental strain were classified as being in Phase 3, whereas this number increased to 45% in the sle1 mutant, in agreement with previous data( Reference Monteiro, Fernandes and Vaz9). These results show that the trained ANN enables rapid and accurate cell cycle progression analysis.
To determine if the trained model is generalizable to data acquired in several types of microscopes, we imaged S. aureus JE2 cells with labeled membrane and DNA using three different microscopes, specifically a Zeiss Axio Observer, a Zeiss Elyra PS.1, and a DeltaVision OMX SR microscope. A fourth set of images was obtained by applying a deconvolution algorithm to the images obtained with the OMX SR microscope, using Applied Precision’s softWorx software. Accuracy was equal to or above 84% for all cases except for the images where deconvolution was used, with an overall accuracy of 70% (Supplementary Figure 4). This is probably caused by the fact the training dataset did not contain deconvolved images, which inherently have a different signal profile and a different signal-to-noise ratio. These results indicate that our model may be applied to images obtained with other microscopes if carefully validated.
2.3. Measurement of morphological features
Standard morphological parameters can be automatically extracted from segmented cells, including cell area, perimeter, length, width, eccentricity, and irregularity (see methods). As these parameters vary along the bacterial cell cycle, measurements obtained from all cells in an asynchronous population may hinder differences associated with specific phases of the cell cycle. eHooke facilitates morphological analysis of cells in distinct cell cycle stages after automatic cell cycle phase classification by the ANN. Users can select cells on a specific cell cycle phase for subsequent analysis. To demonstrate this application, we acquired SIM images of S. aureus JE2 cells stained with the membrane dye Nile red (Figure 4a) and used eHooke to automatically measure cell eccentricity, as well as to classify the cell cycle phase of individual cells. Grouping cells by cell cycle phase showed an increase in eccentricity in later stages of the cell cycle, indicating that cells become more elongated in Phase 3 (Figure 4b), in agreement with previous reports( Reference Monteiro, Fernandes and Vaz9).
Examples of single-cell morphological measurements performed by eHooke. (a) Staphylococcus aureus JE2 cells stained with membrane dye Nile red and imaged by SIM. Scale bars: 1 μm. (b) Quantification of eccentricity of JE2 cells shows an increase along the cell cycle, as previously reported( Reference Monteiro, Fernandes and Vaz9). Phase 1 cells have a median eccentricity of 0.452 ± 0.096 (n = 339), Phase 2 cells of 0.488 ± 0.081 (n = 265), and Phase 3 cells of 0.538 ± 0.115 (n = 150). (c) S. aureus COL cells were incubated for 30 min in the absence (left) or presence (right) of the cell division inhibitor PC190723 (2.5 μg mL−1), stained with membrane dye Nile red and imaged by SIM. Scale bars: 1 μm. (d) Quantification of cell area by eHooke for both conditions shows that the presence of PC190723 leads to an increase in the median cell area, in agreement with inhibition of cell division as the mode of action for this compound (COL: n = 173, COL + PC190723: n = 124). (b,d) Medians are represented by full lines and quartiles by dashed lines. Statistical analysis was performed using a two-sided Mann–Whitney U test. ****p < .0001.
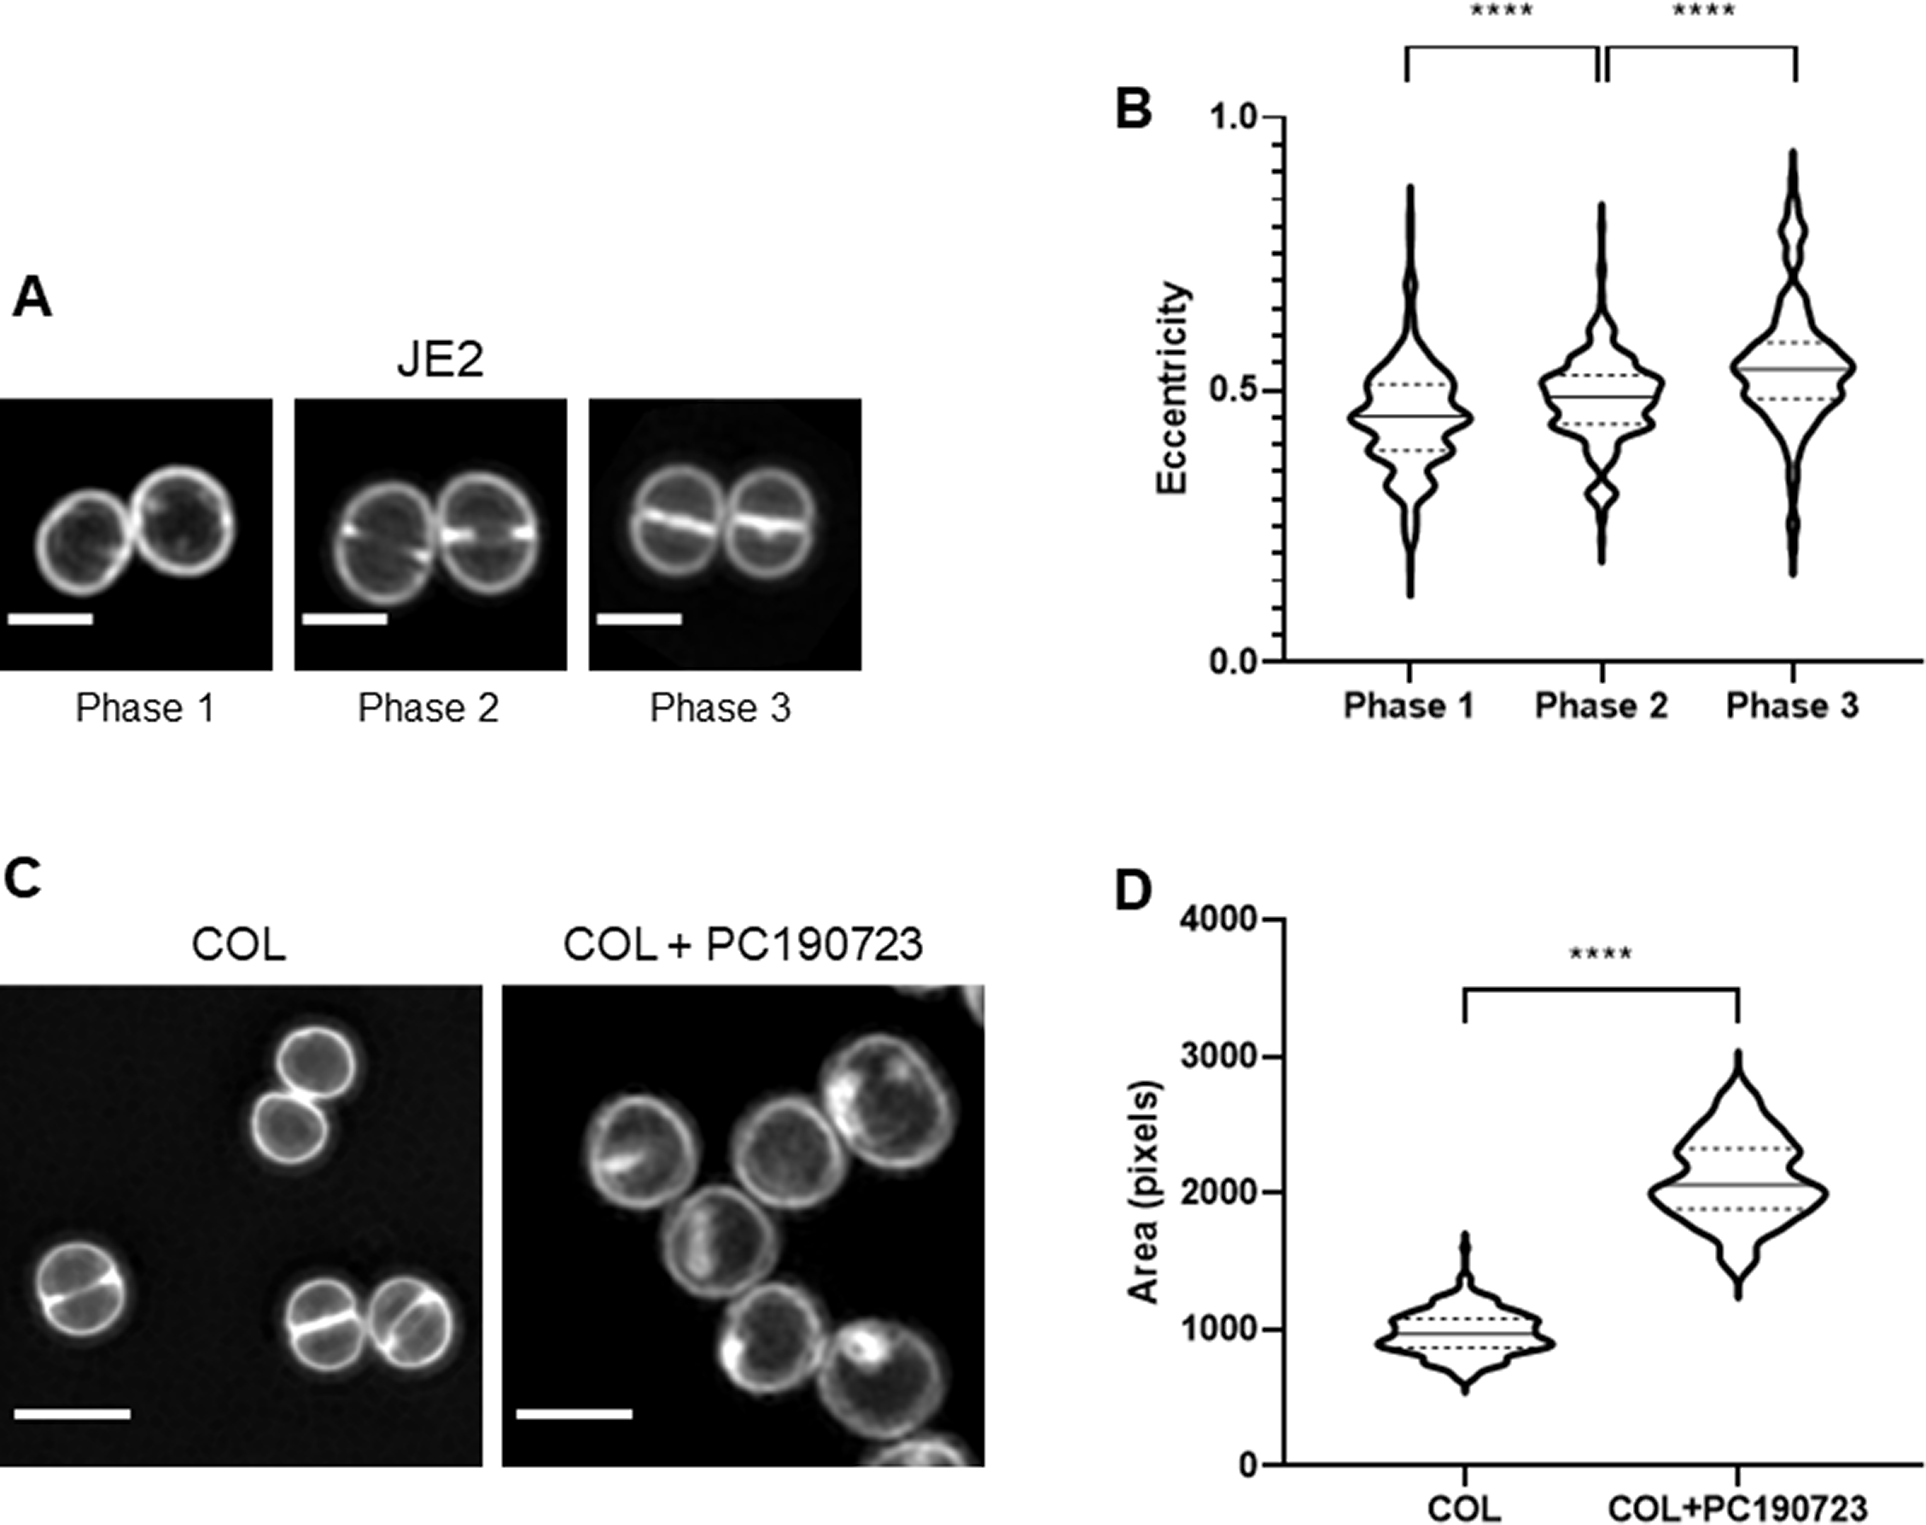
Analysis of cell morphology is relevant for many cell biology studies, including studying the mode of action of antimicrobial compounds. To illustrate this point, we used SIM to image S. aureus COL cells labeled with membrane dye Nile red, which had been previously incubated for 30 min in the absence or presence of PC190723( Reference Haydon, Stokes and Ure18) (Figure 4c). This compound targets FtsZ (the bacterial tubulin homologue), blocking cell division. Consequently, cells stop dividing, but cell wall synthesis continues, increasing the diameter of S. aureus cells( Reference Haydon, Stokes and Ure18). SIM images were analyzed by eHooke, individual cells were automatically identified and segmented, and morphological features, including cell area, were measured. The median area for control cells was 968 ± 161 pixels (n = 173), whereas for cells treated with PC190723, it was 2,057 ± 309 pixels (n = 124), corresponding to a 2.1-fold increase, compatible with the expected inhibition of cell division (Figure 4d).
2.4. Applications of eHooke in cell biology studies
eHooke was developed to expedite various types of analyses that are useful for cell biology studies. These include:
(i) Protein localization studies. As an example, we analyzed widefield microscopy images of S. aureus NCTC 8325-4 strain expressing a fluorescent derivative of Penicillin Binding Protein PBP2, an enzyme involved in the last stages of peptidoglycan synthesis and that is involved in the expression of β-lactam resistance in S. aureus ( Reference Scheffers and Pinho19) (Supplementary Figure 5a). PBP2 is a membrane-anchored protein, which is enriched at the septum of dividing cells. However, it becomes delocalized and dispersed over the cell membrane in the presence of various classes of antibiotics that inhibit peptidoglycan synthesis, such as β-lactams or glycopeptides( Reference Pinho and Errington20). PBP2 localization is a good reporter for peptidoglycan synthesis inhibition and can be assessed by calculating the ratio of the fluorescence of a PBP2 derivative at the septum versus the peripheral membrane( Reference Pereira, Filipe, Tomasz and Pinho21). Manual quantification of this fluorescence ratio (FR) is quite laborious. It involves tracing a line on top of each cell encompassing the background and crossing the membrane and septum, plotting the fluorescence profile, and extracting fluorescence intensity values at the septum, membrane, and background. Supplementary Figure 5b shows FR data obtained for cells expressing GFP-PBP2 in the presence or absence of the β-lactam antibiotic oxacillin, either automatically using eHooke (considering the 25% brightest pixels of the septum, FR25) or manually using ImageJ( Reference Rueden, Schindelin and Hiner1). eHooke data agree well with manual quantification, showing the expected delocalization of PBP2 from the septal region in the presence of oxacillin, which leads to a reduction of FR.
(ii) Analysis of mixed cell populations. Cell biology studies often require a direct comparison of fluorescence levels in two populations/mutants/strains. These comparisons are most accurate if assessed in the same microscopy image. For these pairwise comparisons, one of the samples can be labeled with a specific dye before mixing with the second sample, so that cells from each population can be easily distinguished under the microscope. The mixed sample analysis can be made automatically in eHooke, by loading a secondary fluorescence channel image corresponding to the specific dye used to distinguish one of the samples. The primary channel corresponds to the fluorescence of the protein/dye of interest. Users can then manually select cells with a signal in the secondary channel or use an automatic selection by setting a threshold in the secondary channel. To illustrate this application, we generated mixed populations (one of which was labeled with DNA dye Hoechst 33342) of cells expressing different levels of Green Fluorescent Protein (GFP), using S. aureus RNpGEreporter P spac -GFP( Reference Pereira, Veiga, Jorge and Pinho22), a strain expressing cytoplasmic GFP under the control of the isopropyl β-D-1-thiogalactopyranoside (IPTG) inducible P spac promoter (Supplementary Figure 6). eHooke was then used to measure the mean fluorescence of GFP cytoplasmic signal of both populations, distinguished automatically based on the secondary fluorescence channel (for Hoechst 33342). This simple analysis of mixed populations is helpful for various purposes, including direct comparisons of two samples, analysis of multiple samples using a fixed internal control to normalize absolute fluorescence values, or quantification of anucleate cells (lacking DNA) in a population.
(iii) Calculation of Pearson’s correlation coefficients (PCCs). Proteins that are part of the same multiprotein complex or involved in the same function often colocalize during part of, or the entire cell cycle. Analysis of protein colocalization can be made by calculating the PCC (see methods) of the fluorescence signals from fluorescent derivatives of the two proteins. A PCC of 1 corresponds to a perfect correlation between the two signals, suggesting that the proteins colocalize during the entire cell cycle; a value of 0 indicates no correlation between the localization of the two proteins, whereas a value of −1 suggests that the two proteins are excluded from the same cellular localization. We have previously shown that PCC measurements can be used to estimate the order of arrival of divisome proteins to the division septum as the cell cycle progresses( Reference Monteiro, Pereira and Reichmann6). We have repeated that analysis using eHooke to calculate the PCC for the signal of fluorescent derivatives of two divisome proteins, FtsW and MurJ, and the early divisome protein FtsZ( Reference Monteiro, Pereira and Reichmann6) (Supplementary Figure 7). As FtsZ is the first protein known to arrive at the divisome( Reference Bi and Lutkenhaus23), early divisome proteins correlate better with FtsZ than late divisome proteins. This type of analysis can also be helpful in other contexts, such as identifying functional pairs of proteins or screening for compounds that disrupt protein–protein interactions.
3. Final Remarks
An obvious benefit of automated image analysis is speed, allowing the analysis of large datasets that would be unmanageable if performed manually. However, an equally important advantage is reproducibility. Quantitative analysis can be straightforward, but even simple measurements, such as determining the length of a cell, imply subjective decisions, like defining the cell’s edge. Qualitative analysis is even more prone to user bias and requires a “trained eye.” We have asked 12 members of the laboratory to classify the cell cycle stage of a common set of cells imaged by widefield microscopy or SIM. Supplementary Figure 2 shows the considerable variation of the results obtained by different users, demonstrating the limitations of analyzing large datasets, where subsets are interpreted by different people. It also indicates that the ground truth of the examples used to train and test the classification network was subject to significant uncertainty, since they came from manual annotations by different groups of users. Thus, the obtained accuracies for eHooke in cell cycle classification may be close to the theoretical maximum obtainable using these data as a reference. More importantly, this points to the need for objective and consistent procedures for classifying, measuring, and comparing cell data. By automating these procedures, eHooke guarantees they are consistent over different samples, which is not possible with human intervention.
4. Materials and Methods
4.1. Widefield fluorescence microscopy
Images were acquired with a Zeiss Axio Observer microscope equipped with a Plan-Apochromat 100x/1.4 oil Ph3 objective, a Retiga R1 CCD camera (QImaging: Canada), a white-light source HXP 120 V (Zeiss: Germany), and Metamorph 7.5 software (Molecular Devices: USA). For image acquisition, the filters (Semrock: USA) Brightline TXRED-4040B (Nile red), Brightline CFP-2432A Cyan Fluorescent Protein (CFP), Brightline GFP-3035B (GFP), and Brightline DAPI-1160A (Hoechst 33342) were used.
4.2. Structured Illumination Microscopy
SIM was performed using an Elyra PS.1 microscope (Zeiss) with a Plan-Apochromat 63x/1.4 oil DIC M27 objective. Images were acquired using five grid rotations, with 34 μm grating period for the 561-nm laser (100 mW) and 23 μm grating period for the 405-nm laser (50 mW). Images were captured with a pco.edge 5.5 camera and reconstructed using ZEN software (black edition, 2012, version 8.1.0.484) based on a structured illumination algorithm, using synthetic, channel-specific optical transfer functions and noise filter settings ranging from −6 to −8.
4.3. Automated image analysis in eHooke
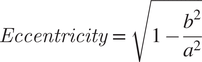
Image analysis is initiated by loading a phase-contrast image and/or fluorescence image. The software then uses the phase-contrast image or the fluorescence image to create a binary mask using the isodata algorithm for automatic thresholding( Reference Dias Velasco14), separating the background pixels from the pixels corresponding to the cells. This mask is then used to find the centers of each individual cell in the image by applying an algorithm that computes the Euclidean distance transform( Reference Virtanen, Gommers and Oliphant24). The software uses those centers and a watershed algorithm( Reference Van Der Walt, Schönberger and Nunez-Iglesias25) to define the pixels corresponding to each cell. Measurement of each cell area is performed by counting the number of pixels corresponding to each cell. To measure eccentricity, the major and minor axes are defined as the major and minor axes of the smallest rectangle that can contain each cell. Eccentricity is then calculated using Equation (1), where a and b are the semimajor and semiminor axes, respectively. eHooke will then define different cell regions: membrane, cytoplasm, and, if needed, septum. The membrane is determined by dilating the outline of each cell toward the inside. The separation of the septum from the cytoplasm is done by using the isodata algorithm( Reference Dias Velasco14) to find the brightest pixels inside the cell, which eHooke then assigns to the septum. Pixels that are part of the interface between the membrane and the septum are removed from the analysis. To calculate the local median background, eHooke starts by defining a bounding box for each cell by taking the minimum and maximum x,y coordinates of pixels belonging to each cell and expanding the box to five pixels in each direction. The local median background is calculated from the background pixels defined in the binary mask in each bounding box while discarding the pixels closer to the cell defined by five rounds of binary dilations( Reference Van Der Walt, Schönberger and Nunez-Iglesias25) on the binary mask. The median fluorescence of each region is measured, and the local median background is subtracted. When the user selects the option to find the septum of each cell, eHooke also calculates the FRs of the fluorescence intensity at the septum versus the membrane( Reference Pereira, Filipe, Tomasz and Pinho21), according to Equation (2). FR will be calculated using all pixels from the septum (FR), or the 10% (FR10), 25% (FR25), or 75% (FR75) brightest septal pixels.
 $$ Eccentricity\hskip2pt =\hskip2pt \sqrt{1-\frac{b^2}{a^2}} $$
 $$ FR\hskip2pt =\hskip2pt \frac{Median(Septum)- Background}{Median(Membrane)- Background} $$
4.4. Automated classification of cell cycle stages of S. aureus
To acquire microscopy images of S. aureus cells at different cell cycle stages, S. aureus JE2 strain cultures were grown overnight in tryptic soy broth (TSB, Difco: USA) and diluted 1:200 in fresh medium the following morning. Cultures were grown until OD600nm = 0.8, and 1 ml was stained with membrane dye Nile red (5 μg mL−1, Invitrogen: USA) and DNA dye Hoechst 33342 (1 μg mL−1, Invitrogen) for 5 min. Cultures were then centrifuged, washed with 1 ml of 1:3 (vol/vol) TSB/phosphate buffered saline (PBS) solution, and resuspended in 20 μL of the same solution. Cells were mounted on microscope slides covered with a layer of 1.2% (w/v) agarose in PBS. Images were acquired by widefield microscopy or SIM. Widefield microscopy was performed to image Nile red and Hoechst 33342 with an exposure time of 100 ms. SIM was performed using a 561-nm laser (100 mW) and a 405-nm laser (50 mW) with an exposure time of 100 ms. Every image was segmented using eHooke and cropped around each cell (50 × 50 pixels for widefield and 100 × 100 pixels for SIM) for both fluorescence channels to create single-cell images. To remove background and fluorescence from neighbor cells from single-cell images, the fluorescence intensity of every pixel not corresponding to a cell was set to 0. Cells were then manually classified for the cell cycle phase by groups of users. Only cells with the same classification by the majority of users were used for the dataset. From these, 10% of cells in each phase were randomly selected and separated to create the test dataset. Of the remaining images, cells from Phases 1 and 2 were randomly discarded to balance the number of cells in each cell cycle phase. Widefield microscopy single-cell images were resized to the same size as the SIM single-cell images. Both widefield and SIM cell images were combined in a training dataset. The resulting dataset was used to train an ANN to classify images of individual cells automatically. Ablation studies were performed by sequentially removing layers from the original ANN. Each architecture was trained with the training dataset, and the corresponding classification accuracies were tested using the test dataset. The proposed ANN model is composed of 22 layers: seven convolutions (each followed by a reLU activation layer), with the first four being intercalated by three MaxPooling, followed by one flatten, one dense, one activation reLU, another dense, and one SoftMax activation layer (Figure 3a). The generated model was integrated into eHooke. The model classifies the cell cycle phase in images where cells are labeled with a membrane dye, used as the main fluorescence channel of eHooke, and, if available, an image where cells are labeled with a DNA dye, which should be used as the secondary channel of eHooke. For biological validation, we acquired widefield microscopy images of S. aureus JE2 strain and a transposon mutant in the sle1 gene (JE2 sle1::Tn)( Reference Fey, Endres and Yajjala16) using the labeling strategy described above, which were then analyzed using eHooke and the automated cell cycle classification ANN. To test the ANN with images obtained in different microscopes, widefield microscopy images of S. aureus JE2 cells were also acquired with a DeltaVision OMX SR microscope equipped with an Olympus 60X PlanApo N/1.42 oil objective and AcquireSRsoftWoRx (GE: USA) for acquisition and deconvolution, using the 568-nm (100 mW) and 405-nm (100 mW) lasers with an exposure time of 100 ms. The deconvolution algorithm used by the AcquireSRsoftWoRx (GE) software is based on the Gold’s multiplicative method( Reference Gold26), further developed by Agard and Sedat( Reference Agard, Hiraoka, Shaw and Sedat27).
4.5. Effect of PC190723 on S. aureus cell size
An overnight culture of S. aureus strain COL was back-diluted 1:200 into TSB and grown at 37°C. When the OD600nm reached 0.4, the culture was separated into two flasks. PC190723 (gift by Merck: USA) was added to one flask at a final concentration of 2.5 μg mL−1, and incubation was continued for 30 min at 37°C. One milliliter of each culture was stained with Nile red at a final concentration of 10 μg mL−1 for 5 min at room temperature. Cells were then centrifuged, washed with 1 ml of PBS, centrifuged again, resuspended in 20 μL of PBS, and mounted on microscope slides covered with a thin layer of 1.2% (w/v) agarose in PBS, before being imaged by SIM using the 561-nm laser with an exposure time of 100 ms. Measurement of single-cell area was done using eHooke.
4.6. Measurement of S. aureus cytoplasmic fluorescence
A culture of S. aureus RNpGEreporter P spac -GFP strain( Reference Pereira, Veiga, Jorge and Pinho22) was grown overnight at 37°C in TSB with erythromycin (10 μg mL−1). The culture was back-diluted 1:200 in TSB supplemented with IPTG (Apollo Scientific: UK) at 0.025 mM (one flask) or 0.25 mM (two flasks), and grown until OD600nm = 0.8. To distinguish the 0.25 mM IPTG control from the experimental samples, DNA dye Hoechst 33342 was added to the control culture at a final concentration of 1 μg mL−1. Incubation continued at 37°C for 5 min, and cells were washed with 1 ml of a solution of 1:3 (vol/vol) TSB/PBS and resuspended in 20 μL of PBS. Samples were then prepared for widefield microscopy by mixing 5 μL of each sample with 5 μL of the control cells, vortexed, and the mix was mounted on microscope slides covered with a thin layer of 1.2% (w/v) agarose in PBS. Widefield microscopy images were acquired to image GFP and Hoechst 33342, with the exposure times of 3,000 and 100 ms, respectively. The cytoplasmic fluorescence of each cell was measured using eHooke and divided by the average fluorescence of control cells.
4.7. Localization of PBP2
S. aureus strain BCBPM090 (NCTC PBP2::P5GFPPBP2) was grown overnight in TSB at 37°C. This strain was obtained using plasmid pBCBPM061( Reference Tan, Therien and Lu28) to generate an NCTC 8325-4 derivative encoding a GFP fluorescent fusion to PBP2. Strain BCBPM090 was back-diluted 1:200 in TSB, grown until OD600nm = 0.4, and split into two different flasks. Oxacillin (which causes PBP2 delocalization from the septum) was added to one of the flasks at a final concentration of 0.5 μg mL−1. After 15 min, 1 ml of culture was washed with a 1:3 (vol/vol) TSB/PBS solution, resuspended in 20 μL of PBS, and mounted on microscope slides covered with a thin layer of 1.2% (w/v) agarose in PBS. Images of cells incubated in the presence and absence of oxacillin were then acquired by widefield fluorescence microscopy using the filter for GFP with an exposure time of 3,000 ms. FRs were measured using eHooke.
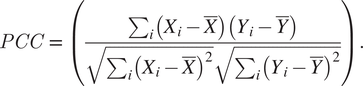
4.8. Measurement of Pearson’s correlation coefficients
Overnight cultures of S. aureus COL strains ColZZ (grown in TSB with 50 μM of kanamycin and neomycin), ColWZ, and COLJZ (grown in TSB) were back-diluted 1:200 in TSB supplemented with IPTG (0.1 mM for ColZZ and 0.5 mM for ColWZ and COLJZ) and grown until OD600nm = 0.6. One milliliter of each culture was centrifuged, washed with a PBS solution, resuspended in 20 μL of PBS, and mounted on microscope slides covered with a thin layer of 1.2% (w/v) agarose in PBS. Images were then acquired by widefield fluorescence microscopy. ColZZ images were acquired with an exposure time of 3,000 ms for both CFP and mCherry channels, ColWZ with 4,000 and 3,000 ms, and ColJZ with 5,000 and 2,000 ms, respectively. PCC values were calculated for each cell using eHooke as shown in Equation (3), where Xi
and Yi
correspond to pixel fluorescence intensity from two fluorescent channels and $ \overline{X} $
and
$ \overline{X} $
and $ \overline{Y} $
to the mean cell fluorescence intensity value on each channel. Only pixels corresponding to each cell are used for this calculation.
$ \overline{Y} $
to the mean cell fluorescence intensity value on each channel. Only pixels corresponding to each cell are used for this calculation.
 $$ PCC\hskip2pt =\hskip2pt \Big(\frac{\sum_i\left({X}_i-\overline{X}\right)\left({Y}_i-\overline{Y}\right)}{\sqrt{\sum_i{\left({X}_i-\overline{X}\right)}^2}\sqrt{\sum_i{\left({Y}_i-\overline{Y}\right)}^2}}. $$
4.9. Statistical analysis
Statistical analyses were done using GraphPad Prism 8 (GraphPad Software: USA). Mann–Whitney U tests were used to compare differences between non-normal distributions. p-values ≤ .05 were considered as significant for all analyses performed; asterisks indicate: **** p ≤ .0001.
Acknowledgments
We are very thankful to present and former members of the Pinho Lab, Ambre Jousselin, Ana R. Pereira, Andreia Duarte, Andreia Tavares, Daniel Vega, Helena Veiga, João Monteiro, Mário Ferreira, Marta Sporniak, Moritz Sorg, Nathalie Reichmann, Nils Meiresonne, Patricia Reed, Pedro Fernandes, Pedro M. Pereira, Sara Costa, and Simon Schäper for the laborious manual classification of the cell cycle stage of S. aureus cells and Pedro M. Pereira for the construction of strain BCBPM090.
Supplementary Materials
To view supplementary material for this article, please visit http://dx.doi.org/10.1017/S2633903X21000027.
Funding Statement
This study was funded by the European Research Council through grant ERC-2017-CoG-771709 (to M.G.P). Additional funds include national funds through Fundação para a Ciência e a Tecnologia (FCT) Project MOSTMICRO-ITQB UIDB/04612/2020 and UIDP/04612/2020 (to ITQB-NOVA), grant PTDC/BIA-MIC/30746/2017 (to S.F.), and fellowship SFRH/BD/147052/2019 (to B.M.S). R.H. acknowledges funding from the Wellcome Trust (203276/Z/16/Z), the European Research Council (ERC-2020-CoG-101001332), and the European Molecular Biology Organization (Installation Grant EMBO-2020-IG-4734).
Competing Interests
The authors declare no competing interests exist.
Data Availability Statement
Data can be made available to interested researchers upon request by email to the corresponding authors. eHooke code is available from https://github.com/BacterialCellBiologyLab/eHooke. Code used to train the automated cell cycle classification ANN is available from https://github.com/BacterialCellBiologyLab/SaureusCellCycleClassification.
Authorship Contributions
All authors designed the research. B.M.S. performed the experiments and developed new software. B.M.S. and M.G.P. analyzed the data. B.M.S., R.H., and M.G.P. wrote the paper. All authors discussed the results and commented on the manuscript.


 Open access

