





1. Introduction
The long-term evolution of glacier surface mass balance is known to be a very good indicator of changing climate conditions (e.g., Haeberli and Beniston, Reference Haeberli and Beniston1998; Solomon and others, Reference Solomon, Manning, Marquis and Qin2007). In the Alps, the interannual variability of the annual surface mass balance is mainly driven by the summer surface mass balance variability (e.g., Braithwaite and Zhang, Reference Braithwaite and Zhang2000; Oerlemans and Reichert, Reference Oerlemans and Reichert2000; Kuhn, Reference Kühn2003; Six and Vincent, Reference Six and Vincent2014; Davaze and others, Reference Davaze, Rabatel, Dufour, Arnaud and Hugonnet2020). Consequently, many studies have focused on summer surface mass-balance modelling using approaches of varying complexity (e.g., Hock, Reference Hock1999; Pellicciotti and others, Reference Pellicciotti2005; Gabbi and others, Reference Gabbi, Carenzo, Pellicciotti, Bauder and Funk2014; Réveillet and others, Reference Réveillet, Vincent, Six and Rabatel2017). Nevertheless, some studies have pointed out a strong sensitivity of annual to winter surface mass balance given that the thicker the winter snowpack, the later the snow/ice transition at the glacier surface, resulting in reduced summer ablation (e.g., Paul and others, Reference Paul, Kääb, Maisch, Kellenberger and Haeberli2004; Machguth and others, Reference Machguth, Eisen, Paul and Hoelzle2006; Dadic and others, Reference Dadic, Mott, Lehning and Burlando2010; Réveillet and others, Reference Réveillet, Vincent, Six and Rabatel2017, Reference Réveillet2018). In addition, accumulation is considered to be the variable with the highest uncertainty in glacier surface mass-balance modelling. Therefore, assessing the spatio-temporal variability of the winter surface mass balance is important to model the annual surface mass-balance evolution with reduced uncertainties.
Snow-accumulation measurements at high resolution are very useful to force, calibrate or validate models. Complex models such as SnowTran-3D (Liston and Sturm, Reference Liston and Sturm1998) have been developed to simulate wind transport and have been successfully used in alpine regions (e.g., Bruland and others, Reference Bruland, Liston, Vonk, Sand and Killingtveit2004), but require high spatial and temporal resolution of the meteorological forcing data, as well as a good understanding of the processes responsible for snow-accumulation spatial variability (Trujillo and Lehning, Reference Trujillo and Lehning2015). Indeed, the spatio-temporal variability of winter surface mass balance due to orographic and wind effects (transport, deposition, erosion) is difficult to quantify and consequently to model at the glacier scale because in situ measurements are commonly limited to a few points per km2 (WGMS, 2013) and may not fully represent the local effects. Indeed, while the interannual variability of precipitation amount is known to control the interannual variability of winter surface mass balance (e.g., Vincent, Reference Vincent2002), the topography and wind effects impact its spatial variability. Many studies have pointed out the increase in winter surface mass balance with elevation (e.g., Rohrer and others, Reference Rohrer, Braun and Lang1994; López-Moreno and Stähli, Reference López-Moreno and Stähli2008; Grünewald and Lehning, Reference Grünewald and Lehning2011; Grünewald and others, Reference Grünewald2013; Pulwicki and others, Reference Pulwicki, Flowers, Radić and Bingham2018) and the amount of snow is usually assessed using a correction factor depending on elevation and a temperature threshold to characterize the precipitation phase (Vincent and others, Reference Vincent, Vallon, Pinglot, Reynaud and Funk1997, Reference Vincent2007a; Hock, Reference Hock1999; Machguth and others, Reference Machguth, Eisen, Paul and Hoelzle2006, Reference Machguth, Paul, Kotlarski and Hoelzle2009; Rabatel and others, Reference Rabatel, Dedieu, Thibert, Letréguilly and Vincent2008). However, the correction factor needs to be adjusted (e.g., Huss and Bauder, Reference Huss and Bauder2009), which requires spatialized measurements to account for the spatial variability of winter surface mass balance in relation to processes linked with the deposition or redistribution of snow (e.g., Gerbaux and others, Reference Gerbaux, Genthon, Etchevers, Vincent and Dedieu2005).
Different methods can be used to measure the spatial variability of winter surface mass balance at high spatial resolution. Indeed, stakes or drilling cores provide only local information (e.g., Cogley and others, Reference Cogley2011). Ground-penetrating radar (GPR) can be used to determine annual snow-layer thickness over different transects (e.g., Dunse and others, Reference Dunse2009; Heilig and others, Reference Heilig, Eisen and Schneebeli2010; Helfricht and others, Reference Helfricht2012; Sold and others, Reference Sold2013). More recently, innovative techniques such as drone photogrammetry (e.g., Bühler and others, Reference Bühler, Adams, Bösch and Stoffel2016), Pléiades imagery at high resolution (e.g., Marti and others, Reference Marti2016) or LiDAR (Light Detection And Ranging) have been widely used on ice-free surfaces and make it possible to determine the spatial distribution of the winter surface mass balance using digital elevation model (DEM) differencing. Airborne LiDAR acquisitions provide measurements over large areas (e.g., Baltsavias, Reference Baltsavias1999; Wehr and Lohr, Reference Wehr and Lohr1999; Lutz and others, Reference Lutz, Geist and Stötter2003; Helfricht and others, Reference Helfricht2012). Terrestrial LiDAR measurements generally cover smaller areas, but offer higher temporal acquisition frequencies (e.g., Prokop, Reference Prokop2008; Fischer and others, Reference Fischer, Huss, Kummert and Hoelzle2016). Nevertheless, LiDAR measurements are generally combined with other approaches to evaluate or quantify the uncertainty. For instance, Piermattei and others (Reference Piermattei, Carturan and Guarnieri2015, Reference Piermattei2016) combined photogrammetric methods with airborne or terrestrial laser scanning, Carturan and others (Reference Carturan2013) compared terrestrial laser surveys with a combination of geomorphological, geophysical and high-resolution geodetic surveying, and Fischer and others (Reference Fischer, Huss, Kummert and Hoelzle2016) evaluated the airborne LiDAR measurements using in situ observations. In addition, many LiDAR measurements have been carried out on non-glacial environments to study the spatio-temporal variability of snow accumulation (e.g., Fassnacht and Deems, Reference Fassnacht and Deems2006; Trujillo and others, Reference Trujillo, Ramírez and Elder2007; Grunewald and others, Reference Grünewald, Schirmer, Mott and Lehning2010; Grünewald and others, Reference Grünewald2013; Kirchner and others, Reference Kirchner, Bales, Molotch, Flanagan and Guo2014; Revuelto and others, Reference Revuelto, López-Moreno, Azorin-Molina and Vicente-Serrano2014).
Few studies have been carried out on glaciers (e.g., Deems and others, Reference Deems, Painter and Finnegan2013; Sold and others, Reference Sold2013; Gabbud and others, Reference Gabbud, Micheletti and Lane2015) because of the complexity of taking into account the glacier flow and snow/firn densification. Indeed, glacier surface evolution is related to snow-accumulation changes and to submergence/emergence velocities, which can be of the same order of magnitude (e.g., Vincent and others, Reference Vincent2007b). Therefore, methods based on DEM comparison need to take into account the effects of glacier dynamics to quantify the surface mass balance. For this purpose, some studies have used empirical methods to estimate the vertical variations of the glacier surface topography due to ice flow (e.g., Sold and others, Reference Sold2013; Schöber and others, Reference Schöber2014) or have used stakes to directly measure the emergence velocities at some points (e.g., Vincent and others, Reference Vincent, Vallon, Pinglot, Reynaud and Funk1997, Reference Vincent2007b). The emergence velocities can be calculated from horizontal and vertical velocities and the slope of the surface. In the accumulation zone, the emergence velocities are negative (therefore called submergence), which corresponds to a downward flow of the mass relative to the glacier surface. The submergence velocity allows the surface mass balance to be related to thickness changes (Cuffey and Paterson, Reference Cuffey and Paterson2010) but is the subject of only a few studies (e.g., Vincent and others, Reference Vincent, Vallon, Pinglot, Reynaud and Funk1997, Reference Vincent2007b; Kääb and Funk, Reference Kääb and Funk1999).
Regarding the glaciers located in the French Alps and monitored within the framework of the GLACIOCLIM (les GLACIers, un Observatoire du CLIMat) observatory (part of the French Research Infrastructure OZCAR, Gaillardet and others, Reference Gaillardet2018), the winter surface mass balance is currently measured at distinct points using the glaciological method (core drilling and density measurements). Based on these data, previous studies have shown a significant correlation between the temporal variability of precipitation and winter surface mass balance (e.g., Vincent, Reference Vincent2002; Six and Vincent, Reference Six and Vincent2014; Réveillet and others, Reference Réveillet, Vincent, Six and Rabatel2017). However, no significant relationship between winter surface mass-balance spatial variability and topographic variables has been found (Réveillet and others, Reference Réveillet, Vincent, Six and Rabatel2017). This might be due to the low spatial density of in situ measurements that does not allow local effects responsible for spatial variability over short distances to be considered (e.g., Fassnacht and Deems, Reference Fassnacht and Deems2006; López-Moreno and others, Reference López-Moreno, Fassnacht, Beguería and Latron2011). In such a context, the aim of this paper is to study the spatio-temporal evolution of surface mass balance over one year in the accumulation zone of the Mer de Glace (Mont-Blanc range, France) using repeated in situ high-resolution topographic and meteorological measurements. For that purpose, repeated LiDAR acquisitions, submergence velocity estimates and meteorological records from an automatic weather station (AWS) were collected over a one-year period. First, the experimental method will be presented along with a comparison of two methods to quantify the submergence velocities. Second, we will analyze and discuss the pattern of the spatio-temporal variability of the surface mass balance.
2. Study area
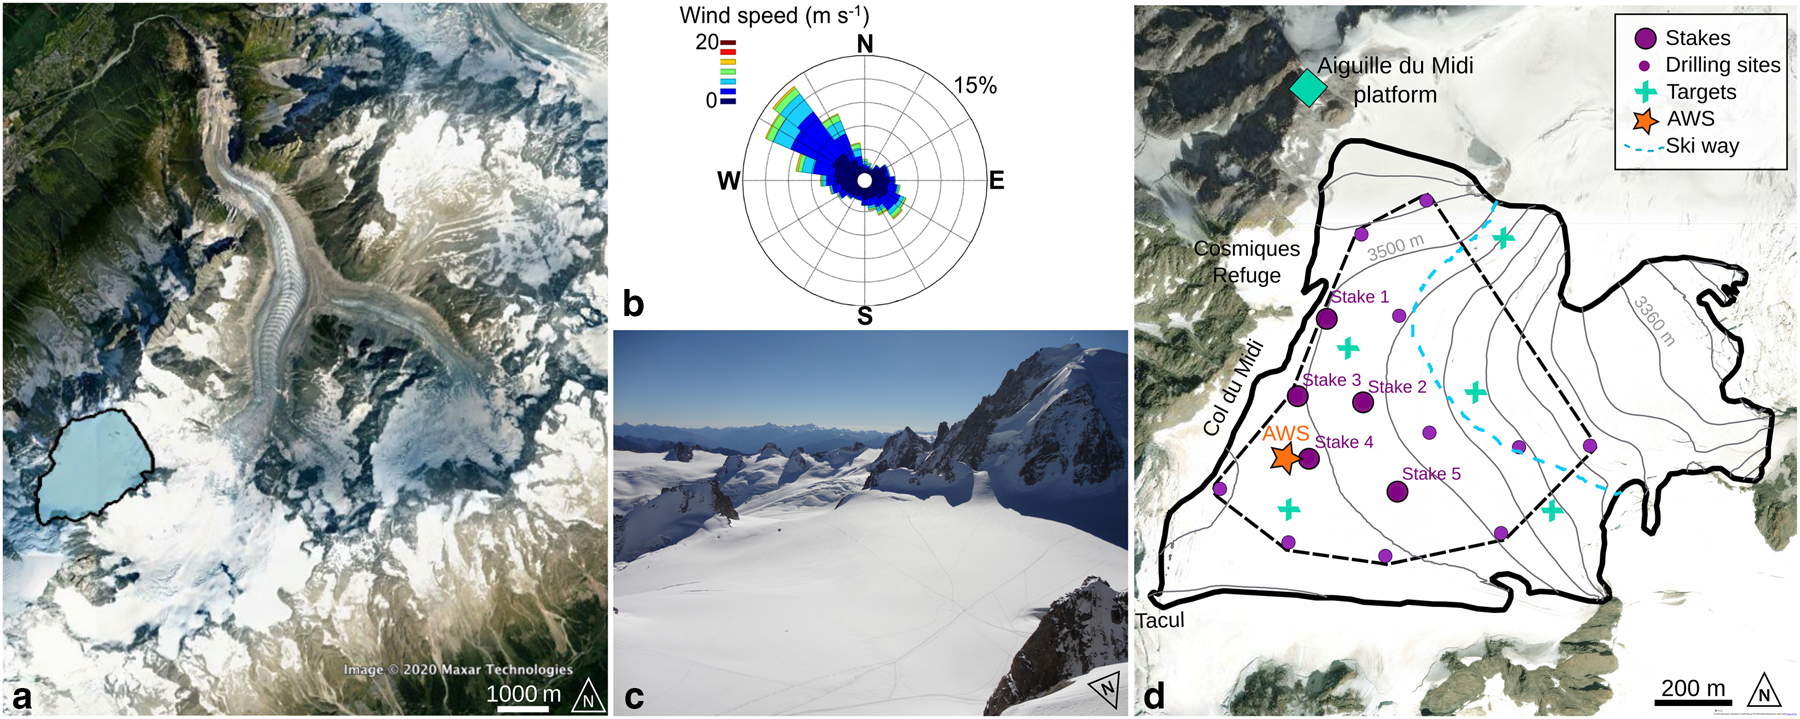
The study site is a ~2 km2 area located in the accumulation zone of the Mer de Glace, at the Col du Midi (45.51°N, 6.54°E, Fig. 1). This site is easily accessible by the Aiguille du Midi cable car. The area includes a small elevation range (from 3350 to ~3600 m a.s.l.) and is relatively flat (average slope of 2°, with a maximum of 11°). The mean winter surface mass balance computed over the last 20 years, based on measurements performed at two sites following the glaciological method, is 2.2 m w.e. a−1 (GLACIOCLIM program). Regarding weather conditions, this area is exposed to strong north-westerly winds, mainly due to the presence of the Col du Midi pass (Météo France data).
(a) Location of the study site (blue area) in the Mer de Glace catchment (background image from Google Earth). (b) Wind rose from the half-hourly mean measurements at the weather station, indicated with an orange star on (d), over the period February–October 2015. (c) Photograph of the study area taken on 31 October 2014 from the Aiguille du Midi platform where the terrestrial LiDAR was set up, indicated by a green diamond on (d). (d) Study sites and measurement locations. Green crosses are the locations of targets used for LiDAR georeferencing. Small purple dots are the locations of the drilling measurements performed on 27 May 2015. Larger purple dots are the stake locations. The blue dashed line is the ski way. The orange star is the location of the automatic weather station (AWS). The thick black line delimits the entire area scanned with the terrestrial LiDAR. The dashed black line shows the boundary of the interpolations made in the study.
3. Method and data
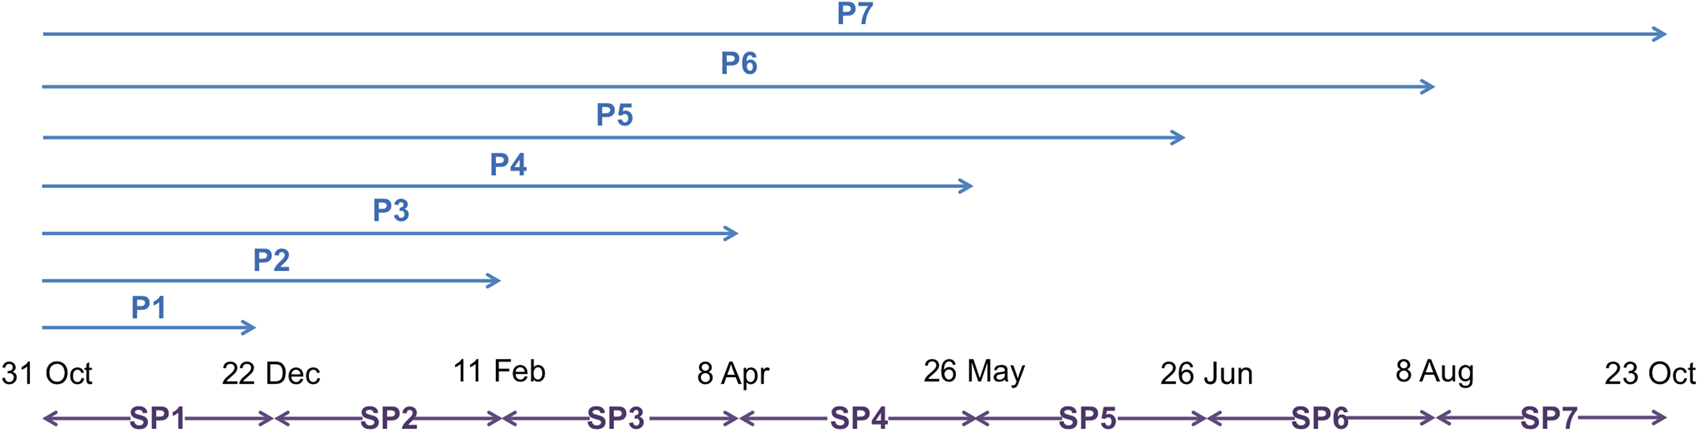
The field campaigns were conducted approximately every 5 weeks over one year, from October 2014 to October 2015. For the sake of clarity, in the following, the time period between the first campaign considered as the reference (i.e., October 2014) and a given campaign is called the total period (noted Pi, with i ɛ [1; 7]); and the time period between two successive campaigns is called a sub-period (noted SPi, with i ɛ [1; 7]). This is illustrated in Figure 2.
Definition of periods (Pi) and sub-periods (SPi) over the year of measurements.
3.1 Terrestrial laser-scanner measurements
Terrestrial laser scanners emit laser signals and measure the return time of the signal after reflection on the scanned surface. In this study, we used an Optech ILRIS-LR long-range Terrestrial Laser Scanner (with a near-infrared wavelength of 1064 nm suited to a snow-covered surface), providing measurements over a maximum distance of 3 km. At our study site, the scanned distances range from 400 to 1800 m. Note that the beam size is 27 ± 7 mm at 100 m and increases with distance.
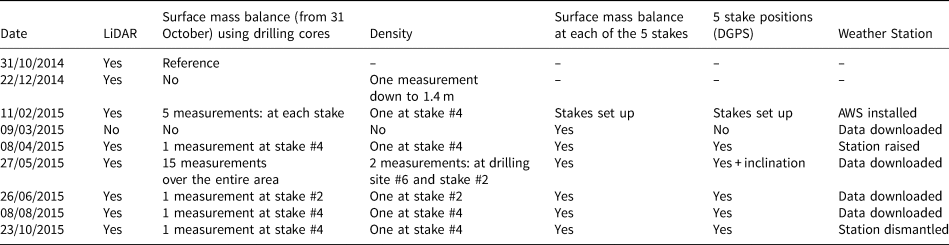
Over the one year study period from 31 October 2014 to 23 October 2015, eight LiDAR acquisitions were performed (see Table 1). Measurements were made from the southernmost Aiguille du Midi platform (Figs 1b, c), at the same place for each acquisition. Given the large area scanned, three scan windows were necessary to cover the entire zone. Data acquisition was made with an averaged sampling step of 0.20 m at 900 m (ranging from 0.10 to 0.42 m depending on the distance). The data obtained from the LiDAR scanner consist of point clouds that were subsequently processed with Polyworks software to obtain a DEM for each survey. First, the point clouds from the three scanned windows were aligned together. For that purpose, the least square method was applied in the overlapping areas between the different windows. Once aligned, the point clouds were merged. Then, for the georeferencing of the merged point cloud resulting from each survey, the 3D coordinates of six targets were measured using a differential GPS (D-GPS). For this, we used a Leica 1200 Differential Global Positioning System (GNSS) receiver, running with dual frequencies. Occupation times were typically 1 min with one second sampling and the number of visible satellites (GPS and GLONASS) was >7. The distance between fixed and mobile receivers was less than a kilometer. The DGPS positions have an intrinsic accuracy of ±0.01 m. Considering this DGPS uncertainty and the manual measurement uncertainty when measuring the target center, we consider the accuracy to be ±0.03 m. Finally, the georeferenced point clouds were rasterized using the nearest neighbor method to obtain eight 1 m resolution DEMs with a horizontal and vertical uncertainty related to the alignment and the georeferencing of 3 and 10 cm, respectively.
Summary of measurements performed during each field campaign over the entire year
3.2 Surface mass-balance measurements
3.2.1 Drilling cores
Several snow-accumulation measurements using a PICO three-inch (7.62 cm) hand ice-coring system were performed during each of the eight field campaigns, drilling cores down to the end-of-summer layer, easily identifiable from changes in snow grain size and the dust deposited during the previous summer period. This method quantifies the total surface mass balance since the beginning of the winter season (i.e., October 2014). Note that the October surface (or end-of-summer) is considered as the reference layer before the accumulation and matches the surface measured with the LiDAR in October 2014 as almost no precipitation occurred during the month of October 2014 (3.5 mm w.e. accumulated over the month), i.e., before the LiDAR scan on 31 October 2014. Furthermore, snow profile measurements made in the first meter of the snowpack at this time showed grain size and type corresponding to metamorphosed snow, supporting the interpretation that the 31 October surface was the snow layer representative of the end-of-summer surface.
For each campaign, one core was drilled close to the AWS, providing the snow depth and density (more details in Table 1). During the campaign on 27 May 2015, roughly at the end of the accumulation season, 15 cores (see locations in Fig. 1), including two density measurements, were drilled over the accessible parts of the study area.
3.2.2 Stakes
Five 5 m long wooden poles with a diameter of 12 cm were inserted to a depth of 1 m on 11 February 2015. These five stakes were distributed over the central part of the study area (Fig. 1c). Locations were chosen according to accessibility, without disturbing the ski way, which is very busy with tourism during wintertime. During each field campaign, the snow depth changes were measured by calculating the differences in stake emergence (i.e., following the glaciological method, more details in Table 1) with an estimated accuracy of ±0.05 m (uncertainty mainly related to the slight tilt of the stakes).
3.3 Submergence velocity
As defined by Cuffey and Paterson (Reference Cuffey and Paterson2010), the emergence velocity corresponds to the upward or downward displacement relative to the glacier surface, which can be defined at a fixed coordinate or for a coordinate that moves with the flow. In the accumulation area, it is called the submergence velocity and is due to the ice motion and snow/firn densification. It corresponds to the downward vertical displacement corrected for slope and is defined by Eqn (1).

where u s, v s, w s are the components of the velocity vector of the glacier flow, Z s is the elevation of the glacier surface and x, y the coordinates. At a given point, the glacier surface elevation changes according to the sum of submergence velocities and the amount of mass (i.e., snow, ice) added to the surface. Note that submergence velocity differs from the velocity of the vertical displacement of the stakes (which is defined by the vertical changes at rate w s). In this study, two in situ methods were used to measure the submergence velocity and are described below.
3.3.1 Method 1: measurements at each core drilling site
This method (M1) is an Eulerian approach that calculates the submergence velocity for fixed points, independent of time. For this purpose, the elevation of the end-of-summer layer (ZsEndSummer_Oct, in m a.s.l.) was measured during the first LiDAR acquisition performed on 31 October 2014, with an uncertainty estimated at ± 0.10 m (see Section 3.1). The elevation of the same layer was then measured again in May 2015 (ZsEndSummer_May, in m a.s.l.) for each of the 15 core drilling sites using the height of the snow mantle from drilling cores (with an uncertainty of ±0.20 m, Thibert and others, Reference Thibert, Blanc, Vincent and Eckert2008) and D-GPS measurements (with an uncertainty of ±0.03 m). The elevation difference between the two dates represents the submergence velocity. Therefore, based on these measurements, the submergence velocity at each point (w sub) can be computed using Eqn (2), with an uncertainty of ~ ± 0.22 m, quantified from the propagation of errors, considering uncertainties related to LiDAR, drilling cores and DGPS measurements.

3.3.2 Method 2: measurement using stakes
The second method (M2) is a Lagrangian approach that follows the location of a point and is time dependent. This method involves measuring the locations of the tops of the five stakes. These locations were accurately measured using a D-GPS during each campaign, from 11 February 2015 onward, to quantify vertical and horizontal location changes of the stakes. For each measurement, the slope of the surface (α) is calculated over the distance of the horizontal displacement of the stake between two campaigns. The slope is computed from the LiDAR-derived DEM measured at each campaign. This slope is considered to quantify the submergence velocities using this method (Eqn. 3). Uncertainties of this method are related to: (i) D-GPS measurements (±0.03 m corresponding to the DGPS accuracy (see Section 3.1) and the size of the holes drilled to insert the stakes), (ii) the slope estimation (±0.04 m, corresponding to a slope difference of 1°), and (iii) the stake inclination over time due to glacier flow (±0.03 m). Considering all these uncertainties, the submergence-velocity uncertainty for the period from February to May is computed using the propagation error approach and is equal to ±0.18 m (~ ± 0.50 m per year) using this method.

3.4 Surface mass-balance maps
Surface mass-balance maps were plotted using the differences between the DEMs acquired with the LiDAR measurements and correcting these DEM differences using the submergence velocities. For this, the submergence velocities quantified at a point scale have been interpolated using a Kriging method. Interpolation uncertainty is computed using a leave-one-out cross-validation method, i.e., performing repeated interpolations based on 14 of the 15 points, keeping one point for uncertainty estimation. Finally, surface mass-balance maps are compared to local measurements to evaluate the method uncertainty.
3.5 Automatic weather station measurements
An AWS was set up on 11 February 2014 at Col du Midi (see location on Fig. 1) and recorded meteorological measurements continuously (without a data gap) until 23 October 2015 (Table 1). The air temperature, relative humidity (measured with a VAISALA HMP155 sensor), wind speed and direction (measured with an RM Young 05103 sensor) and snow depth (using an SR50 Campbell sonic ranger) were recorded at an hourly time step. These data were used to interpret the variability of the surface mass balance as discussed in Section 5. Daily precipitation from SAFRAN reanalysis data (Durand and others, Reference Durand2009) was also used. SAFRAN disaggregates large-scale meteorological analyses and observations in the French Alps. The analyses provide hourly meteorological data for seven slope exposures (N, S, E, W, SE, SW and flat) and altitudes at 300 m intervals up to 3600 m a.s.l.
4. Results
4.1 Horizontal velocities
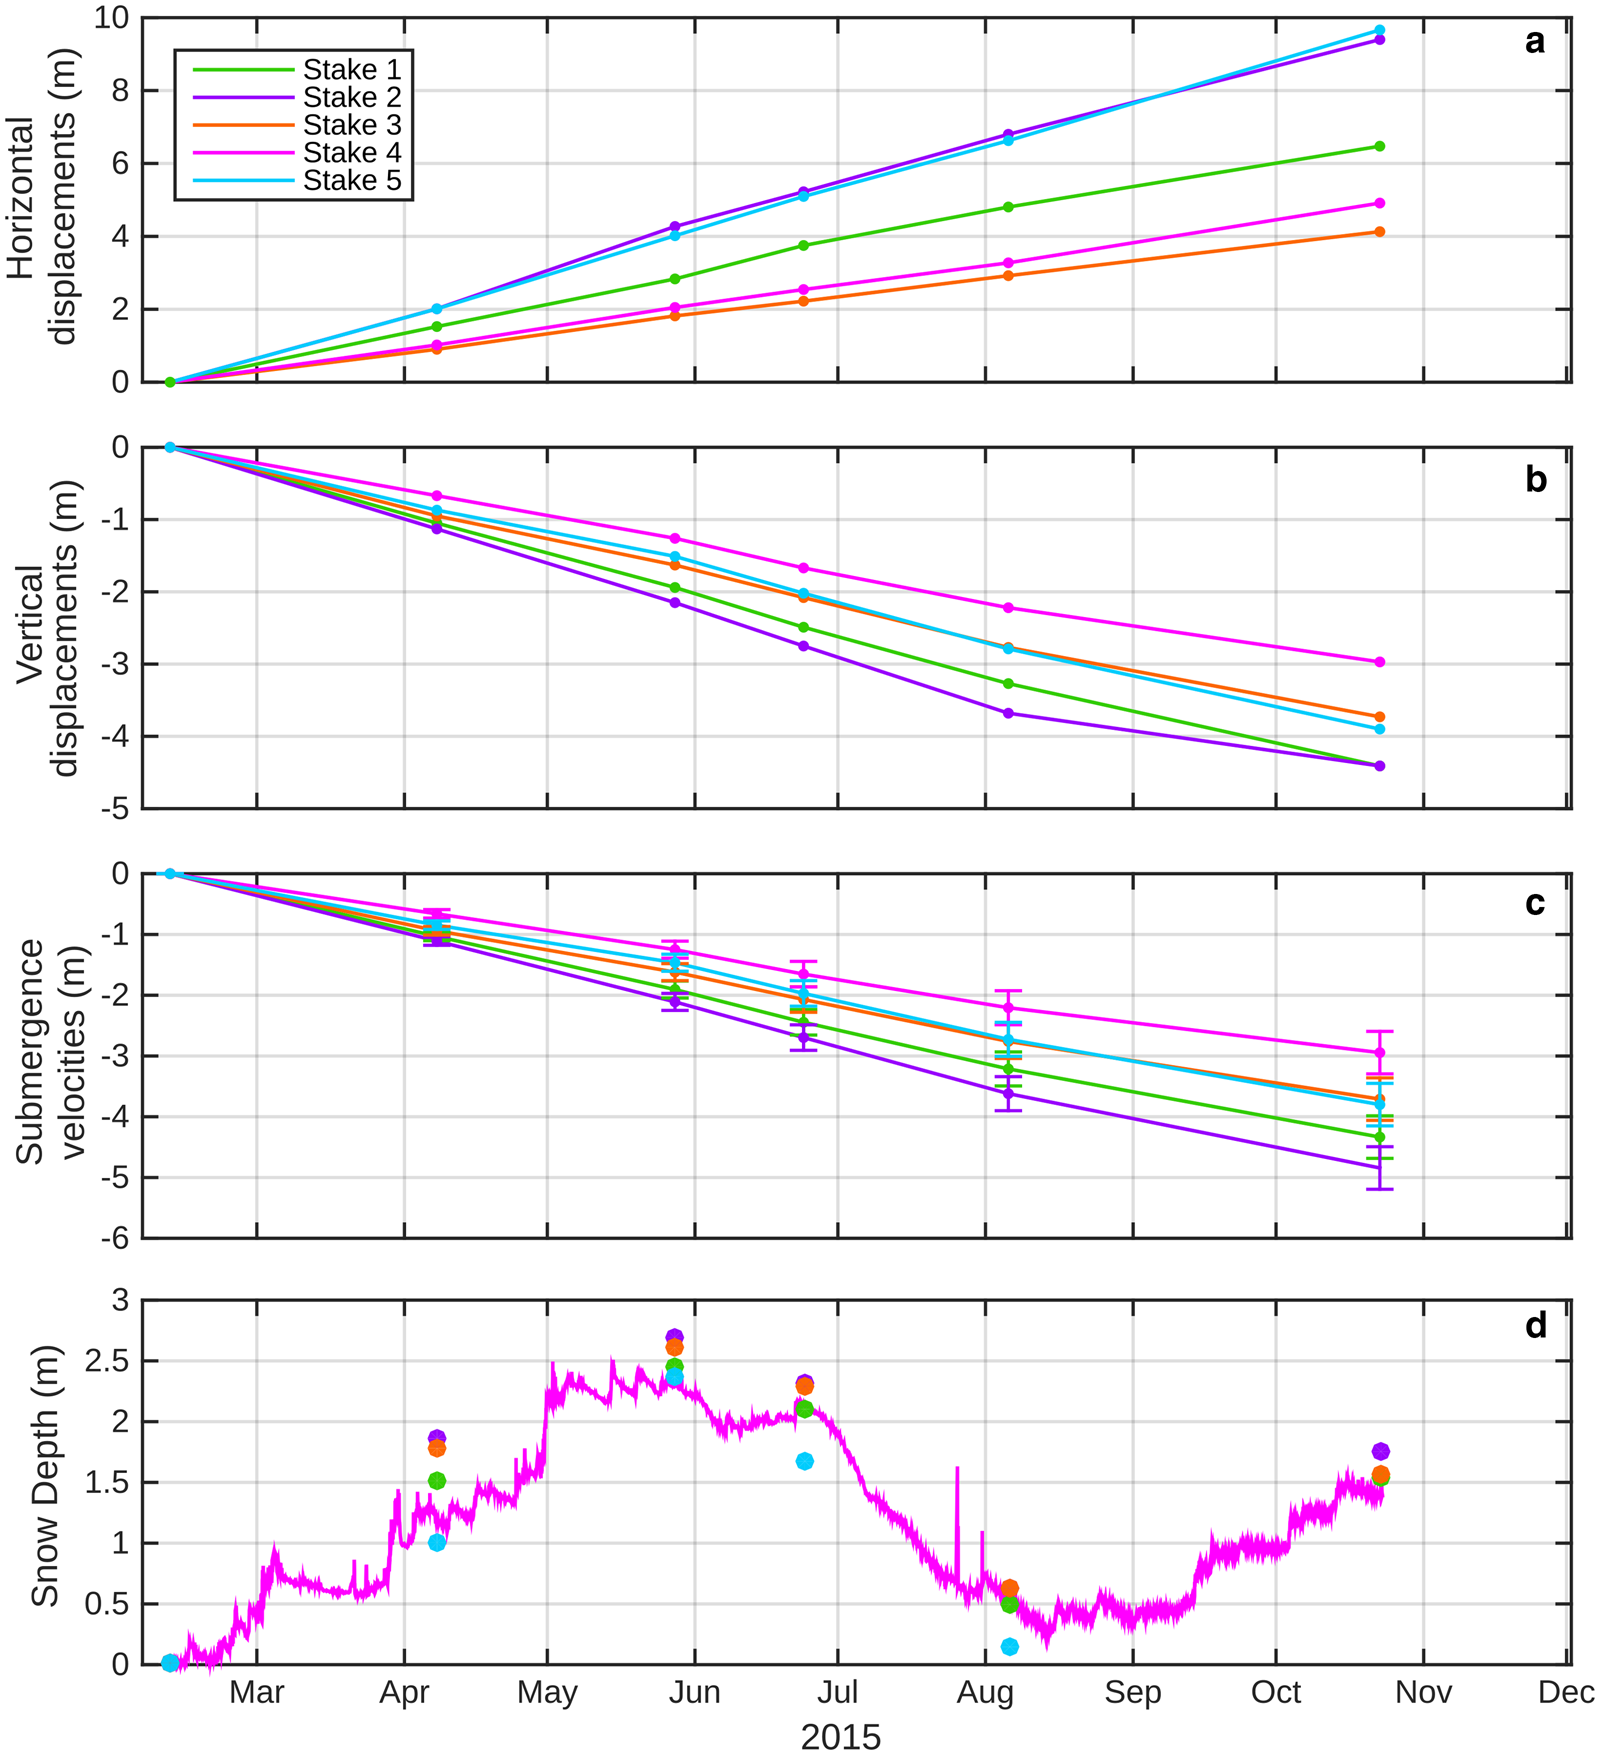
Figure 3a shows the horizontal displacements of the five stakes over the period 11 February to 23 October 2015. The almost linear evolution of the horizontal displacements indicates constant velocities throughout the measurement period. Surface velocities measured at the five stakes are 9.3, 13.5, 5.9, 7.1 and 13.9 ± 0.2 m a−1 for stakes 1–5, respectively. The differences in horizontal displacement from site to site indicate high spatial variability. For instance, the difference between stake 3 and 5, <400 m apart, is 5.6 m (for the period between 11 February and 23 October), corresponding to 8 m a−1. Despite the low horizontal surface velocities (<14 m a−1), the fastest velocities are observed at the steepest locations (i.e., at stake 5 with a slope of ~3°).
(a) Horizontal displacements and (b) vertical displacements, and (c) submergence velocities, measured at each stake over the period 11 February 2015–23 October 2015. (d) The pink line is the snow depth measured at the automatic weather station (i.e., Stake 4) and the dots represent the snow depth measured at each stake.
4.2 Submergence velocities
4.2.1. Quantification using stakes
Vertical displacements measured at each stake for the period between 11 February and 23 October 2015 and vertical displacements corrected for slope are reported in Figures 3b, c. Similar to the horizontal displacements, results show an almost linear temporal evolution at each stake, indicating constant submergence velocities throughout the measurement period. The temporal changes are lower than the measurement uncertainty and do not reveal significant seasonal changes. The submergence velocity can be extrapolated over the total study period (31 October 2014–23 October 2015).
Figure 3b also indicates a strong spatial variability of the vertical displacements. The largest difference is observed between stakes 2 and 4, with a difference of 2.7 m a−1, which is a factor of 1.6 between these two stakes. Because of the high spatial variability, a dense and distributed measurement network over the entire study area would be required to establish the most accurate submergence-velocity map possible, which could be used to correct the LiDAR DEMs differences from the submergence velocity. As stakes cover only a small part of the scanning area (Fig. 1), the submergence measurements at the stakes are supplemented by the measurements from the 15 core drilling sites.
4.2.2 Using drilling cores
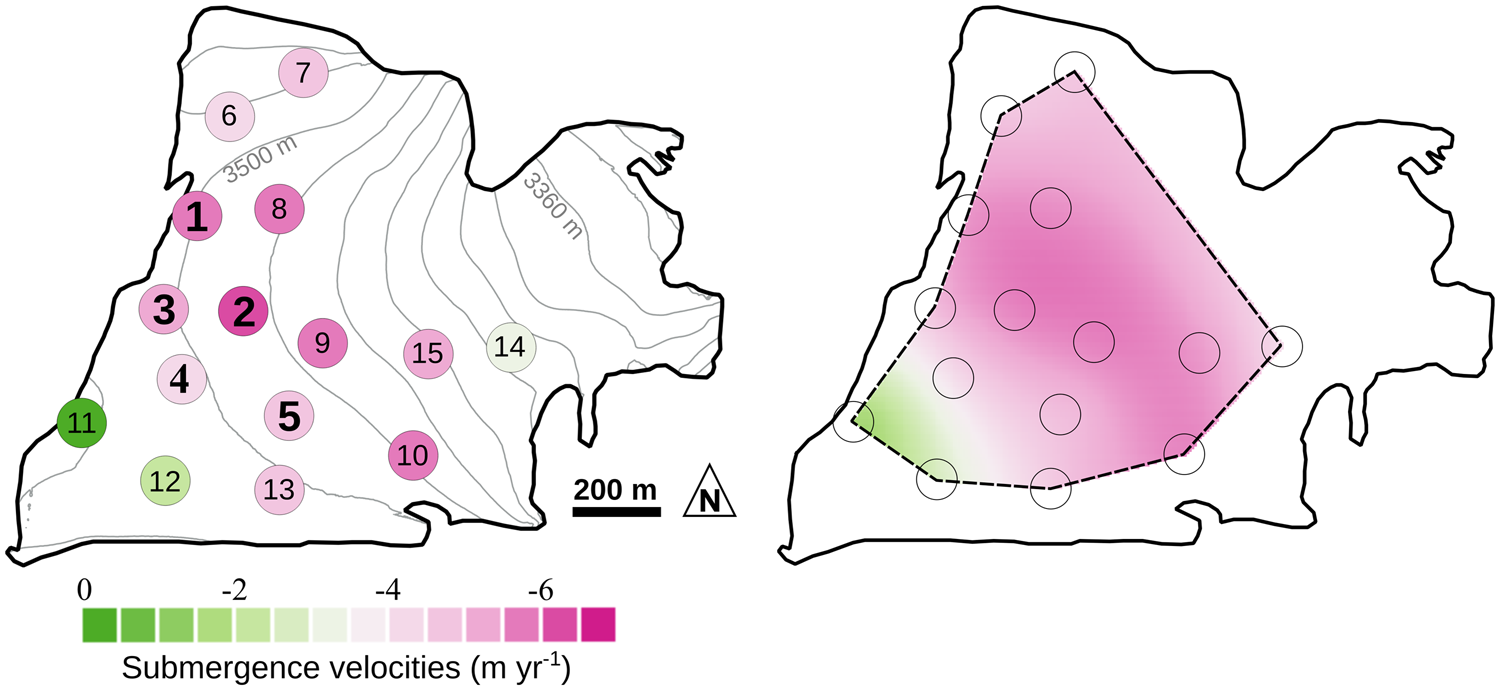
Figure 4 represents the submergence velocities computed using method 1 based on an Eulerian approach (w sub(M1)) and shows strong spatial variability (ranging from 2.1 to 5.9 m a−1). The average distance between two measurements is ~250 m, for an average difference of submergence velocity of 0.68 m a−1. This difference can be larger than 1 m a−1 for two measurement sites 300 m apart (e.g., cores #4 and #12 in Fig. 4).
(Left): Submergence velocities at each drilling site computed using method 1 (method detailed in Section 3.3.1). Cores drilled close to the stakes are indicated in bold by the corresponding stake numbers. (Right): Interpolation of the submergence velocities with a Kriging method.
4.2.3 Comparison of results of the two methods
The correlation between the submergence velocities obtained with the two methods (w sub(M1) and w sub(M2) described in Section 3.3) is significant (r 2 = 0.93) with a confidence level of 99% according to the Student's t-test. As w sub(M1) is computed using measurements over the period October 2014–May 2015 and w sub(M2) over the total period February–October 2015, the values were extrapolated over 1 year to allow comparison. Differences range between 0.06 m a−1 (stake #1) and 0.31 m a−1 (stake #4), without systematic bias, and the RMSE equals 0.23 m a−1, which is lower than the measurement uncertainty.
In addition, the spatial variability of the submergence velocities agrees well for the two approaches even if only five point comparisons are available. For instance, whatever the method used, the largest difference between the quantified submergence velocities is observed for stakes #2 and #4; this spatial difference equals 2.3 and 2.7 m a−1 for w sub(M1) and w sub(M2), respectively.
4.2.4 Submergence-velocity map and uncertainty
Because of (i) the good agreement between the two methods used to quantify the submergence velocities, (ii) the linear temporal evolution of the submergence velocities, and (iii) the need for an accurate representation of the spatial distribution of the submergence velocities, the submergence velocities were interpolated using a Kriging method. Interpolation uncertainty is evaluated using a leave-one-out cross-validation method, i.e., performing repeated interpolations based on 14 of the 15 points, keeping one point for uncertainty estimation. When the point used for the interpolation uncertainty estimate is located within the area defined by the measurement network, the average difference between the measured and interpolated value is 0.13 m a−1 with a maximum of 0.23 m a−1. On the other hand, when the point is located on the edge of the study area, the difference can reach values of more than 1 m a−1. According to these results, the surface mass-balance maps (Section 4.3) are restricted to the area defined within the measurement network. The uncertainty related to the interpolation method on submergence velocities is assumed to be equal to ±0.13 m a−1.
4.3 Surface mass-balance maps
Figure 5 shows the surface mass-balance maps (SMBLiDAR) since 31 October 2014. These results were obtained using the difference between the successive DEMs acquired by the LiDAR measurements (described in Section 3.1), while also correcting the DEM difference for the glacier dynamics using the submergence-velocity map (described in Section 4.1.4). To validate the method and evaluate the uncertainties, the SMBLiDAR maps are compared with the 25 local in situ surface mass-balance measurements performed at each stake (SMBm, indicated by the circles in Fig. 5). Results indicate a very good agreement (r 2 = 0.92, p < 0.05, RMSE = 0.27 m) with a maximum difference of 0.49 m.
(a) Wind rose from the half-hourly mean measurements at the weather station over the period February – October 2015. (b) to (h) Surface mass-balance maps (SMBLiDAR) for each period, Pi, with i ɛ [1; 7], i.e., since October 2014. Colored circles indicate winter surface mass balances measured at the same date with the drilling method (SMBm). Numbers indicated close to the circle correspond to the differences in meters between SMBm and SMBLiDAR, positive differences meaning SMBm > SMBLiDAR.
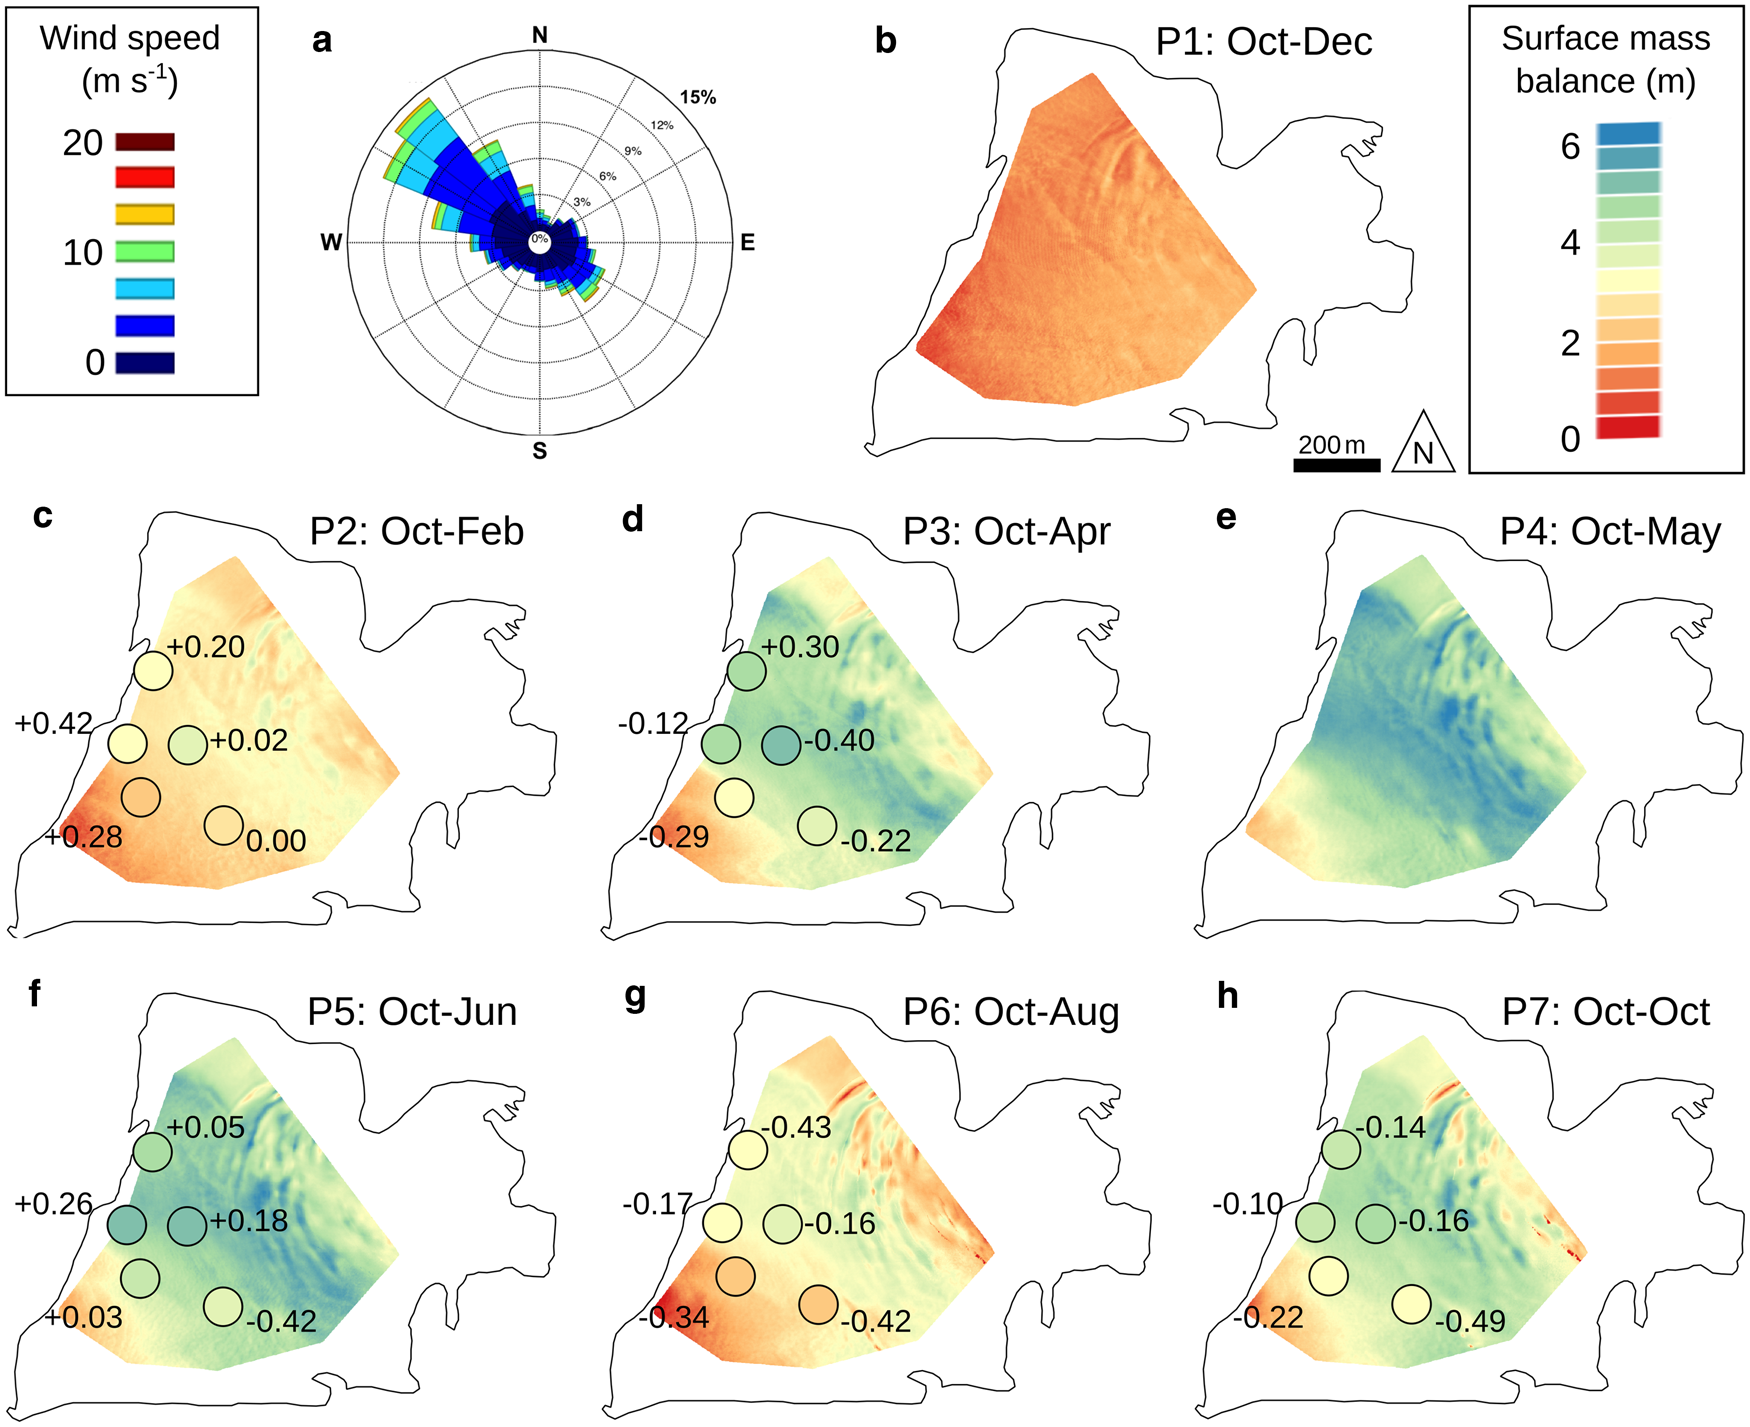
Note that the measurements performed in May are not used in this comparison (Fig. 5e) given that they have been used to quantify the submergence velocity map. In addition, the absence of surface mass-balance measurements using the drilling method in December prevents validation over the period October 2014–December 2014 (Fig. 5b).
The uncertainty in the SMBLiDAR is estimated by computing the quadratic sum of the uncertainty due to LiDAR measurements (±0.20 m) related to the DEM acquisitions, the uncertainty related to the calculation of the submergence velocities (±0.50 m a−1) and the uncertainty linked to the interpolation of the submergence velocities (±0.13 m a−1). This uncertainty ranges from ±0.36 m (for the period October to February) to ±0.55 m (for the entire period: October 2014 to October 2015).
Results presented in Figure 5 show a significant spatial variability of the surface mass balance. Indeed, the std dev. of the surface mass-balance maps for each period are 0.28, 0.52, 0.92, 0.79, 0.78, 0.73 and 0.78 m for P1 to P7, respectively.
5. Discussion
5.1 Submergence velocities and surface mass balance
At steady state, the surface mass balance can be directly estimated from the submergence velocity (Eqn. 1; Cuffey and Paterson, Reference Cuffey and Paterson2010). The annual surface mass balance measured at the five stakes in October 2015 was compared to the submergence velocities. Note that the density profile measured by drilling in October 2015 was used to convert the annual surface mass balance and submergence velocities into water equivalent (w.e.). As the density was measured at only one site, we assume a homogeneous density over the whole area. Despite this questionable assumption on the density, the comparison between the submergence velocities and the annual surface mass balance (Fig. 6) indicates an excellent correlation. The bias of 1.23 m w.e. a−1 indicates a non-steady state in this part of the glacier. It confirms the surface elevation lowering shown from the DEMs difference (Fig. S3 in the Supplementary material).
Correlation between the annual surface mass balance (SMB) and the submergence velocity. Error bars represent measurement uncertainties.
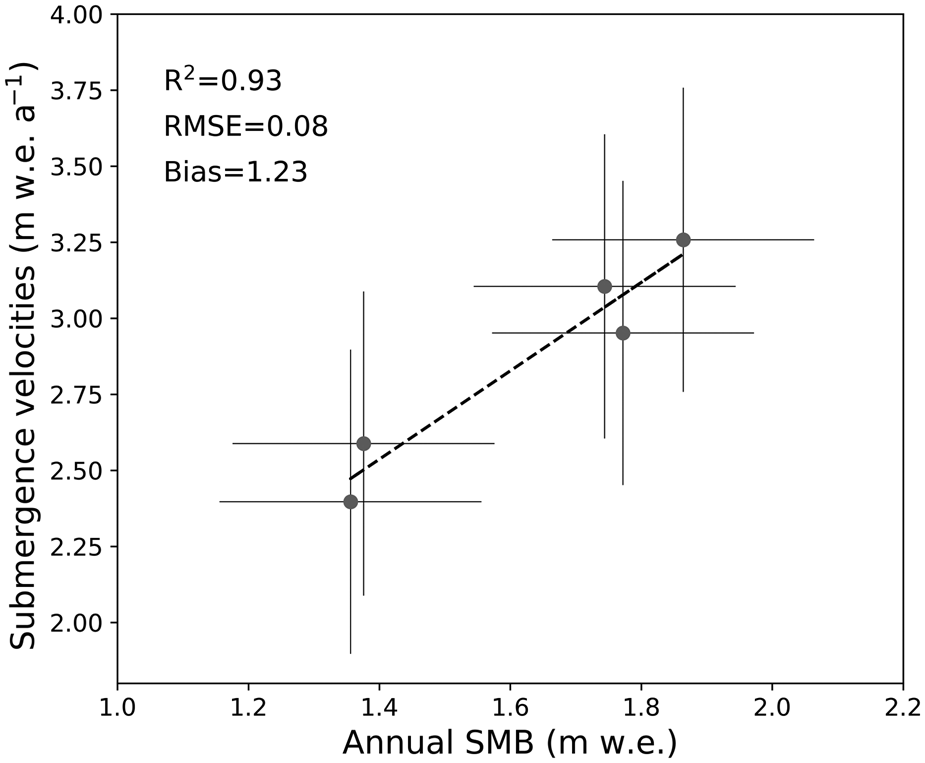
In addition, our comparison shows a very good agreement between the spatial variability of the submergence velocity and the surface mass balance with an RMSE of 0.08 m w.e. These differences are within the uncertainties. Note that the submergence velocities appear to offer a good way of assessing the long-term average surface mass balance (Vincent and others, Reference Vincent2007b). From our comparison, we can conclude that the annual mass balances correlate very well with submergence velocities.
5.2 Spatio-temporal variability of the surface mass balance
Our results clearly show a strong spatio-temporal variability of the surface mass-balance distribution, mainly during the winter period (Fig. 5). The relationships with topographical parameters have been reported in some studies to be significant (e.g., Sold and others, Reference Sold, Huss, Eichler, Schwikowski and Hoelzle2015). In our case, wind effects are expected to be the main driver for the spatial variability because (i) the elevation range of the study area is limited (i.e., <250 m, with a std dev. equal to 25 m) and therefore no precipitation gradient is expected and (ii) slopes are low (i.e., 2° on the average and always <11°) meaning that avalanches are not observed at that site. This assumption is reinforced by the finding of a previous study performed by Réveillet and others (Reference Réveillet, Vincent, Six and Rabatel2017) over the accumulation zone of the Mer de Glace. Based on the accumulation measurements conducted each year with the glaciological method over the period 1995–2014, they failed to find significant relationships between winter surface mass-balance spatial variability and the classical topographic variables found in the literature (i.e., elevation, curvature, distance to steep slope and ridge and topographic position index). Nevertheless, this study was performed using only a few stakes (seven in the accumulation part of the glacier and only two overlapping with the area of the current study) and one of the conclusions was the need to quantify the spatio-temporal variability at a higher resolution to be able to better understand this variability and to relate it to indexes considering wind effects.
The significant impact of wind effect on the snow distribution has been reported in several studies over mountain regions and glaciers using the Sx index (e.g., Winstral and others, Reference Winstral and Marks2002, Erickson and others, Reference Erickson, Williams and Winstral2005; McGrath and others, Reference McGrath2015; Molotch and others, Reference Molotch, Colee, Bales and Dozier2005; Grunewald and others, Reference Grünewald2013, Revuelto and others, Reference Revuelto, López-Moreno, Azorin-Molina and Vicente-Serrano2014). Some studies indicated that this variable was the main contributor to spatial variability, sometimes even more than elevation (e.g., Grünewald and others, Reference Grünewald2013). Therefore, it has been advised to take this index into account in model studies (Grünewald and others, Reference Grünewald2013). In our case, the surface mass-balance maps presented in this study (Fig. 5) were compared to the Sx index computed for each gridcell for each period and sub-period (see Supplementary material for the complete description). Despite its importance in explaining the snow-accumulation distribution as reported by Winstral and Marks (Reference Winstral and Marks2014) and Revuelto and others (Reference Revuelto, López-Moreno, Azorin-Molina and Vicente-Serrano2014), our results indicate a highly variable correlation from one period to another depending on specific wind conditions during and after the snowfalls. In addition, the best correlation is obtained for wind directions that often do not match the main measured wind direction. On the other hand, note that the highest correlations are found at the beginning of the accumulation season (S2 in the Supplementary material) and can be related to snow layers with a lower density (e.g., 0.2 measured for the first 50 cm of the snowpack in February), thus more erodible and transportable by wind; compared with the end of the season when higher temperature and snow depth can lead to a denser snow pack (e.g., 0.4 measured for the first 50 cm in May) that is therefore less subject to erosion and transportation.
Note that our dataset might not be fully suited to the use of the Sx index. Indeed, our maps are quantified at roughly a monthly scale and therefore integrate a large variety of snowfall events (with different amounts, influenced by different wind directions during and after each event). For instance, observations from the AWS show several changes of wind direction over a short time period (e.g., the event in March had a WNW direction during the snowfall and changed to S just after the snowfall) associated with erosion processes (Fig. 3d and Fig. S1 in the Supplementary material). Therefore, in our context, it is difficult to draw conclusions on the relationship between the spatial variability of surface mass balance over a period of about a month and the Sx index. We therefore suggest that this index should be used at the snowfall event scale.
5.3 Limitations of the study and further work
Despite the 2 km2 scanned area, our study covers only a limited portion of the accumulation area of the Mer de Glace and represents <10% of the total area of the glacier (28 km2). This study merits extension to a larger scale. However, given the amount of fieldwork required in this study, extension to a wider spatial scale would be extremely difficult. Additional measurements from other techniques such as the acquisition of DEM from airborne LiDAR, high-resolution remote sensing (e.g., Pléiades or drone) or GPR measurements (even if it is limited to accessible areas) would be required. In such a context, combined approaches would enable uncertainties to be quantified as has been done in other studies based on LiDAR measurements (e.g., Carturan and others, Reference Carturan2013; Sold and others, Reference Sold2013; Piermattei and others, Reference Piermattei, Carturan and Guarnieri2015, Reference Piermattei2016; Fischer and others, Reference Fischer, Huss, Kummert and Hoelzle2016).
Nevertheless, whatever the chosen method, it is necessary to properly consider the submergence velocities. The strong spatial variability of the submergence velocity confirms the need for a dense measurement network to accurately correct the DEM differences for glacier dynamics and obtain the surface mass-balance map at the glacier surface. For further studies, we recommend prioritizing their measurement over a large area. This could be done, for instance, using GPR measurements that can cover a larger area with a higher spatial resolution (e.g., Sold and others, Reference Sold2013; Schöber and others, Reference Schöber2014). Note that the geodetic mass-balance method does not require submergence/emergence velocity corrections given that the DEM difference provides the mass change of the entire glacier.
Finally, an accurate quantification of the submergence velocities provides valuable and useful information to calibrate or validate physical ice-flow models, which is essential to simulate future glacier evolution.
6. Conclusion
The main aim of this study was to evaluate the spatial distribution of surface mass balance in the accumulation zone of the Mer de Glace over the 2014–2015 hydrological year using monthly terrestrial LiDAR acquisitions. For this, the difference between DEMs obtained by LiDAR scans needs to be corrected to account for the submergence velocities. The in situ measured submergence velocities indicate a linear temporal evolution of both vertical and horizontal displacements, without significant seasonal changes over the study period (i.e., from February to October 2015). On the other hand, these measurements show a significant spatial variability (with a mean of 4.5 m a−1, a std dev. of 1.5 m a−1 and a maximum difference reaching 5.9 m a−1), demonstrating the importance of a dense network of submergence-velocity measurements to reduce the uncertainties when correcting the DEM differences to compute the surface mass balance.
Our results also indicate a high spatio-temporal variability of the surface mass-balance distribution even if at first glance the topography of the study area is relatively homogeneous. In this area, located close to a pass, wind seems to be one of the main causes of the spatial variability at decametric-to-hectometric scales. Nevertheless, correlations between the Sx index and surface mass balance over the winter period are poor and the highest correlations are not found with the main measured wind direction. This points out the limitation in using this index for long time periods, rather than at the event scale, given that the snow spatial distribution, for instance on a monthly scale, can be related to distinct wind directions.
For further studies, given the significant spatial variability of the submergence velocities, we recommend prioritizing their measurement over a large area. This could be done, for instance, using radar measurements that can cover a wider area with a higher spatial resolution.
Supplementary material
The supplementary material for this article can be found at https://doi.org/10.1017/jog.2020.92
Acknowledgments
This study was performed within the context of the French Service National d'Observation GLACIOCLIM (https://glacioclim.osug.fr). We thank all those who participated in the field campaigns. The support of LabEx OSUG@2020 (Investissements d'avenir – ANR10 LABX56) is deeply acknowledged for the purchase of the LiDAR. M.R. is supported by the ANR program: ANR-16-CE01-0006 EBONI. We are grateful to H. Harder for reviewing the English. Finally, we acknowledge the editor and the two anonymous reviewers for their detailed comments and helpful suggestions on previous versions of the manuscript.


 Open access

