


1. Introduction
During the last decades, glaciers and ice caps worldwide have been melting at increasing rates as a response to a globally warming (e.g. Vaughan and others, Reference Vaughan, Stocker, Qin, Plattner, Tignor, Allen, Boschung, Nauels, Xia, Bex and Midgley2013, Huss and Hock, Reference Huss and Hock2018). The Arctic and particularly the Barents Sea region, which includes the archipelagoes of Svalbard, Franz Josef Land and Novaya Zemlya, has experienced pronounced warming (e.g. Screen and Simmonds, Reference Screen and Simmonds2010, Lind and others, Reference Lind, Ingvaldsen and Furevik2018, Carr and others, Reference Carr, Murphy, Nienow, Jakob and Gourmelen2023). This warming is partly driven by a rapid sea ice decline, which leads to an enhanced heat transfer between the ocean and the atmosphere (e.g. Barton and others, Reference Barton, Lenn and Lique2018, Lind and others, Reference Lind, Ingvaldsen and Furevik2018).
While there are several estimates of the climatic mass balance of Svalbard, both from in situ observations (e.g. Hagen and others, Reference Hagen, Kohler, Melvold and Winther2003, Schuler and others, Reference Schuler2020), satellite observations
(e.g. Moholdt and others, Reference Moholdt, Nuth, Hagen and Kohler2010, Nuth and others, Reference Nuth, Moholdt, Kohler, Hagen and Kääb2010, Mémin and others, Reference Mémin, Rogister, Hinderer, Omang and Luck2011, Wouters and others, Reference Wouters, Gardner and Moholdt2019) and modelling studies (e.g. Østby and others, Reference Østby, Vikhamar Schuler, Ove Hagen, Hock, Kohler and Reijmer2017, Van Pelt and others, Reference Van Pelt2019, Schmidt and others, Reference Schmidt, Schuler, Thomas and Westermann2023), studies on the surface mass loss of Novaya Zemlya and Franz Josef Land are limited. In situ observation of mass balance and ablation were conducted sporadically from 1933 to 1969 on the Shokal’ski Glacier in Novaya Zemlya (Zeeberg and Forman, Reference Zeeberg and Forman2001), but to our knowledge there are no recent in situ estimates of the mass balance. There were reportedly also mass balance observation on Franz Josef Land until the early 1960s, although detailed measurements were hard to obtain (Dowdeswell and others, Reference Dowdeswell1997).
There are, however, several estimates of the mass balance of both Novaya Zemlya and Franz Josef Land using geodetic methods, gravimetry or both (e.g.
Jacob and others, Reference Jacob, Wahr, Pfeffer and Swenson2012, Moholdt and others, Reference Moholdt, Wouters and Gardner2012, Cirací and others, Reference Ciracì, Velicogna and Swenson2020, Hugonnet and others, Reference Hugonnet2021, Tepes and others, Reference Tepes, Nienow and Gourmelen2021, Mał ecki, Reference Małecki2022, Sommer and others, Reference Sommer, Seehaus, Glazovsky and Braun2022). These estimates provide the total mass balance, including both the mass loss from glacier melting and frontal ablation. They mostly indicate a general mass loss from 2000 to 2019, with about −0.32 ± 0.14 m w.e. a−1 mass change in Novaya Zemlya and about  $-0.24 \pm\ 0.16\ \mathrm{m\ w.e.\ a}^{-1}$ mass change in Franz Josef Land. The estimated average frontal ablation rate from 2000 to 2020 has been estimated to be −0.15 ± 0.05 m w.e. a−1 for Novaya Zemlya and −0.71 ± 0.33 m w.e. a−1 for Franz Josef Land (Kochtitzky and others, Reference Kochtitzky2022).
Modelling of the climatic mass balance, i.e. the sum of surface mass balance and internal mass change, can be an important tool to expand the time series beyond the observational period and to provide a detailed look at the mass balance components (the climatic mass balance, flux divergence and frontal ablation) and climatic drivers. Information on glacial meltwater runoff can also be gathered from these models, which constitutes a significant source of the freshwater discharged into glacial fjords and coastal seas (Bamber and others, Reference Bamber, Westaway, Marzeion and Wouters2018). This freshwater discharge has important implication for a wide range of physical, chemical and biological processes, including fjord circulation (Carroll and others, Reference Carroll, Sutherland, Shroyer, Nash, Catania and Stearns2017), light availability (Hop and others, Reference Hop2002, Arimitsu and others, Reference Arimitsu, Piatt, Madison, Conaway and Hillgruber2012), water biogeochemisty (Bhatia and others, Reference Bhatia, Kujawinski, Das, Breier, Henderson and Charette2013, Wadham and others, Reference Wadham2013) and marine primary production (Juul-Pedersen and others, Reference Juul-Pedersen, Arendt, Mortensen, Blicher, Søgaard and Rysgaard2015, Hopwood and others, Reference Hopwood2020).
The performance of these models needs to be assessed against observations, which are limited in the Russian Arctic. Some global models have provided estimates of the mass balance evolution using temperature as a proxy (e.g. Radić and Hock, Reference Radić and Hock2011, Marzeion and others, Reference Marzeion, Jarosch and Hofer2012), but these are calibrated using only few observations in the Russian Arctic and may therefore have large uncertainties in this region. Only one previous study of all glaciers in the Arctic does provide estimates of the climatic mass balance and runoff using the regional climate model Modèle Atmosphérique Régional (MAR) (Maure and others, Reference Maure, Kittel, Lambin, Delhasse and Fettweis2023), using ERA5 as model forcing and a horizontal model resolution of about 6 × 6 km.
Here, we present a high-resolution detailed estimate of the climatic mass balance and runoff from glaciers in Novaya Zemlya and Franz Josef Land at a high horizontal resolution (2.5 km × 2.5 km). We use the land surface model CryoGrid for the simulations, a full energy balance model coupled to a subsurface snow/firn scheme, with atmospheric forcings from the Copernicus Arctic Regional ReAnalysis (CARRA). The CryoGrid model is run for the same resolution as CARRA, eliminating the need for any additional downscaling. This model configuration has been well-validated for glaciers in Svalbard (Schmidt and others, Reference Schmidt, Schuler, Thomas and Westermann2023), and since glacier mass balance changes in the Russian Arctic has been found to closely mimic those of Svalbard (Lubinski and others, Reference Lubinski, Forman and Miller1999), we expect reliable estimates for Novaya Zemlya and Franz Josef Land. Here, the CARRA product is used from January 1991 to December 2022. For further validation, we evaluate the meteorological forcing against the few automatic weather stations (AWSs) available in the area and compare our mass balance results to those found using geodetic methods (Hugonnet and others, Reference Hugonnet2021). Finally, the results of the climatic mass balance are compared to the other studies (e.g. Hugonnet and others, Reference Hugonnet2021, Kochtitzky and others, Reference Kochtitzky2022, Maure and others, Reference Maure, Kittel, Lambin, Delhasse and Fettweis2023).
2. Study area
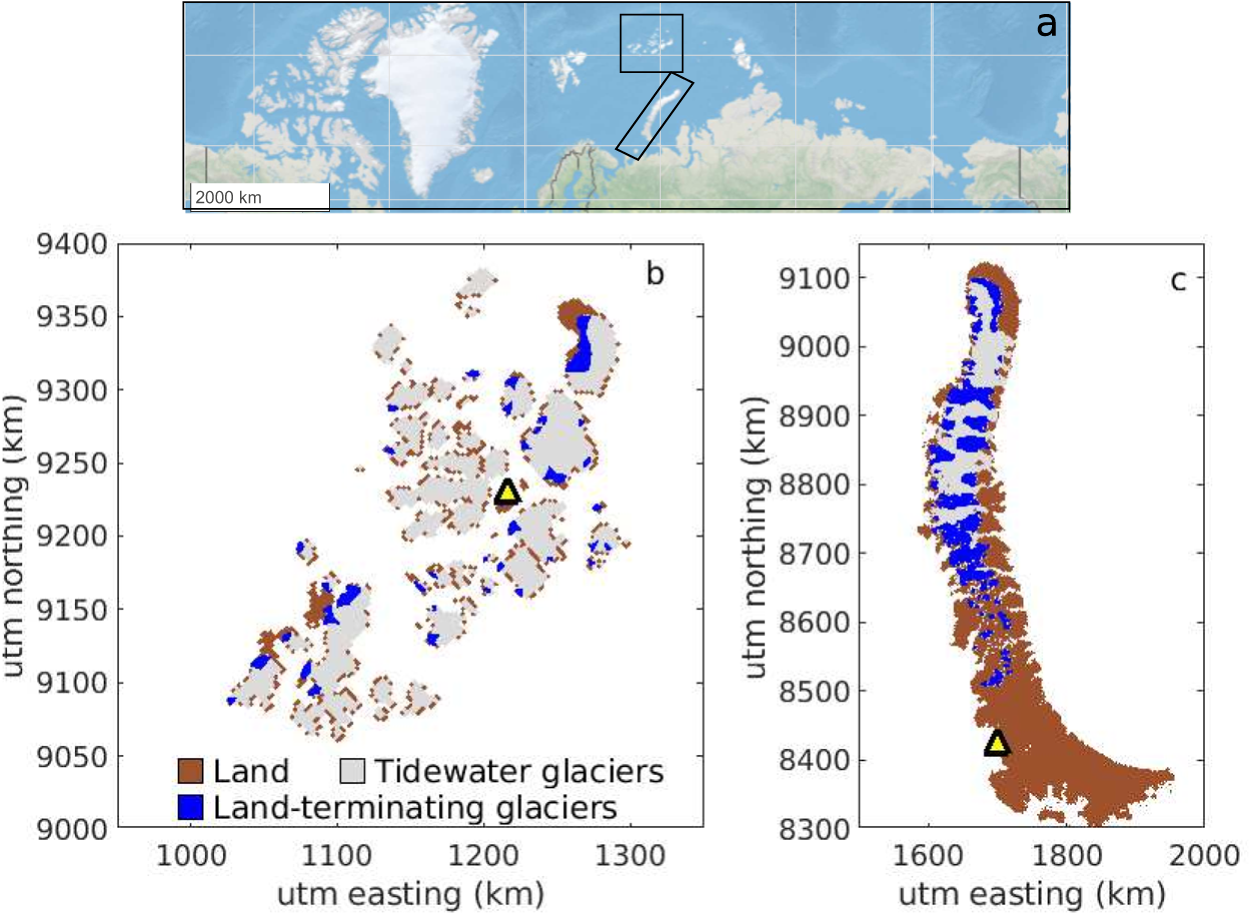
The archipelagos of Franz Josef Land and Novaya Zemlya are situated in the north east and south east Barents Sea, respectively (Fig. 1a). The southern Barents Sea has a relatively mild and wet climate due to the strong influence of warm Atlantic waters, and the waters southwest of Novaya Zemlya are thus often ice-free, even in winter (Fig. 2a). The eastern coast of Novaya Zemlya borders to the Kara Sea, which, due to cold Arctic water and sea-ice coverage during winter and spring, experiences lower atmospheric temperatures than the southern Barents Sea region (Zeeberg and Forman, Reference Zeeberg and Forman2001). The Kara Sea coast also has less precipitation than the Barents Sea coast.
(a) The location of Franz Josef Land and Novaya Zemlya. (b and c) The position of land-terminating glaciers used for comparison with geodetic estimates (blue areas) and of the two automatic weather stations (yellow triangles) for (b) Franz Josef Land and (c) Novaya Zemlya.
(a–b) Average sea ice fraction in CARRA from 1991 to 2022 for (a) March and (b) September. Stippled areas have a zero sea ice concentration. The white line is the 15% threshold line. (c–d) Decadal trend in sea ice fraction from 1991 to 2022 in (c) March and (d) September. Stippled areas have no significant trend at a 95% confidence interval.

The Atlantic influence is reduced in the northern Barents Sea, making Franz Josef Land the coldest and driest area in the region. The northern Barents Sea has previously been called the Arctic warming ‘hotspot’ (Lind and others, Reference Lind, Ingvaldsen and Furevik2018), due to the strongly amplified temperature increase in the region. This is linked to a decreasing trend in sea ice concentration in this area (Fig. 2c,d). Several processes and feedbacks contribute to the variations in sea ice around the Barents Sea. One important factor is the inflow of warm Atlantic water, which in combination with storm-induced ocean mixing has been shown to also affect sea ice variations (Duarte and others, Reference Duarte, Sundfjord, Meyer, Hudson, Spreen and Smedsrud2020). Poleward atmospheric energy transport has also been shown to be an important factor (e.g. Olonscheck and others, Reference Olonscheck, Mauritsen and Notz2019, Hofsteenge and others, Reference Hofsteenge, Graversen, Rydsaa and Rey2022), with moisture transport in particular having a large impact on sea ice extent by increasing the downward longwave radiation and sensible heat flux (e.g. Doyle and others, Reference Doyle2011, Olonscheck and others, Reference Olonscheck, Mauritsen and Notz2019, Fearon and others, Reference Fearon, Doyle, Ryglicki, Finocchio and Sprenger2021, Haacker and others, Reference Haacker, Wouters, Fettweis, Glissenaar and Box2024). Atmospheric rivers and cyclones thus both contribute to sea ice variations, as both can cause extreme moisture and heat transport to the Arctic (e.g. Clancy and others, Reference Clancy, Bitz, Edward, McGraw and Cavallo2022, Parker and others, Reference Parker, Mooney, Webster and Boisvert2022, Li and others, Reference Li, Cannon, Mazloff, Subramanian, Wilson and Ralph2024). Future sea ice loss can potentially increase and prolong the intensity of cyclones, thus causing more extreme weather events (Parker and others, Reference Parker, Mooney, Webster and Boisvert2022).
Glacier cover is extensive for both Franz Josef Land (81% or 13 000 km2) and Novaya Zemlya (27% or 22 000 km2) (Fig. 1). The islands of Franz Josef Land are primarily covered with marine terminating ice caps, with only 4% of the ice area belonging to land-terminating glaciers. The elevations of the ice cap domes are generally 300–500 m a.s.l., but with a maximum ice elevation of 670 m a.s.l. (Barr and others, Reference Barr1995). Novaya Zemlya consist of two main islands, the southern Yuzhny Island (maximum elevation of 1340 m) and the northern Severny Island (maximum elevation of 1596 m) (Kotlyakov and others, Reference Kotlyakov, Glazovskii and Frolov2010). A large ice field, called the Northern Icefield, is situated on Severny island, which has outlet glaciers draining into valleys and fjords. The Northern Icefield has an average elevation of 800 m (Grosval’d and Kotlyakov, Reference Grosval’d and Kotlyakov1969) is more than 400 km long, with a mean width of 80 km (Rastner and others, Reference Rastner, Strozzi and Paul2017). In addition, small individual mountain glaciers are present on both main islands and make up 7% of the total ice area (Mał ecki, Reference Małecki2022).
3. Material and methods
3.1. CryoGrid community model
For simulations of the climatic mass balance and runoff, we use the CryoGrid community model (Schmidt and others, Reference Schmidt, Schuler, Thomas and Westermann2023, Westermann and others, Reference Westermann2023). CryoGrid is an open-source model developed for climate-driven simulations in the terrestrial cryosphere. It uses a full surface energy-balance model which can be coupled to different subsurface models of varying complexity. The model has a modular structure, with many different modules that can be combined to describe the evolution of subsurface temperature, water content and density for a wide range of surface and subsurface conditions. Information about the different functionalities and structures are described in detail by Westermann and others Reference Westermann(2023). Three classes are used to describe the stratigraphy of glaciers in the Russian Arctic: a glacier (ice) module, a firn module and a snow module.
The glacier module consists of 47 layers of pure-ice with a user-defined constant ice thickness. Each layer has a thickness between 0.1 and 1 m, totalling of 20 m of ice. We assume a constant ice albedo of 0.4 for both Franz Josef Land and Novaya Zemlya. When mass is removed from the model by runoff, evaporation or sublimation, mass is shifted up from an infinite ice reservoir below into the lowest model layer. This is done to prevent the glacier from disappearing during long spin-ups due to the lack of ice flow. The infinite reservoir is assumed to have the same temperature as the lowest model layer.
If snowfall occurs during the simulation, a snow module is added on top of the glacier ice. In case the snow stays on the glacier surface for more than 1 year, the snow layer is relabelled as firn. The snow and firn schemes have the same model physics, and the distinction is mostly used to determine internal accumulation. The snow and firn modules follow a slightly altered Crocus (Vionnet and others, Reference Vionnet2012) snow scheme as described by Westermann and others Reference Westermann(2023) and Schmidt and others Reference Schmidt, Schuler, Thomas and Westermann(2023). The mass balance model has a spectral albedo scheme which includes shortwave penetration and also simulates the metamorphism and densification of snow and firn. Water percolation is controlled by a formulation for the hydraulic conductivity.
The full CryoGrid set-up is described in detail by Schmidt and others Reference Schmidt, Schuler, Thomas and Westermann(2023), and we refer to this paper for further details on the model.
Glacier outlines from the Randolph Glacier Inventory v 6.0 (Pfeffer and others, Reference Pfeffer2014) were used to compute a fractional glacier mask for both areas. We do not take into account changes in glacier extent during the study period.
3.2. Model forcing
2-D fields of meteorological forcing were extracted from the CARRA dataset (Yang and others, Reference Yang2021), including 2 m air temperature, specific humidity, incoming long- and shortwave radiation, pressure and precipitation. The CARRA dataset covers the European Arctic at a 2.5 × 2.5 km resolution, currently spanning from September 1990 to september 2024. It was created using the numerical weather prediction model HARMONIE-AROME (Bengtsson and others, Reference Bengtsson2017), which was forced at the lateral boundaries by ERA5 reanalysis. Here we use the east domain, which contains Svalbard, Franz Josef Land, Novaya Zemlya and Northern Norway. CARRA simulations have previously been validated and used as forcing for mass balance simulations of Svalbard glaciers (Schmidt and others, Reference Schmidt, Schuler, Thomas and Westermann2023). Sea ice in CARRA is represented by a 1-D thermodynamic sea ice scheme (Batrak and others, Reference Batrak, Kourzeneva and Homleid2018). The representation of the sea ice cover in CARRA has been found to significantly improve the sea ice surface temperature compared to ERA5, particularly in the winter in the Barents Sea region (Batrak and others, Reference Batrak, Cheng and Kallio-Myers2024).
The CARRA dataset is also used for calculating significant climatic trends for both areas. Throughout this paper, the term significance indicates p < 0.05.
3.3. In situ observations
Directly measured meteorological data are very sparse in both regions, and no AWS observations are available from the glaciers of Franz Josef Land and Novaya Zemlya, but there are observations available from the archipelago. Air temperature, precipitation, relative humidity and wind speed data were obtained from two AWS for forcing evaluation: E.T. Krenkelja (WMO ID: 20046) on Franz Josef Land and Malye Karmakuly (WMO ID: 20744) on Novaya Zemlya. These stations started observations in 1957 and 1876, respectively, and observations are currently available until mid-2021. The data were obtained from the Hydrometeorological Information—World Data Centre Baseline Climatological Data Sets (http://aisori-m.meteo.ru) and were provided at daily or 3 hour resolution. For the CARRA comparison, we use daily values and only observations with a high-quality flag. For the E.T. Krekelja station on Franz Josef Land, around 18% of the time period has no valid data. The largest data gap is from August 2001 until November 2004. For Malye Karmakuly in Novaya Zemlya, only 1.8% of the period has no valid data. The location of the stations is shown in Fig. 1. It is important to note that the temperature and relative humidity from these AWSs are also assimilated into the CARRA product, and the correlation between CARRA and the observations may therefore be higher than for other regions on the archipelago.
3.4. Satellite observations
3.4.1. Geodetic mass balance
In the absence of in situ measurements of mass balance, we instead use estimates of the geodetic mass balance for model validation. The geodetic mass balance is determined by taking the difference between glacier elevations at different survey dates to find the volume change rate. Using a value for the bulk density (often around 850 kg m−1 (Huss, Reference Huss2013)), this volume change is then converted into mass balance. Since the geodetic mass balance includes frontal ablation from marine-terminating glaciers, we only compare our climatic mass balance results to the geodetic balance of land-terminating glaciers, although the climatic mass balance of all glaciers in the regions is calculated with the model. All glaciers classified as land-terminating in the Randolph Glacier Inventory (RGI) are marked with blue in Fig. 1. The land-terminating glaciers are spatially distributed across the study areas, which is good for model validation.
Several studies have provided estimates of the geodetic mass balance of glaciers in Franz Josef Land and Novaya Zemlya (e.g. Moholdt and others, Reference Moholdt, Wouters and Gardner2012, Tepes and others, Reference Tepes, Nienow and Gourmelen2021) but here we use the estimate by Hugonnet and others Reference Hugonnet(2021). This study used Advanced Spaceborne Thermal Emission and Reflection Radiometer (ASTER) imagery for determining the geodetic mass balance of all glaciers on Earth from 2000 to 2019. The results are available for all glaciers in the RGI at a temporal resolution of 1, 2, 4, 5, 10 and 20 years. In this study, we use the 5 year estimates for model evaluation.
3.4.2. Land surface temperature
In addition to the geodetic mass balance, we used observations of the land surface temperature (LST) from the Moderate Resolution Imaging Spectroradiometer (MODIS) on board the Terra and Aqua satellites to provide an estimate of the melt frequency. The LST is provided at a 1 km resolution in the MOD11A1 (Terra) and MYD11A1 (Aqua) products with a daily resolution. For this study, observations from 2002 to 2022 are used from the MODIS collection version 6. Tile h19v01 contains all glaciers on Novaya Zemlya, while Franz Josef Land is split between tile h18v01, h18v00, h19v01 and h19v00. We only use observations during the melt season, here assumed to be between 1 May and 1 October. To determine the amount of melt days, we calculate the maximum daytime LST from Terra and Aqua. MODIS LST has an uncertainty of at least ±1∘C, and we therefore use  $-1^\circ$C as the threshold between melting and non-melting conditions (Hall and others, Reference Hall, Cullather, DiGirolamo, Comiso, Medley and Nowicki2018). However, several studies have shown that MODIS has a larger cold bias in the Arctic (e.g.
Hall and others, Reference Hall, Box, Casey, Hook, Shuman and Steffen2008a, Westermann and others, Reference Westermann, Langer and Boike2011, Østby and others, Reference Østby, Schuler and Westermann2014), and this threshold may thus be too conservative. On average, between 28% and 47% of the investigated period has at least one daily cloud-free acquisition. To gap-fill any days that lack observations, we use a simple interpolation scheme. If a cloudy period is bookended by two melt days, we assume that the cloudy period also has melting conditions, as the LST usually is higher under cloud cover than under clear skies. A similar gap filling approach was used for Greenland by Hall and others Reference Hall, Williams, Luthcke and Digirolamo(2008b). If the cloudy period is bookended by non-melt conditions, we assume that no melt occurred during the observation gap. If, on the other hand, the start of the cloudy period is preceded by a melt day and followed by a non-melt day, we assume half of the period has melt condition and the other half non-melt conditions. The uncertainties on the melt day estimate are calculated by assuming that for the latter case, the cloudy days are either all melt days or all non-melt days. This uncertainty estimate is likely conservative, as there is also uncertainties on the LST product itself, even during clear-sky days.
$-1^\circ$C as the threshold between melting and non-melting conditions (Hall and others, Reference Hall, Cullather, DiGirolamo, Comiso, Medley and Nowicki2018). However, several studies have shown that MODIS has a larger cold bias in the Arctic (e.g.
Hall and others, Reference Hall, Box, Casey, Hook, Shuman and Steffen2008a, Westermann and others, Reference Westermann, Langer and Boike2011, Østby and others, Reference Østby, Schuler and Westermann2014), and this threshold may thus be too conservative. On average, between 28% and 47% of the investigated period has at least one daily cloud-free acquisition. To gap-fill any days that lack observations, we use a simple interpolation scheme. If a cloudy period is bookended by two melt days, we assume that the cloudy period also has melting conditions, as the LST usually is higher under cloud cover than under clear skies. A similar gap filling approach was used for Greenland by Hall and others Reference Hall, Williams, Luthcke and Digirolamo(2008b). If the cloudy period is bookended by non-melt conditions, we assume that no melt occurred during the observation gap. If, on the other hand, the start of the cloudy period is preceded by a melt day and followed by a non-melt day, we assume half of the period has melt condition and the other half non-melt conditions. The uncertainties on the melt day estimate are calculated by assuming that for the latter case, the cloudy days are either all melt days or all non-melt days. This uncertainty estimate is likely conservative, as there is also uncertainties on the LST product itself, even during clear-sky days.
4. Results
4.1. Evaluation
Figure 3 shows the comparison between the CARRA forcing and records of the two AWSs. The nearest point to the AWS on the CARRA grid is used for the comparison. The comparison with the 2 m temperature (Fig. 3a,e) shows that CARRA generally fits well with observations, with an average difference (model − observations) of 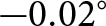 $-0.02^\circ$C for E.T. Krenkelja and
 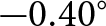 $-0.40^\circ$C for Malye Karmakuly. The root-mean-square error is approximately 1∘C at both locations. The relative humidity (Fig. 3b) is only measured at E.T. Krenkelja, with an average overestimation in CARRA of 0.76% and a root-mean-square error of 8.3%. The wind speed is generally simulated well (Fig. 3c,f), with a slight underestimation in CARRA of
  $\sim-$0.2 m s−1 and with root-mean-square errors of ∼5 m s−1 at both stations. The precipitation (Fig. 3d,g) is overestimated at both locations, by 20% at the E.T. Krenkelja station and 86% at the Malye Karmakuly station. Precipitation gauges can severely undercatch precipitation, particularly during high wind events and for solid precipitation (Goodison and others, Reference Goodison, Louie and Yang1998, Yang and others, Reference Yang, Kane, Zhang, Legates and Goodison2005), so some overestimation in the model results is to be expected. Still, the large difference for Malye Karmakuly could indicate an overestimation of the CARRA precipitation in Novaya Zemlya.
Comparison of meteorological variables from the CARRA reanalysis and observations from (a–d) E.T. Krenkelja in Franz Josef Land and (e–g) Malye Karmakuly in Novaya Zemlya. The meteorological variables used for the comparison are (a, e) 2 m temperature (2m T), (b) relative humidity (rh), (c, f) wind speed (ws) and (d, g) precipitation (precip). The colourscale refers to the density of points from low (blue) to high (yellow). The average difference (model − observation, Δ), root-mean-square error (RMSE) and unbiased RMSE (ubRMSE) are given on each subplot.

Figure 4 shows the average amount of melting days for all glacierized points, estimated using both CryoGrid and MODIS LST. The two estimates are generally close, with high correlation coefficients of 0.92 for Franz Josef Land and 0.88 for Novaya Zemlya. The CryoGrid estimate is generally within the uncertainty of the MODIS LST estimate. As previously mentioned, it is important to keep in mind that the uncertainties are most likely higher than reported here, due to the higher uncertainty of MODIS LST in the Arctic.
The amount of melt days estimated by the CryoGrid model and from MODIS land surface temperatures. (a–b) The best estimates of the average amount of melt days per year from MODIS LST for (a) Franz Josef Land and (b) Novaya Zemlya. (c–d) The average differences in melt days from the MODIS estimate and the CryoGrid model. Positive values mean an overestimation in the CryoGrid model. (e–f) Time series of the amount of melt days. The grey areas shows the estimated uncertainty on the MODIS melt days and the black line shows the best estimate.
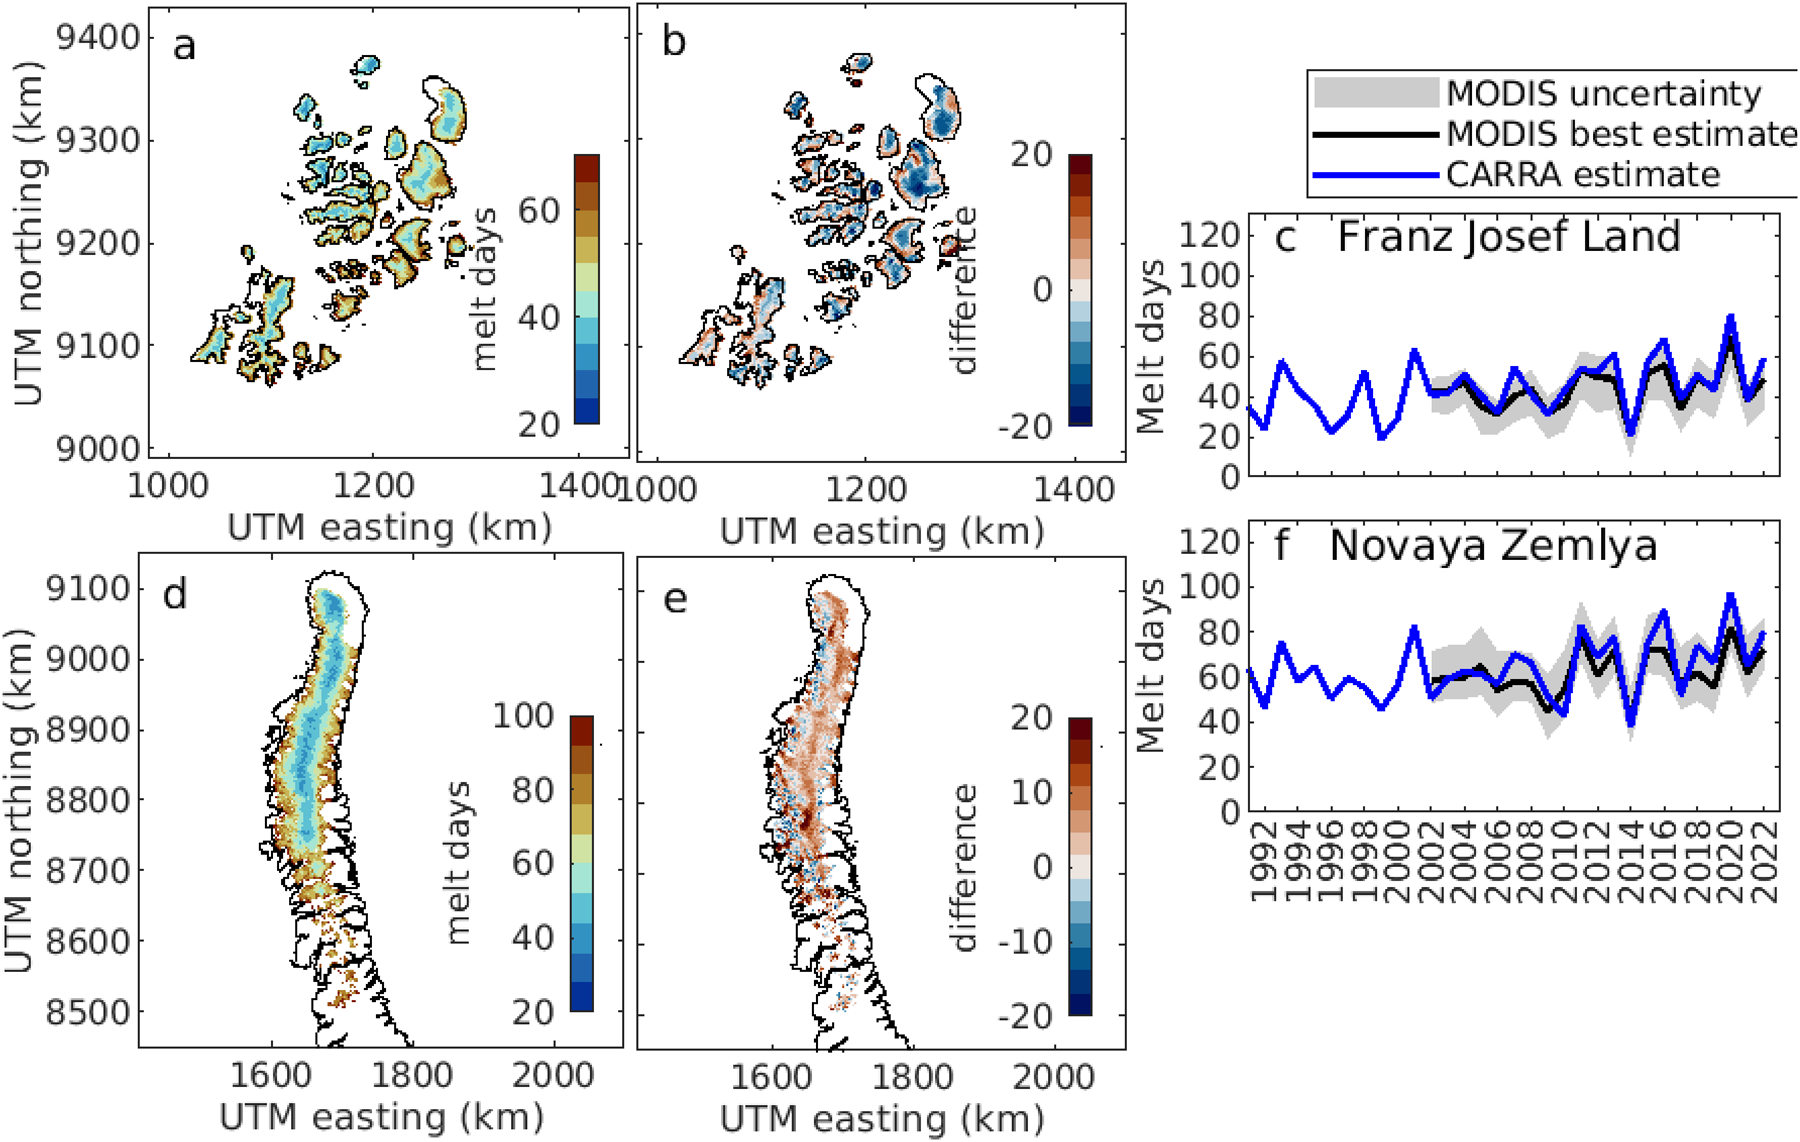
Figure 5a and b compare the simulated climatic mass balance and the geodetic mass balance by Hugonnet and others Reference Hugonnet(2021) for all glaciers from 2000 to 2020. Land terminating glaciers are marked with black. Since frontal ablation is not included in the simulations, all marine-terminating glaciers have a higher mass loss than in the simulations. Land-terminating glaciers are marked with black. Figure 5c and d show the average climatic mass balance for all land-terminating glaciers. The simulated climatic mass balance is within the uncertainty estimate of the geodetic data for the whole period, although it is always above the best-estimate value. That the estimates for Novaya Zemlya are generally in the upper range of the uncertainty estimate could be consistent with the overestimation of modelled precipitation found for the Malye Karmakuly AWS.
(a–b) Comparison between the best-estimate geodetic mass balance from Hugonnet and others Reference Hugonnet(2021) and the climatic mass balance in this study for all glaciers in the RGI from 2000 to 2020 for (a) Franz Josef Land and (b) Novaya Zemlya. The difference is calculated as  $B^{Hugonnet}-B_{clim}^{CryoGrid}$. Land-terminating glaciers are outlined in black. Note that both figures share the same colourscale. (c–d) Comparison between simulated climatic mass balance (blue line) and the geodetic estimate from Hugonnet and others Reference Hugonnet(2021) for land-terminating glaciers. Grey areas show the uncertainty on the geodetic estimate and black stippled lines show the best estimate.

4.2. Climatic trends
Since 1991, the CARRA simulations indicate positive trends in both temperature and precipitation over Franz Josef Land and Novaya Zemlya (Fig. 6). The average yearly temperature over Franz Josef land is 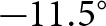 $-11.5^\circ$C, including both glacierized and non-glacierized land areas, with the highest average annual temperatures over low-elevation non-glacierized land (up to
  $-4.4^\circ$C) and the lowest temperatures in the centre of ice caps (down to
  $-16.8^\circ$C). For Novaya Zemlya, the average yearly temperature is
  $-8.2^\circ$C, with the highest average annual temperatures over non-glacierized land in the south (up to 0.5∘C) and the lowest temperatures above high-elevation glacier points in the north (down to
  $-16.4^\circ$C).
(a) Average yearly values of temperature and (b) change in precipitation compared to 1991–2000 average for Franz Josef Land (blue lines) and Novaya Zemlya (red lines). The black stippled lines show the overall trend (p-value < 0.05). (c–d) show the trends in temperature and (e–f) show the trends in precipitation in each point compared to the 1991–2000 mean. Stippled areas have no statistically significant trend at a 95% confidence interval.

Particularly Franz Josef Land has experienced a significant warming (Fig. 6c), with a temperature trend of 1.8∘C decade−1. This is higher than the trend from both Novaya Zemlya (1.4∘C decade−1) and Svalbard (1.5∘C decade−1) (Schmidt and others, Reference Schmidt, Schuler, Thomas and Westermann2023) over the same period. The strongest temperature trends are found in the southern islands (up to 2.1∘C decade−1) while the lowest trends are found in the northern islands (as low as 1.6∘C decade−1). For Novaya Zemlya (Fig. 6d), the largest temperature trends are found along the south and eastern coast (up to 2.1∘C decade−1), while the lowest trends are found along the western coast (down to 1.0∘C decade−1).
The average precipitation is 0.42 m w.e. a−1 over Franz Josef Land and 0.70 m w.e. a−1 over Novaya Zemlya. There is a significant trend in the average yearly precipitation for both locations of 0.05 m w.e. decade−1. This is equivalent to a 15.1% decade−1 increase for Franz Josef Land and a 8.2% decade−1 for Novaya Zemlya, when compared to the 1991–2000 precipitation average. There is a significant positive trend in the precipitation for all points on Franz Josef Land (Fig. 6e), with a maximum trend at high elevation (up to 21% decade−1). For Novaya Zemlya (Fig. 6f), the highest trends are found in the northern part of the archipelago (up to 20 % decade−1), with mostly insignificant trends in the South.
Figure 7 shows the average precipitation for each glacier in the RGI as well as the trend. For Franz Josef Land (Fig. 7a,c), glaciers on the southern islands generally receive the most precipitation. All glaciers have an increasing trend in precipitation. For Novaya Zemlya (Fig. 7b,d), the east-facing glaciers receive less precipitation than west-facing glaciers. The west-facing glaciers also have a larger increasing decadal trend than east-facing glacier, with the north-eastern glaciers experiencing the largest increase.
(a–b) Average yearly precipitation from 1991 to 2022 for all glaciers in the RGI for (a) Franz Josef Land and (b) Novaya Zemlya. (c–d) Decadal trends in precipitation for all glaciers in the RGI for (a) Franz Josef Land and (b) Novaya Zemlya.
4.3. Climatic mass balance
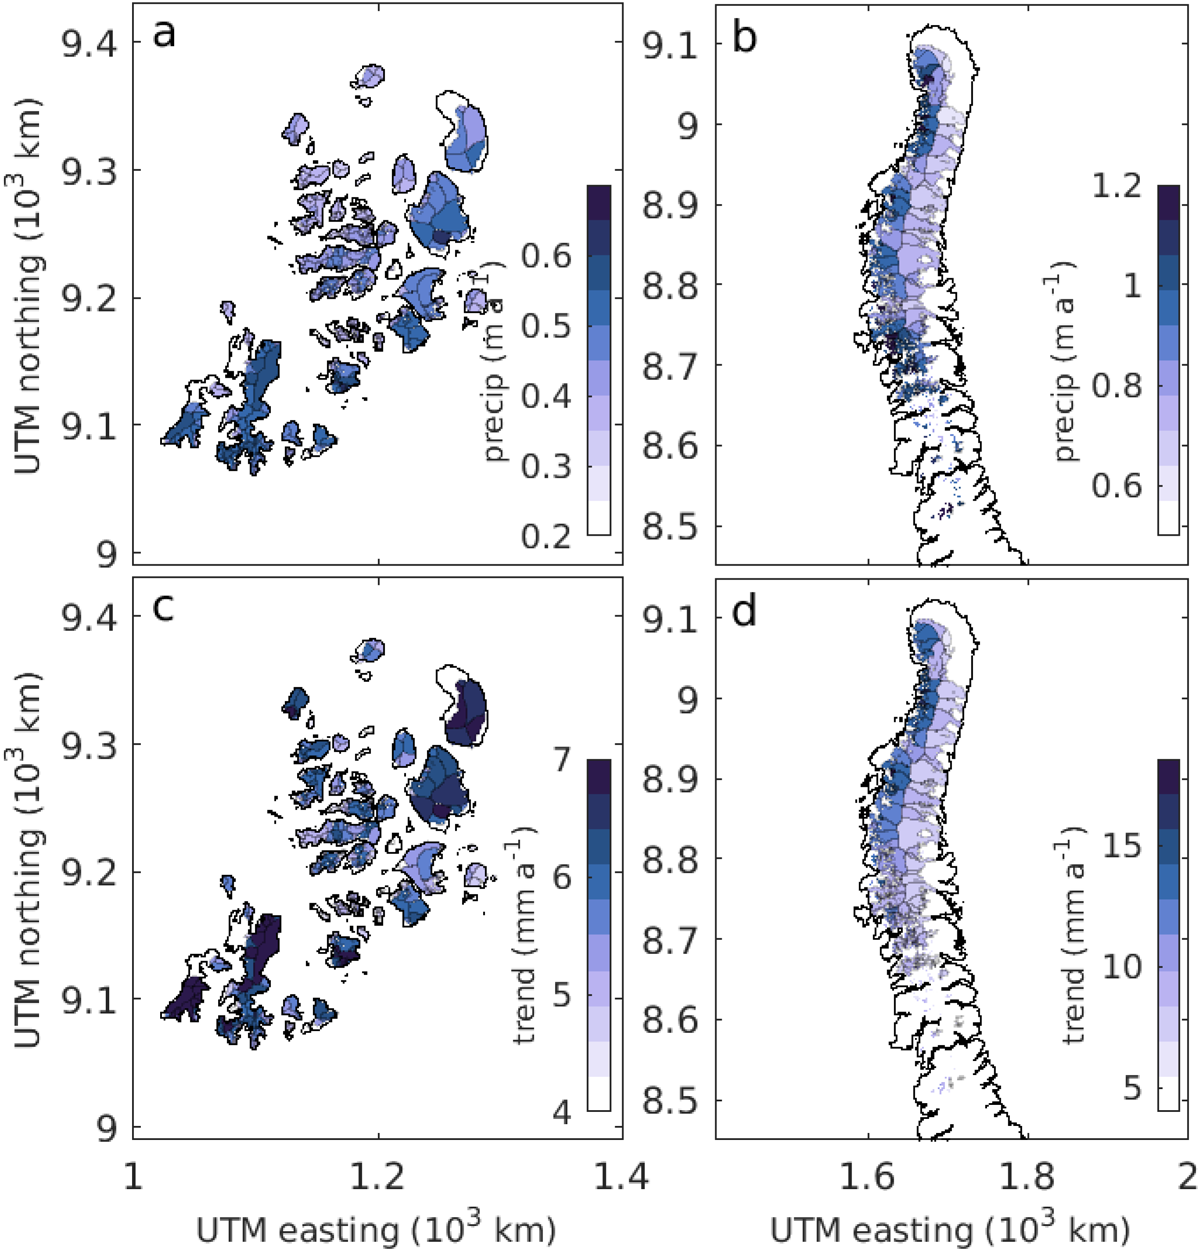
Figure 8 shows the climatic mass balance of Franz Josef Land and Novaya Zemlya for the 1991/92–2021/22 glaciological years, defined as the period from September in the preceding to August in the current year.
(a, d) The average annual climatic mass balance, (b, e) the evolution of the summer, winter and annual climatic mass balance (cmb) and (c, f) the residual between the CARRA-forced CryoGrid simulations and the geodetic mass balance estimated by Hugonnet and others Reference Hugonnet(2021) for (a–c) Franz Josef Land and (d–f) Novaya Zemlya.
We find that the climatic mass balance is generally positive over the simulation period, with an average climatic mass balance of 0.21 m w.e. a−1 for Franz Josef Land and 0.07 m w.e. a−1 for Novaya Zemlya. For some years, e.g. 2009/10 and 2013/14, the summer balance is even positive in both areas, due to low air temperatures and increased summer snow events. There is no significant trend in the annual climatic mass balance over the simulation periods, but there is a small, increasing trend in the winter mass balance for both areas. This amounts to an increase of 0.05 m w.e. decade−1 for Franz Josef Land and 0.06 m w.e. decade−1 for Novaya Zemlya. In general, there are more frequent high-melt years in the last decade, but only for Franz Josef Land is there a significant, but small, trend in the summer balance of −0.09 m w.e. decade−1.
Figure 9 shows the average annual climatic mass balance for Franz Josef Land and Novaya Zemlya integrated for each glacier in the RGI. In addition, box plots of the average climatic mass balance are shown for different area bins. For Franz Josef Land (Fig 9a,c), the annual climatic mass balance of most glaciers is positive. Approximately, 23% of all glaciers have a negative annual climatic mass balance, but since these are mostly small, they only account for 7% of the total glacier area. For Novaya Zemlya, 67% of the glaciers have a negative annual climatic mass balance. These are mostly glaciers with an area below 100 km2 and thus only account for 35% of the total glacier area. West-facing glaciers have on average a higher climatic mass balance than east-facing glaciers. This is partly due to the higher precipitation in the East (Figure 7).
(a–b) Average climatic mass balance of all glaciers in the RGI from 1991/92 to 2021/22 for (a) Franz Josef land and (b) Novaya Zemlya. Note that both figures share the same colourscale. (c–d) Boxplots of the climatic mass balance for glaciers in different area bins and histograms of the number of glaciers in each bin for (c) Franz Josef Land and (d) Novaya Zemlya.

For both area, smaller glaciers have lower CMB than large glaciers, which is a similar behaviour as found for Svalbard (Schuler and others, Reference Schuler2020). The reason for this behaviour is partly that the smaller glacier has a lower accumulation–area ratio (AAR) than the larger glaciers, as less of their area lies above the Equilibrium Line Altitude (ELA). In addition, smaller glacier covers a smaller elevation span than larger glaciers and often therefore do not reach as high accumulation.
4.4. Accumulation–area ratio
The accumulation area of Franz Josef Land is large (Fig. 8a), with an average AAR of 78%. For a third of the period (10 years), the accumulation area encompasses almost the entire glacier area, with AAR > 95%. For most of the simulation period, the annual climatic mass balance is therefore positive, even with a positive summer balance during many years. One clear outlier is 2019/20, where an extremely negative summer mass balance is simulated. This leads to a very low AAR (9%) compared to the preceding years.
For Novaya Zemlya, the AAR is on average 65%. Similar to Franz Josef Land, 2019/20 has a lower than average climatic mass balance and a low AAR (5%). Lower than average climatic mass balance and AAR has also been estimated for Svalbard (Schmidt and others, Reference Schmidt, Schuler, Thomas and Westermann2023), suggesting generally high melt rates in the Barents Sea region in 2019/20. However, some previous years (e.g. 2003/04 and 2012/13) have had comparable summer mass balance and AARs.
4.5. Refreezing and cold content
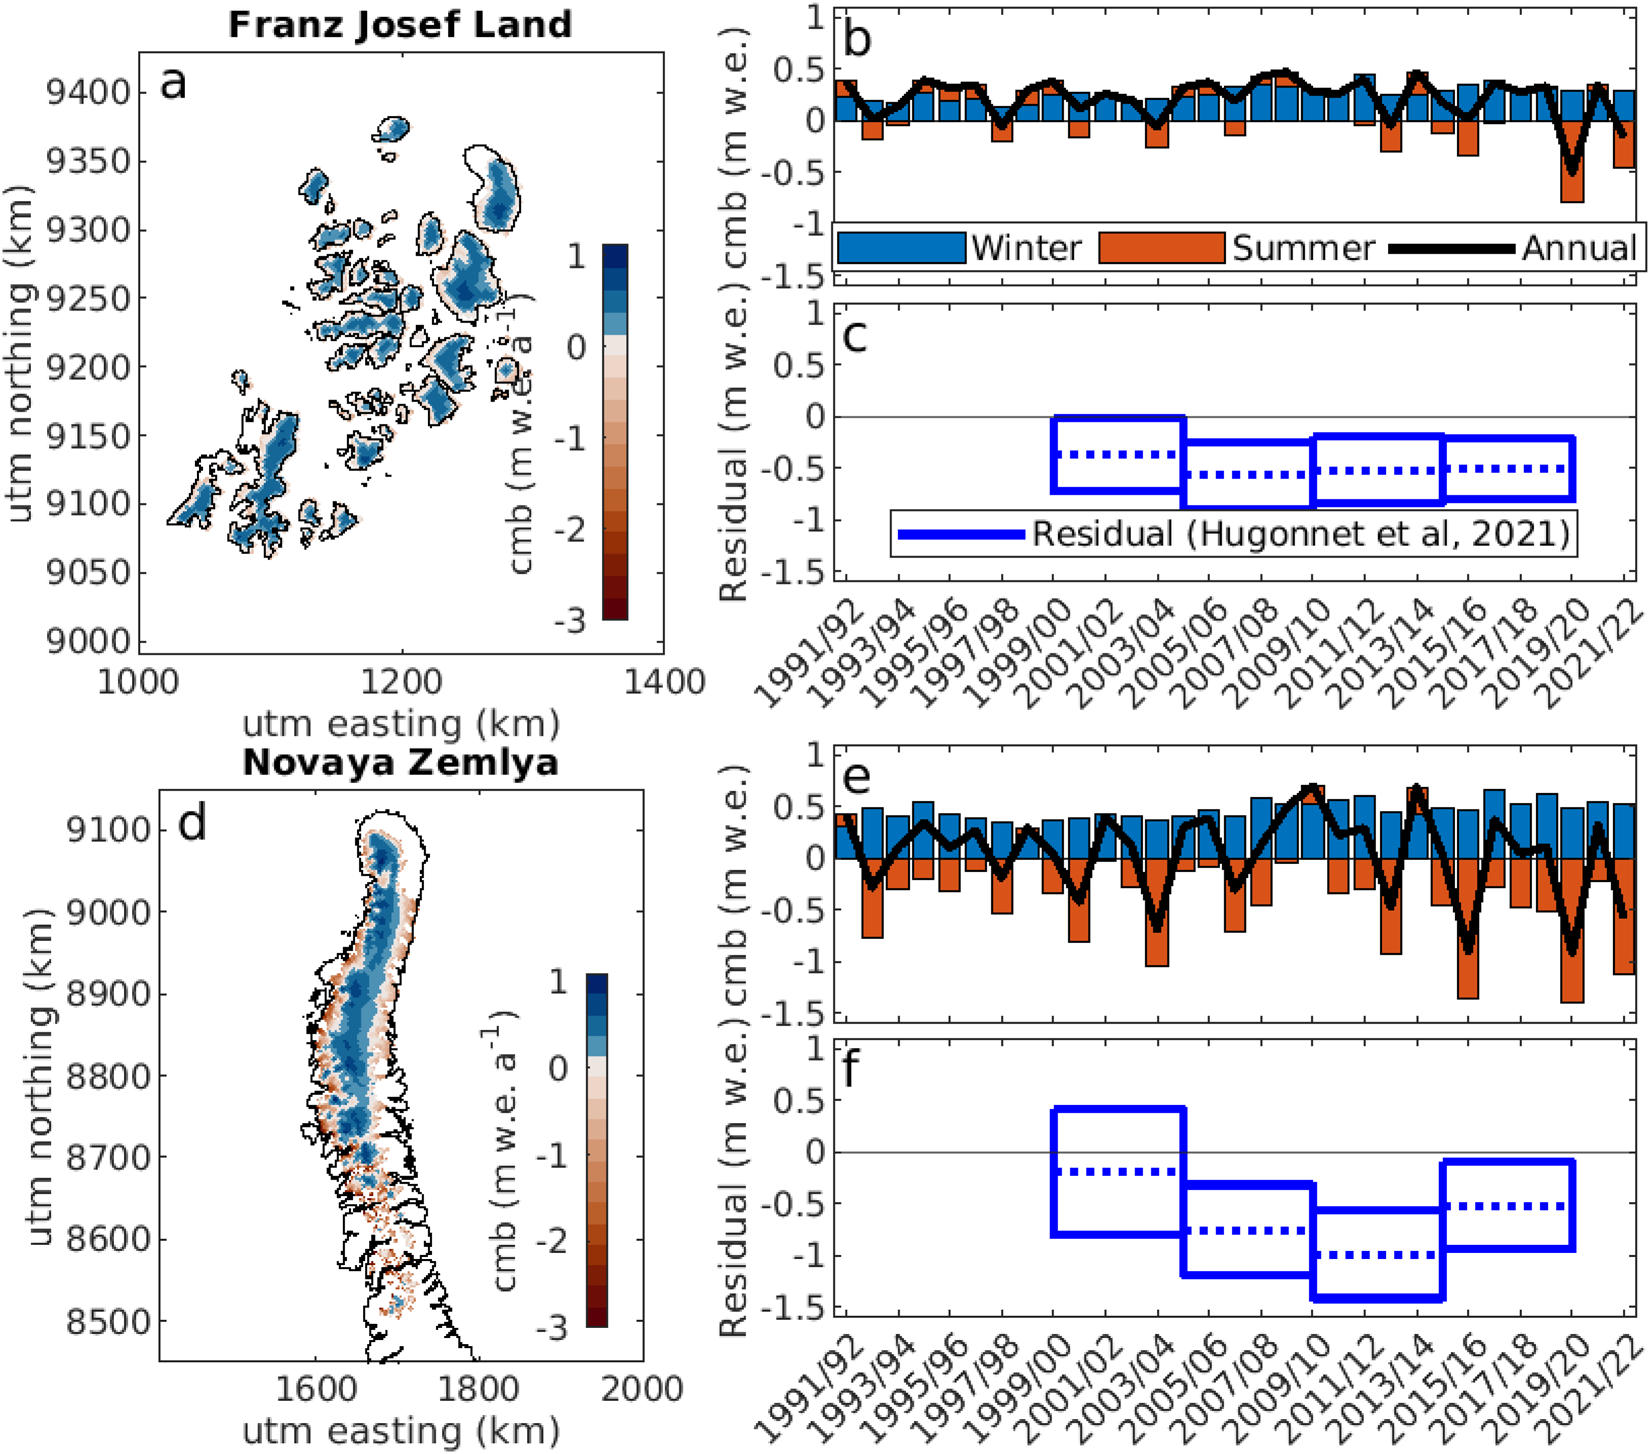
Figure 10 shows the changes in yearly refreezing, i.e. refreezing in the entire snow and firn column, and internal accumulation, i.e. refreezing below the annual layer. The average refreezing rate is similar for the two areas, of 0.23 m w.e. year−1 for Franz Josef Land and 0.24 w.e. year−1 for Novaya Zemlya. There is no significant change in the refreezing rate for Franz Josef Land, but there is a significant decrease for Novaya Zemlya of −0.018 m w.e. decade−1. The internal accumulation accounts for on average 57% of the total refreezing for Franz Josef Land and 46% of the total refreezing for Novaya Zemlya. There is no significant trend for Franz Josef Land, but for Novaya Zemlya there is a significant decrease of −0.01 m w.e. decade−1. The majority of the trend in the refreezing is therefore due to a decrease in internal accumulations, and there is no significant trend in the refreezing in the yearly layer.
The yearly specific refreezing (solid lines) and internal accumulation (stippled lines) for Franz Josef Land (blue) and Novaya Zemlya (red). The trend for Novaya Zemlya is shown in black. There is no significant trend for Franz Josef Land ( $p \gt $0.05).
The decrease in total refreezing is due to a decrease in the cold content of the snow and firn of Novaya Zemlya. Compared to the 1991–2000 average, the cold content at the beginning of the melt season (here defined as May 1) has a significant decreasing trend of 10% decade−1. As a result, the liquid water content at the beginning of the melt season has also significantly increased over the time period, with a trend of 0.42 m3 m−3 decade−1. Although there is no significant trend in the refreezing for Franz Josef Land, there is a significant trend in both the cold content and water content. The cold content has decreased by 6% decade−1, while the liquid water content has increased by 0.43 m3 m−3 decade−1.
4.6. Runoff
There is a significant, increasing trend in the runoff from glaciers from both Franz Josef Land and Novaya Zemlya (Fig. 11). The runoff from Franz Josef Land over the simulation period is on average 0.24 m w.e. a−1. There is a significant trend of 0.11 m w.e. decade−1. The average for Novaya Zemlya is 0.76 m w.e. a−1, with a significant trend of 0.20 m w.e. decade−1. The runoff contribution from Novaya Zemlya is therefore much higher than that from Franz Josef Land, and the trend shows that the runoff has increased at almost twice the rate.
The average specific runoff from 1991 to 2022 from glaciers in (a) Franz Josef Land and (b) Novaya Zemlya. (c) Time series of specific runoff (m w.e.) and trend.
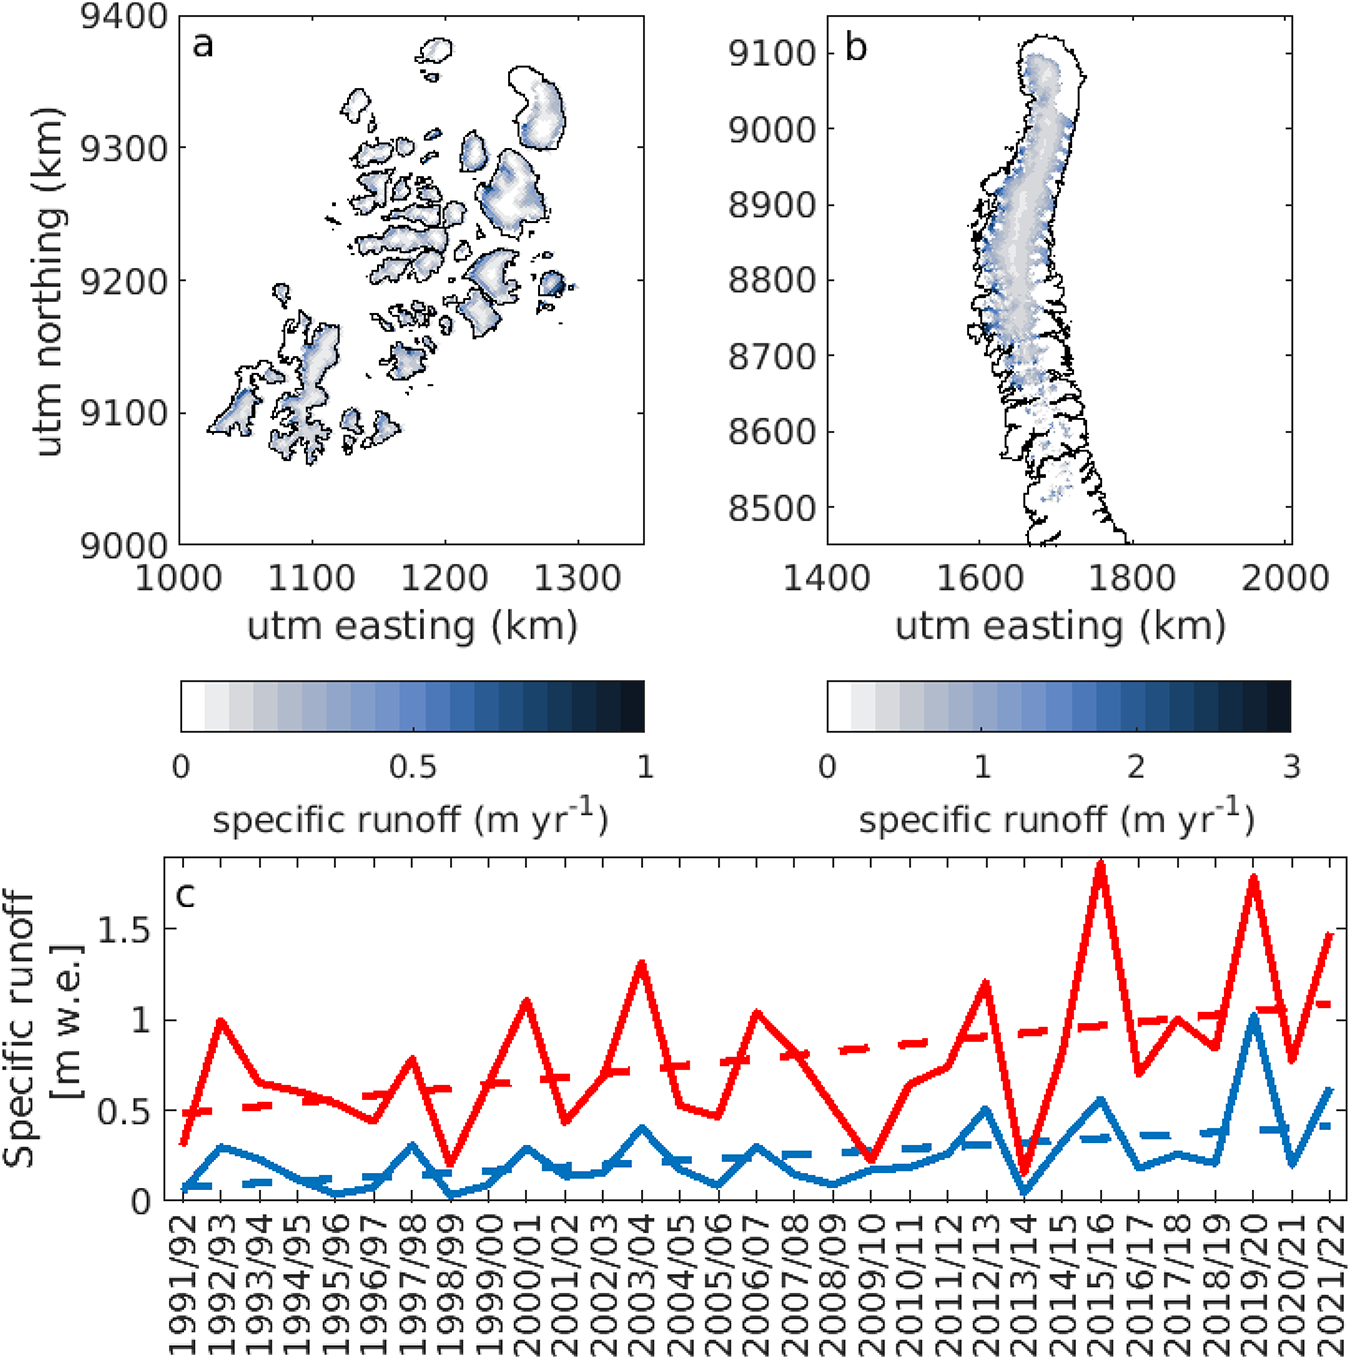
The average runoff from each glacier in the RGI from 1991/92 to 2021/22 is shown in Fig. 12, in addition to the runoff trend. For Franz Josef Land, all glaciers have an increasing runoff trend, with the largest trends found for glaciers in the southern islands. For Novaya Zemlya, the smaller glaciers in the south of the archipelago have the largest runoff and trends. Generally, the west-facing glaciers have a larger runoff than the east-facing glaciers.
Average runoff (a–b) and runoff trends (c–d) for each glacier in the RGI from 1991/92 to 2021/22 for (a, c) Franz Josef Land and (b, d) Novaya Zemlya.

4.7. Frontal ablation estimate
The mass balance simulations in this study only include surface and subsurface processes but do not include glacier dynamics and frontal ablation. However, by comparing the climatic mass balance from this study with geodetic estimates, we can get an indication of the mass loss due to frontal ablation. Figure 8c and f show the residuals between the geodetic estimate from Hugonnet and others Reference Hugonnet(2021), including tidewater glaciers, and the climatic mass balance estimate simulated in this study. The residual comprises both frontal ablation and the collective uncertainties in the geodetic and modelled mass balances. We assume that these residuals are only due to frontal ablation and not due to errors in the climatic mass balance model. Thus, the residuals can provide a rough estimate of the frontal ablation. Based on these results, the frontal ablation rate of Franz Josef Land from 2000 to 2019 is −0.49 ± 0.32 m w.e. a−1. The residuals, and therefore the assumed frontal ablation rates, are fairly stable over the investigated period. For Novaya Zemlya, a similar frontal ablation rate is found from 2000 to 2019 of −0.60 ± 0.47 m w.e. a−1. The residuals vary throughout the investigated period, with the largest residuals in 2010–15. These estimates are consistent with the estimates by Kochtitzky and others Reference Kochtitzky(2022), which found frontal ablation rates of  $-0.71\pm0.33$ m w.e. a−1 for Franz Josef Land and
  $-0.15\pm0.05$ m w.e. a−1 for Novaya Zemlya from 2000 to 2020.
4.8. Model sensitivities
In order to explore the sensitivity of the model results to biases in the meteorological forcing, we apply uniform perturbations in temperature and precipitation for 1991–2022. Due to large computational cost, sensitivity simulations are only done for 50 points for each area, which were randomly selected across each of the domains. First, the air temperature is shifted by ±0.5 and  $\pm1^\circ$C, as the comparison between the modelled precipitation and two AWSs had a root-mean-square error of 1∘C. Then precipitation is perturbed by ±20% and ±30% (Table 1). For Franz Josef Land, comparison with an AWSs showed a model bias of around 20%, while the model bias for the AWS location in Novaya Zemlya was much higher, at 86%. However, this is likely partly due to undercatch, and we therefore limit this sensitivity test to 30%. A temperature increase of 1∘C results in a decrease in the climatic mass balance of −0.37 for Franz Josef Land and −0.32 m w.e. a−1 for Novaya Zemlya. This is similar to the sensitivity of −0.3 m w.e. a−1 found for Svalbard (Van Pelt and others, Reference Van Pelt, Oerlemans, Reijmer, Pohjola, Pettersson and Van Angelen2012, Østby and others, Reference Østby, Vikhamar Schuler, Ove Hagen, Hock, Kohler and Reijmer2017) but in the lower range of sensitivities for glaciers elsewhere in the world (Woul and Hock, Reference Woul and Hock2005).
Sensitivity of the climatic mass balance (dB $_{clim}$) to perturbations in temperature and precipitation
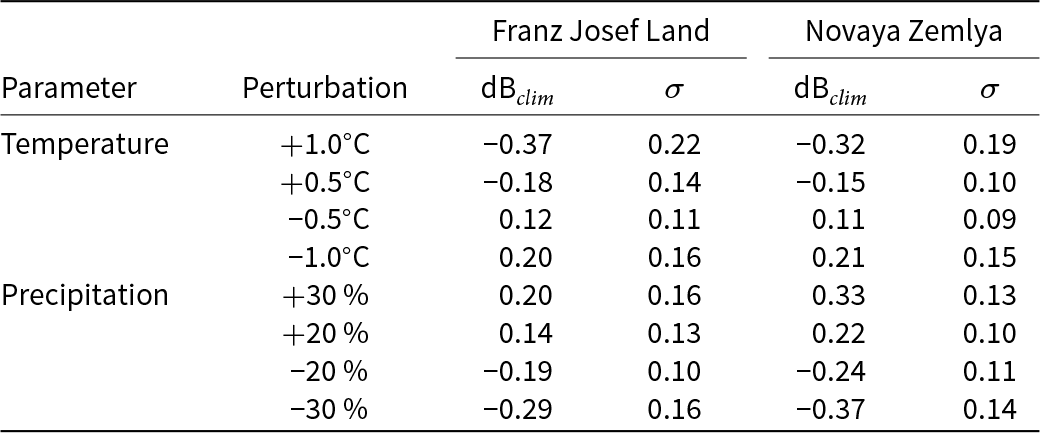
A 30% decrease in precipitation leads to a decrease in the climatic mass balance of −0.29 m w.e. a−1 for Franz Josef Land and −0.37 m w.e. a−1 for Novaya Zemlya. Novaya Zemlya is therefore slightly more sensitive to changes in precipitation. The effect of a 30% increase in precipitation is slightly less, with an increase in the climatic mass balance of 0.20 m w.e. a−1 for Franz Josef Land and 0.33 m w.e. a−1 for Novaya Zemlya.
4.9. Extreme melt on Franz Josef Land in 2020
The large amount of melt from Franz Josef Land in 2020 in the simulations is largely due to high values of air temperatures, specific humidity and incoming longwave radiation during the summer (June through August). The average energy balance during the summer is shown for each year in Fig. 13.
The average contribution from individual energy balance components to the melt energy over glaciers from July through August in Franz Josef Land.
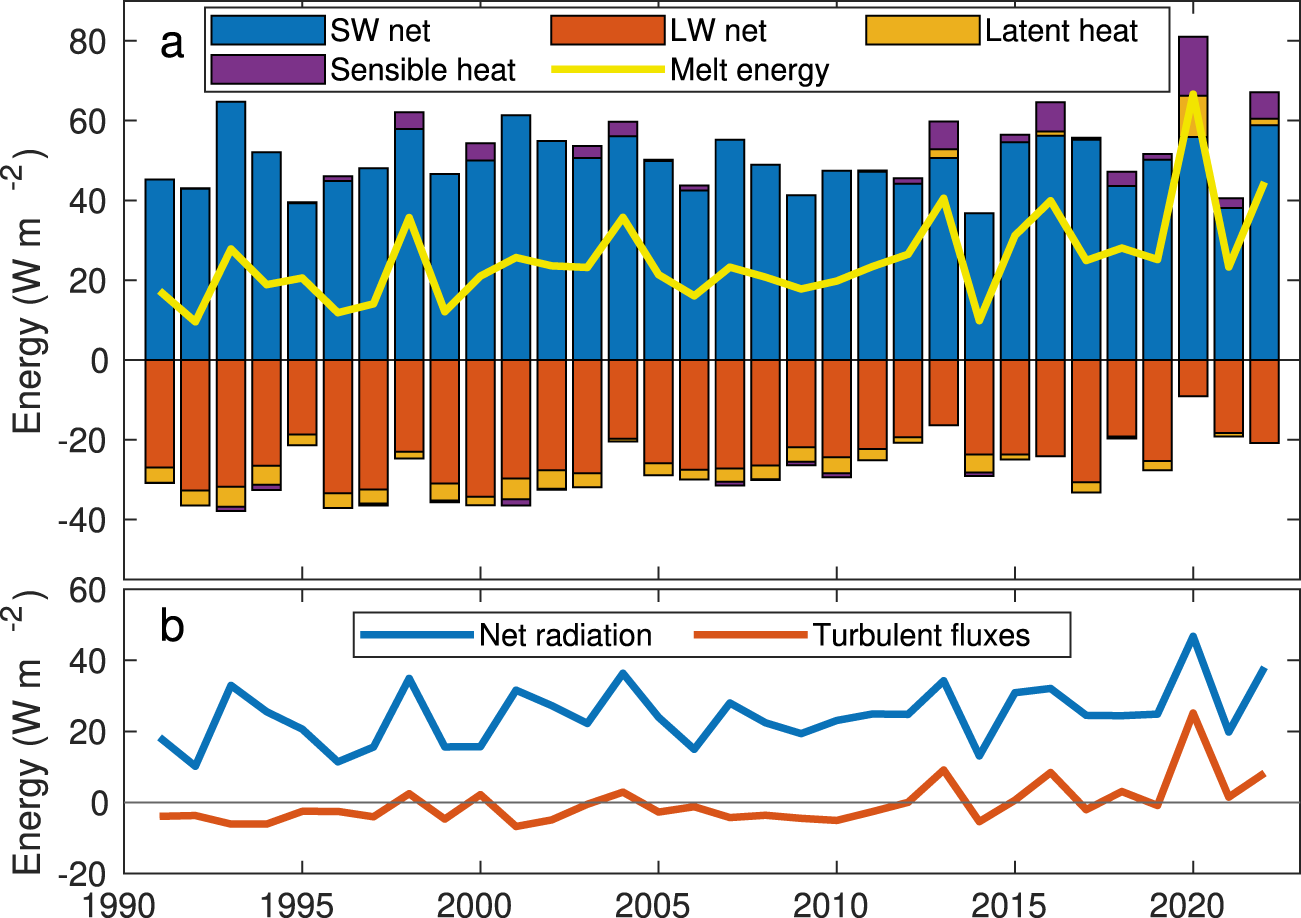
In Franz Josef Land, the amount of melt is for most years controlled by the radiation balance, but in 2020 there was a large contribution from the turbulent fluxes. The average summer 2 m temperature during 1991–2019 varied between −2∘C and −0.2∘C, with an average value of  $-1^\circ$C. In 2020, on the other hand, the average 2 m temperature reached 0.8∘C. In combination with higher than average winds in some locations, the increase in the temperature gradient through the atmosphere leads to higher than usual sensible heat flux. The higher atmospheric temperatures are also followed by an increase in the incoming longwave radiation compared to previous years. The incoming shortwave radiation in June through August of 2020 is 12% below the average value, indicating cloudy conditions, but due to low glacier albedo the amount of absorbed shortwave is still above average.
The higher temperatures also lead to an increase in the specific humidity. From 1991 to 2019, the specific humidity during the summer varied between 0.0030 and 0.0036 g kg−1 with an average of 0.0033 g kg−1. In 2020, the average specific humidity was 0.0039 g kg−1. The relative humidity was often 100%, meaning the hot, moist air had a higher specific humidity than the air close to the glacier surface. During some days, there is, therefore, a strong specific humidity gradient from a few meters above the surface towards the glacier ice surface, leading to deposition and a positive latent heat flux towards the surface.
The increase in both net longwave and shortwave radiation and turbulent fluxes leads to a larger amount of energy available for melt. On average during 1991–2019, the melt energy over the summer months was 23 W m−2. The melt energy in summer 2020 was almost three times as high, at 66.6 W m−2. Even in 2022, which is the year with the second highest melt energy over the summer months, the available energy is around two-thirds of that of 2020, at 44.6 W m−2.
The temperatures from the AWS on Franz Josef Land in 2020 are consistent with the higher CARRA temperatures. From 1991–2019, the average yearly summer temperature at the AWS was between −1.1∘C and 0.7∘C, with an average value for the whole period of around 0∘C. In 2020, the average summer temperature was much higher at 1.2∘C. In addition, an increase in melt days was found from the MODIS LST observations (Fig. 4c), corroborating the increase in melt in 2020.
4.10. Spatial variability in the Barents Sea region
The evolution of the climatic mass balance for the three land areas in the Barents Sea region—Svalbard, Franz Josef Land and Novaya Zemlya—is shown in Fig. 14. For Svalbard, we show the range in climatic mass balance estimated from different modelling studies (Lang and others, Reference Lang, Fettweis and Erpicum2015, Aas and others, Reference Aas2016, Østby and others, Reference Østby, Vikhamar Schuler, Ove Hagen, Hock, Kohler and Reijmer2017, Schmidt and others, Reference Schmidt2019, Van Pelt and others, Reference Van Pelt2019, Noël and others, Reference Noël2020) and calculate the average yearly climatic mass balance across the models. For Franz Josef Land and Novaya Zemlya, only the results from this study are shown. For the following discussion of climatic drivers, all climate variables (sea ice fraction, sea surface temperature [SST], etc.) are taken from the CARRA reanalysis (Yang and others, Reference Yang2021), as this is the forcing for the Cryogrid model.
(a) Specific climatic mass balance (cmb) and (b) cumulative climatic mass balance of glaciers in Svalbard, Franz Josef Land and Novaya Zemlya. For Svalbard, the average and span in climatic mass balance from several modelling studies is shown (Lang and others, Reference Lang, Fettweis and Erpicum2015, Aas and others, Reference Aas2016, Østby and others, Reference Østby, Vikhamar Schuler, Ove Hagen, Hock, Kohler and Reijmer2017, Schmidt and others, Reference Schmidt2019, Van Pelt and others, Reference Van Pelt2019, Noël and others, Reference Noël2020). Note that not all studies cover the entire study period. The lines from Franz Josef Land and Novaya Zemlya are the same as the green climatic mass balance lines in Figure 8b,e.

The mass balance of the three archipelagos appears to be correlated for some of the period, particularly in the 1990s (Fig. 14a). All regions also experienced highly negative climatic mass balance in 2013 and 2020, which is linked to increased summer air temperatures and increased turbulent fluxes over glaciers in the areas, as well as a decreased sea ice fraction in the Barents Sea. For Novaya Zemlya, Haacker and others Reference Haacker, Wouters, Fettweis, Glissenaar and Box(2024) also found that the increased melt was due to increased turbulent fluxes, largely due to high fluxes of additional sensible heat, which was brought by atmospheric rivers and Foehn winds. Atmospheric rivers can also lead to a decreased sea ice fraction in the Arctic (e.g. Li and others, Reference Li, Cannon, Mazloff, Subramanian, Wilson and Ralph2024), and atmospheric rivers could, therefore, also be a contributing factor to the simulated decreased sea ice fraction in the Barents Sea during these years.
Although the annual mass balance is often similar for the three regions, there are large differences in both the summer and winter mass balance. Glaciers in Franz Josef Land generally have a less negative summer mass balance, but this is compensated by lower winter precipitation than in the other regions. Svalbard generally has the most negative summer climatic mass balance and highest winter climatic mass balance, while Novaya Zemlya lies in between. Still, even if the absolute values differ, there is a high correlation between the regions. In general, the annual climatic mass balance of Franz Josef Land is highly correlated to that of both Novaya Zemlya (r = 0.86) and Svalbard (r = 0.74), while the correlation between Novaya Zemlya and Svalbard is lower (r = 0.63). This high correlation is mostly controlled by the summer mass balance, where there is also a high correlation between all three regions (r > 0.6).
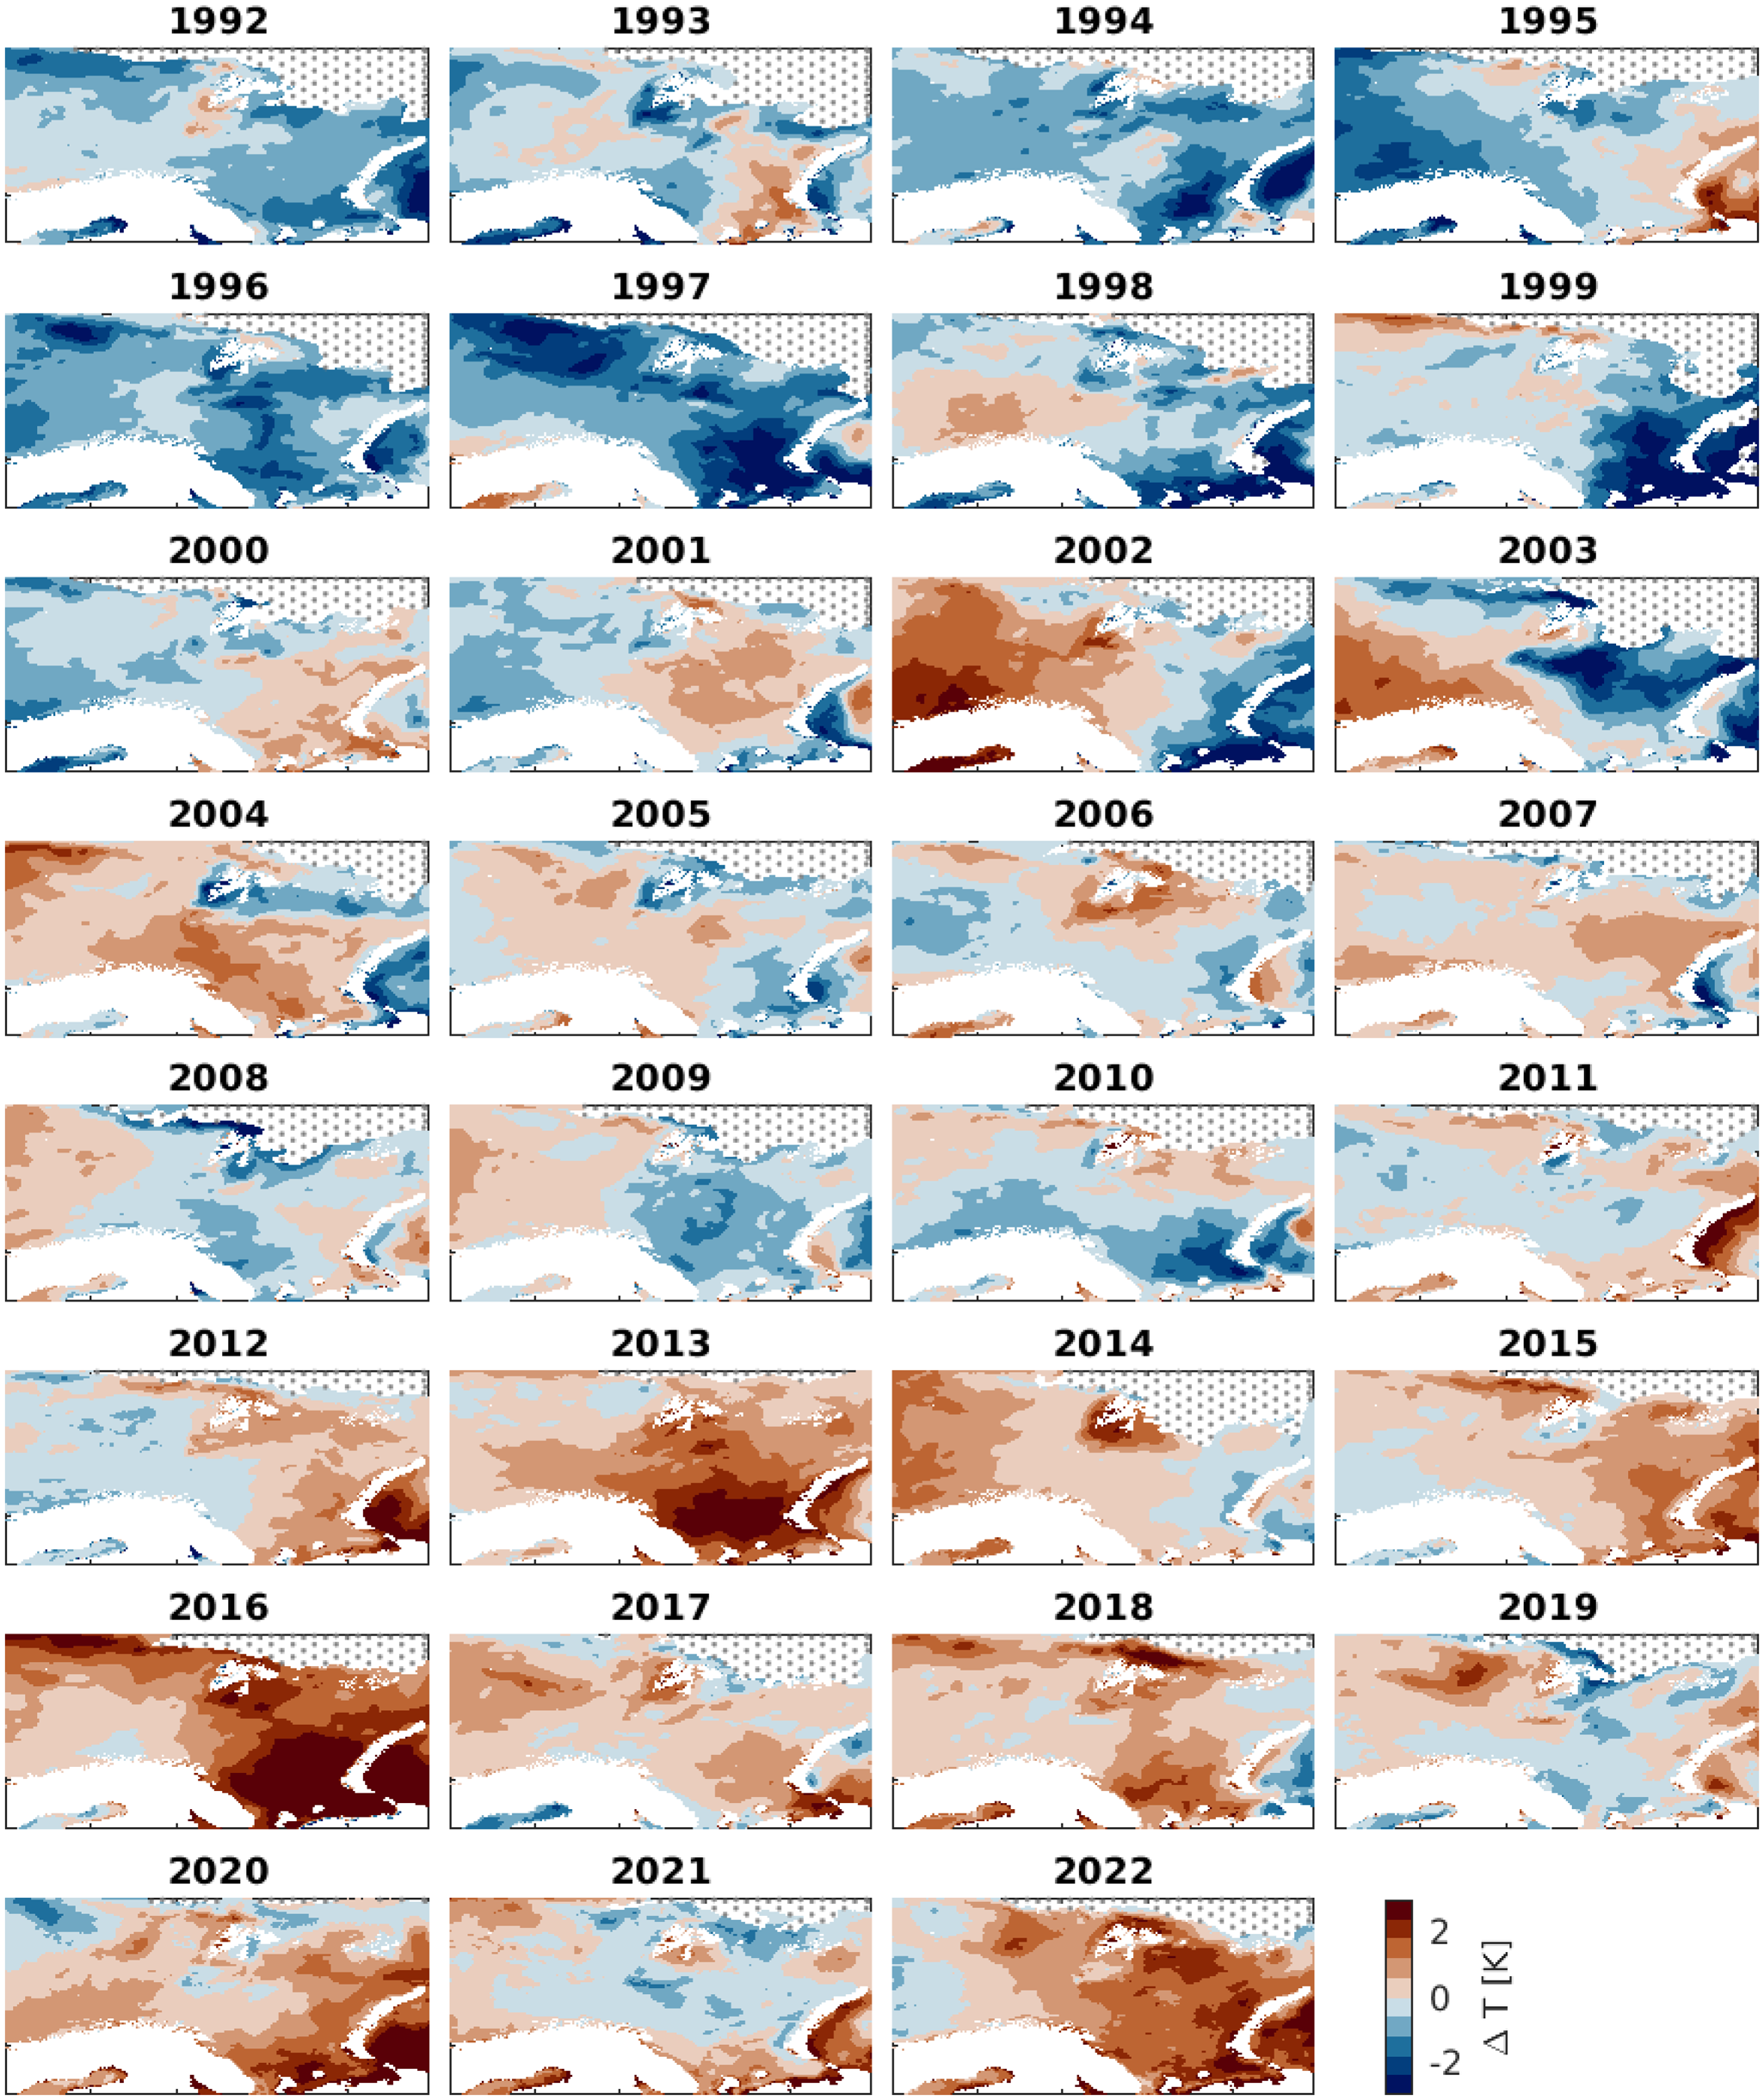
During some years, there is a contrasting behaviour between the regions. For example, in 2001/02 and 2002/03, the amount of melt increased for Svalbard and the climatic mass balance thus became negative, while for both Franz Josef Land and Novaya Zemlya the climatic mass balance became positive. This is due to higher than average summer air temperatures over Svalbard and below-average summer air temperatures over Franz Josef Land and Novaya Zemlya, which lead to high turbulent fluxes and low albedo values over Svalbard. Conversely, in 2015/16, Novaya Zemlya experienced highly negative climatic mass balance which is not seen for Franz Josef Land and Svalbard. Both Franz Josef Land and Svalbard did experience increased melt in 2015/16, although not as extreme, and this increase in melt is partly out-weighted by an above average winter mass balance in these regions. This difference is also reflected in the average summer SST, as most of the CARRA domain experience higher-than-average SST but with the most extreme warming in SW Barents Sea and SE Kara Sea (see Fig. 15).
Average summer (June through August) sea surface temperature anomalies between 1992 and 2022 according to CARRA. Stippled area shows average June through August sea ice extent.
This contrasting behaviour does not appear to be directly linked to climate indicators, as we found that the correlation between modelled climatic mass balance (annual, summer and winter) and the North Atlantic Oscillation and Artic Oscillation is low for all regions. We further investigated if the reason behind the contrasting behaviour could be found in the pressure patterns, sea ice extent, wind patterns or SST in the CARRA domain but did not find a parameter which could explain all the variations, and it is, therefore, likely that the contrasting behaviour is due to a combination of different processes.
For 2002, 2003, 2009 and 2014, there are indications that the higher melt from Svalbard is due to increased Atlantic inflow. In these years, there is an above-average SST in the Norwegian Sea and the ocean areas around Svalbard during the summer months, while the eastern Barents sea experienced colder-than-average SST (see Fig. 15). This difference between Svalbard and the eastern Barents sea is particularly strong in 2002 and 2003, but this SST pattern is not evident in 2010 and 2017, where there is also contrasting behaviour between Svalbard and Franz Josef Land and/or Novaya Zemlya. The differences in 2010 and 2017 appear to be more related to longwave radiation and precipitation differences. In 2010 and 2017, while Novaya Zemlya experienced increased snowfall in summer, thus increasing the accumulation and the albedo, Svalbard received less-than-average summer snowfall. In addition, both Franz Josef Land and Novaya Zemlya received below-average incoming shortwave radiation over the summer. For 2010, the differences for Novaya Zemlya become more pronounced due to the addition of a high winter accumulation.
When calculating the cumulative climatic mass balance from 1991/92 to 2021/22 (Fig. 14b), there is a large span in the estimates for Svalbard, but on average Svalbard was losing mass over the simulation period while Franz Josef Land and Novaya Zemlya were gaining mass. A similar relation is found in the estimates of the total mass balance from Hugonnet and others Reference Hugonnet(2021) for 2000–20, which found the largest relative mass loss from Svalbard (−0.31 ± 0.09 m w.e. a−1) followed by Novaya Zemlya (−0.25 ± 0.10 m w.e. a−1) and Franz Josef Land (−0.22 ± 0.09 m w.e. a−1).
5. Discussion
5.1. Comparison to other studies
Only one other model estimate of climatic mass balance and runoff for the Russian Arctic based on energy balance modelling currently exists (Maure and others, Reference Maure, Kittel, Lambin, Delhasse and Fettweis2023), which used the regional climate model MAR at a 6 km resolution. For the period 1991/92 to 2019/20, they found a climatic mass balance of −0.31 m w.e. a−1 for Novaya Zemlya and 0.16 m w.e. a−1 for Franz Josef Land. In this study, we find very similar values of climatic mass balance for Franz Josef Land for this period (0.22 m w.e. a−1), but there are significant differences for Novaya Zemlya, where this study finds a much less negative yearly climatic mass balance (0.06 m w.e. a−1). This difference could be due to differences in temperature and precipitation type between the two products for Novaya Zemlya. Differences between the two models could both stem from the different resolutions (2.5 km for this study vs 6 km for MAR) and from differences in model physics and parameterizations. For example, MAR uses the hydrostatic approximation while CARRA uses a non-hydrostatic model. Previous studies have shown that a non-hydrostatic model may provide more accurate estimates of precipitation (e.g. Kato and Saito, Reference Kato and Saito1995, Schmidt and others, Reference Schmidt, Langen, Adalgeirsdóttir, Pálsson, Gudmundsson and Gunnarsson2018, Liu and others, Reference Liu, Ullrich, Guba, Caldwell and Keen2022). Nevertheless, the average total precipitation for the two studies is similar over glaciers in Novaya Zemlya, but the amount of rainfall is much higher in the MAR product than for the CryoGrid simulations. In terms of the runoff, Maure and others Reference Maure, Kittel, Lambin, Delhasse and Fettweis(2023) finds values of 1.16 m w.e. a−1 for Novaya Zemlya and 0.32 m w.e. a−1 for Franz Josef Land. In this study, we find a lower average runoff for both regions, with 0.76 m w.e. a−1 from Novaya Zemlya and 0.23 m w.e. a−1 from Franz Josef Land.
Several studies have provided estimates of the geodetic mass balance (e.g.
Jacob and others, Reference Jacob, Wahr, Pfeffer and Swenson2012, Moholdt and others, Reference Moholdt, Wouters and Gardner2012, Cirací and others, Reference Ciracì, Velicogna and Sutterley2018, Hugonnet and others, Reference Hugonnet2021). These studies all found that glaciers in Franz Josef Land and Novaya Zemlya have been losing mass over the last decades, which seems to contradict the on average positive climatic mass balance found for these regions. Considering the large contribution of frontal ablation, these results are not necessarily in contradiction. For example, for 2000–2020, Franz Josef Land had a mass balance of  $-0.22 \pm 0.09$ m w.e. a−1 and Novaya Zemlya had a mass balance of
  $-0.25 \pm 0.10$ m w.e. a−1, according to Hugonnet and others Reference Hugonnet(2021). For the same period (2000–2020), the frontal ablation was equal to
  $-0.71\pm0.33$ m w.e. a−1 for Franz Josef Land and
  $-0.15\pm0.05$ m w.e. a−1 for Novaya Zemlya (Kochtitzky and others, Reference Kochtitzky2022). This means that the estimated climatic mass balance for Franz Josef Land is
  $0.49\pm0.42$ m w.e. a−1, and thus, even when uncertainties are taken into account, the climatic mass balance of Franz Josef Land over this period is likely to be positive. For comparison, this study finds an average annual climatic mass balance of 0.21 m w.e. a−1.
The estimate of the climatic mass balance of Novaya Zemlya, on the other hand, is  $-0.10 \pm 0.15$ m w.e. a−1 and could therefore either be positive or negative. A positive mass balance for this period of 0.07 m w.e. a−1 for Novaya Zemlya, as found in this study, is, therefore, just outside the uncertainty estimate. As previously mentioned, comparisons with AWSs indicate that the meteorological forcing has an overestimation in precipitation, which could lead to this overestimation in the climatic mass balance.
For Novaya Zemlya, the surface mass loss over the last decade has been found to be largely due to high melt years in 2013, 2016, 2020 and 2022 (Haacker and others, Reference Haacker, Wouters, Fettweis, Glissenaar and Box2024), which is consistent with this study. The most extreme melt events were due to a combination of atmospheric rivers and Foehn winds (Haacker and others, Reference Haacker, Wouters, Fettweis, Glissenaar and Box2024).
5.2. Uncertainties
Although we have tried to limit the uncertainties in the mass balance estimate by using a model which has previously been validated over Svalbard and a high-resolution reanalysis product as model forcing, several sources of uncertainty affect the results presented in this study.
First, there are uncertainties associated with the CARRA reanalysis. Although it showed a good fit with in situ measurements of meteorological variables on glaciers on Svalbard (Schmidt and others, Reference Schmidt, Schuler, Thomas and Westermann2023), fewer observations are available for assimilation over the Russian Arctic, which can affect the accuracy. A comparison with two available weather stations was performed, but these are also assimilated into the CARRA product and may not represent the uncertainties of other areas. The comparison did show that precipitation is likely the largest source of uncertainty, with both AWSs indicating an overestimation of precipitation, particularly for Novaya Zemlya (86%). Considering that the climatic mass balance of Novaya Zemlya was only found to be slightly positive (0.07 m w.e. a−1), if this comparison is indicative for the rest of the archipelago, it is likely that the climatic mass balance is actually negative. Still, regional extrapolation of precipitation from just one weather station is particularly tenuous. For the AWS in Franz Josef Land, a much smaller precipitation overestimation of 20% was found, and part of the precipitation difference can likely be explained by undercatch. It is not surprising that precipitation is a big source of uncertainty, as precipitation generally is the hardest value for climate models to capture, and many previous modelling studies in the arctic have found large biases for this variable (e.g. Forbes and others, Reference Forbes, Tompkins and Untch2011, Schmidt and others, Reference Schmidt2017, Van Pelt and others, Reference Van Pelt2019, Lenaerts and others, Reference Lenaerts, Drew Camron, Wyburn-Powell and Kay2020).
Second, there are uncertainties associated with the model physics and set-up. Although the CryoGrid glacier scheme has previously been validated over Svalbard (Schmidt and others, Reference Schmidt, Schuler, Thomas and Westermann2023), and we, therefore, expect the model to perform well in the similar climatic conditions of the Russian Arctic, there are always uncertainties in the models formulations. For example, the albedo and snow densification schemes are based on Crocus (Vionnet and others, Reference Vionnet2012), which was developed for glaciers in the alps and not in the Arctic. Several studies have shown that Crocus struggle to properly simulate profiles of density in Arctic snowpacks (Barrere and others, Reference Barrere, Domine, Decharme, Morin, Vionnet and Lafaysse2017, Royer and others, Reference Royer, Picard, Vargel, Langlois, Gouttevin and Dumont2021, Lackner and others, Reference Lackner2022), for example, due to an underestimation of wind-induced compaction. Although modifications were added to the model to better simulate Arctic conditions following Royer and others Reference Royer, Picard, Vargel, Langlois, Gouttevin and Dumont(2021), the model still struggles to simulate firn compaction (Innanen, 2023). Although the model performs well when compared to geodetic estimates, large errors occasionally occur for individual glaciers. In addition, we use a 30 year spin-up to initialize the sub-surface conditions before the start of our simulations. This was done by repeating the forcing from 1991 to 2000, which could introduce biases in both the extent and depth of the firn, as in reality the glaciers were most likely not in balance with the 1991–2000 climate.
Third, we neglect the effect of ice flow and glacier geometry changes on the mass balance by assuming fixed glacier outlines and a static elevation model. Both areas are based on observations collected between 2000 and 2010 (Pfeffer and others, Reference Pfeffer2014, Schyberg and others, Reference Schyberg2020) and should therefore be representative for most of the investigated period. A fixed elevation model may still introduce a negative bias in the beginning of our study period, as the elevation may be too low, and a positive bias towards the end of the study period where the used elevation model may be too high. The glacier elevation decreased by an average of  $-0.26\pm0.10$ m a−1 in Franz Josef Land and
  $-0.30\pm0.11$ m a−1 in Novaya Zemlya from 2000 to 2020 (Hugonnet and others, Reference Hugonnet2021). From 1952 to 2013, a similar thinning rate for Novaya Zemlya of
  $-0.26\pm0.04$ m a−1 was found (Melkonian and others, Reference Melkonian, Willis, Pritchard and Stewart2016). Based on these values, and considering the elevation map used in this study is based on observations from the 2000s, we expect maximum average deviation to be 8 m. From 1991 to 2023, we find average changes of mass balance with elevation of
  $2.6 \times 10^{-3}$ m w.e. m−1 for Franz Josef Land and
  $2.0 \times 10^{-3}$ m w.e. m−1 for Novaya Zemlya. We thus expect the error associated with the constant glacier mask to be less than 0.02 m w.e. a−1 on average. In areas where the thinning rate is higher than the average, the associated errors may be larger. For Novaya Zemlya, the thinning rate is largest near the glacier front, with high average frontal thinning of, e.g., −0.92 m a−1 from 2003 to 2009 (Moholdt and others, Reference Moholdt, Wouters and Gardner2012). The thinning pattern for Franz Josef Land is more erratic, with strong glacial thickening in some areas and strong glacial thinning confined to a small number of glaciers (Moholdt and others, Reference Moholdt, Wouters and Gardner2012, Sommer and others, Reference Sommer, Seehaus, Glazovsky and Braun2022).
Using a fixed glacier geometry means we do not account for frontal retreat or advance. Even small changes in glacier geometry can lead to significant variations in the total climatic mass balance, especially in the lower ablation zone, where melt rates are highest (e.g. Østby and others, Reference Østby, Vikhamar Schuler, Ove Hagen, Hock, Kohler and Reijmer2017). Outlines of glaciers at various time intervals are available through the Global Land Ice Measurements from Space (GLIMS) database (GLIMS Consortium, 2005, Raup and others, Reference Raup, Racoviteanu, Khalsa, Helm, Armstrong and Arnaud2007), though outlines are only available after 2000 for these areas. For Franz Josef Land, we create a glacier mask for the early 2000s (a mixture of outlines from 2002 to 2006) and for 2016. Our analysis shows that using these two different glacier masks, which are about 10 years apart, results in an average change in climatic mass balance of only 0.4%. For Novaya Zemlya, we establish a glacier mask for the early 2000s (2002–04) and for 2019. The analysis indicates an average difference in climatic mass balance of 5.4% between these masks, which are approximately 15 years apart. While limited information is available on the frontal position of glaciers in Franz Josef Land, Novaya Zemlya has shown greater retreat from 2000 to 2020 compared to earlier decades (Carr and others, Reference Carr, Murphy, Nienow, Jakob and Gourmelen2023). Therefore, we assume that errors due to geometry changes are smaller before 2000 than the values we found here.
6. Conclusion
We present a detailed estimate of the climatic mass balance of Franz Josef Land and Novaya Zemlya, simulated with a full energy balance model at a 2.5 × 2.5 km horizontal resolution from 1991 to 2022. These results provide an estimate of the changes in runoff and climatic mass balance, in a region where temperatures are increasing at high rates but not many in situ observations are available. These results may, therefore, be useful to estimate, e.g., changes in the freshwater input from glacier runoff to the Barents Sea region.
In the model simulations, we find no significant trend in the annual climatic mass balance over the simulation period, 1991/92 to 2021/22, for both Novaya Zemlya and Franz Josef Land. The average climatic mass balance is positive for both regions, with values of 0.21 m w.e. a−1 for Franz Josef Land and 0.07 m w.e. a−1 for Novaya Zemlya, but there is a tendency towards more frequent high melt years after 2010. By comparing our results to the geodetic estimate by Hugonnet and others Reference Hugonnet(2021), we get an estimate of the frontal ablation rate from 2000 to 2019 of  $-0.49\pm0.32$ m w.e. a−1 for Franz Josef Land and
  $-0.60\pm0.47$ m w.e. a−1 for Novaya Zemlya. Thus, due to the large contribution of frontal ablation in these regions, the glaciers in these areas are still losing mass on average.
We find that glaciers in both regions experienced extreme mass loss in 2013, 2020 and 2022, due to high summer air temperatures and an increase in the contribution of turbulent fluxes. These extreme melt years coincide with years of low sea ice extent in the Barents Sea region. On the other hand, in, e.g., 2009/10 and 2013/14, the simulations show strong positive mass balance, even during the summer. In these years, glaciers in both areas experienced above-average winter accumulation, in addition to below average summer melt due to low air temperatures and summer snow events.
Although there is no significant trend in the annual climatic mass balance, there is a significant increasing trend in the glacier runoff from both regions. The largest trend is found in Novaya Zemlya of 0.20 m w.e. a−1. A smaller, but still significant, trend is found for Franz Josef Land, of 0.11 m w.e. decade−1. The average runoff over the simulation period is 0.24 m w.e. a−1 for Franz Josef Land and 0.76 m w.e. a−1 for Novaya Zemlya.
In general, we find that 2020 was a year with highly negative mass balance, with particularly Franz Josef Land experiencing an extreme melt year. This is attributed to an increase in the sensible heat flux and a decrease in radiative cooling.
Data availability statement
The simulations described in this paper at monthly and daily resolutions are available at https://doi.org/10.21343/k5gq-bh33 (Schmidt, Reference Schmidt2023). They can be used for a wide range of applications, e.g. as input for runoff, ocean circulation or ecosystem models.
CARRA data (Schyberg and others, Reference Schyberg2020) were downloaded from the Copernicus Climate Change Service (C3S) Climate Data Store. The results contain modified Copernicus Climate Change Service information 2022. Neither the European Commission nor ECMWF is responsible for any use that may be made of the Copernicus information or data it contains.
The CryoGrid community model is hosted on Github. The source code is available at https://github.com/CryoGrid/CryoGridCommunity_source.
Acknowledgements
We are grateful to Lara Ferrighi and Øystein Godøy for their valuable help with data archiving. The research conducted in this study was funded by the Research Council of Norway through the Nansen Legacy project (NFR-276730). The simulations were performed on resources provided by the Department of Geosciences, University of Oslo. We thank the editor Shad O’Neel and two anonymous reviewers for their constructive comments, which improved the clarity of this manuscript.


 Open access