

Preamble
While we started working on this project in the early 2010, we wanted to investigate the power of high-frequency identification in overcoming the empirical puzzles related to the impact of monetary policy in small open economies. With this aim, we combined the identification scheme of monetary policy shocks based on external instruments and high-frequency identification with block exogeneity restrictions to account for the effect of foreign forces on the transmission mechanism of monetary policy in small open economies like the UK. We found that the high-frequency identification is powerful to overcome two prominent empirical puzzles related to the increase in prices and a weak and often statistically insignificant appreciation of the exchange rate in response to a contractionary monetary policy shock, known as the price and exchange rate puzzle, respectively. The analysis also supports the relevance of long-term yields for changes in economic activity.
Since our initial investigation, several studies have improved and refined the estimation of the effect of monetary policy shocks in small open economies using a high-frequency identification approach, and the availability of intraday and even shorter frequency data for several small open economies has further advanced knowledge on the subject. Instead of discussing the details of the vast and substantial new work in this literature, we refer the reader to the second chapter in the Handbook of Macroeconomics by Ramey (Reference Ramey and Ramey>2016) who provides a comprehensive overview on the recent literature on the identification of monetary policy shocks, and the more focused, recent studies on high-frequency identification by Altavilla et al. (Reference Altavilla, Brugnolini, Gurkaynak, Motto and Ragusa>2019) and Miranda-Agrippino and Ricco (Reference Miranda-Agrippino and Ricco>2020).
1. Introduction
This paper assesses the transmission of monetary policy shocks in the UK.Footnote 1 The analysis uses a vector autoregression model (VAR) that comprises domestic and foreign variables and identifies monetary policy shocks using external instruments in the form of surprise changes in market rates that occur within a 2-day window around monetary policy announcements. The estimation imposes block exogeneity restrictions to estimate parameters from the viewpoint of the small open economy. This identification strategy detects large and persistent effects of monetary policy shocks and points to a critical role of exchange rates and term premia for the transmission of monetary policy shocks. The analysis resolves empirical puzzles related to the response of inflation and the exchange rate to monetary policy shocks in recursive identification methods.
Our identification strategy is powerful in addressing two problematic assumptions of recursive identification schemes of monetary policy shocks in small open economies. First, recursive identification methods impose timing restrictions on the effect of monetary policy shocks, restricting the domestic interest rate to have a lagged effect on macroeconomic variables. This restriction is unrealistic for VAR models with financial variables and exchange rates since these variables react immediately to monetary policy shocks.Footnote 2 Our identification scheme relaxes this restriction and allows all the variables in the VAR model to respond simultaneously to exogenous changes in monetary policy. The identifying assumption is that surprise changes in market rates within a narrow time window are mainly due to monetary policy shocks and therefore are orthogonal to movements in nonmonetary shocks. Second, traditional estimation of VAR models for small open economies does not assume independence of foreign variables from movements in domestic variables, which is a central assumption in small open economy models.Footnote 3 Our identification strategy instead imposes block exogeneity restrictions that isolate the foreign economy from movements in the domestic variables and therefore estimates the VAR model from the viewpoint of the small open economy.
Our study reveals several important results. First, monetary policy shocks have large and persistent effects on output and yields of long maturities. A monetary policy shock that raises the domestic policy rate by 25 basis points reduces output (proxied by industrial production) by approximately $0.25\%$
within 1 year. We show that the same VAR model estimated with recursive identification methods leads to a smaller decrease in output of
$0.25\%$
within 1 year. We show that the same VAR model estimated with recursive identification methods leads to a smaller decrease in output of $0.17\%$
. Our findings are similar to those in Cloyne and Hurtgen (Reference Cloyne and Hurtgen>2016), who identify the effect of a monetary policy shock for the UK economy using the narrative approach in Romer and Romer (Reference Romer and Romer>2004) on a new real-time forecast data. With our identification scheme, the 10-year government bond yield increases by
$0.17\%$
. Our findings are similar to those in Cloyne and Hurtgen (Reference Cloyne and Hurtgen>2016), who identify the effect of a monetary policy shock for the UK economy using the narrative approach in Romer and Romer (Reference Romer and Romer>2004) on a new real-time forecast data. With our identification scheme, the 10-year government bond yield increases by $32$
basis points in response to the monetary policy shock whereas it falls by
$32$
basis points in response to the monetary policy shock whereas it falls by $11$
basis points under recursive identification methods. The rise in the 10-year government bond yield in our identification scheme conforms with the theory of the term structure of interest rates that links movements in long yields to a weighted average of present and expected short yields. This finding reveals that rates with long maturities bear information about expected changes in future economic activity that entail an important propagation channel for monetary policy shocks in small open economies. Our analysis therefore provides support for the relevance of long-term yields for movements in economic activity.Footnote
4
$11$
basis points under recursive identification methods. The rise in the 10-year government bond yield in our identification scheme conforms with the theory of the term structure of interest rates that links movements in long yields to a weighted average of present and expected short yields. This finding reveals that rates with long maturities bear information about expected changes in future economic activity that entail an important propagation channel for monetary policy shocks in small open economies. Our analysis therefore provides support for the relevance of long-term yields for movements in economic activity.Footnote
4
Second, we find that a 25-basis point increase in the domestic interest rate significantly decreases the price level by $0.12\%$
within 2 years. This result sharply contrasts with those from recursive identification methods that instead detect a rise in inflation in response to an unexpected tightening in monetary policy, an empirical phenomenon labeled “price puzzle,” originally established by Sims (Reference Sims>1992) on UK data.Footnote
5
We show that the counterfactual increase in inflation detected by recursive identification methods is tightly linked with the behavior of financial markets, as encapsulated by the counterfactual decrease in the 10-year government bonds. The decline in long-yield bonds is consistent with a strong economy and therefore rising inflation. Thus, our analysis shows that empirically plausible movements in the term premia are critical for a realistic response of inflation to changes in monetary policy.
$0.12\%$
within 2 years. This result sharply contrasts with those from recursive identification methods that instead detect a rise in inflation in response to an unexpected tightening in monetary policy, an empirical phenomenon labeled “price puzzle,” originally established by Sims (Reference Sims>1992) on UK data.Footnote
5
We show that the counterfactual increase in inflation detected by recursive identification methods is tightly linked with the behavior of financial markets, as encapsulated by the counterfactual decrease in the 10-year government bonds. The decline in long-yield bonds is consistent with a strong economy and therefore rising inflation. Thus, our analysis shows that empirically plausible movements in the term premia are critical for a realistic response of inflation to changes in monetary policy.
Third, our identification scheme produces large and empirically plausible movements in the exchange rate. The exchange rate appreciates by $1.6\%$
on impact in response to a 25-basis point increase in the domestic interest rate, which then quickly depreciates. The interest rate differential induced by the contractionary domestic monetary policy is offset by expected future depreciation in the domestic currency, a consistent finding with the exchange rate overshooting hypothesis described by Dornbusch (Reference Dornbusch>1976). We show that this finding is in sharp contrast with the results from an identical VAR model estimated with a recursive identification method, which finds that a contractionary domestic monetary policy induces an extremely weak appreciation in the domestic currency that becomes statistically insignificant from the second period after the shock.Footnote
6
$1.6\%$
on impact in response to a 25-basis point increase in the domestic interest rate, which then quickly depreciates. The interest rate differential induced by the contractionary domestic monetary policy is offset by expected future depreciation in the domestic currency, a consistent finding with the exchange rate overshooting hypothesis described by Dornbusch (Reference Dornbusch>1976). We show that this finding is in sharp contrast with the results from an identical VAR model estimated with a recursive identification method, which finds that a contractionary domestic monetary policy induces an extremely weak appreciation in the domestic currency that becomes statistically insignificant from the second period after the shock.Footnote
6
Our study is related to the realm of research that focuses on the monetary transmission mechanism in the UK. Ellis et al. (Reference Ellis, Mumtaz and Zabczyk>2014) and Mountford (Reference Mountford>2005) use sign restrictions on structural VAR and Factor-Augmented Vector Autoregressive models to study the transmission mechanism of an array of macroeconomic shocks in the UK and find a limited role for monetary policy shocks. Cloyne and Hurtgen (Reference Cloyne and Hurtgen>2016) use the narrative approach in Romer and Romer (Reference Romer and Romer>2004) to identify monetary policy shocks on UK data and find similar results to ours. These studies focus on real activity and inflation, and instead they abstract from open economy issues and the inclusion of financial variables, which are central to our investigation. Sims (Reference Sims>1992) is the seminal study to show anomalies related to movements in inflation and exchange rates using a recursive identification scheme estimated on UK data. Cushman and Zha (Reference Cushman and Zha>1997) show that the prize puzzle disappears using block exogeneity restrictions in a VAR model identified with Cholesky restriction on Canadian data. Similar to these studies, our work addresses important empirical puzzles, but we also focus on a broader set of variables and take advantage of the information in financial and exchange rate markets using a less restrictive identification scheme. Our analysis is also closely related to recent studies by Cesa-Bianchi et al. (Reference Cesa-Bianchi, Thwaites and Vicondoa>2016) and Miranda-Agrippino and Ricco (Reference Miranda-Agrippino and Ricco>2017, Reference Miranda-Agrippino and Ricco>2020) that identify the effect of monetary policy surprises on the economy using high-frequency data for the UK. We show that an analysis based on a 2-day window around monetary policy announcements produces robust and consistent results compared to monetary policy instruments derived from data with intraday window.
The analysis also relates to the studies that identify monetary policy shocks using external instruments. Our methodology is similar to Mertens and Ravn (Reference Mertens and Ravn>2013, Reference Mertens and Ravn>2014), who use external instruments to investigate the dynamic effects of changes in taxes and tax multipliers. Stock and Watson (Reference Stock and Watson>2012) use external instruments to estimate the effect of six structural shocks, including monetary policy shocks, to investigate alternative explanations of the Great Recession. Gertler and Karadi (Reference Gertler and Karadi>2015) use a similar methodology to estimate the effect of monetary policy shocks and the role of forward guidance. Similar to these studies, our investigation identifies monetary policy shocks using external instruments, but our analysis focuses on the monetary transmission mechanism in a small open economy for a wider set of variables, including financial variables and exchange rates.
The remainder of the paper is organized as follows. Section 2 outlines the VAR model and the identification scheme. Section 3 presents the selection criteria for external instruments and discusses the findings. Section 4 performs robustness analyses. Section 5 concludes.
2. The identification scheme
In this section, we describe the VAR model and the identification scheme based on external instruments.
Consider the structural VAR model:
 \begin{equation} Ax_{t}=\sum \limits _{j=1}^{p}C(j)x_{t-j}+\varepsilon _{t}, \end{equation}
where $x_{t}$
is the vector of variables,
$x_{t}$
is the vector of variables, $A$
, and
$A$
, and $C(j)$
with
$C(j)$
with $j\geq 1$
are conformable coefficient matrices and
$j\geq 1$
are conformable coefficient matrices and $\varepsilon _{t\text{ }}$
is a vector of white noise structural shocks. Multiplying each side of equation (1) by
$\varepsilon _{t\text{ }}$
is a vector of white noise structural shocks. Multiplying each side of equation (1) by $A^{-1}$
yields the reduced-form VAR representation
$A^{-1}$
yields the reduced-form VAR representation
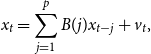 \begin{equation} x_{t}=\sum \limits _{j=1}^{p}B(j)x_{t-j}+v_t,\text{ } \end{equation}
where $B(j)=A^{-1}C(j)$
,
$B(j)=A^{-1}C(j)$
, $v_t= S\varepsilon _{t}$
,
$v_t= S\varepsilon _{t}$
, $S=A^{-1}$
, and
$S=A^{-1}$
, and $p$
is the number of lags. The variance-covariance matrix of the reduced-form representation (2) is
$p$
is the number of lags. The variance-covariance matrix of the reduced-form representation (2) is $E[v_{t},v_{t}^{\prime }]=E[SS^{\prime }]=\Sigma$
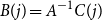
. Partitioning equation (2) between domestic (
$E[v_{t},v_{t}^{\prime }]=E[SS^{\prime }]=\Sigma$
. Partitioning equation (2) between domestic ( $y_{t}$
) and foreign (
$y_{t}$
) and foreign ( $y^{*}_{t}$
) variables yields
$y^{*}_{t}$
) variables yields
 \begin{equation} \left [ \begin{array}{c} y_{t} \\[5pt] y^{*}_{t}\end{array}\right ] =\sum \limits _{j=1}^{p}\left [ \begin{array}{c@{\quad}c} B_{11}(j) & B_{12}(j) \\[5pt] B_{21}(j) & B_{22}(j)\end{array}\right ] \left [ \begin{array}{c} y_{t-j} \\[5pt] y^{*}_{t-j}\end{array}\right ] +\left [ \begin{array}{c} u_{t} \\[5pt] u^{*}_{t}\end{array}\right ], \end{equation}
where $B_{11}(j)$
,
$B_{11}(j)$
, $B_{12}(j)$
,
$B_{12}(j)$
, $B_{21}(j)$
, and
$B_{21}(j)$
, and $B_{22}(j)$
are conformable coefficient matrices associated with domestic and foreign variables, and
$B_{22}(j)$
are conformable coefficient matrices associated with domestic and foreign variables, and $u_{t}$
and
$u_{t}$
and $u^{*}_{t}$
are the reduced-form shocks for domestic and foreign variables, respectively. The reduced-form shocks are a function of the structural shocks such that
$u^{*}_{t}$
are the reduced-form shocks for domestic and foreign variables, respectively. The reduced-form shocks are a function of the structural shocks such that
 \begin{equation} \left [ \begin{array}{c} u_{t} \\[5pt] u^{*}_{t}\end{array}\right ] = \left [ \begin{array}{c@{\quad}c} S_{11} & S_{12} \\[5pt] S_{21} & S_{22}\end{array}\right ] \left [ \begin{array}{c} \epsilon _{t} \\[5pt] \epsilon ^{*}_{t}\end{array}\right ], \end{equation}
where $\epsilon _{t}$
and
$\epsilon _{t}$
and $\epsilon ^{*}_{t}$
are vectors of the structural shocks to domestic and foreign variables, respectively.
$\epsilon ^{*}_{t}$
are vectors of the structural shocks to domestic and foreign variables, respectively.
To estimate the VAR model, we impose block exogeneity restrictions that prevent changes in domestic variables to affect foreign variables while allowing foreign variables to be a source of economic fluctuations for the domestic economy. These restrictions amount to imposing $B_{21}(j)=0$
for
$B_{21}(j)=0$
for $j=1,2,\ldots,p$
in the reduced-form VAR model in equation (3). They enable us to estimate the coefficients in the VAR model from the viewpoint of the small open economy. Our use of block exogeneity restrictions builds on work by Cushman and Zha (Reference Cushman and Zha>1997) that uses similar restrictions to identify monetary policy shocks with standard Cholesky decomposition methods, showing that they improve the identification of monetary policy shocks in open economies. We use least squares estimation of the reduced form (3) to obtain estimates of the coefficients in each matrix
$j=1,2,\ldots,p$
in the reduced-form VAR model in equation (3). They enable us to estimate the coefficients in the VAR model from the viewpoint of the small open economy. Our use of block exogeneity restrictions builds on work by Cushman and Zha (Reference Cushman and Zha>1997) that uses similar restrictions to identify monetary policy shocks with standard Cholesky decomposition methods, showing that they improve the identification of monetary policy shocks in open economies. We use least squares estimation of the reduced form (3) to obtain estimates of the coefficients in each matrix $B_{11}(j)$
,
$B_{11}(j)$
, $B_{12}(j)$
, and
$B_{12}(j)$
, and $B_{22}(j)$
that are necessary to simulate the model and derive the reduced-form residuals for the domestic economy (
$B_{22}(j)$
that are necessary to simulate the model and derive the reduced-form residuals for the domestic economy ( $u_{t}$
) and the foreign economy (
$u_{t}$
) and the foreign economy ( $u^{*}_{t}$
).
$u^{*}_{t}$
).
To identify the effect of domestic monetary policy shocks, $\epsilon _{r,t}$
, we partially identify the matrix
$\epsilon _{r,t}$
, we partially identify the matrix $S$
. Let
$S$
. Let $s$
denote the column of
$s$
denote the column of $S$
associated with the impact of the structural domestic policy shock
$S$
associated with the impact of the structural domestic policy shock $\epsilon _{r,t}$
. Partition
$\epsilon _{r,t}$
. Partition $s$
as
$s$
as
 \begin{equation} s = \left [ \begin{array}{c} s_{1} \\[5pt] s_{2} \end{array}\right ], \end{equation}
where $s_1$
is the on-impact response of domestic variables to one unit of domestic monetary shock,
$s_1$
is the on-impact response of domestic variables to one unit of domestic monetary shock, $\epsilon _{r,t}$
and
$\epsilon _{r,t}$
and $s_2$
is the on-impact response of foreign variables to
$s_2$
is the on-impact response of foreign variables to $\epsilon _{r,t}$
. Note that the block exogeneity restrictions that prevent changes in domestic variables to affect foreign variables impy that
$\epsilon _{r,t}$
. Note that the block exogeneity restrictions that prevent changes in domestic variables to affect foreign variables impy that $s_2=0$
.
$s_2=0$
.
We estimate $s_1$
using an instrumental variables approach that follows the methodology developed by Stock and Watson (Reference Stock and Watson>2012) and Mertens and Ravn (Reference Mertens and Ravn>2013). A valid instrumental variable
$s_1$
using an instrumental variables approach that follows the methodology developed by Stock and Watson (Reference Stock and Watson>2012) and Mertens and Ravn (Reference Mertens and Ravn>2013). A valid instrumental variable $m_{t}$
is correlated with the primitive monetary shock
$m_{t}$
is correlated with the primitive monetary shock $\epsilon _{r,t}$
(i.e.
$\epsilon _{r,t}$
(i.e. $\mathbb{E}(m_{t}\epsilon _{r,t})\neq 0$
) and is orthogonal to any other structural shock in the VAR model (i.e.
$\mathbb{E}(m_{t}\epsilon _{r,t})\neq 0$
) and is orthogonal to any other structural shock in the VAR model (i.e. $\mathbb{E}(m_{t}\epsilon _{k,t})=0$
, for
$\mathbb{E}(m_{t}\epsilon _{k,t})=0$
, for $k\neq r$
). The contemporary response
$k\neq r$
). The contemporary response $s_1$
is estimated by regressing all reduced-form nonmonetary policy shocks in the domestic block on the reduced-form monetary policy shock
$s_1$
is estimated by regressing all reduced-form nonmonetary policy shocks in the domestic block on the reduced-form monetary policy shock $u_{r,t}$
using
$u_{r,t}$
using $m_{t}$
as an instrument. Since
$m_{t}$
as an instrument. Since $m_{t}$
is orthogonal to nonmonetary shocks, the instrumental estimation yields a consistent estimate for
$m_{t}$
is orthogonal to nonmonetary shocks, the instrumental estimation yields a consistent estimate for $s_1$
.Footnote
7
We normalize
$s_1$
.Footnote
7
We normalize $s_1$
to represent a monetary shock of
$s_1$
to represent a monetary shock of $25$
basis points.
$25$
basis points.
3. Estimation
This section describes the data and discusses the selection of external instruments. It presents and compares the results from our identification method with those from a standard recursive identification scheme.
3.1 Data
We use monthly frequency data for the period January 1994 $-$
December 2007 on a variety of economic and financial variables for the UK (domestic economy) and the US (foreign economy).Footnote
8
To focus on a stable time period, we chose the sample to coincide with the introduction of inflation targeting and a permanent flexible exchange rate in the UK, which excludes the period of the financial crisis.Footnote
9
$-$
December 2007 on a variety of economic and financial variables for the UK (domestic economy) and the US (foreign economy).Footnote
8
To focus on a stable time period, we chose the sample to coincide with the introduction of inflation targeting and a permanent flexible exchange rate in the UK, which excludes the period of the financial crisis.Footnote
9
The vector of domestic variables is defined as $y_{t}=(g_{t},p_{t},\pi _{t},r_{t},{\unicode[Times]{x00A3}}_{t},f_{t},i_{t})^{\prime }$
. It comprises readings for real activity as measured by industrial production (
$y_{t}=(g_{t},p_{t},\pi _{t},r_{t},{\unicode[Times]{x00A3}}_{t},f_{t},i_{t})^{\prime }$
. It comprises readings for real activity as measured by industrial production ( $g_{t}$
) and the manufacturing Purchasing Managers Index (
$g_{t}$
) and the manufacturing Purchasing Managers Index ( $p_{t}$
), inflation (
$p_{t}$
), inflation ( $\pi _{t}$
) as measured by changes in the Consumer Price Index index, the domestic policy rate (
$\pi _{t}$
) as measured by changes in the Consumer Price Index index, the domestic policy rate ( $r_{t}$
), and three financial variables that include the exchange rate index for the pound sterling (
$r_{t}$
), and three financial variables that include the exchange rate index for the pound sterling ( ${\unicode[Times]{x00A3}}_{t}$
), returns to the Financial Times Stock Exchange (FTSE) Index (
${\unicode[Times]{x00A3}}_{t}$
), returns to the Financial Times Stock Exchange (FTSE) Index ( $f_{t}$
) and nominal yields to 10-year government bonds (
$f_{t}$
) and nominal yields to 10-year government bonds ( $i_{t}$
).Footnote
10
The vector of foreign variables (
$i_{t}$
).Footnote
10
The vector of foreign variables ( $y^{*}_{t}$
) comprises the US policy rate (
$y^{*}_{t}$
) comprises the US policy rate ( $r^{*}_{t}$
).Footnote
11
Appendix A provides description and sources of the data.Footnote
12
$r^{*}_{t}$
).Footnote
11
Appendix A provides description and sources of the data.Footnote
12
3.2 Selection of external instruments
We construct external instruments for monetary policy shocks by measuring surprise changes in market interest rates in a short-time frame around the Monetary Policy Committee (MPC) policy announcements. The interest rates we consider are as follows: the 1-month libor rate (libor-1m), the 3-month libor rate (libor-3m), the 6-month libor rate (libor-6m) and the 12-month libor rate (libor-12m). These particular interest rates are chosen since they broadly capture the market’s expectations on the policy rate. Important for our analysis, we assume surprise changes in the rates in a short-time frame around MPC announcements are orthogonal to nonmonetary shocks included in the VAR model. As discussed in Kuttner (Reference Kuttner>2001), the inflow of news in a short-time frame that contains monetary policy events is dominated by monetary policy announcements, and policy announcements do not disclose private information of the central bank and do not affect risk premia of the short-term interest rates we consider. Faust et al. (Reference Faust, Swanson and Wright>2004) document that surprise changes in the federal funds futures rate due to policy announcement do not contain the Fed’s private information on macroeconomic indicators. Similarly, Piazzesi and Swanson (Reference Piazzesi and Swanson>2008) establish that surprise changes in the federal funds futures rate in a short-time frame around Fed announcements do not encompass risk premia. Thus, changes in the short-term interest rate before and after monetary policy announcements can be treated as changes in the level of monetary policy.Footnote 13 Piazzesi and Cochrane (Reference Piazzesi and Cochrane>2002) measure monetary shocks as changes in the 1-month Eurodollar rate a day before and a day after Fed policy announcements. They show that monetary policy surprises constructed in this way are powerful estimates of monetary shocks.Footnote 14 A number of studies embed the assumption that surprise changes in market interest rates within a short-time frame are good measures for monetary shocks.Footnote 15
We measure surprise changes in the interest rates in a 2-day window within monetary policy MPC policy rate announcements. Since libor rates are set and reported at 11:00 a.m., 1 hour earlier than MPC announcements at 12:00 p.m., we do not expect libor rates to respond to monetary policy on the same day. However, a careful inspection of the data shows that libor rates occasionally change on the day of policy announcements. For example, the 6-month libor rate jumped to 5.44% from 5.38% on 12 January 1994, when the Bank of England decided to keep Bank Rate unchanged, and they reverted to 5.38% 1 day later. In another instance, on 8 February 1994, the Bank of England cut its Bank Rate by 25 basis points. The rate cut was recorded in the 6-month libor rate on the day of announcement but not 1 day later. Dating errors lead to abnormal changes on announcement dates. To deal with the issue of potential dating errors, we follow the approach in Piazzesi and Cochrane (Reference Piazzesi and Cochrane>2002) and define unexpected changes in libor rates due to policy announcements as the move from 1 day before to 1 day after policy announcements.Footnote 16 As a robustness check, we discuss results from instruments measured in a 1-day window in section 4.
Regressing VAR residuals from the monetary equation on external instruments for monetary shocks

Notes: This table reports results for regressing residuals from the monetary policy equation in (2) on various external instruments as shown in the columns. Both VAR residuals from the monetary equation and instruments are expressed in percentage points. The sample is monthly, from January 1994 to December 2007.
To address the problem of weak instruments, we statistically test the degree of correlation of the instruments with reduced-form residuals from the monetary policy equation in the VAR model ( $u_{r,t}$
) using
$u_{r,t}$
) using $F$
-statistics from the first-stage regression. Stock et al. (Reference Stock, Wright and Yogo>2002) suggest that a value of the
$F$
-statistics from the first-stage regression. Stock et al. (Reference Stock, Wright and Yogo>2002) suggest that a value of the $F$
-statistics lower than
$F$
-statistics lower than $10$
is evidence of weak instruments. Table 1 shows values of
$10$
is evidence of weak instruments. Table 1 shows values of $F$
-statistics from regressing VAR residuals of the monetary policy equation (
$F$
-statistics from regressing VAR residuals of the monetary policy equation ( $u_{r,t}$
) on external instruments (
$u_{r,t}$
) on external instruments ( $m_{t}$
). The
$m_{t}$
). The $F$
-statistics show that all of the four instruments have values higher than 10 and therefore avoid the weak instrument problem. While all four instruments are statistically valid, we need to ensure that rate surprises do not result from timing shocks, which reflect a surprise in the timing of rate changes rather than a surprise in the expected level of future interest rates. As discussed in Bernanke and Kuttner (Reference Bernanke and Kuttner>2005), this distinction is critical for estimating the impact of monetary policy shocks since shocks that alter the level of interest rates in the near future have stronger impact on the economy than shocks that reflect unanticipated timing in the monetary policy shock.
$F$
-statistics show that all of the four instruments have values higher than 10 and therefore avoid the weak instrument problem. While all four instruments are statistically valid, we need to ensure that rate surprises do not result from timing shocks, which reflect a surprise in the timing of rate changes rather than a surprise in the expected level of future interest rates. As discussed in Bernanke and Kuttner (Reference Bernanke and Kuttner>2005), this distinction is critical for estimating the impact of monetary policy shocks since shocks that alter the level of interest rates in the near future have stronger impact on the economy than shocks that reflect unanticipated timing in the monetary policy shock.
To investigate whether timing shocks substantially affect libor rate surprises, Figure 1 plots surprise changes in libor rates of different maturities. The left panel plots surprise changes in the 6-month libor rate against surprise changes in the 1-month rate. The right panel plots surprise changes in the 3-month libor rate against surprise changes in the 1-month rate. The 45-degree line corresponds to a one-for-one response of the 6-month libor rate to the 1-month libor rate. Observations lying below the 45-degree line in the northeast quadrant and above the southwest quadrant are those associated with a less than one-for-one effect on the surprise changes in the 6-month libor rate; those lying along a steeper line had a greater than one-for-one effect. Regressing surprise changes in the 6-month libor rate on surprise changes in the 1-month libor rate yields an estimated slope of 0.63, which is significantly different from $1$
at the
$1$
at the $1\%$
level. Similarly, a regression of surprise changes in the 3-month libor rate on surprise changes in the 1-month libor rate yields an estimated slope of 0.69, which is also significantly different from
$1\%$
level. Similarly, a regression of surprise changes in the 3-month libor rate on surprise changes in the 1-month libor rate yields an estimated slope of 0.69, which is also significantly different from $1$
at the
$1$
at the $1\%$
level. This analysis suggests that the generally stronger responses of the 1-month libor rate to MPC decisions may capture timing shocks, which have smaller impacts on 3- and 6-month libor rates. Thus, we choose the 6-month rate as our preferred instrument since it avoids the weak instrument problem and is less affected by timing shocks than surprises in the 1- and 3-month libor rate. Surprise changes in the 12-month rate are less affected by timing shocks than surprise changes in the 6-month libor rate. But the instrument is marginally weak for our estimation as shown in Table 1. In other words, we have selected our preferred instrument, 6-month libor rate surprises, to minimize the impact of timing monetary shocks as much as possible. Nevertheless results using the 12-month libor rates are similar to the baseline results. In Section 4, we perform robustness analysis to further investigate the selection of external instruments using principal component analysis.
$1\%$
level. This analysis suggests that the generally stronger responses of the 1-month libor rate to MPC decisions may capture timing shocks, which have smaller impacts on 3- and 6-month libor rates. Thus, we choose the 6-month rate as our preferred instrument since it avoids the weak instrument problem and is less affected by timing shocks than surprises in the 1- and 3-month libor rate. Surprise changes in the 12-month rate are less affected by timing shocks than surprise changes in the 6-month libor rate. But the instrument is marginally weak for our estimation as shown in Table 1. In other words, we have selected our preferred instrument, 6-month libor rate surprises, to minimize the impact of timing monetary shocks as much as possible. Nevertheless results using the 12-month libor rates are similar to the baseline results. In Section 4, we perform robustness analysis to further investigate the selection of external instruments using principal component analysis.
Surprise changes in libor rates. Notes: This graph shows common and idiosyncratic components of surprise changes in the 1-, 3- and 6-month libor rates due to MPC announcement. The left panel plots surprise changes in the 6-month libor rate against surprise changes in the 1-month rate. The right panel plots surprise changes in the 3-month libor rate against surprise changes in the 1-month rate. The common component among the rates is shown by the strong correlations, while idiosyncratic components are manifested by loosely scattered points along the 45-degree line.

3.3 Findings
Figure 2 shows impulse responses to a 25-basis point surprise in domestic monetary policy (thick line) with $68\%$
confidence intervals (thin lines).Footnote
17
To appraise the differences between our identification method and standard recursive methods, Figure 3 shows impulse responses to a 25-basis point surprise in monetary policy using a standard Cholesky identification (thick-dashed line) with
$68\%$
confidence intervals (thin lines).Footnote
17
To appraise the differences between our identification method and standard recursive methods, Figure 3 shows impulse responses to a 25-basis point surprise in monetary policy using a standard Cholesky identification (thick-dashed line) with $68\%$
confidence bands (thin-dashed lines) alongside our identification (solid line).Footnote
18
$68\%$
confidence bands (thin-dashed lines) alongside our identification (solid line).Footnote
18
The figure shows that a 25-basis point increase in the domestic interest rate generates a significant decline in industrial production of approximately $0.25\%$
within 1 year after the shock. Figure 3 shows that the same VAR model estimated with the recursive identification method generates a decline in output of approximately
$0.25\%$
within 1 year after the shock. Figure 3 shows that the same VAR model estimated with the recursive identification method generates a decline in output of approximately $0.17\%$
within 1 year after the shock.Footnote
19
Thus, the response of output is almost twice as strong in our identification method. Our finding is consistent with the results in Cloyne and Hurtgen (Reference Cloyne and Hurtgen>2016), who estimate the effect of monetary policy shocks using the narrative approach in Romer and Romer (Reference Romer and Romer>2004) and find that industrial production declines approximately 0.5% (i.e. 2.3% in response to a 1% monetary policy shock).
$0.17\%$
within 1 year after the shock.Footnote
19
Thus, the response of output is almost twice as strong in our identification method. Our finding is consistent with the results in Cloyne and Hurtgen (Reference Cloyne and Hurtgen>2016), who estimate the effect of monetary policy shocks using the narrative approach in Romer and Romer (Reference Romer and Romer>2004) and find that industrial production declines approximately 0.5% (i.e. 2.3% in response to a 1% monetary policy shock).
The baseline result. Notes: The VAR has $6$
endogenous U.K. variables: log(IP), CPI inflation, the policy rate, log(£ERI), monthly returns to the FTSE and yields to 10-year government bonds; and one exogenous variable: the Fed funds target rate. Two lags of endogenous and exogenous variables are included in the VAR model. Identification is achieved with instruments for monetary policy shocks constructed as surprise changes in the 6-month libor rate in a two-day window around MPC announcements. Cumulative responses from inflation and FTSE returns are reported. The
$6$
endogenous U.K. variables: log(IP), CPI inflation, the policy rate, log(£ERI), monthly returns to the FTSE and yields to 10-year government bonds; and one exogenous variable: the Fed funds target rate. Two lags of endogenous and exogenous variables are included in the VAR model. Identification is achieved with instruments for monetary policy shocks constructed as surprise changes in the 6-month libor rate in a two-day window around MPC announcements. Cumulative responses from inflation and FTSE returns are reported. The $68\%$
confidence interval is generated using a wild bootstrap procedure with 1000 replications. The sample is monthly, from January 1994 to December 2007.
$68\%$
confidence interval is generated using a wild bootstrap procedure with 1000 replications. The sample is monthly, from January 1994 to December 2007.

Compare instrumental identification with recursive identification. Notes: Dashed lines show median impulse responses and the $68\%$
confidence intervals from recursive identification ordering financial variables after the monetary variable. Impulse responses from our instrumental identification are shown in solid lines.
$68\%$
confidence intervals from recursive identification ordering financial variables after the monetary variable. Impulse responses from our instrumental identification are shown in solid lines.

Figure 2 shows that a 25-basis point increase in the domestic interest rate reduces the price level by $0.12\%$
within 2 years after the shock. The response is significantly different from zero and it is surrounded by a large degree of uncertainty, as captured by the large confidence interval. Mountford (Reference Mountford>2005) and Ellis et al. (Reference Ellis, Mumtaz and Zabczyk>2014) estimate weaker negative responses of the price level of
$0.12\%$
within 2 years after the shock. The response is significantly different from zero and it is surrounded by a large degree of uncertainty, as captured by the large confidence interval. Mountford (Reference Mountford>2005) and Ellis et al. (Reference Ellis, Mumtaz and Zabczyk>2014) estimate weaker negative responses of the price level of $0.04\%$
and
$0.04\%$
and $0.05\%$
, respectively. The magnitude of our results is consistent with Romer and Romer (Reference Romer and Romer>2004), who show that a 25-basis point, positive shock reduces CPI (PPI) by
$0.05\%$
, respectively. The magnitude of our results is consistent with Romer and Romer (Reference Romer and Romer>2004), who show that a 25-basis point, positive shock reduces CPI (PPI) by $0.9\%$
(
$0.9\%$
( $1.5\%$
) in 48 months. Cloyne and Hurtgen (Reference Cloyne and Hurtgen>2016) find similar results to ours on UK data. Figure 3 shows the response of the price level identified with recursive identification methods. The price level increases in response to the shock. This counterfactual response is a pervasive issue in the identification of monetary policy shocks using recursive identification schemes, as originally detected by Sims (Reference Sims>1992) and labeled “price puzzle.” Our identification scheme based on external instruments resolves this issue and generates a realistic fall in inflation in response to tightening in domestic monetary policy.Footnote
20
$1.5\%$
) in 48 months. Cloyne and Hurtgen (Reference Cloyne and Hurtgen>2016) find similar results to ours on UK data. Figure 3 shows the response of the price level identified with recursive identification methods. The price level increases in response to the shock. This counterfactual response is a pervasive issue in the identification of monetary policy shocks using recursive identification schemes, as originally detected by Sims (Reference Sims>1992) and labeled “price puzzle.” Our identification scheme based on external instruments resolves this issue and generates a realistic fall in inflation in response to tightening in domestic monetary policy.Footnote
20
Figure 2 shows that an increase of 25 basis points in the domestic interest rate generates an impact appreciation of $1.6\%$
in the exchange rate index (£ERI). The response shows that appreciation in the domestic interest rate relative to the foreign interest rate is followed by a persistent depreciation of the domestic currency. This result is consistent with the exchange rate overshooting hypothesis described by Dornbusch (Reference Dornbusch>1976) that predicts an appreciation in the nominal exchange rate in response to an increase in the interest rate followed by depreciation in the nominal exchange rate.Footnote
21
The response of the exchange rate from our identification scheme is larger than estimates from alternative identification methods. For instance, Faust et al. (Reference Faust, Rogers, Swanson and Wright>2003) use a VAR model identified by a response-matching approach and find that the peak appreciation of US dollars against UK pounds is less than
$1.6\%$
in the exchange rate index (£ERI). The response shows that appreciation in the domestic interest rate relative to the foreign interest rate is followed by a persistent depreciation of the domestic currency. This result is consistent with the exchange rate overshooting hypothesis described by Dornbusch (Reference Dornbusch>1976) that predicts an appreciation in the nominal exchange rate in response to an increase in the interest rate followed by depreciation in the nominal exchange rate.Footnote
21
The response of the exchange rate from our identification scheme is larger than estimates from alternative identification methods. For instance, Faust et al. (Reference Faust, Rogers, Swanson and Wright>2003) use a VAR model identified by a response-matching approach and find that the peak appreciation of US dollars against UK pounds is less than $1\%$
in reaction to a
$1\%$
in reaction to a $25$
-basis point shock.Footnote
22
Bjørnland (Reference Bjørnland>2009) identifies a VAR model using a long-run neutrality restriction of monetary policy on the exchange rate and finds that nominal exchange rates appreciate on impact within the range
$25$
-basis point shock.Footnote
22
Bjørnland (Reference Bjørnland>2009) identifies a VAR model using a long-run neutrality restriction of monetary policy on the exchange rate and finds that nominal exchange rates appreciate on impact within the range $0.4-1.0\%$
in four countries: Australia, Canada, New Zealand, and Sweden. Figure 3 compares the response of the exchange rate index against those estimated with recursive identification methods. The exchange rate increases by approximately
$0.4-1.0\%$
in four countries: Australia, Canada, New Zealand, and Sweden. Figure 3 compares the response of the exchange rate index against those estimated with recursive identification methods. The exchange rate increases by approximately $0.4\%$
in the first period after the shock, and it then becomes unresponsive to the monetary policy shock. This is a common counterfactual finding in VAR models identified with recursive schemes. Caglayan et al. (Reference Caglayan, Kocaaslan and Mouratidis>2013) find a similar puzzling response of exchange rate movements to the monetary policy shock in a VAR model identified with sign restrictions on UK data.
$0.4\%$
in the first period after the shock, and it then becomes unresponsive to the monetary policy shock. This is a common counterfactual finding in VAR models identified with recursive schemes. Caglayan et al. (Reference Caglayan, Kocaaslan and Mouratidis>2013) find a similar puzzling response of exchange rate movements to the monetary policy shock in a VAR model identified with sign restrictions on UK data.
Figure 2 shows that an increase of 25 basis points in the domestic interest rate generates a fall of approximately $1.8\%$
on impact in the FTSE index and the index declines by approximately
$1.8\%$
on impact in the FTSE index and the index declines by approximately $2.6\%$
within 9 months after the shock. The impact response is close to the range of values
$2.6\%$
within 9 months after the shock. The impact response is close to the range of values $0.6-1.1\%$
in Bernanke and Kuttner (Reference Bernanke and Kuttner>2005) from an event study on the effect of an increase of 25 basis points in the nominal interest rate on US equities.Footnote
23
Figure 3 shows that the response of the stock market returns estimated with recursive identification methods is similar on impact, but it becomes insensitive to the monetary policy tightening 5 months after the shock.
$0.6-1.1\%$
in Bernanke and Kuttner (Reference Bernanke and Kuttner>2005) from an event study on the effect of an increase of 25 basis points in the nominal interest rate on US equities.Footnote
23
Figure 3 shows that the response of the stock market returns estimated with recursive identification methods is similar on impact, but it becomes insensitive to the monetary policy tightening 5 months after the shock.
Figure 2 shows that an increase of 25 basis points in the domestic interest rate increases the yields to 10-year government bonds by $30$
basis points. The impact reaction of the 10-year yields is stronger than the reaction of the short-term policy rate, showing that monetary policy has powerful and persistent effects on rates with long maturities, consistent with the findings in Hanson and Stein (Reference Hanson and Stein>2015). However, the strong increase in the 10-year yields is unlinked with expectations of higher inflation (inflation falls in response to the shock), but it is generated by a rise in the term premium, which is consistent with the monetary policy channel described in models with financial frictions.Footnote
24
Figure 3 shows that the response of the yields to 10-year government bonds estimated with recursive identification methods is negative and therefore inconsistent with the theory of the term structure of the interest rate that links the increase in the short-term policy rate with a rise in rates of long-term maturities.Footnote
25
$30$
basis points. The impact reaction of the 10-year yields is stronger than the reaction of the short-term policy rate, showing that monetary policy has powerful and persistent effects on rates with long maturities, consistent with the findings in Hanson and Stein (Reference Hanson and Stein>2015). However, the strong increase in the 10-year yields is unlinked with expectations of higher inflation (inflation falls in response to the shock), but it is generated by a rise in the term premium, which is consistent with the monetary policy channel described in models with financial frictions.Footnote
24
Figure 3 shows that the response of the yields to 10-year government bonds estimated with recursive identification methods is negative and therefore inconsistent with the theory of the term structure of the interest rate that links the increase in the short-term policy rate with a rise in rates of long-term maturities.Footnote
25
4. Robustness analysis
To establish whether our baseline results are robust, we undertake a number of robustness checks on the choice of the external instruments and the specification of the VAR model.
Identification using the first principal components of monetary shocks. Notes: This graph shows median impulse responses and their $68\%$
confidence intervals (dashed lines) for a model identified with the first principal component of surprise changes in the 1-, 3-, 6- and 12-month libor rates. Impulse responses from our baseline instrumental identification are shown in solid lines.
$68\%$
confidence intervals (dashed lines) for a model identified with the first principal component of surprise changes in the 1-, 3-, 6- and 12-month libor rates. Impulse responses from our baseline instrumental identification are shown in solid lines.

We begin by investigating to what extent our instrument selection affects the results. This robustness check is particularly important since results from the $F$
-statistics in Table 1 – based on the threshold of
$F$
-statistics in Table 1 – based on the threshold of $10$
suggested by Stock et al. (Reference Stock, Wright and Yogo>2002) – show that all variables are potentially valid instruments. As shown in Figure 1, while the instruments are strongly correlated, there are substantial idiosyncratic components in the instruments as manifested by loosely scattered points along the 45-degree lines.Footnote
26
In some cases, libor rates of different maturities move against each other as a response to MPC announcements, as shown by points in the northwest and southeast quadrants. In addition, as discussed in Section 2, one particular example is the significantly less than one-for-one effect between 1- and 3/6-month libor rate surprises. To investigate the issue of idiosyncratic changes in the valid instruments, we follow the approach in Gurkaynak et al. (Reference Gurkaynak, Sack and Swanson>2005a) and use principal component analysis to extract a common “level” factor of monetary shocks derived from market rates of different maturities.Footnote
27
We then use the principal component of all the statistically valid instruments as the external instrument to identify monetary policy shocks. Gurkaynak et al. (Reference Gurkaynak, Sack and Swanson>2005a) point out that the first principal component of surprising changes in market interest rates provides information on the level shock of monetary policy, which shifts market interest rates in the same direction. Since the first principal component is a level factor that moves the 1-to-12 month libor rates in the same way, it is free of idiosyncratic changes of the libor rates, such as timing shocks that mainly affect short-term libor rates and “future policy path shocks,” mainly captured by libor rates with longer maturities.
$10$
suggested by Stock et al. (Reference Stock, Wright and Yogo>2002) – show that all variables are potentially valid instruments. As shown in Figure 1, while the instruments are strongly correlated, there are substantial idiosyncratic components in the instruments as manifested by loosely scattered points along the 45-degree lines.Footnote
26
In some cases, libor rates of different maturities move against each other as a response to MPC announcements, as shown by points in the northwest and southeast quadrants. In addition, as discussed in Section 2, one particular example is the significantly less than one-for-one effect between 1- and 3/6-month libor rate surprises. To investigate the issue of idiosyncratic changes in the valid instruments, we follow the approach in Gurkaynak et al. (Reference Gurkaynak, Sack and Swanson>2005a) and use principal component analysis to extract a common “level” factor of monetary shocks derived from market rates of different maturities.Footnote
27
We then use the principal component of all the statistically valid instruments as the external instrument to identify monetary policy shocks. Gurkaynak et al. (Reference Gurkaynak, Sack and Swanson>2005a) point out that the first principal component of surprising changes in market interest rates provides information on the level shock of monetary policy, which shifts market interest rates in the same direction. Since the first principal component is a level factor that moves the 1-to-12 month libor rates in the same way, it is free of idiosyncratic changes of the libor rates, such as timing shocks that mainly affect short-term libor rates and “future policy path shocks,” mainly captured by libor rates with longer maturities.
We find that the first principal component is a strong instrument for our identification, with $F$
-statistics from the first stage fit equal to
$F$
-statistics from the first stage fit equal to $29.6$
. It accounts for
$29.6$
. It accounts for $86\%$
of variation in the instruments.Footnote
28
Figure 4 shows the impulse responses to a 25-basis point surprise in monetary policy using the first principal component to identify monetary policy shocks (thick-dashed line) with
$86\%$
of variation in the instruments.Footnote
28
Figure 4 shows the impulse responses to a 25-basis point surprise in monetary policy using the first principal component to identify monetary policy shocks (thick-dashed line) with $68\%$
confidence intervals (thin-dashed lines). Responses from our preferred instrument (6-month labor rate) are reported (black line). The figure shows that the impulse responses from the principal component analysis are remarkably close to our baseline results. We interpret this finding as evidence that our preferred instrument accurately captures most of the information on monetary policy changes conveyed by statistically powerful instruments.Footnote
29
$68\%$
confidence intervals (thin-dashed lines). Responses from our preferred instrument (6-month labor rate) are reported (black line). The figure shows that the impulse responses from the principal component analysis are remarkably close to our baseline results. We interpret this finding as evidence that our preferred instrument accurately captures most of the information on monetary policy changes conveyed by statistically powerful instruments.Footnote
29
To ensure results are robust to the specification of our instruments, we use a narrower time window to estimate monetary policy surprises and consider changes in libor rates in a one-day window within MPC announcements. Since libor rates are set and reported before 11:00 a.m., 1 hour earlier than MPC announcements at 12:00 p.m., we measure monetary shocks as changes in libor rates in the day after announcements. Figure 5 presents the impulse responses identified with 1-day monetary shocks using the 6-month libor rate (dashed line) alongside the benchmark results. Results are generally similar to the baseline identification, although the responses of inflation and FTSE index are somewhat smaller. As explained in Section 3.2, the different responses may be due to measurement errors on the 1-day window around the policy announcements, which is reflected by the wider uncertainty around the estimated responses in the VAR model.
Measuring monetary shocks in a 1-day window. Notes: This graph shows impulse responses identified using monetary shocks measured as changes in the 6-month libor rate in a 1-day window around MPC announcements (dashed lines). Impulse responses from our baseline instrumental identification are shown in solid lines.

Finally, to ensure our identified monetary policy shocks accurately represent the exogenous component of monetary policy and are not accounting for anticipation effects, we follow the methodology in Miranda-Agrippino and Ricco (Reference Miranda-Agrippino and Ricco>2017, Reference Miranda-Agrippino and Ricco>2020) and regress our identified monetary policy shock on forecast variables from Cloyne and Hurtgen (Reference Cloyne and Hurtgen>2016) that capture information available prior to the MPC meetings. The identification of shocks based on the residual of this regression, which can be interpreted as a cleaned proxy for exogenous monetary policy shocks, produces similar impulse response functions to those of our benchmark specification.Footnote 30
5. Conclusion
This paper assessed the transmission of monetary policy shocks in the UK. Our identification scheme uses surprise changes in the policy rate within a narrow time window as external instruments and imposes block exogeneity restrictions on domestic variables to estimate parameters from the viewpoint of the domestic economy. The estimation detects large and persistent effects of monetary policy shocks on real activity and long-term yields, pointing to a critical role of the exchange rate and term premia. The analysis addresses important empirical puzzles related to movements in inflation and exchange rates in response to exogenous changes in monetary policy detected by recursive identification schemes.
The analysis offers some interesting directions for future research. The results show that unexpected changes in monetary policy generate sharp movements in the term premia that are consistent with the theory of the term structure of the interest rate. It would certainly be interesting to develop small open economy models with financial frictions that introduce yields of different maturities to identify important theoretical channels that link movements in term premia to fluctuations in economic activity. This framework will also shed light on what extent and through what mechanisms the inclusion of frictional financial markets enhances the response of exchange rates to monetary policy surprises. These extensions are open to future research.
A. Appendix: Data sources
The table below describes the data definition and sources.


 Open access