


In 2020, reports revealing paediatric cases of significant and novel systemic hyperinflammation and shock with multiorgan involvement associated with severe acute respiratory syndrome coronavirus 2 infection became more recognised. Reference Feldstein, Rose and Horwitz1–Reference Whittaker, Bamford and Kenny6 The condition is called “Multisystem inflammatory syndrome in children and adolescents temporally related to COVID-19” or “Paediatric inflammatory multisystem syndrome temporally associated with SARS-CoV-2” (PIMS-TS). 7–9 Clinical and biochemical criteria for multisystem inflammatory syndrome in children combine elevated serum levels of inflammatory markers, objective evidence of multisystemic organ involvement, and the presence of fever without any other obvious microbial cause. Clinical symptoms frequently show persistent fever, gastrointestinal symptoms, and muco-cutaneous symptoms, e.g. non-purulent conjunctivitis or diffuse erythematous polymorphic rash. Reference Feldstein, Rose and Horwitz1–Reference Verdoni, Mazza and Gervasoni3,Reference Whittaker, Bamford and Kenny6,Reference Waltuch, Gill and Zinns10–Reference Nelson, Ishimine, Hayden, Correia and Wardi14 Many reports described myocardial and coronary involvement during the acute phase of multisystem inflammatory syndrome in children, including decreased left ventricular systolic function, coronary artery dilation and aneurysms, and elevated levels of N-terminal pro b-type natriuretic peptide and troponin T. Reference Feldstein, Rose and Horwitz1–Reference Verdoni, Mazza and Gervasoni3,Reference Whittaker, Bamford and Kenny6,Reference Waltuch, Gill and Zinns10–Reference Rauf, Vijayan, John, Krishnan and Latheef13,Reference Licciardi, Pruccoli and Denina15–Reference Greene, Saleh, Roseman and Sinert18 More severe cases required mechanical ventilation, inotropic drugs, and extracorporeal membrane oxygenation. Reference Sperotto, Friedman, Son, VanderPluym, Newburger and Dionne16,Reference Belhadjer, Méot and Bajolle17,Reference Grimaud, Starck and Levy19 The majority of reports show favourable outcomes without significant short-term sequelae Reference Sperotto, Friedman, Son, VanderPluym, Newburger and Dionne16,Reference Belhadjer, Méot and Bajolle17,Reference Grimaud, Starck and Levy19 after supportive and immunosuppressive medication. Reference Harwood, Allin and Jones4,Reference Alsaied, Tremoulet and Burns20,Reference Bartoszek, Małek, Barczuk-Falęcka and Brzewski21 However, a small proportion of children seem to suffer from cardiac dysfunction at discharge. Reference Riphagen, Gomez, Gonzalez-Martinez, Wilkinson and Theocharis2,Reference Licciardi, Pruccoli and Denina15,Reference Sperotto, Friedman, Son, VanderPluym, Newburger and Dionne16,Reference Jones, Mills and Suarez22
To determine the presence of cardiac complications after multisystem inflammatory syndrome in children, recent studies recommend performing cardiac MRI as a follow-up tool. Reference Sperotto, Friedman, Son, VanderPluym, Newburger and Dionne16,Reference Zagrosek, Abdel-Aty and Boyé30 Different institutions have performed a follow-up cardiac MRI no longer than 109 days after initial symptoms showing variable, but promising results. Reference Theocharis, Wong and Pushparajah5,Reference Bartoszek, Małek, Barczuk-Falęcka and Brzewski21,Reference Prieto, Toral, LLorente, Coca and Blázquez-Gamero24–Reference Webster, Patel and Carr27
The aim of this single centre study was to evaluate the presence of persistent myocardial impairment or abnormalities of coronary arteries six months after onset of symptoms by cardiac MRI.
Methods
Study design and patients
Between December 2020 and February 2022, all patients fulfilling the World Health Organisation criteria for multisystem inflammatory syndrome in children 9 hospitalised at the paediatric department of the Kepler University Hospital Linz, Austria, were included in this retrospective, single-centre study. Left ventricular systolic function [Left Ventricular Ejection Fraction in %] was evaluated on transthoracic echocardiography in the parasternal short-axis view using the Teicholz method. Cardio-specific parameters were analysed by blood samples. Patients were included if left ventricular function was decreased (left ventricular ejection fraction < 56%) and/or cardio-specific serum parameters (troponin T > 14 ng/L, N-terminal pro b-type natriuretic peptide > 135 ng/L) were increased and/or if they had dilated coronary arteries (Z-Score ≥ 2). All patients suffering from multisystem inflammatory syndrome in children received immune-modulatory treatment including intravenous immunoglobulins, intravenous steroids, and anticoagulant therapy with aspirin according to the recommendations available at the time. Reference Harwood, Allin and Jones4,Reference Ouldali, Toubiana and Antona28 Patients were advised to remain in strict physical rest for six weeks, with limited exceptions. If transthoracic echocardiography showed no signs of left ventricular dysfunction or coronary anomaly 6 weeks after discharge patients were allowed to resume exercise and discontinue anticoagulant therapy with aspirin. Patients with congenital heart disease were excluded. This study was approved by the Ethics Committee of the Johannes Kepler University, Linz (EK Nr: 1047/2022) and was exempt from patient and parental consent.
Cardiac MRI
Cardiac MRI studies were performed 6 months after the onset of symptoms on a 1.5 T scanner (Magnetom Symphony Tim, Siemens Healthineers, Erlangen) with locally approved and standardised imaging protocols. Localiser images were obtained, followed by balanced steady-state free precession cine images in four-chamber view and short axis for ventricular volumetry and function. T2-weighted fat saturated dark blood images in four-chamber view and short axis were used as oedema-sensitive sequences to detect acute myocardial injury. T1 and T2 maps were performed free-breathing motion-corrected and electrocardiogram-triggered in short axis. T2 mapping was done as true fast imaging with steady-state precession. After the mappings, a bolus of 0.2 mmol/kg gadoterate meglumine (Dotarem, Guerbet, Aulnay-sous-Bois, France) was injected as contrast agent. Contrast-enhanced 3D whole heart imaging with respiratory navigator gating and electrocardiogram triggering enabled coronary assessment. A time-resolved angiography with interleaved stochastic trajectories showed the contrast agent transit time and helped with vessel evaluation. Late gadolinium enhancement technique was used via phase-sensitive inversion recovery images in short-axis and our-chamber view for the assessment of myocardial viability. For volumetric and functional data analysis, a dedicated cardiac MRI, post-processing software was used (syngo via, Siemens Healthineers, Erlangen). Left ventricular volume was assessed with three different variables (left ventricular end-diastolic volume index, left ventricular end-systolic volume index, and left ventricular stroke volume). Diagnosis of acute myocarditis was defined by using the Lake Louise Criteria. Studies were evaluated by a radiologist with specific expertise in cardiac MRI at our centre.
Statistical analysis
Descriptive analysis was used to describe the results. Continuous variables are shown as medians with interquartile ranges. The description of categorical data was based on absolute and relative frequencies using percentage and numbers.
Results
Between December 2020 and February 2022, 15 patients were included (80% male, n = 12/15). Eighty percent (12/15 patients) underwent cardiac MRI six months after onset of symptoms. In one patient, general anaesthesia would have been necessary due to the patient’s age, and the parents refused to give consent. Two other patients were not available during the study period. The median age was 8 years (interquartile range 4.5–13.5 years). All patients had positive serologies (immunoglobulines A and G) for severe acute respiratory syndrome coronavirus 2, while positive polymerase chain reaction tests obtained by nasopharyngeal swab were found in only 13% (2/15) of children.
All patients presented with fever, with a median duration of 4.5 days (cardiac MRI 4-5 days). Gastrointestinal symptoms [abdominal pain, vomiting, and diarrhoea] were present in nine patients (60%), followed by muco-cutaneous symptoms (rash, conjunctivitis, and lip erythema) in 13 patients (87%). Table 1 summarises the patient characteristics.
Patient characteristics
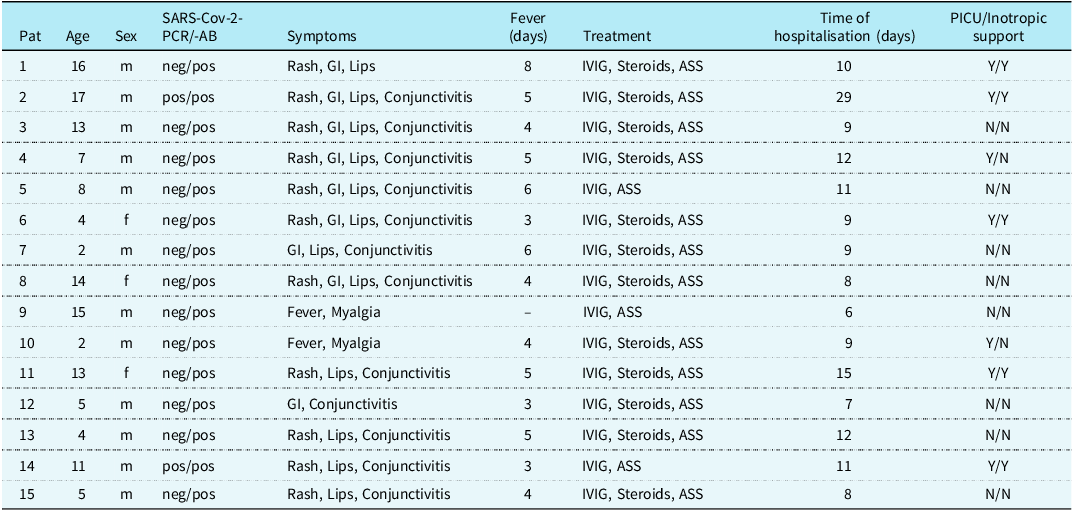
GI = gastrointestinal; IVIG = intravenous immunoglobulins; PICU = paediatric intensive care unit SARS-CoV-2 = severe acute respiratory syndrome coronavirus 2.
Inflammation parameters were elevated in all patients with median C-reactive protein values of 22 mg/dL (interquartile range 9.75–27.75 mg/dL, Table 2). Cardio-specific markers like N-terminal pro b-type natriuretic peptide were increased in 14 patients (93%) with median values of 4426 ng/L (interquartile range 3414.25–14,401.5 ng/L), whereas troponin T was increased in nine patients (60%) with median values of 38.2 ng/L (interquartile range 7.35–214.5 ng/L).
Laboratory parameters and left ventricular ejection fraction at admission and discharge
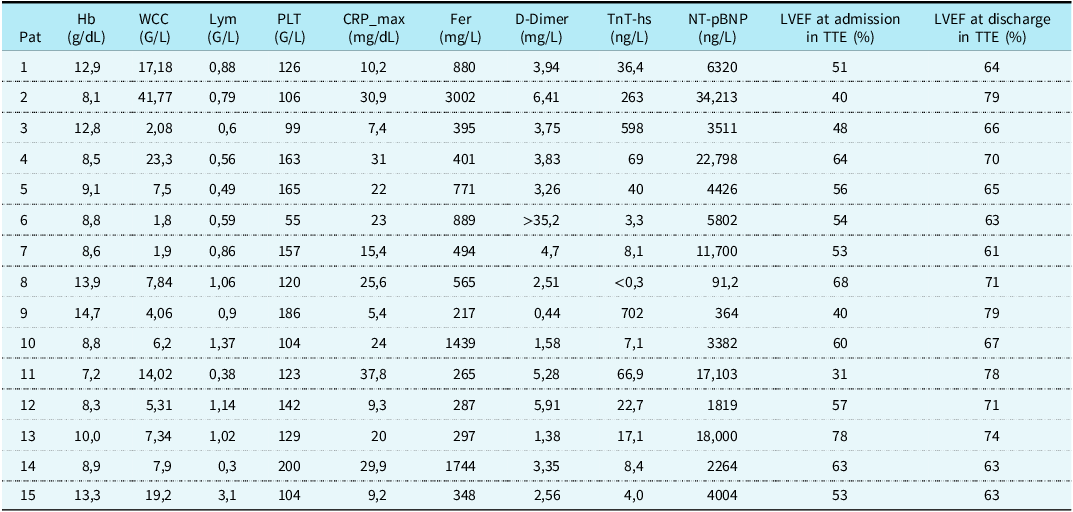
CRP = C-reactive protein; Fer = Ferritin; Hb = haemoglobin; LVEF = left ventricular ejection fraction; Lym = lymphocytes; NT-pBNP = N-terminal pro b-type natriuretic peptide; PLT = platelets; Trop T-hs = troponin T; TTE = transthoracic echocardiography; WCC = white cell count.
Seven patients (47%) were admitted to the paediatric ICU, four patients (27%) required inotropic support. Only one patient needed extracorporeal membrane oxygenation support and haemodialysis and was subsequently treated with Anakinra, an interleukin-receptor-antagonist. All patients were discharged in a stable clinical state, with normalised laboratory parameters, a normal electrocardiogram and regular left ventricular function on transthoracic echocardiography after a median duration of nine days (interquartile range 8.5–11.5 days).
Transthoracic echocardiography results
At admission left ventricular ejection fraction on transthoracic echocardiography was reduced in eight patients (53%, 8/15) with median values of 54% (interquartile range 49.5–61.5%). Four (27%, 4/15) patients presented with mild pericardial effusion. Two patients (13%) showed dilation of coronary arteries [Z-score + 3.58, defined as small aneurysm]. Reference McCrindle, Rowley and Newburger29 Both patients showed recovery during follow-up and neither of them was treated with aspirin longer than six weeks after discharge. Furthermore, left ventricular ejection fraction showed normal results in every patient at discharge with median values of 67% (interquartile range 63% - 74%).
Cardiac MRI results
Cardiac MRI took place at a median of 190.5 days (interquartile range 182–202 days) after the onset of multisystem inflammatory syndrome in children. A representative cardiac MRI example of our study group is presented in Figure 1.
Examples of typical CMR findings in the studied population. Short-axis views are shown from a to d: a : normal T1W; b : normal T2-TRUE FISP map; c : normal T2W; d : normal T2 map.

Exact parameters of cardiac volume and function of cardiac MRI are shown in Table 3. Only 2/12 patients (17%) presented with reduced left ventricular stroke volume (26.9 ml/m2 and 29.3 ml/m2, respectively). All other parameters regarding left ventricular volume were normal (median left ventricular end-diastolic volume index 65.25 ml/m2, interquartile range 57.95–77.7 ml/m2, median left ventricular end-systolic volume index 29.4 ml/m2, interquartile range 23.1–33.425 ml/m2, median left ventricular stroke volume 39.65 ml/m2, interquartile range 33.95–43.725 ml/m2). Correspondingly, only one patient had a slightly reduced right ventricular end-systolic volume index (25.8 ml/m2). The rest of the right ventricular volume characteristics, of this specific and all the other patients, were normal (median right ventricular end-diastolic volume index 72.05 ml/m2, interquartile range 62.275–86.425 ml/m2, median right ventricular end-systolic volume index 33.75 ml/m2, interquartile range 29.7–39.55 ml/m2). Nine of twelve (75%) individuals showed regular LV function (median left ventricular ejection fraction 59.45%, interquartile range 55.15–62.7). The rest of the study group showed mild to moderately reduced left ventricular function with left ventricular ejection fraction values of 46.8%, 49.7%, and 52.6%, respectively. Two of these three patients presented normal left ventricular function on transthoracic echocardiography at admission with left ventricular ejection fraction values of 48%, 64%, and 60%, respectively.
CMR parameters during follow-up
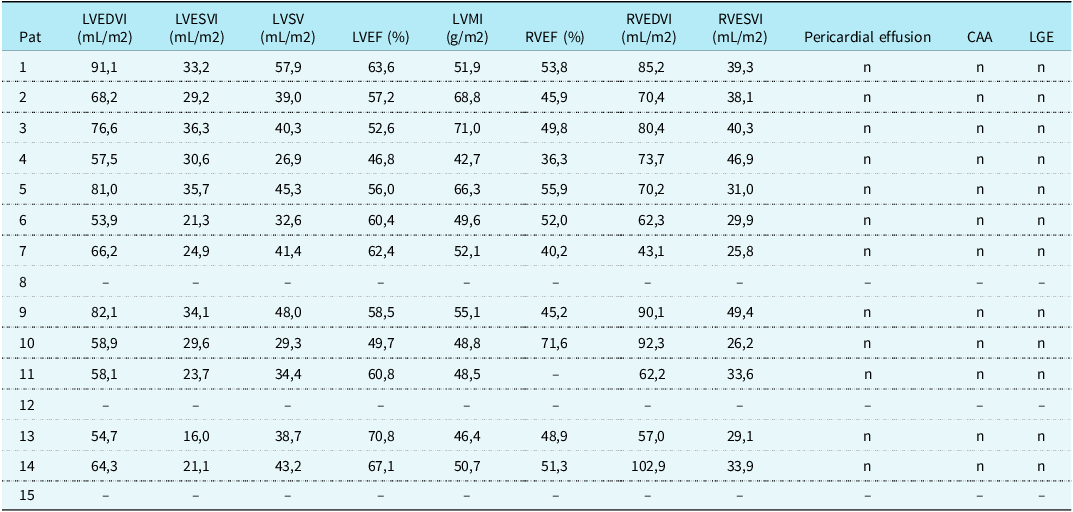
CAA = coronary artery anomalies; LGE = late gadolinium enhancement; LVEF = left ventricular ejection fraction; LVEDVI = left ventricular end-diastolic volume index; LVESVI = left ventricular end-systolic volume index; LVMI = left ventricular mass index; LVSV = left ventricular stroke volume; RVEDVI = right ventricular end-diastolic volume index; RVESVI = right ventricular end-systolic volume index; RVEF = right ventricular ejection fraction.
No signs of late gadolinium enhancement were found, therefore no patient had evidence of ongoing acute myocarditis or myocardial scarring. Moreover, no patient, neither the two showing initial coronary dilation nor the rest of the study group showed coronary artery anomalies during cardiac MRI-scanning 6 months after the onset of multisystem inflammatory syndrome in children. The four (27%) patients showing pericardial effusion in echocardiographic examination at hospital admission showed reabsorption in cardiac MRI.
Discussion
This study presents our experience of using cardiac MRI in patients with multisystem inflammatory syndrome in children as a follow-up screening tool to investigate cardiac damage during a mid-term follow-up period of median 6.7 months (5.1–7.0). We were able to show that for most children the impairment of cardiac function due to multisystem inflammatory syndrome in children was not a persistent condition. No signs of myocardial fibrosis, scars, or oedema could be found in cardiac MRI six months after the onset of multisystem inflammatory syndrome in children. Since the beginning of the COVID-19 pandemic, numerous reports presented patients with cardiac involvement after multisystem inflammatory syndrome in children Reference Rauf, Vijayan, John, Krishnan and Latheef13,Reference Sperotto, Friedman, Son, VanderPluym, Newburger and Dionne16,Reference Blondiaux, Parisot and Redheuil25–Reference Webster, Patel and Carr27 with several of those providing data of cardiac MRI imaging in a short-term follow-up period. Reference Bartoszek, Małek, Barczuk-Falęcka and Brzewski21,Reference Blondiaux, Parisot and Redheuil25–Reference Webster, Patel and Carr27 We evaluated the presence of persistent myocardial damage in affected children with multisystem inflammatory syndrome in children after a midterm follow-up period by using cardiac MRI at our institution. Regarding the current myocarditis guidelines Reference Grimaud, Starck and Levy19,Reference Zagrosek, Abdel-Aty and Boyé30,Reference Luetkens, Homsi and Dabir31 and the most recent studies related to multisystem inflammatory syndrome in children Reference Harwood, Allin and Jones4,Reference Sperotto, Friedman, Son, VanderPluym, Newburger and Dionne16,Reference Blondiaux, Parisot and Redheuil25 at the time of our first patient’s admission to hospital, we decided to perform cardiac MRI six months after the onset of symptoms. To the best of our knowledge, this is one of the longest median follow-up periods examining cardiac complications by cardiac MRI after the onset of multisystem inflammatory syndrome in children. Reports investigating cardiac complications after myocarditis before multisystem inflammatory syndrome in children with similar follow-up periods demonstrated that a part of the studied population still presented with myocardial injury caused by cardiotropic viruses. Reference Bartoszek, Małek, Barczuk-Falęcka and Brzewski21,Reference Dubey, Agarwal, Nguyen and Adebo32,Reference Banka, Robinson and Uppu33
None of our patients showed signs of myocardial fibrosis (normal global native T1 values), oedema (normal global and segmental maximum T2 values), pericardial effusion, or coronary artery anomalies during a median follow-up-period of 6.7 months. These results are consistent with the reports of Bartoszek et al. (median follow-up 3.3 months) and Webster et al. (median follow-up 2 months) Reference Bartoszek, Małek, Barczuk-Falęcka and Brzewski21,Reference Webster, Patel and Carr27 presenting none of the evaluated patients with signs of ongoing acute myocarditis or persistent myocardial scars. In contrast to these observations, Benvenuto et al. Reference Benvenuto, Simonini and Della Paolera34 observed signs of persisting scars in 25% (5 of 20 patients) of their patient cohort after a median follow-up period of 3 months. However, four of those five patients were examined by cardiac MRI two months after diagnosis.
Eight of fifteen (53%) of our patients presented with reduced left ventricular systolic function on transthoracic echocardiography on admission. These results are comparable to multicentre studies, Reference Valverde, Singh and Sanchez-de-Toledo35,Reference Feldstein, Tenforde and Friedman36 where a similar number of patients showed reduced left ventricular ejection fraction values in the acute phase of multisystem inflammatory syndrome in children on transthoracic echocardiography. In our patient cohort, this percentage could not be verified by transthoracic echocardiography at discharge. However, 25% (3/12) still showed mild to moderately reduced left ventricular systolic function in cardiac MRI six months after the onset of symptoms. Interestingly, only one of these three patients (Patient 3) presented with a reduced left ventricular function on echocardiography upon initial hospital admission. Like aforementioned these children neither showed clinical nor echocardiographic signs of cardiac impairment at discharge, both being indicative for a good short-term recovery. Two out of these three patients presented a normal left ventricular ejection fraction on transthoracic echocardiography, at five and nine months after their cardiac MRI assessments, respectively. The third patient was lost to follow-up six weeks after discharge, having a normal left ventricular ejection fraction at that time.
These findings are consistent with the study of Benvenuto et al. Reference Benvenuto, Simonini and Della Paolera34 showing that 20% of patients still had a mildly reduced left ventricular ejection fraction in the follow-up period of three months, but neither of them with echocardiographic evidence of a depressed left ventricular function. It could be argued that Patient 4 and Patient 10, who initially exhibited normal left ventricular ejection fraction values on transthoracic echocardiography, might have shown reduced equivalents on cardiac MRI if this examination had been conducted. While both methods can assess left ventricular function, cardiac MRI typically provides precise and comprehensive data due to its excellent image quality and ability to assess tissue characteristics (37). Global longitudinal strain in transthoracic echocardiography is also highly sensitive to subtle changes in myocardial function, but was not routinely performed in this group of patients. We speculate that cardiac MRI is effective in diagnosing both short- and long-term cardiac impairment following multisystem inflammatory syndrome in children. However, using global longitudinal strain in transthoracic echocardiography might have yielded comparable findings.
There are other reports not showing any evidence of reduced left ventricular systolic function in cardiac MRI in their patient cohorts and their respective follow-up periods. Reference Bartoszek, Małek, Barczuk-Falęcka and Brzewski21,Reference Webster, Patel and Carr27,Reference Ouldali, Toubiana and Antona28 Out of seven patients initially admitted to the paediatric ICU, two (29%) presented with reduced left ventricular ejection fraction on cardiac MRI. Interestingly, neither of them exhibited significantly higher inflammation parameters nor cardio-specific markers compared to the rest of the group requiring intensive care. Thus, we could not find any correlation between the initial clinical state and reduced left ventricular function during follow-up.
Comparing the results of our cohort with previous studies, the necessity of cardiac MRI at six months follow-up may be arguable as Bartoszek et al. presented promising results with no myocardial damage in cardiac MRI after a period of three months. In contrast, Benvenuto et al. Reference Benvenuto, Simonini and Della Paolera34 presented 5% of patients (1/20) with late gadolinium enhancement at a median of 5 months after the onset of symptoms being the longest follow-up period to date where signs of persistent myocardial damage after multisystem inflammatory syndrome in children were found. Therefore, we speculate that cardiac MRI at six months follow-up might not be necessary in the follow-up period after 3 months, if the patient is presenting in a good clinical state, with normal blood tests, electrocardiogram, and echocardiography.
Limitations of the study
Limitations of the study are first the small number of patients and second the retrospective study design. Third, cardiac MRI examination was not performed during the acute phase of multisystem inflammatory syndrome in children, therefore a comparison of early versus late cardiac MRI results was not possible.
Conclusion
No signs of myocardial scarring, fibrosis, pericardial effusion, or any coronary artery anomaly could be found on cardiac MRI in 12 children six months after the onset of multisystem inflammatory syndrome in children. A majority of patients do not show persistent cardiac impairment after multisystem inflammatory syndrome in children; however, there are some patients with further need of a strict follow-up due to persistent LV impairment. For this small proportion of patients, cardiac MRI may be a useful amendment. In favour of these patients, multicentre longitudinal studies are needed to provide a standardised follow-up regime regarding activity restrictions or cardiac treatment.
Acknowledgements
We like to thank Judith Limberger and Ilse Schmutz for organising patient’s schedules and conducting cardiac MRI studies. We would like to also thank Uvistra Naidoo for study protocol reviews.
Financial support
This research received no specific grant from any funding agency, commercial, or not-for-profit sectors.
Competing interests
None.


 Open access