


Impact statement
Punching shear failure in concrete slabs can cause sudden structural collapse, threatening lives and infrastructure safety. Current design equations are often inconsistent across different slab and column shapes, leading to costly over-designs or unsafe underestimations. This study applies explainable machine learning (ML) to more than 400 experimental tests from the fib International Database, developing a transparent and reliable model to predict punching shear capacity. The model links physical design parameters to structural performance, helping engineers design safer and more economical buildings and bridges. Policymakers can use these insights to promote data-driven safety standards and modernize building codes through evidence-based, interpretable ML tools.
1. Introduction
Flat slab-column systems are widely used in reinforced concrete (RC) construction because of their architectural flexibility, reduced story heights, and ease of formwork (Russell, Reference Russell2015). Despite these advantages, they are particularly vulnerable to punching shear failure, a brittle and sudden mechanism that occurs at the slab-column connection and can trigger progressive collapse without warning (Yankelevsky et al., Reference Yankelevsky, Karinski, Brodsky and Feldgun2021; Liu et al., Reference Liu, Chen, Afefy and Sennah2025). The consequences of such failures in real structures highlight the urgent need for reliable methods to assess punching shear capacity (Yu et al., Reference Yu, Khodadadi, Song, Yu and Nanni2025).
Design codes, such as ACI 318 (American Concrete Institute), Eurocode 2, and fib Model Code 2010 (Fédération Internationale du Béton), estimate the punching shear strength through empirical or semi-empirical equations, often extensions of the critical shear crack theory (Pani and Stochino, Reference Pani and Stochino2020; Elgohary and Zareef, Reference Elgohary and Zareef2025). Although practical, these approaches exhibit significant scatter and often show domain-dependent bias when applied outside their calibration ranges. For instance, predictions may be conservative on average but highly inconsistent for specific cases involving variations in slab thickness, column shape, reinforcement ratio, or edge conditions. This inconsistency arises because the current code equations do not systematically account for the nonlinear interactions among geometric, material, and boundary parameters at slab-column connections. Furthermore, probabilistic approaches have also been adopted to explicitly account for uncertainty in structural capacity predictions, as demonstrated in reliability-based models for reinforced and composite concrete members (Contento et al., Reference Contento, Aloisio, Xue, Quaranta, Briseghella and Gardoni2022).
Recent years have witnessed remarkable advancements in machine learning (ML), with structural engineering emerging as one of the key beneficiaries of these developments (Khan et al., Reference Khan, Awan, Rasul, Siddiqi and Pimanmas2023; Chitkeshwar, Reference Chitkeshwar2024; Ajmal et al., Reference Ajmal, Sravani Yerram, Nizam, Aglave, Patnam, Raghuvanshi and Srivastava2025; Khan et al., Reference Khan, Naveed, Rasheed and Pimanmas2025). Unlike traditional empirical and semi-empirical approaches, ML techniques are capable of capturing complex, nonlinear interactions among design parameters, offering superior predictive accuracy and generalization (Aylas-Paredes et al., Reference Aylas-Paredes, Han, Neithalath, Huang, Goel, Kumar and Neithalath2025; Khan et al., Reference Khan, Muhammad, Raza and Pimanmas2025). For example, Zhang et al. (Reference Zhang, Li, Xie and Guo2020) applied random forest and gradient boosting algorithms to predict the shear capacity of RC beams, reporting significant improvements over code-based models (Zhang et al., Reference Zhang, Li, Xie and Guo2020). Similarly, Zhao et al. (Reference Zhao, Gu, Qiu, Zhang and Li2021) utilized support vector regression to estimate the compressive strength of high-performance concrete, achieving higher reliability under diverse material compositions (Zhao et al., Reference Zhao, Gu, Qiu, Zhang and Li2021). In the domain of structural health monitoring (SHM), Zhang et al. (Reference Zhang, Wang, Li and Xu2022) demonstrated the efficacy of convolutional neural networks in detecting and classifying damage from vibration signals, while Erazo et al. (Reference Erazo, Sen, Nagarajaiah and Sun2019) integrated deep learning with SHM sensor networks for real-time damage localization. Collectively, these studies illustrate the growing role of ML as a transformative tool for advancing predictive modeling, uncertainty quantification, and performance-based design in structural engineering. However, important gaps remain. Most prior studies: (i) pool all test data into a single dataset without distinguishing between different slab-column connections; (ii) rely mainly on conventional regression metrics (e.g., coefficient of determination [R 2] and root mean squared error [RMSE]) while neglecting reliability-oriented indicators critical for design safety, such as bias factors and coefficients of variation (COVs); and (iii) rarely employ explainable artificial intelligence techniques, such as SHapley Additive exPlanations (SHAP), to clarify the influence of input parameters on the output.
Addressing these limitations is essential for integrating ML into structural engineering practice. A model that treats all slab-column configurations identically risks obscuring geometry-specific effects, while an evaluation framework limited to average error metrics fails to capture safety-critical underprediction risks. Furthermore, without transparent feature-importance analysis, ML predictions remain black-box estimates with limited interpretability for design engineers (Musolf et al., Reference Musolf, Holzinger, Malley and Bailey-Wilson2022; Khan et al., Reference Khan, Naveed, Rasheed and Pimanmas2024).
This study investigates the domain-specific experimental data of flat RC slabs to predict the punching shear capacity using a robust ML model that provides accurate and reliable predictions. The analysis is based on the comprehensive punching shear database jointly developed by fib Working Party 2.2.3 and ACI Committee 445. The database compiles more than 400 well-documented concentric punching tests on two-way RC slabs at interior locations without shear reinforcement. Only specimens with fully reported material properties, geometric details, and clear punching shear failure were retained for this study. To capture geometry-specific stress transfer mechanisms, the database was systematically divided into four domains: square slab with square column (SS), circular slab with circular column (CC), square slab with circular column (SC), and circular slab with square column (CS). The dataset used in this study covers five major categories: material strength, slab geometry, column geometry, boundary conditions, and reinforcement detailing. The predictive target is the ultimate punching shear capacity here in this study as failure load $ \left({P}_u\right) $
[kN]. Collectively, this parameter set provides a balanced representation of both geometric and material influences on punching shear behavior. The eXtreme Gradient Boosting (XGBoost) model was used in this study to predict the
$ \left({P}_u\right) $
[kN]. Collectively, this parameter set provides a balanced representation of both geometric and material influences on punching shear behavior. The eXtreme Gradient Boosting (XGBoost) model was used in this study to predict the $ {P}_u $
, trained for each domain, with evaluation conducted using both conventional statistical metrics (R 2, mean squared error [MSE], RMSE, and mean absolute error [MAE]) and structural reliability indicators (bias factor, standard deviation of prediction ratios, and COV).
$ {P}_u $
, trained for each domain, with evaluation conducted using both conventional statistical metrics (R 2, mean squared error [MSE], RMSE, and mean absolute error [MAE]) and structural reliability indicators (bias factor, standard deviation of prediction ratios, and COV).
The contributions of this study are threefold:
-
i. It develops an ML model to predict the punching shear capacity of different geometric domains of flat RC slab, overcoming the common limitation of treating all configurations as a single dataset.
-
ii. It establishes a comprehensive evaluation framework that reports not only conventional statistical metrics but also reliability-oriented measures, directly linking ML predictions to engineering safety considerations.
-
iii. It applies SHAP-based explainable analysis to systematically rank parameters across the domains, thereby revealing how each parameter contributes to the ML model’s prediction.
Together, these contributions establish a robust framework for integrating ML into punching shear assessment, promoting safer and more efficient flat RC slab design while respecting geometry-specific behaviors.
2. Literature review
2.1. XGBoost
XGBoost is an advanced ensemble learning algorithm based on the gradient boosting framework, designed to deliver both high predictive accuracy and computational efficiency (Kavzoglu and Teke, Reference Kavzoglu and Teke2022). It builds decision trees sequentially, where each subsequent tree focuses on correcting the errors of the previous ones, thereby minimizing overall loss. Unlike traditional boosting approaches, XGBoost integrates regularization terms to control model complexity, reduce overfitting, and enhance generalization (Khan et al., Reference Khan, Naveed, Rasheed and Pimanmas2025). Its ability to handle nonlinear relationships, accommodate feature interactions, and maintain scalability makes it a preferred choice in engineering and scientific applications where data variability is significant (Khan et al., Reference Khan, Muhammad, Raza, Chaimahawan and Pimanmas2025).
The performance of XGBoost is strongly dependent on its hyperparameters, which control the learning process, model complexity, and regularization strength. Among the most influential parameters are the learning rate ( $ \eta $
), which determines the step size for updating tree weights; the maximum depth (
$ \eta $
), which determines the step size for updating tree weights; the maximum depth ( $ \max \_ depth $
), which regulates the complexity of individual trees; the number of estimators (
$ \max \_ depth $
), which regulates the complexity of individual trees; the number of estimators ( $ n\_ estimators $
), representing the total number of boosting iterations; and sampling-related parameters, such as
$ n\_ estimators $
), representing the total number of boosting iterations; and sampling-related parameters, such as $ subsample $
and
$ subsample $
and $ colsample\_ bytree $
, which introduce randomness to reduce overfitting and enhance robustness (Kavzoglu and Teke, Reference Kavzoglu and Teke2022). Furthermore, regularization terms, namely
$ colsample\_ bytree $
, which introduce randomness to reduce overfitting and enhance robustness (Kavzoglu and Teke, Reference Kavzoglu and Teke2022). Furthermore, regularization terms, namely $ {L}_1\left(\alpha \right) $
and
$ {L}_1\left(\alpha \right) $
and $ {L}_1\left(\lambda \right) $
penalties, are incorporated to control model complexity by shrinking coefficients and penalizing large weights (Cerulli and Cerulli, Reference Cerulli and Cerulli2023).
$ {L}_1\left(\lambda \right) $
penalties, are incorporated to control model complexity by shrinking coefficients and penalizing large weights (Cerulli and Cerulli, Reference Cerulli and Cerulli2023).
2.2. Mechanism behind the punching shear failure
Punching shear failure is a brittle mode of collapse that occurs in flat RC slab-column connections when the concentrated load or reaction from a column exceeds the shear resistance capacity of the slab (Qian et al., Reference Qian, Li, Huang, Weng and Deng2022; Wu et al., Reference Wu, Chen, Peng and Yi2022). This failure mechanism is characterized by the development of inclined cracks around the column perimeter, propagating through the slab thickness, and ultimately leading to the sudden punching of the column through the slab (Zhou et al., Reference Zhou, Huang and Chen2021). The process typically initiates with flexural cracking in the tension zone of the slab, caused by bending moments around the column face (Yu et al., Reference Yu, Tang, Luo and Fang2020; Ravasini et al., Reference Ravasini, Vecchi, Belletti and Muttoni2023). As the applied load increases, these cracks extend diagonally toward the compression zone, forming a truncated cone (or pyramid)-shaped failure surface around the column (Chen et al., Reference Chen, Jia and Zhu2024). This inclined failure plane generally develops at an angle of ~25°–35° to the slab surface, depending on the concrete strength, slab thickness, and reinforcement detailing (Jarapala and Menon, Reference Jarapala and Menon2023).
The progression of cracks reduces the effective shear perimeter resisting the applied load, concentrating stresses near the slab-column interface (Anas et al., Reference Anas, Al-Dala’ien, Shariq and Alam2024). Once the critical shear perimeter reaches its ultimate capacity, the slab loses its ability to transfer loads through shear action, leading to a brittle punching failure (Duan and Zhang, Reference Duan and Zhang2024). This mechanism is particularly dangerous because it occurs suddenly and without significant warning, unlike flexural failure modes that exhibit greater ductility. Several parameters influence this mechanism. Concrete compressive strength directly governs the shear resistance along the critical perimeter, while slab thickness and effective depth define the geometry of the shear failure surface (Alrousan and Bara’a, Reference Alrousan and Bara’a2022; Faridmehr et al., Reference Faridmehr, Nehdi and Baghban2022). Column dimensions alter the punching perimeter length, thereby affecting the load transfer mechanism. Although reinforcement detailing contributes by controlling crack widths and delaying failure, it cannot prevent the brittle nature of punching once the shear strength of concrete is exceeded (Zamri et al., Reference Zamri, Mohamed, Awalluddin and Abdullah2022; Youssf et al., Reference Youssf, Hassanli, Elchalakani, Mills, Tayeh and Agwaa2023). Additionally, boundary conditions and slab continuity can influence the redistribution of stresses, either enhancing or reducing the punching resistance depending on the restraint provided (Diao et al., Reference Diao, Li, Guan, Yang, Gilbert and Wang2021; Zhao et al., Reference Zhao, Li, Guan, Diao, Chen and Gilbert2025).
Overall, punching shear failure is a local yet catastrophic failure mode, as the collapse of a single slab-column connection can trigger progressive collapse in flat slab systems. This has motivated extensive research into predictive models and strengthening techniques, aiming to enhance the ductility and safety of flat RC slabs against this critical failure mechanism.
2.3. Geometric domains
The experimental dataset was organized into four geometric domains to reflect the different configurations of slab-column connections typically encountered in practice. The first domain, SS column, represents the most conventional and widely studied configuration. In this case, both the slab and the column share orthogonal geometries, which provide uniform load transfer paths and a symmetric stress distribution around the column perimeter. The SS configuration is often used in design codes as a benchmark case for calibrating punching shear models due to its structural regularity and straightforward geometry (Elsanadedy et al., Reference Elsanadedy, Al-Salloum and Alsayed2013; Moreno and Sarmento, Reference Moreno and Sarmento2013).
The second domain, CC column, captures systems where both structural elements possess radial symmetry. This configuration promotes uniform distribution of stresses in all directions around the slab-column interface, thereby reducing the concentration of shear stresses at corners, which are common in square geometries. The CC-domain is particularly relevant in structures with architectural or functional constraints requiring circular elements, and it provides a useful comparison to the SS case by highlighting the role of geometry in punching shear resistance (Khajavi et al., Reference Khajavi, Khanghah and Khiavi2025; Mahrous et al., Reference Mahrous, AbdelRahman and Galal2025).
The third domain, SC column, introduces a geometric mismatch between the supporting column and the slab. In this arrangement, the slab maintains orthogonal geometry while the column is circular. The difference in shapes alters the stress transfer mechanism at the slab-column junction, as the circular column produces a more concentrated punching shear perimeter within the square slab. This domain is important in practice because it represents common architectural choices where circular columns are integrated into square floor systems for aesthetic or functional reasons (Hamoda et al., Reference Hamoda, Sennah, Ahmed, Abadel and Emara2025).
Finally, the CS column domain represents the reverse configuration, where a square column is embedded within a circular slab. This case introduces localized stress concentrations around the corners of the square column, while the surrounding slab provides radial geometry. Such interactions create nonuniform stress fields along the critical punching perimeter, making the CS-domain distinct from the other three. This domain is less common in conventional design but provides valuable insights into the influence of column geometry on punching shear failure within circular slab systems (Fayed et al., Reference Fayed, Basha and Yehia2025; Zhang et al., Reference Zhang, Xue, Xu and Li2025).
2.4. Categorical distribution of parameters
The input parameters employed across the four domains, ranging from 15 to 17 in number, were further classified into five overarching categories. This subdivision was carried out to capture the influence of material strength, geometric characteristics, boundary conditions, and reinforcement detailing on punching shear response. The statistical summaries of the parameters for each domain are presented in Tables 1–4, providing insight into the variability and representativeness of the dataset. In addition, the categorical distribution of the parameters is reported in Table 5, highlighting how the input features are organized across the mechanical, geometric, and reinforcement-related groups.
Summary of SS-domain variables and statistical measures

Summary of CC-domain variables and statistical measures

Summary of SC-domain variables and statistical measures

Summary of CS-domain variables and statistical measures

Distribution of input parameters across the domain

In material strength, there are two parameters consistently available across all geometric domains: the concrete cylinder compressive strength $ \left({f}_c^{\prime}\right) $
(MPa) and the yield strength of reinforcement
$ \left({f}_c^{\prime}\right) $
(MPa) and the yield strength of reinforcement $ \left({f}_y\right) $
(MPa) (Table 5). The
$ \left({f}_y\right) $
(MPa) (Table 5). The $ {f}_c^{\prime } $
represents the fundamental resistance of concrete against shear-induced cracking and is explicitly included in most international code formulations. Similarly, the
$ {f}_c^{\prime } $
represents the fundamental resistance of concrete against shear-induced cracking and is explicitly included in most international code formulations. Similarly, the $ {f}_y $
governs the ability of steel to resist tensile stresses and contribute to crack control, dowel action, and redistribution of stresses in the slab-column connection. On the other hand, the column geometry is the most domain-specific input category. Columns were defined by their orthogonal dimensions as column dimensions (x- and y-direction denoted as
$ {f}_y $
governs the ability of steel to resist tensile stresses and contribute to crack control, dowel action, and redistribution of stresses in the slab-column connection. On the other hand, the column geometry is the most domain-specific input category. Columns were defined by their orthogonal dimensions as column dimensions (x- and y-direction denoted as $ {b}_{cx},{b}_{cy}\Big) $
(mm); in some domains (CC and CS),
$ {b}_{cx},{b}_{cy}\Big) $
(mm); in some domains (CC and CS), $ {b}_{cx} $
and
$ {b}_{cx} $
and $ {b}_{cy} $
were also expressed as a column cross-sectional area
$ {b}_{cy} $
were also expressed as a column cross-sectional area $ \left({A}_c\right) $
(mm2). In the CC-domain, the footprint was fully described by the column diameter
$ \left({A}_c\right) $
(mm2). In the CC-domain, the footprint was fully described by the column diameter $ \left({d}_c\right) $
(mm).
$ \left({d}_c\right) $
(mm).
In contrast, slab geometry was characterized by four primary parameters: slab thickness $ (h) $
(mm), average effective depth
$ (h) $
(mm), average effective depth $ \left({d}_{avg}\right) $
(mm), and the effective depths of reinforcement at the first and second layers
$ \left({d}_{avg}\right) $
(mm), and the effective depths of reinforcement at the first and second layers $ \left({d}_1,{d}_2\right) $
(mm). Additionally, boundary conditions were quantified through the distance from the slab edge to the column center
$ \left({d}_1,{d}_2\right) $
(mm). Additionally, boundary conditions were quantified through the distance from the slab edge to the column center $ \left({e}_{sx},{e}_{sy}\right) $
(mm) and distances from the column center to the nearest slab support (line or point)
$ \left({e}_{sx},{e}_{sy}\right) $
(mm) and distances from the column center to the nearest slab support (line or point) $ \left({s}_x,{s}_y\right) $
(mm) in x- and y-direction, respectively. The reinforcement detailing parameters were represented by average bar spacing (
$ \left({s}_x,{s}_y\right) $
(mm) in x- and y-direction, respectively. The reinforcement detailing parameters were represented by average bar spacing ( $ {s}_1,{s}_2 $
) (mm) and reinforcement ratios (
$ {s}_1,{s}_2 $
) (mm) and reinforcement ratios ( $ {\rho}_1,{\rho}_2 $
) (%) for the first and second layers, respectively. These variables were reported in all domains, although the level of detail varied between experiments.
$ {\rho}_1,{\rho}_2 $
) (%) for the first and second layers, respectively. These variables were reported in all domains, although the level of detail varied between experiments.
The combination of these input variables allows the dataset to reflect the complex interplay of material strength, geometry, and reinforcement detailing that governs punching shear behavior. By systematically incorporating all parameters with a demonstrated influence on slab performance, the predictive framework is grounded in sound physical reasoning and avoids omission of critical contributors to failure.
2.5. Output parameter
The predictive parameter in this study is the ultimate punching shear capacity ( $ {P}_u $
) (kN), defined as the maximum applied load at which a slab undergoes punching shear failure. This parameter was chosen as the sole output because it provides the most direct and physically meaningful measure of structural capacity under concentrated column loading, inherently capturing the combined effects of geometry, material strength, reinforcement detailing, and boundary conditions. From a practical perspective, the reliable prediction of
$ {P}_u $
) (kN), defined as the maximum applied load at which a slab undergoes punching shear failure. This parameter was chosen as the sole output because it provides the most direct and physically meaningful measure of structural capacity under concentrated column loading, inherently capturing the combined effects of geometry, material strength, reinforcement detailing, and boundary conditions. From a practical perspective, the reliable prediction of $ {P}_u $
is critical, as flat RC slabs are ultimately governed by their resistance to brittle punching shear rather than by serviceability considerations (Ricker et al., Reference Ricker, Feiri, Nille-Hauf, Adam and Hegger2021).
$ {P}_u $
is critical, as flat RC slabs are ultimately governed by their resistance to brittle punching shear rather than by serviceability considerations (Ricker et al., Reference Ricker, Feiri, Nille-Hauf, Adam and Hegger2021).
3. Methodology
3.1. Database compilation
A comprehensive punching shear database was utilized in this study, compiled and curated by the fib Working Party 2.2.3 in collaboration with ACI Committee 445 (Concrete, 2025). The database is essentially a curated collection of test results from experiments done worldwide, focusing only on flat RC slabs without shear reinforcement, loaded concentrically at interior columns, until punching shear failure occurred. Entries with incomplete reporting of critical parameters, ambiguous failure modes, or typical boundary conditions were excluded. After applying these criteria, the final dataset consisted of 405 specimens, representing one of the most extensive compilations available to date. The distribution of specimens across geometric domains is as follows: SS-domain with the highest number of tests (244), CC-domain with 98 tests, SC-domain with 35 tests, and CS-domain with the lowest number of tests (28). This structured collection provides the experimental foundation for the predictive modeling presented in this study.
3.2. Outlier removal using Z-score
To improve model performance and ensure data integrity, outliers were removed from the dataset using the Z-score method, as shown in Figure 1. The Z-score calculates how many standard deviations a data point is from the mean, allowing for the identification of extreme values (Jamshidi et al., Reference Jamshidi, Yusup, Kayode and Kamaruddin2022; Chauhan et al., Reference Chauhan, Bisht, Kathuria, Bisht and Hatwal2023). A threshold of 3 was used, and any data point exceeding this threshold was considered an outlier and excluded from further analysis. Before removing outliers, the dataset contained 430 samples. After applying the Z-score filter, this number was reduced to 405, as outliers were eliminated. The removal of these extreme values helped minimize noise and improved the model’s ability to capture genuine patterns within the data. This preprocessing step ensured that the hyperparameter tuning process and model evaluation were conducted on a cleaner, more representative dataset, ultimately enhancing the model’s accuracy and generalization capability.
Workflow of the proposed punching shear prediction framework.

3.3. Data scaling and preprocessing
The ML model in this study was implemented using Python’s scikit-learn library, which provides a robust framework for developing and evaluating predictive algorithms. To ensure reliable assessment of the model, the dataset was partitioned into training and testing subsets following an 80:20 ratio, where 80% of the data was used to train the model and the remaining 20% was reserved exclusively for validation of predictive accuracy. Before model development, feature variables were normalized through standard scaling, a preprocessing step that transforms the data to have zero mean and unit variance, thereby eliminating the influence of differing measurement scales and enhancing the convergence behavior of the algorithms.
3.4. ML model and its justification
The XGBoost algorithm was employed in this study due to its proven effectiveness in handling complex nonlinear relationships and its superior predictive capability compared to conventional regression techniques. XGBoost is an ensemble learning method based on gradient boosting, where multiple weak learners (decision trees) are iteratively combined to minimize the prediction error (Ali et al., Reference Ali, Khedr, El-Bannany and Kanakkayil2023; Demir and Sahin, Reference Demir and Sahin2023). In each boosting round, the algorithm constructs a new tree that corrects the residual errors of the previous trees, thereby improving model accuracy while maintaining computational efficiency (Hajihosseinlou et al., Reference Hajihosseinlou, Maghsoudi and Ghezelbash2023). A key advantage of XGBoost lies in its incorporation of regularization terms, which prevent overfitting and enhance generalization, making it particularly suitable for engineering datasets where variability is high (Khan et al., Reference Khan, Naveed, Rasheed and Miao2023; Utkarsh and Jain, Reference Utkarsh and Jain2024).
To obtain the optimal parameter settings, a Grid Search Cross-Validation approach was employed during model calibration. In this procedure, predefined ranges of hyperparameters were evaluated using multiple folds of the training dataset to identify robust parameter combinations and reduce sensitivity to a single data split. The cross-validation process was used exclusively for hyperparameter tuning, while final model performance was assessed using an independent validation dataset. Table 6 presents the tuned hyperparameters of the XGBoost model across the CC, SS, CS, and SC-domains. Notably, the SS-domain required a deeper tree structure and a slightly higher learning rate compared to other domains, reflecting the underlying complexity of the data distribution. Conversely, the SC-domain achieved better generalization with a shallower tree depth and smaller sampling fractions.
Hyperparameters of XGBoost model across the domains

3.5. Model evaluation and reliability assessment
Model performance was assessed using standard regression metrics, including the R 2, MSE, RMSE, and MAE, which are widely adopted in machine-learning-based structural engineering studies. To complement these accuracy measures with safety-relevant indicators, model reliability was further evaluated using the bias factor and COV of prediction-to-test ratios. This combined evaluation framework enables simultaneous assessment of predictive accuracy, dispersion, and potential systematic bias, which is essential for structural design applications.
4. Results and discussion
4.1. Overall model performance
Figure 2 illustrates the R 2 values for the XGBoost model across the four geometric domains under both training and testing conditions. The results highlight the strong predictive capability of the model, with all domains achieving high accuracy (R 2 > 0.930). In the SS, CC, and CS-domains, the model achieved nearly perfect performance in training with an R 2 value of 1.000 and maintained excellent generalization in testing, with values of 0.9902, 0.997, and 0.986, respectively, as reported in Table 7. This demonstrates that for these configurations, the model effectively captured the main factors influencing $ {P}_u $
and generalized well for unseen data.
$ {P}_u $
and generalized well for unseen data.
Coefficient of determination (R 2) of XGBoost models for SS, CC, SC, and CS domains.

Results of XGBoost model

In contrast, the SC-domain shows a slightly reduced performance, with a training R 2 of 0.986 and a testing R 2 of 0.930. This drop is visible in Figure 2, where the testing bar for the SC case is noticeably shorter compared to the other domains. The reduction in accuracy can be attributed to the inherent complexity of the SC configuration or to a small number of experimental datasets used in this domain. Unlike the other domains, the SC-domain combines slender column geometry with comparatively larger slab thickness, leading to more variable stress distributions and localized stress concentrations around the slab-column interface (Joseph and Lakshmi, Reference Joseph and Lakshmi2018; Oleiwi, Reference Oleiwi2023). These nonlinear interactions introduce higher scatter in the experimental dataset, making the $ {P}_u $
more challenging to predict precisely.
$ {P}_u $
more challenging to predict precisely.
Overall, the XGBoost model performs exceptionally well across different geometric domains, with only a modest decrease in predictive accuracy for the SC-domain. This consistency underscores the robustness of the model and its applicability to a wide range of slab-column configurations while also pointing out that domains with greater geometric irregularity naturally present greater predictive difficulty.
4.2. Prediction of ultimate punching shear capacity
This study investigates the ultimate punching shear capacity $ \left({P}_u\right) $
of RC slab-column connections by using ML model (XGBoost) across four geometric domains. The aim is to provide accurate, generalizable predictions of structural performance under punching shear failure. The scatter plots in Figure 3 compare the predicted
$ \left({P}_u\right) $
of RC slab-column connections by using ML model (XGBoost) across four geometric domains. The aim is to provide accurate, generalizable predictions of structural performance under punching shear failure. The scatter plots in Figure 3 compare the predicted $ {P}_u $
against the actual values, illustrating the accuracy and alignment of the model with the 1:1 reference line. Error distribution graphs in Figure 4 show the spread of prediction errors and overall trend of actual versus predicted values, highlighting the bias and variability of the model across various geometric domains used in this study.
$ {P}_u $
against the actual values, illustrating the accuracy and alignment of the model with the 1:1 reference line. Error distribution graphs in Figure 4 show the spread of prediction errors and overall trend of actual versus predicted values, highlighting the bias and variability of the model across various geometric domains used in this study.
Predicted versus actual punching shear capacities across domains.

Comparison of actual and predicted punching shear capacities with error distributions for each domain.

In Figure 3a, the training data align tightly with the 45° reference line, showing excellent agreement between actual and predicted values, and confirming that the model has captured the training dataset with high precision. The testing data also follow a strong linear relationship, although more scatter is visible compared to training. Most test samples lie within the ±20% error margin, yet a few points deviate further, especially in regions with very high load values where the variability of SS-domain parameters is greatest. The distribution of errors in Figure 4a provides a clearer picture of these deviations. The training errors remain tightly clustered around zero, confirming the near-perfect training performance observed in Figure 3a. For the testing data, the errors spread more widely, ranging roughly between ±40 kN, with the majority of samples falling closer to zero but some showing larger deviations.
These graphical findings are reinforced by the results in Table 7. For the training dataset, the model shows perfect performance with an R 2 of 1.000, with relatively low error values (MSE = 9.900, RMSE = 3.146, MAE = 0.706), which justifies the tight clustering of points along the reference line in Figure 4a. In the testing dataset, the R 2 remains excellent at 0.997, confirming that the model generalizes well. However, the testing errors increase substantially with MSE of 795.756, RMSE of 28.209, and MAE of 19.364, which explains both the ±40 kN error range in Figure 4a and the scattering of points seen in Figure 3a. Importantly, the actual versus predicted trend line for the testing dataset remains very close to the 45° line, showing that the model does not suffer from systematic bias but rather from random deviations caused by the inherent variability of SS-domain data. This consistency across plots and metrics demonstrates that the model is both reliable and robust, though naturally challenged by the extreme cases embedded within this domain.
In Figure 3b, the training data points once again align almost perfectly along the 45° reference line, showing that the predicted values nearly overlap with the actual ones. This indicates that the model has captured the training data exceptionally well with no noticeable deviation. The testing data, while maintaining a strong linear trend, exhibits some scattering around the ideal line. Most predictions remain within the ±20% error band, but a few points deviate more noticeably, particularly at higher actual load values. These deviations may be attributed to the wide variability in the CC-domain parameters, such as compressive strength and strain values, which makes predicting extreme cases more challenging. The behavior seen in Figure 3b is further clarified in Figure 4b, where the error distribution shows that the training set errors cluster almost around zero, reflecting the near-perfect fit of the training data. For the testing dataset, however, the errors range approximately between ±20 kN, with most samples concentrated closer to zero but a few outliers contributing to larger deviations.
These graphical insights are strongly supported by the numerical evidence in Table 7. For training, the R 2 value is a perfect 1.000, while error metrics remain almost negligible with MSE of 0.001, RMSE of 0.024, and MAE of 0.017, justifying the near-perfect overlap spotted in Figure 3b. In testing, the R 2 remains very high at 0.990, confirming strong predictive accuracy, but the error values rise substantially (MSE = 239.935, RMSE = 15.490, and MAE = 11.991). These elevated values explain both the broader scatter in the validation plot and the ±20 kN error range observed in Figure 4b. Altogether, the results show that while the model learns the CC-domain’s training data with remarkable precision, its testing performance is influenced by the inherently large variability in the respective domain properties, leading to occasional higher prediction errors.
In Figure 3c, the training data points generally align along the 45° line, though with a slightly wider scatter compared to the previous domains. This indicates that the model has captured the training set reasonably well, but not with the same near-perfect precision as seen in CC, SS, and CS-domains. For the testing dataset, the predicted values follow the overall linear trend, yet the scatter becomes more pronounced, with several points deviating beyond the ±20% error band. These deviations are particularly noticeable in mid-to-high actual load ranges, suggesting that the SC-domain’s narrower but distinct parameter distributions create challenges in accurately capturing certain cases. The error distribution in Figure 4c provides a deeper view of these results. For training, errors remain small and centered close to zero, confirming that the model has managed the training phase effectively despite slightly larger spreads. In the testing dataset, however, the errors extend approximately between −15 and + 30 kN, with clusters close to zero but also several notable outliers. The actual values and the predicted values remain broadly parallel, showing that the model successfully captures the general failure load trend. However, the divergence between the two lines at certain points reflects the growing prediction uncertainty, which is consistent with the scattering observed in Figure 3c.
The values in Table 7 confirm these graphical trends. For the training dataset, the R 2 value is slightly lower than in other domains at 0.986, with moderate error levels, MSE of 97.076, RMSE of 9.853, and MAE of 8.037. These values explain why the training points, though closely aligned, still show more scatter than the other domains. For the testing dataset, the R 2 decreases further to 0.930, with significantly higher error values, MSE of 676.465, RMSE of 26.009, and MAE of 20.520. These elevated error metrics justify both the ±30 kN error range observed in Figure 4c and the wider scattering in Figure 3c. Overall, the results indicate that while the model can capture the general trend in the SC-domain, the relatively high variability in testing predictions suggests that this dataset poses greater challenges for the model, likely due to its more uniform but narrower parameter distribution, which restricts generalization performance.
In Figure 3d, the training data points are concentrated tightly along the 45° reference line, confirming that the model has learned the training dataset with almost perfect precision. The predicted and actual values for training show no visible deviations, indicating a very strong fit. For the testing data, the points also follow the 45° line closely, but with more visible scatter compared to training. Most of the predictions remain within the ±20% error band, though a few testing points deviate more strongly, particularly at higher actual values. The error distribution in Figure 4d illustrates this behavior more clearly. Training errors remain virtually nonexistent, clustered tightly around zero, which corresponds to the near-perfect overlap seen in Figure 3d. In contrast, the testing errors span a much broader range, approximately from −40 to +30 kN, with the majority of predictions still close to zero but some showing significantly higher deviations. The actual values and the predicted values both follow the same upward trajectory, staying parallel across the range of failure loads. This parallelism indicates that the model successfully captures the overall trend of the data, and the observed deviations are random rather than systematic.
The observations from these figures are consistent with the statistical outcomes presented in Table 7. For training, the model achieves an R 2 of 1.000, with nearly zero error values, with an MSE of 0.000, RMSE of 0.001, and MAE of 0.001, which justifies the perfect alignment in Figure 3d. In testing, the R 2 remains strong at 0.986, but the error metrics increase significantly in MSE, RMSE, and MAE with values 1541.393, 39.261, and 33.510, respectively. These larger error values explain both the ±30 kN error range in Figure 4d and the increased scattering of test points in Figure 3d. Together, the figures and the table highlight that while the model handles the CS training data almost flawlessly, the inherent variability of the domain leads to noticeable prediction deviations in the testing stage, particularly for higher-load cases.
The prediction accuracy of the proposed XGBoost models was evaluated through error distribution histograms, as illustrated in Figure 5. These plots display the frequency of percentage errors between actual and predicted values for both training and testing datasets, thereby providing an intuitive assessment of model performance and generalization capability across different domains.
Histograms of prediction error percentages in training and testing datasets.

4.3. Error distribution analysis of model prediction
In Figure 5a, corresponding to the CC-domain, the error distribution is predominantly concentrated within the 0–6% range for both training and testing datasets. This narrow spread of errors reflects the strong predictive accuracy of the model and indicates that overfitting is effectively minimized. Similarly, Figure 5b, which represents the SS-domain, shows that although the errors extend up to nearly 12%, the majority of predictions cluster around lower error percentages. This demonstrates that the model captures the underlying data trends reliably, despite slightly higher variability compared to other domains. For the CS-domain, illustrated in Figure 5c, the histogram reveals that most prediction errors remain below 6%, with both training and testing datasets exhibiting comparable distributions. This consistency confirms that the model is robust and generalizes well to unseen data. Finally, Figure 5d, corresponding to the SC-domain, shows that the majority of errors fall below 10%, with very few instances exceeding this threshold. The similarity between training and testing distributions again highlights the stability of the model across this domain.
Overall, the error distribution plots presented in Figure 5 indicate that the XGBoost models perform with high accuracy and stability across all four domains. The clustering of prediction errors at low percentages, along with the absence of significant discrepancies between training and testing datasets, demonstrates the strong generalization ability of the developed models.
4.4. Influence of input parameters on punching shear capacity
Figure 6 presents the relationships between the individual input parameters and the ultimate punching shear capacity, $ {P}_u $
, across the four geometric domains. To improve clarity and streamline the presentation, the datasets from all four geometric domains were consolidated, and the parameter-to-failure load relationships are presented collectively, thereby minimizing the number of figures while enabling a more coherent and comprehensive interpretation of the observed trends. These plots highlight how variations in material strengths, geometric proportions, support conditions, and reinforcement layouts influence the
$ {P}_u $
, across the four geometric domains. To improve clarity and streamline the presentation, the datasets from all four geometric domains were consolidated, and the parameter-to-failure load relationships are presented collectively, thereby minimizing the number of figures while enabling a more coherent and comprehensive interpretation of the observed trends. These plots highlight how variations in material strengths, geometric proportions, support conditions, and reinforcement layouts influence the $ {P}_u $
predictions. By analyzing the observed ranges and trends, the graphs offer valuable insight into the relative contribution of each parameter and its structural implications for punching shear capacity in different slab-column configurations.
$ {P}_u $
predictions. By analyzing the observed ranges and trends, the graphs offer valuable insight into the relative contribution of each parameter and its structural implications for punching shear capacity in different slab-column configurations.
Relationship between input parameters and punching shear capacity across all domains.

For the material strength in Figure 6a, $ {f}_c^{\prime } $
across all domains (SS, CC, SC, and CS) ranges from about 10 to 150 MPa, with
$ {f}_c^{\prime } $
across all domains (SS, CC, SC, and CS) ranges from about 10 to 150 MPa, with $ {P}_u $
rising from below 600 kN at the lowest strengths to nearly 3,000 kN at the upper bound. This strong upward trend confirms that higher concrete strength directly enhances shear resistance by increasing the compressive capacity of the slab and delaying punching cone formation. In contrast,
$ {P}_u $
rising from below 600 kN at the lowest strengths to nearly 3,000 kN at the upper bound. This strong upward trend confirms that higher concrete strength directly enhances shear resistance by increasing the compressive capacity of the slab and delaying punching cone formation. In contrast, $ {f}_y $
, which spans roughly 150–900 MPa, shows a more moderate effect in Figure 6b.
$ {f}_y $
, which spans roughly 150–900 MPa, shows a more moderate effect in Figure 6b. $ {P}_u $
increase with higher
$ {P}_u $
increase with higher $ {f}_y $
, from around 600 kN at the low end to nearly 2,400 kN at higher strengths, but the scatter in the plots indicates that
$ {f}_y $
, from around 600 kN at the low end to nearly 2,400 kN at higher strengths, but the scatter in the plots indicates that $ {f}_y $
is a secondary factor compared with
$ {f}_y $
is a secondary factor compared with $ {f}_c^{\prime } $
. This outcome is consistent with structural mechanics, as punching shear is primarily governed by concrete strength and geometry, with reinforcement properties contributing mainly through crack control and ductility improvements.
$ {f}_c^{\prime } $
. This outcome is consistent with structural mechanics, as punching shear is primarily governed by concrete strength and geometry, with reinforcement properties contributing mainly through crack control and ductility improvements.
For the column geometry, the influence is evident across the domains where these parameters apply. In the SS and SC-domains, $ {b}_{cx} $
and
$ {b}_{cx} $
and $ {b}_{cy} $
vary between about 150 mm and 600 mm (Figure 6c,d), with
$ {b}_{cy} $
vary between about 150 mm and 600 mm (Figure 6c,d), with $ {P}_u $
increasing steadily from around 600 kN for smaller columns to nearly 3,000 kN for larger ones, showing the direct benefit of a longer shear perimeter. In Figure 6e,
$ {P}_u $
increasing steadily from around 600 kN for smaller columns to nearly 3,000 kN for larger ones, showing the direct benefit of a longer shear perimeter. In Figure 6e, $ {A}_c $
(SS-domain) spans ~50,000–300,000 mm2, exhibits a similar positive correlation, with larger column areas associated with
$ {A}_c $
(SS-domain) spans ~50,000–300,000 mm2, exhibits a similar positive correlation, with larger column areas associated with $ {P}_u $
values approaching 2,800–3,000 kN. For the CC and CS-domains, the range of
$ {P}_u $
values approaching 2,800–3,000 kN. For the CC and CS-domains, the range of $ {d}_c $
in Figure 6f is about 50–600 mm, and the trend is equally pronounced, as
$ {d}_c $
in Figure 6f is about 50–600 mm, and the trend is equally pronounced, as $ {P}_u $
rise from about 600 kN at the smallest diameters to nearly 2,800–3,000 kN at the largest. These results confirm that column geometry is a primary determinant of punching shear capacity, as increasing perimeter length directly enlarges the critical shear surface and distributes stresses more effectively around the slab-column interface.
$ {P}_u $
rise from about 600 kN at the smallest diameters to nearly 2,800–3,000 kN at the largest. These results confirm that column geometry is a primary determinant of punching shear capacity, as increasing perimeter length directly enlarges the critical shear surface and distributes stresses more effectively around the slab-column interface.
For the slab geometry, the trends are strong and consistent across all domains. The range of $ h $
is about 100–600 mm as shown in Figure 6g, with
$ h $
is about 100–600 mm as shown in Figure 6g, with $ {P}_u $
increasing almost linearly from roughly 600 kN at the thinnest slabs to nearly 3,000 kN at the thickest, confirming slab thickness as one of the most decisive factors in resisting punching shear. In Figure 6h
$ {P}_u $
increasing almost linearly from roughly 600 kN at the thinnest slabs to nearly 3,000 kN at the thickest, confirming slab thickness as one of the most decisive factors in resisting punching shear. In Figure 6h $ {d}_{avg} $
, observed between 100 and 500 mm, shows a similar positive correlation, with capacity rising from below 800 kN at shallow depths to well above 2,500 kN at larger depths. The reinforcement layer depths in Figure 6i,j,
$ {d}_{avg} $
, observed between 100 and 500 mm, shows a similar positive correlation, with capacity rising from below 800 kN at shallow depths to well above 2,500 kN at larger depths. The reinforcement layer depths in Figure 6i,j, $ {d}_1 $
and
$ {d}_1 $
and $ {d}_1 $
, vary within ~80–400 mm, and both demonstrate that greater embedment leads to higher
$ {d}_1 $
, vary within ~80–400 mm, and both demonstrate that greater embedment leads to higher $ {P}_u $
, climbing from around 600–800 kN at small values to more than 2,400 kN at the upper range. These outcomes align with structural mechanics, as increased slab thickness and reinforcement depth enlarge the effective shear perimeter, improve crack resistance, and delay punching shear failure.
$ {P}_u $
, climbing from around 600–800 kN at small values to more than 2,400 kN at the upper range. These outcomes align with structural mechanics, as increased slab thickness and reinforcement depth enlarge the effective shear perimeter, improve crack resistance, and delay punching shear failure.
For the boundary conditions, the parameters $ {e}_{sx} $
and
$ {e}_{sx} $
and $ {e}_{sy} $
in Figure 6k,l vary broadly across the dataset—roughly 400–2,500 mm—and
$ {e}_{sy} $
in Figure 6k,l vary broadly across the dataset—roughly 400–2,500 mm—and $ {P}_u $
shows only a modest increase over that range (typical loads move from about 600–900 kN at the smallest clearances to ~1,200–2,200 kN at the largest), with substantial scatter; this indicates
$ {P}_u $
shows only a modest increase over that range (typical loads move from about 600–900 kN at the smallest clearances to ~1,200–2,200 kN at the largest), with substantial scatter; this indicates $ {e}_{sx} $
and
$ {e}_{sx} $
and $ {e}_{sy} $
has a measurable but weak effect, except in near-edge cases where the critical perimeter is truncated. Likewise in Figure 6m,n,
$ {e}_{sy} $
has a measurable but weak effect, except in near-edge cases where the critical perimeter is truncated. Likewise in Figure 6m,n, $ {s}_x $
and
$ {s}_x $
and $ {s}_y $
range ~400–2,000 mm and produce a gentle upward trend in
$ {s}_y $
range ~400–2,000 mm and produce a gentle upward trend in $ {P}_u $
(again roughly 600 to 1,500–2,200 kN across the span), but the cloud of points shows that support span is not a primary driver—its influence appears largely through interaction with slab depth and column size (larger spans reduce confinement and can lower capacity for shallow slabs, whereas for deep or highly reinforced slabs the effect is negligible). In short, boundary parameters affect punching capacity only secondarily and mainly when they change the effective boundary condition from interior to edge/near-edge behavior; otherwise, geometry and material dominate.
$ {P}_u $
(again roughly 600 to 1,500–2,200 kN across the span), but the cloud of points shows that support span is not a primary driver—its influence appears largely through interaction with slab depth and column size (larger spans reduce confinement and can lower capacity for shallow slabs, whereas for deep or highly reinforced slabs the effect is negligible). In short, boundary parameters affect punching capacity only secondarily and mainly when they change the effective boundary condition from interior to edge/near-edge behavior; otherwise, geometry and material dominate.
For reinforcement detailing, $ {s}_1 $
,
$ {s}_1 $
, $ {s}_2 $
, and
$ {s}_2 $
, and $ {\rho}_1 $
,
$ {\rho}_1 $
, $ {\rho}_2 $
show the expected trends in Figure 6o,r. Where,
$ {\rho}_2 $
show the expected trends in Figure 6o,r. Where, $ {s}_1 $
and
$ {s}_1 $
and $ {s}_2 $
typically range from 30 to 300 mm, with
$ {s}_2 $
typically range from 30 to 300 mm, with $ {P}_u $
rising from roughly 600 to 900 kN at the largest spacings to about 1,500–2,800 kN at the tightest spacings; the effect is strongest for
$ {P}_u $
rising from roughly 600 to 900 kN at the largest spacings to about 1,500–2,800 kN at the tightest spacings; the effect is strongest for $ {s}_1 $
because closer first-layer bars control crack widths and mobilize tensile forces sooner. While,
$ {s}_1 $
because closer first-layer bars control crack widths and mobilize tensile forces sooner. While, $ {\rho}_1 $
and
$ {\rho}_1 $
and $ {\rho}_2 $
vary roughly 0.005–0.05%, and
$ {\rho}_2 $
vary roughly 0.005–0.05%, and $ {P}_u $
increases markedly as the steal ratio grows from 0.005 to 0.02 (typical gains from
$ {P}_u $
increases markedly as the steal ratio grows from 0.005 to 0.02 (typical gains from $ \sim $
700 kN to >2,000 kN), but gains diminish beyond
$ \sim $
700 kN to >2,000 kN), but gains diminish beyond $ \rho \approx $
0.02, indicating diminishing returns once adequate flexural reinforcement exists. Overall, tighter spacing and a higher first-layer ratio consistently improve
$ \rho \approx $
0.02, indicating diminishing returns once adequate flexural reinforcement exists. Overall, tighter spacing and a higher first-layer ratio consistently improve $ {P}_u $
, but their practical benefit plateaus, so design emphasis should remain first on geometry and concrete strength.
$ {P}_u $
, but their practical benefit plateaus, so design emphasis should remain first on geometry and concrete strength.
Taken together, the parameter to failure load trends in Figure 6 confirm that slab geometry and column geometry are the primary determinants of punching shear capacity, consistently showing strong, nearly proportional increases in $ {P}_u $
as these dimensions grow. Concrete compressive strength also emerges as a dominant factor, while reinforcement yield strength exerts a secondary but supportive influence. Boundary condition parameters display only modest effects, mainly relevant in edge or near-edge cases, whereas reinforcement detailing improves capacity through crack control and stress redistribution, though with diminishing returns beyond certain reinforcement levels. These findings emphasize that while reinforcement and support conditions refine the response, the governing mechanisms of punching shear are primarily driven by concrete strength and geometric characteristics of the slab-column geometry.
$ {P}_u $
as these dimensions grow. Concrete compressive strength also emerges as a dominant factor, while reinforcement yield strength exerts a secondary but supportive influence. Boundary condition parameters display only modest effects, mainly relevant in edge or near-edge cases, whereas reinforcement detailing improves capacity through crack control and stress redistribution, though with diminishing returns beyond certain reinforcement levels. These findings emphasize that while reinforcement and support conditions refine the response, the governing mechanisms of punching shear are primarily driven by concrete strength and geometric characteristics of the slab-column geometry.
4.5. Uncertainty and reliability analysis
The reliability of a predictive model for structural safety is not only judged by its overall accuracy but also by the balance between conservative and unsafe predictions. Underprediction of $ {P}_u $
can be regarded as conservative, meaning the model estimates lower than the true capacity, thereby ensuring safety but possibly leading to uneconomical designs. On the other hand, overprediction represents an unsafe condition, as the model forecasts a higher capacity than the actual, which could risk structural failure.
$ {P}_u $
can be regarded as conservative, meaning the model estimates lower than the true capacity, thereby ensuring safety but possibly leading to uneconomical designs. On the other hand, overprediction represents an unsafe condition, as the model forecasts a higher capacity than the actual, which could risk structural failure.
In this study, the reliability of the XGBoost model was quantified using the bias factor, defined as the mean of predicted-to-actual ratios, and the COV, which characterizes the scatter of these ratios. These metrics are commonly employed in the structural engineering literature for assessing empirical and mechanics-based models, enabling direct comparison with nonmachine-learning approaches. The statistical evaluation of model predictions across the four geometric domains presented in Table 8 demonstrates strong accuracy and reliability. In the SS-domain, the bias factor is slightly below unity at 0.998, with a standard deviation of 0.0305 and a COV of 0.031, indicating very low bias and stable prediction accuracy. For the CC-domain, the bias factor of 1.002, together with a standard deviation of ratios of 0.0199 and a COV of 0.020, confirms that the predictions are nearly unbiased and highly consistent. The SC-domain has a bias factor of 0.994, a standard deviation of 0.0570, and a COV of 0.057, reflecting a minor underestimation accompanied by relatively higher variability compared to the other domains. Finally, the CS-Domain shows a bias factor of 1.006, a standard deviation of 0.0293, and a COV of 0.029, suggesting a marginal overestimation tendency but with consistency comparable to other domains. Overall, the bias factors remain close to unity, and COV values below 0.06 confirm that the models provide reliable predictions across all domains, with slightly reduced precision in the SC-domain.
Statistical evaluation of model predictions across the domains

These outcomes confirm that the XGBoost model provides a balanced trade-off between conservativeness and risk, with only marginal deviations from unity. Importantly, the low COV values highlight that the model does not produce excessive unsafe predictions, thus enhancing its reliability for practical applications.
5. Feature importance and interpretability
In addition to predictive performance, the interpretability of ML models is of critical importance in engineering applications, as it provides insights into the relative contribution of each input variable to the prediction outcome (Lyngdoh and Das, Reference Lyngdoh, Mohd Zaki and Das2022; Mangalathu et al., Reference Mangalathu, Karthikeyan, Feng and Jeon2022; Bomrah et al., Reference Bomrah, Uddin, Upadhyay, Komorowski, Priya, Dhar, Hsu and Syed-Abdul2024; Tursunalieva et al., Reference Tursunalieva, David, Dunne, Li, Riera and Zhao2024). Feature importance analysis was conducted in this study to quantify the influence of individual parameters on the model’s predictions (Rajbahadur et al., Reference Rajbahadur, Wang, Oliva, Kamei and Hassan2021; Saarela and Jauhiainen, Reference Saarela and Jauhiainen2021). Within the XGBoost framework, feature importance is typically derived from metrics such as gain, cover, or frequency, which capture how often and how effectively a feature is used in tree splits during the boosting process. These measures allow the identification of dominant variables that govern the model’s behavior, thereby enhancing transparency and supporting engineering judgment. Furthermore, advanced interpretability techniques such as SHAP can be employed to provide a more rigorous, instance-level interpretation by attributing contributions of each feature to the final prediction (Lundberg and Lee, Reference Lundberg and Lee2017). Such interpretability not only strengthens the reliability of the developed model but also bridges the gap between data-driven predictions and practical engineering understanding.
5.1. Quantitative feature importance across geometric domains
The mean absolute SHAP value provides a quantitative ranking of the global importance of each input feature to the model’s predictions. Figure 7 presents these rankings for each geometric domain, which corroborate and quantify the trends observed in the corresponding SHAP summary plots.
Global feature importance of input parameters based on mean SHAP values.

The SS-domain in Figure 7a shows that the prediction of shear response is primarily governed by section geometry and material strength parameters. The SHAP bar chart demonstrates that $ h $
has the highest importance, with its average SHAP value approaching 120%, confirming its decisive role in governing
$ h $
has the highest importance, with its average SHAP value approaching 120%, confirming its decisive role in governing $ {P}_u $
. In this configuration, the critical shear perimeter follows the orthogonal edges of the column, so increasing
$ {P}_u $
. In this configuration, the critical shear perimeter follows the orthogonal edges of the column, so increasing $ h $
directly enlarges the shear-resisting depth and delays the formation of a punching cone. The second most influential factor is
$ h $
directly enlarges the shear-resisting depth and delays the formation of a punching cone. The second most influential factor is $ {d}_{avg} $
, with a SHAP magnitude of about 85%, followed by
$ {d}_{avg} $
, with a SHAP magnitude of about 85%, followed by $ {f}_c^{\prime } $
at roughly 45%, both showing that effective depth and concrete strength strongly shape punching shear predictions.
$ {f}_c^{\prime } $
at roughly 45%, both showing that effective depth and concrete strength strongly shape punching shear predictions. $ {d}_1 $
appears next at ~43, highlighting the importance of reinforcement depth, as deeper reinforcement placement increases anchorage and restrains crack propagation. Additionally, the
$ {d}_1 $
appears next at ~43, highlighting the importance of reinforcement depth, as deeper reinforcement placement increases anchorage and restrains crack propagation. Additionally, the $ {\rho}_1 $
was identified as one of the top five features, signifying its role in shear transfer mechanisms, though its contribution was relatively smaller compared to geometric and material parameters. In contrast, parameters such as
$ {\rho}_1 $
was identified as one of the top five features, signifying its role in shear transfer mechanisms, though its contribution was relatively smaller compared to geometric and material parameters. In contrast, parameters such as $ {s}_1 $
and
$ {s}_1 $
and $ {s}_y $
exhibited minimal relative importance, with near-zero SHAP values, suggesting that spacing-related effects were not significant within the SS-domain predictions.
$ {s}_y $
exhibited minimal relative importance, with near-zero SHAP values, suggesting that spacing-related effects were not significant within the SS-domain predictions.
In the CC-domain (Figure 7b), the SHAP-based feature importance analysis shows a very clear dominance of section depth over all other parameters. The parameter $ h $
is by far the most influential feature, with a relative importance of ~135%, which is more than double that of any other parameter. This extremely high SHAP value contribution highlights the governing role of section depth in controlling the shear response in the CC-domain, reflecting its fundamental influence on structural capacity. The
$ h $
is by far the most influential feature, with a relative importance of ~135%, which is more than double that of any other parameter. This extremely high SHAP value contribution highlights the governing role of section depth in controlling the shear response in the CC-domain, reflecting its fundamental influence on structural capacity. The $ {d}_{avg} $
is the second most significant factor, with a relative importance around 50%, indicating that reinforcement distribution and depth interplay remain essential in this domain. The
$ {d}_{avg} $
is the second most significant factor, with a relative importance around 50%, indicating that reinforcement distribution and depth interplay remain essential in this domain. The $ {f}_c^{\prime } $
follows with about 40% relative importance, demonstrating its critical effect on material resistance and confirming that higher strength concretes contribute substantially to predicted capacity. The
$ {f}_c^{\prime } $
follows with about 40% relative importance, demonstrating its critical effect on material resistance and confirming that higher strength concretes contribute substantially to predicted capacity. The $ {s}_1 $
also contributes meaningfully (about 25%). Within the column geometry category, the
$ {s}_1 $
also contributes meaningfully (about 25%). Within the column geometry category, the $ {d}_c $
is also highly ranked. A larger column footprint enlarges the punching shear perimeter, reduces local stress concentration, and improves the distribution of load into the slab. This explains why
$ {d}_c $
is also highly ranked. A larger column footprint enlarges the punching shear perimeter, reduces local stress concentration, and improves the distribution of load into the slab. This explains why $ {d}_c $
is an important geometric factor in the CC-domain. The longitudinal reinforcement ratio
$ {d}_c $
is an important geometric factor in the CC-domain. The longitudinal reinforcement ratio $ {\rho}_1 $
is included among the top five parameters with a relative importance of roughly 10%, underscoring its role, though less pronounced compared to geometric and material parameters. On the other hand, boundary conditions and reinforcement detailing appear least influential in this domain. Specifically,
$ {\rho}_1 $
is included among the top five parameters with a relative importance of roughly 10%, underscoring its role, though less pronounced compared to geometric and material parameters. On the other hand, boundary conditions and reinforcement detailing appear least influential in this domain. Specifically, $ {e}_{sy} $
and
$ {e}_{sy} $
and $ {s}_y $
from boundary conditions and the
$ {s}_y $
from boundary conditions and the $ {s}_2 $
from reinforcement detailing fall at the bottom of the SHAP rankings. Overall, the SHAP value distribution in the CC-domain strongly emphasizes the supremacy of sectional geometry (
$ {s}_2 $
from reinforcement detailing fall at the bottom of the SHAP rankings. Overall, the SHAP value distribution in the CC-domain strongly emphasizes the supremacy of sectional geometry ( $ h $
,
$ h $
, $ {d}_{acg} $
) and material strength (
$ {d}_{acg} $
) and material strength ( $ {f}_c^{\prime}\Big) $
in shaping model predictions, while reinforcement amount (
$ {f}_c^{\prime}\Big) $
in shaping model predictions, while reinforcement amount ( $ {\rho}_1 $
) has a secondary effect, and strain/spacing parameters contribute very little.
$ {\rho}_1 $
) has a secondary effect, and strain/spacing parameters contribute very little.
In Figure 7c, the SHAP importance distribution indicates that $ {f}_c^{\prime } $
is the single most dominant predictor in the SC-domain, with a relative importance of ~48–50%. This reflects the governing role of material strength in this domain, where shear capacity is strongly influenced by the ability of concrete to resist diagonal cracking. The
$ {f}_c^{\prime } $
is the single most dominant predictor in the SC-domain, with a relative importance of ~48–50%. This reflects the governing role of material strength in this domain, where shear capacity is strongly influenced by the ability of concrete to resist diagonal cracking. The $ {\rho}_1 $
and
$ {\rho}_1 $
and $ {\rho}_2 $
emerges as the second and third most significant features, respectively (≈25%), underscoring their roles in improving ductility and redistributing stresses. Web geometry (
$ {\rho}_2 $
emerges as the second and third most significant features, respectively (≈25%), underscoring their roles in improving ductility and redistributing stresses. Web geometry ( $ {b}_{cy} $
) contributes around 10–12%, confirming that confinement and cross-sectional shape also play meaningful roles. The
$ {b}_{cy} $
) contributes around 10–12%, confirming that confinement and cross-sectional shape also play meaningful roles. The $ h $
and
$ h $
and $ {d}_1 $
appear with moderate importance (≈5–7%), reflecting their contribution to load transfer and shear span effects. By contrast, parameters such as
$ {d}_1 $
appear with moderate importance (≈5–7%), reflecting their contribution to load transfer and shear span effects. By contrast, parameters such as $ {b}_{cx} $
,
$ {b}_{cx} $
, $ {c}_y $
, and
$ {c}_y $
, and $ {c}_x $
show negligible SHAP contributions (<2%), indicating that width-related and spacing parameters have very limited impact on the predictions in the SC-domain.
$ {c}_x $
show negligible SHAP contributions (<2%), indicating that width-related and spacing parameters have very limited impact on the predictions in the SC-domain.
In Figure 7d, the column geometry parameter $ {d}_c $
is among the most influential parameters with a relative importance of about 230–240%. This is expected because the geometry of the column directly determines how loads are introduced into the slab, and larger depths reduce stress concentrations that trigger punching failure. The slab geometry parameter, particularly
$ {d}_c $
is among the most influential parameters with a relative importance of about 230–240%. This is expected because the geometry of the column directly determines how loads are introduced into the slab, and larger depths reduce stress concentrations that trigger punching failure. The slab geometry parameter, particularly $ h $
, follows as the second most important factor (≈120–130%), ranking high in the SHAP analysis. Their influence shows that both column and slab dimensions work together to resist punching shear in the CS-domain. From the material strength category, both
$ h $
, follows as the second most important factor (≈120–130%), ranking high in the SHAP analysis. Their influence shows that both column and slab dimensions work together to resist punching shear in the CS-domain. From the material strength category, both $ {f}_c^{\prime } $
and
$ {f}_c^{\prime } $
and $ {f}_y $
remain important contributors. They provide the material basis for resistance, though their influence is less dominant compared to geometry. This reflects a balance: geometry sets the structural proportions while material strengths provide the capacity. The reinforcement detailing parameters
$ {f}_y $
remain important contributors. They provide the material basis for resistance, though their influence is less dominant compared to geometry. This reflects a balance: geometry sets the structural proportions while material strengths provide the capacity. The reinforcement detailing parameters $ {\rho}_1 $
and
$ {\rho}_1 $
and $ {\rho}_2 $
each contributes modestly, highlighting the role of reinforcement in supplementing geometry. At the bottom of the ranking, parameters (such as
$ {\rho}_2 $
each contributes modestly, highlighting the role of reinforcement in supplementing geometry. At the bottom of the ranking, parameters (such as $ {e}_{sy} $
,
$ {e}_{sy} $
, $ {s}_2 $
, and
$ {s}_2 $
, and $ {d}_2 $
) appear least influential. This indicates that in the CS-domain, punching shear strength is governed far more by column diameter, slab thickness, and material properties than by external restraints.
$ {d}_2 $
) appear least influential. This indicates that in the CS-domain, punching shear strength is governed far more by column diameter, slab thickness, and material properties than by external restraints.
5.2. Analysis of feature importance via SHAP values
The SHAP summary plots (Figure 8) provide a unified measure of feature importance and impact for the predictive model developed in this study. The following analysis interprets these plots for each geometric domain, revealing how the model leverages input parameters differently based on slab and column shape.
Relative importance of parameters across domains from XGBoost feature importance analysis.

In the SS-domain (Figure 8a), the slab geometry parameter $ h $
is clearly the most dominant feature. The SHAP values indicate that higher values of
$ h $
is clearly the most dominant feature. The SHAP values indicate that higher values of $ h $
generally push the prediction upward, while smaller values tend to shift predictions downward. This consistent and wide effect highlights its structural significance. Similarly,
$ h $
generally push the prediction upward, while smaller values tend to shift predictions downward. This consistent and wide effect highlights its structural significance. Similarly, $ {d}_{avg} $
and
$ {d}_{avg} $
and $ {d}_1 $
also play a strong role, with higher values typically associated with higher SHAP contributions. The color distribution suggests a clear monotonic relationship, where large feature values positively influence predictions. Other variables, such as
$ {d}_1 $
also play a strong role, with higher values typically associated with higher SHAP contributions. The color distribution suggests a clear monotonic relationship, where large feature values positively influence predictions. Other variables, such as $ {f}_c^{\prime } $
,
$ {f}_c^{\prime } $
, $ {\rho}_1 $
, and
$ {\rho}_1 $
, and $ {b}_{cy} $
, show moderate impacts, but with some heterogeneity. For example, in
$ {b}_{cy} $
, show moderate impacts, but with some heterogeneity. For example, in $ {f}_c^{\prime } $
, low values are generally negative, while higher values raise the output, showing a consistent strength–capacity relationship. The spread of points for variables like
$ {f}_c^{\prime } $
, low values are generally negative, while higher values raise the output, showing a consistent strength–capacity relationship. The spread of points for variables like $ {A}_c $
and
$ {A}_c $
and $ {e}_{sy} $
indicates nonlinear interactions, where effects are not uniform across samples. Outliers are evident, especially for reinforcement-related variables, pointing to variability due to sample-specific reinforcement configurations. Overall, the SS-domain plot demonstrates that the geometry parameters (
$ {e}_{sy} $
indicates nonlinear interactions, where effects are not uniform across samples. Outliers are evident, especially for reinforcement-related variables, pointing to variability due to sample-specific reinforcement configurations. Overall, the SS-domain plot demonstrates that the geometry parameters ( $ h $
,
$ h $
, $ {d}_{avg} $
, and
$ {d}_{avg} $
, and $ {d}_1 $
) and material properties (
$ {d}_1 $
) and material properties ( $ {f}_c^{\prime } $
and
$ {f}_c^{\prime } $
and $ {\rho}_1 $
) are the most influential, with broad spreads that highlight sample heterogeneity and possible nonlinear structural behaviors.
$ {\rho}_1 $
) are the most influential, with broad spreads that highlight sample heterogeneity and possible nonlinear structural behaviors.
The SHAP summary plot for the CC-domain in Figure 8b shows that the slab geometry parameter ( $ h\Big) $
again emerges as the most critical factor, with larger depths pushing predictions upward. The consistent separation of colors around the SHAP axis indicates a strong and monotonic effect.
$ h\Big) $
again emerges as the most critical factor, with larger depths pushing predictions upward. The consistent separation of colors around the SHAP axis indicates a strong and monotonic effect. $ {d}_{avg} $
also ranks highly, showing a wide spread that suggests variable effects across samples. The broad variability in SHAP values for
$ {d}_{avg} $
also ranks highly, showing a wide spread that suggests variable effects across samples. The broad variability in SHAP values for $ {d}_{avg} $
highlights nonlinear interactions, potentially reflecting the influence of geometric irregularities on capacity.
$ {d}_{avg} $
highlights nonlinear interactions, potentially reflecting the influence of geometric irregularities on capacity. $ {f}_c^{\prime } $
remains important, but compared to the SS-domain, its impact appears more variable with some overlapping effects. The parameters (
$ {f}_c^{\prime } $
remains important, but compared to the SS-domain, its impact appears more variable with some overlapping effects. The parameters ( $ {s}_1 $
,
$ {s}_1 $
, $ {s}_2 $
) and (
$ {s}_2 $
) and ( $ {d}_c $
,
$ {d}_c $
, $ {d}_1 $
) also show noticeable influence, with higher values generally linked to positive SHAP shifts. Interestingly, reinforcement parameters (
$ {d}_1 $
) also show noticeable influence, with higher values generally linked to positive SHAP shifts. Interestingly, reinforcement parameters ( $ {\rho}_1 $
,
$ {\rho}_1 $
, $ {\rho}_2 $
) and
$ {\rho}_2 $
) and $ {f}_c $
have smaller yet noticeable impacts, though their spreads are narrower, suggesting more stable and less heterogeneous contributions compared to geometry-driven features. Overall, the CC-domain followed by the SS-domain plot emphasizes geometry-driven dominance (
$ {f}_c $
have smaller yet noticeable impacts, though their spreads are narrower, suggesting more stable and less heterogeneous contributions compared to geometry-driven features. Overall, the CC-domain followed by the SS-domain plot emphasizes geometry-driven dominance ( $ h $
,
$ h $
, $ {d}_{avg} $
), followed by material strength (
$ {d}_{avg} $
), followed by material strength ( $ {f}_c^{\prime } $
) and reinforcement measures. Compared to the SS-domain, the CC-domain shows slightly less dispersion in secondary features, suggesting that predictions in this domain are more consistently governed by geometric factors with reduced variability from reinforcement and material property interactions.
$ {f}_c^{\prime } $
) and reinforcement measures. Compared to the SS-domain, the CC-domain shows slightly less dispersion in secondary features, suggesting that predictions in this domain are more consistently governed by geometric factors with reduced variability from reinforcement and material property interactions.
For the SC-domain in Figure 8c, the ranking of parameters differs notably. The mechanical property $ {f}_c^{\prime } $
is the most important predictor. This may indicate that for this rarer configuration, where a square column creates a stress concentration in an axisymmetric circular slab, the material’s ability to resist these concentrated stresses is paramount. Following this,
$ {f}_c^{\prime } $
is the most important predictor. This may indicate that for this rarer configuration, where a square column creates a stress concentration in an axisymmetric circular slab, the material’s ability to resist these concentrated stresses is paramount. Following this, $ {\rho}_1 $
and
$ {\rho}_1 $
and $ {\rho}_2 $
also strongly affect outcomes, with higher reinforcement ratios positively driving model outputs. Interestingly,
$ {\rho}_2 $
also strongly affect outcomes, with higher reinforcement ratios positively driving model outputs. Interestingly, $ {b}_{cx} $
and
$ {b}_{cx} $
and $ h $
both show wide spreads, indicating significant heterogeneity, larger section sizes tend to increase predictions, while smaller values push them downward.
$ h $
both show wide spreads, indicating significant heterogeneity, larger section sizes tend to increase predictions, while smaller values push them downward.
Secondary features such as $ {d}_1 $
,
$ {d}_1 $
, $ {s}_1 $
,
$ {s}_1 $
, $ {e}_{sx} $
, and
$ {e}_{sx} $
, and $ {s}_2 $
exert more modest but noticeable effects. The color spread for these features suggests nonlinear interactions; for example, certain reinforcement spacings or placements can either increase or decrease predictions depending on the sample context. Features like
$ {s}_2 $
exert more modest but noticeable effects. The color spread for these features suggests nonlinear interactions; for example, certain reinforcement spacings or placements can either increase or decrease predictions depending on the sample context. Features like $ {d}_{avg} $
,
$ {d}_{avg} $
, $ {f}_y $
, and
$ {f}_y $
, and $ {e}_{sy} $
show narrower distributions, implying less variability across samples, but still contribute meaningful directional shifts. Overall, the SC-domain is strongly governed by material strength (
$ {e}_{sy} $
show narrower distributions, implying less variability across samples, but still contribute meaningful directional shifts. Overall, the SC-domain is strongly governed by material strength ( $ {f}_c^{\prime } $
) and reinforcement ratios (
$ {f}_c^{\prime } $
) and reinforcement ratios ( $ {\rho}_1 $
,
$ {\rho}_1 $
, $ {\rho}_2 $
), with geometry (
$ {\rho}_2 $
), with geometry ( $ h $
,
$ h $
, $ {b}_{cx} $
) acting as important secondary drivers.
$ {b}_{cx} $
) acting as important secondary drivers.
Finally, in Figure 8d, the CS-domain presents a unique case; the leading feature is $ {d}_c $
, which exhibits a very wide spread of SHAP values.
$ {d}_c $
, which exhibits a very wide spread of SHAP values. $ h $
and
$ h $
and $ {f}_c^{\prime } $
also emerge as critical factors, both showing strong monotonic relationships, greater section depth, and higher material strength clearly improve predictions.
$ {f}_c^{\prime } $
also emerge as critical factors, both showing strong monotonic relationships, greater section depth, and higher material strength clearly improve predictions.
The reinforcement parameters $ {\rho}_1 $
,
$ {\rho}_1 $
, $ {\rho}_2 $
, and
$ {\rho}_2 $
, and $ {f}_y $
provide additional influence but with narrower spreads compared to geometry-driven features. The beeswarm distribution for
$ {f}_y $
provide additional influence but with narrower spreads compared to geometry-driven features. The beeswarm distribution for $ {d}_{avg} $
and
$ {d}_{avg} $
and $ {e}_{cx} $
reveals variability, suggesting these features interact differently across samples. Other parameters such as
$ {e}_{cx} $
reveals variability, suggesting these features interact differently across samples. Other parameters such as $ {s}_x $
,
$ {s}_x $
, $ {s}_y $
,
$ {s}_y $
, $ {s}_1 $
,
$ {s}_1 $
, $ {s}_2 $
,
$ {s}_2 $
, $ {d}_1 $
,
$ {d}_1 $
, $ {d}_2 $
, and
$ {d}_2 $
, and $ {e}_{sy} $
are less dominant but still show scattered effects, reflecting their secondary contribution to the overall model output.
$ {e}_{sy} $
are less dominant but still show scattered effects, reflecting their secondary contribution to the overall model output.
In summary, the CS-domain is heavily influenced by geometry ( $ {d}_c $
,
$ {d}_c $
, $ h $
) and concrete strength (
$ h $
) and concrete strength ( $ {f}_c^{\prime } $
), with reinforcement effects (
$ {f}_c^{\prime } $
), with reinforcement effects ( $ {\rho}_1 $
,
$ {\rho}_1 $
, $ {\rho}_2 $
,
$ {\rho}_2 $
, $ {f}_y $
) playing a supporting but less variable role. Compared to the SC-domain, the CS-domain shows more pronounced geometric dominance, whereas SC is more material- and reinforcement-driven.
$ {f}_y $
) playing a supporting but less variable role. Compared to the SC-domain, the CS-domain shows more pronounced geometric dominance, whereas SC is more material- and reinforcement-driven.
6. Conclusions
This study developed and evaluated an XGBoost-based model for predicting the punching shear capacity $ \left({P}_u\right) $
of slab-column connections across four geometric domains (SS, CC, SC, and CS). The results demonstrated excellent predictive performance, with R 2 values exceeding 0.930 in all domains and minimal error margins, confirming the robustness of the model. The SS-domain exhibits high accuracy (R 2 = 0.997) but relatively large error magnitudes (MSE = 795.756, RMSE = 28.209, and MAE = 19.364), suggesting sensitivity to unseen samples despite strong correlation. The CC-domain achieves balanced performance, with robust generalization (R 2 = 0.990, RMSE = 15.490), indicating superior stability and reliability compared to other domains. In the SC-domain, moderate predictive capability is observed (R 2 = 0.930, RMSE = 26.009), highlighting weaker generalization and greater error dispersion relative to geometry-driven domains. Finally, the CS-domain, despite exhibiting near-perfect training accuracy, records the highest test error (MSE = 1541.393 and RMSE = 39.261), indicative of substantial overfitting. The evaluation of statistical reliability through bias factors (ranging from 0.994 to 1.006) and COVs (ranging from 0.02 to 0.057) further verified the model’s accuracy and reduced scatter compared to conventional design approaches.
$ \left({P}_u\right) $
of slab-column connections across four geometric domains (SS, CC, SC, and CS). The results demonstrated excellent predictive performance, with R 2 values exceeding 0.930 in all domains and minimal error margins, confirming the robustness of the model. The SS-domain exhibits high accuracy (R 2 = 0.997) but relatively large error magnitudes (MSE = 795.756, RMSE = 28.209, and MAE = 19.364), suggesting sensitivity to unseen samples despite strong correlation. The CC-domain achieves balanced performance, with robust generalization (R 2 = 0.990, RMSE = 15.490), indicating superior stability and reliability compared to other domains. In the SC-domain, moderate predictive capability is observed (R 2 = 0.930, RMSE = 26.009), highlighting weaker generalization and greater error dispersion relative to geometry-driven domains. Finally, the CS-domain, despite exhibiting near-perfect training accuracy, records the highest test error (MSE = 1541.393 and RMSE = 39.261), indicative of substantial overfitting. The evaluation of statistical reliability through bias factors (ranging from 0.994 to 1.006) and COVs (ranging from 0.02 to 0.057) further verified the model’s accuracy and reduced scatter compared to conventional design approaches.
The SHAP analysis reveals a clear hierarchy of influential parameters. Across the four domains, distinct yet complementary patterns of feature influence are observed. In the SS-domain, predictions are predominantly governed by slab geometry parameters ( $ h $
,
$ h $
, $ {d}_{avg} $
,
$ {d}_{avg} $
, $ {d}_1 $
), with material strength (
$ {d}_1 $
), with material strength ( $ {f}_c^{\prime } $
) and reinforcement detailing parameter (
$ {f}_c^{\prime } $
) and reinforcement detailing parameter ( $ {\rho}_1 $
) exerting secondary effects, underscoring geometry-driven behavior with notable nonlinear interactions. The CC-domain similarly highlights the slab geometry dominance (
$ {\rho}_1 $
) exerting secondary effects, underscoring geometry-driven behavior with notable nonlinear interactions. The CC-domain similarly highlights the slab geometry dominance ( $ h $
,
$ h $
, $ {d}_{avg} $
), though with reduced variability in secondary features, indicating more stable geometry-controlled responses. Conversely, the SC-domain is primarily influenced by the parameters of material strength (
$ {d}_{avg} $
), though with reduced variability in secondary features, indicating more stable geometry-controlled responses. Conversely, the SC-domain is primarily influenced by the parameters of material strength ( $ {f}_c^{\prime } $
) and reinforcement detailing (
$ {f}_c^{\prime } $
) and reinforcement detailing ( $ {\rho}_1 $
,
$ {\rho}_1 $
, $ {\rho}_2 $
), with geometric factors (
$ {\rho}_2 $
), with geometric factors ( $ h $
,
$ h $
, $ {b}_{cy} $
) assuming a supportive role, reflecting a reinforcement-material governed capacity. The CS-domain demonstrates an integrative pattern, where
$ {b}_{cy} $
) assuming a supportive role, reflecting a reinforcement-material governed capacity. The CS-domain demonstrates an integrative pattern, where $ {d}_c $
,
$ {d}_c $
, $ h $
, and
$ h $
, and $ {f}_c^{\prime } $
emerge as the most critical features, while reinforcement parameters contribute consistently but with lower heterogeneity. Collectively, these findings suggest that slab geometry is the principal driver in SS and CC domains, reinforcement–material interaction dominates in the SC domain, and a balanced synergy of geometry and material strength characterizes the CS domain.
$ {f}_c^{\prime } $
emerge as the most critical features, while reinforcement parameters contribute consistently but with lower heterogeneity. Collectively, these findings suggest that slab geometry is the principal driver in SS and CC domains, reinforcement–material interaction dominates in the SC domain, and a balanced synergy of geometry and material strength characterizes the CS domain.
List of symbols
- $ {f}_c^{\prime } $
-
concrete compressive strength
-
$ h $
-
slab thickness
-
$ {d}_1 $
-
effective depth to the first layer of tensile reinforcement
-
$ {d}_2 $
-
effective depth to the second layer of tensile reinforcement
-
$ {d}_{avg} $
-
average effective depth, defined as
$ \left({d}_1+{d}_2\right)/2 $
;
$ {d}_c $
, column diameter or characteristic column dimension -
$ {V}_u $
-
punching shear capacity (failure load)
-
$ {b}_c $
-
column width (square columns)
-
$ {A}_c $
-
column cross-sectional area


Data availability statement
The data used in this study were obtained from the publicly available fib Punching Shear Database developed jointly by fib Working Party 2.2.3 and ACI Committee 445, accessible via the Fédération Internationale du Béton (fib) website: https://www.fib-international.org/commissions/databases.html.
Author contribution
Conceptualization-Lead: A.Q.K.; Data Curation-Lead: A.Q.K., M.R.; Formal Analysis-Lead: A.Q.K.; Investigation-Lead: A.Q.K.; Methodology-Equal: A.Q.K., M.R.; Project Administration-Equal: M.R., A.P.; Resources-Lead: A.P.; Supervision-Lead: A.P.; Visualization-Lead: A.Q.K., M.R.; Writing – Original Draft-Lead: A.Q.K.; Writing – Review & Editing-Equal: M.R., A.P.
Funding statement
This research received no specific grant from any funding agency in the public, commercial, or not-for-profit sectors.
Competing interests
The authors declare none.


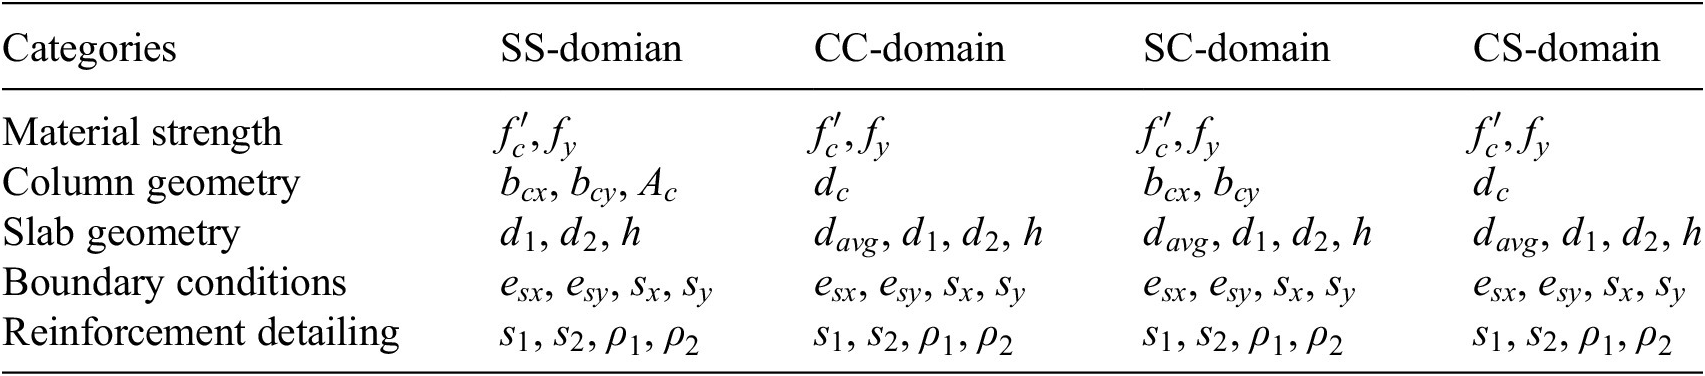

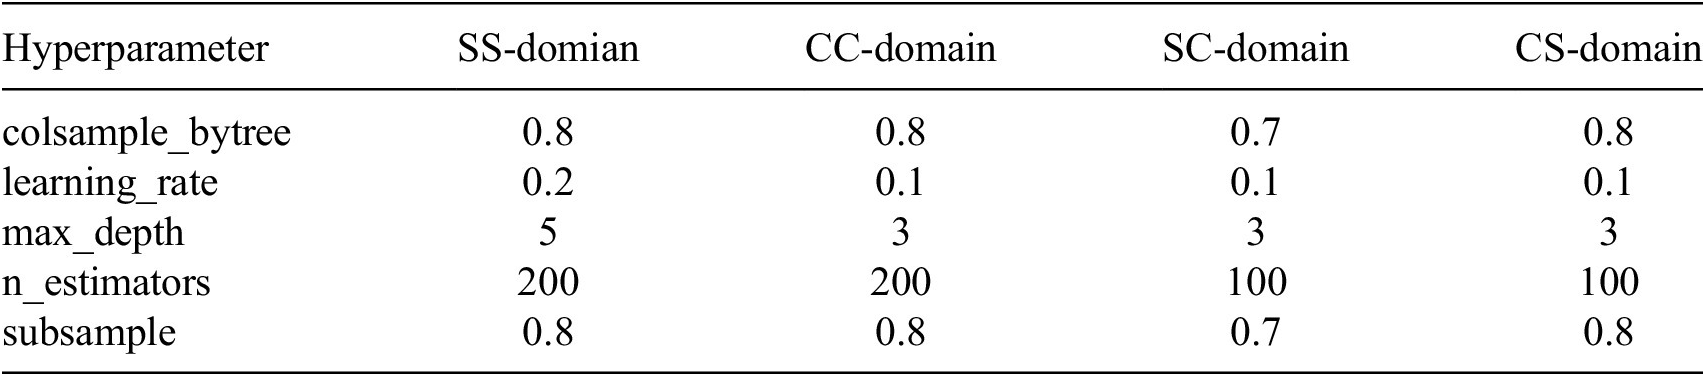

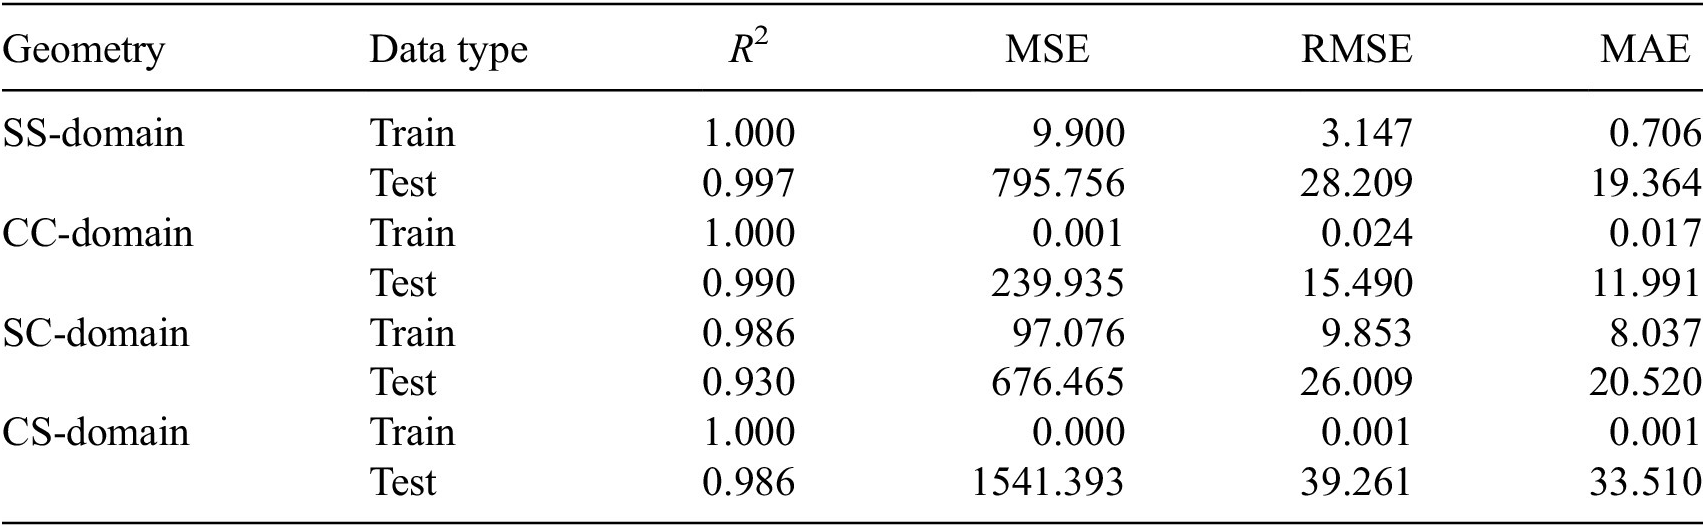


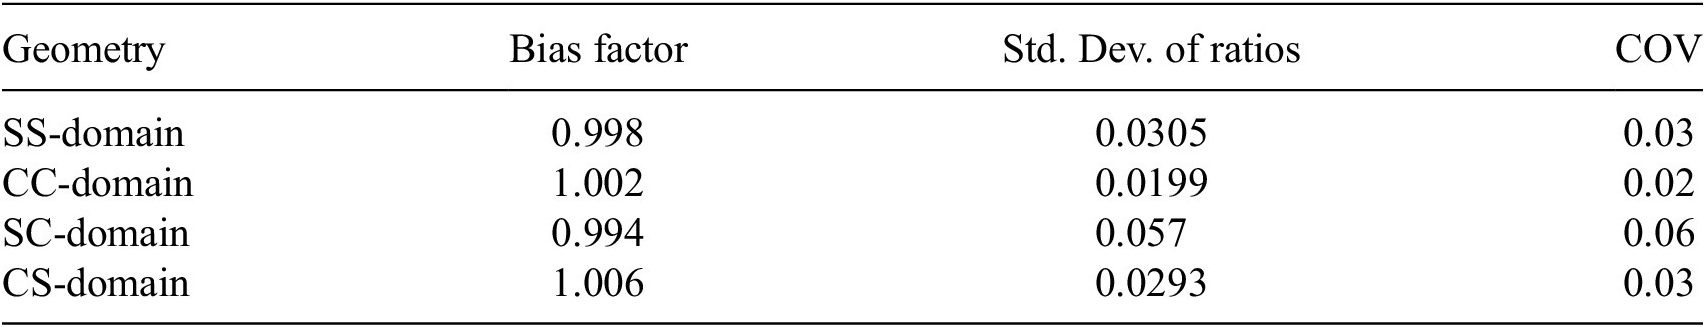


 Open access
Comments
No Comments have been published for this article.