

Introduction
Students’ attendance and preparation for lectures often is voluntary, and assessment of learning outcomes occurs only at the end of the term. These structural challenges may induce students to focus both their attention and study efforts, largely on the final exam, instead of engaging continuously with the lecture’s content as the semester progresses. Especially in this situation, instructors are keen to foster learning, using innovative teaching tools and techniques, such as an audience response system (Gormley-Heenan and Mccartan Reference Gormley-Heenan and Mccartan2009; Mayhew Reference Mayhew2019) and flipped classrooms (Jenkins Reference Jenkins2015). However, the success of new teaching tools cannot be taken for granted, and research into the effect of educational technology has attracted ample scholarly attention (Bedenlier et al. Reference Bedenlier, Bond and Buntins2020; Henderson et al. Reference Henderson, Selwyn and Aston2017; Selwyn Reference Selwyn2016). This research has demonstrated how the informed use of new teaching methods can foster students’ engagement with courses and their material (Schindler et al. Reference Schindler, Burkholder and Morad2017).
Against this backdrop, we explore to what extent educational technology can counteract the structural challenges of large lecture courses. More specifically, can instructors, by providing students with regular unobtrusive encouragements to engage with the course and its literature improve learning outcomes? We address these questions using a pre-registered experiment, in which students receive weekly text messages, informing them about the upcoming lecture, and the assigned readings. Building on a literature researching the effect of recurring reminders to induce positive behavioural changes (e.g. Castleman and Page Reference Castleman and Page2015; Dale and Strauss Reference Dale and Strauss2009; Fjeldsoe et al. Reference Fjeldsoe, Marshall and Miller2009), we expect that students’ self-motivated learning and performance increases, when they receive personalised reminders.
This article has two goals. First, we advocate using experimental designs, for testing the effectiveness of new teaching techniques, and show how experimental designs can be implemented in a large lecture. To this end, we developed an experimental design that can serve as an easily implementable template to facilitate more experimental tests of learning tools in political science and beyond. Second, we test whether short information treatments delivered by text messages raise learning outcomes. In our experiment, we rely on voluntary subjects from a large introductory lecture course. We randomly sample students, who receive text messages, reminding them about the weekly reading load for the course. We test whether these reading reminders affect two outcomes, corresponding to formative and summative learning: quizzes at the beginning of lectures and grades in a final exam. In the experiment, we do not find differences between students, who received a reminder, and those, who did not for both learning outcomes. In the discussion, we explore several reasons for the null effect, including, attrition, statistical power, and the strength of information treatments. More important than these particular design features, these null findings stress the need to evaluate new teaching techniques rigorously, and when possible, experimentally.
Reminding students to learn
Students’ independent engagement with assigned coursework prior to classes is a cornerstone of their academic success (Barkley and Major Reference Barkley and Major2020; Hockings et al. Reference Hockings, Cooke and Yamashita2008), and is an absolute prerequisite for many contemporary forms of teaching, such as flipped classrooms (Jenkins Reference Jenkins2015; O’Flaherty and Phillips Reference O’Flaherty and Phillips2015). Hence, a crucial task that is particularly prevalent in large lectures is getting students to engage with the material independently. This independent motivation on behalf of the students, which refers to the idea that students are willing to invest their time and attention in a course, cannot be taken for granted (Ambrose Reference Ambrose2010: 68). An easily measurable aspect of independent student engagement is students’ completion of assigned readings. Researchers have been tracking the completion rate of course readings for decades and, while results vary, the overall conclusion is dire in the sense that most students fail to sufficiently engage with their reading assignments (Johnson 2019). The rate by which students completed their reading assignments, plummeted by almost 60 percentage points towards the end of the last millennium (Burchfield and Sappington Reference Burchfield and Sappington2000), and has ever since, remained relatively stable at about 25% (Baier et al. 2011; Clump et al. Reference Clump, Bauer and Bradley2004; Ribera and Wang 2015). This drop coincides with the expansion and wider societal reach of higher education, which diversified students’ reading skills, as well as their motivation to work towards a university degree (Baron and Mangen Reference Baron and Mangen2021).
Completing weekly coursework is, of course, not a goal in itself, but ultimately is meant to improve learning outcomes. Literature on learning typically distinguishes between two types of outcomes and assessment (Ambrose Reference Ambrose2010; Bloom et al. Reference Bloom, Hastings and Madaus1971). Formative learning refers to feedback, while students are still in the process of learning. It is typically focused on a particular task, and provides immediate evaluations for students and teachers. Summative assessments occur at the end of a course or program and “give a final judgement or evaluation of proficiency, such as grade and scores” (Ambrose Reference Ambrose2010: 193).
Bearing in mind low reading completion rates, and the importance of continuous engagement for learning outcomes, it becomes increasingly paramount for instructors to encourage student learning, and enhance their intrinsic motivation to engage continually with course materials. To do so, we combine weekly quizzes, administered using audience response systems (ARS), and a reoccurring encouragement by the instructor to read the required materials via personalised text messages. Particularly researched in the realm of public health, this sort of intervention has turned out to be effective in supporting smoking cessation (Free et al. Reference Free, Knight, Robertson, Whittaker, Edwards, Zhou, Rodgers, Cairns, Kenward and Roberts2011), weight loss (Patrick et al. Reference Patrick, Raab and Adams2009), and inducing more healthy life choices in general (Fjeldsoe et al. Reference Fjeldsoe, Marshall and Miller2009). Furthermore, its effectiveness has been tested in the social sciences, where it was shown to increase personal savings commitments (Karlan et al. Reference Karlan, McConnell and Mullainathan2016), vote turnout (Dale and Strauss Reference Dale and Strauss2009), and compliance with court fines (Haynes et al. Reference Haynes, Green and Gallagher2013). Within an educational context, Castleman and Page (Reference Castleman and Page2015) demonstrate how personalised text messages can help to induce students to sign up for university courses on time.
Although text messages may not be students’ “dominant daily mode of communication” (Lenhart 2012: 1) anymore, we believe that they are an appropriate channel of communication for this study’s target group. Importantly, mobile phones are generally not inundated by unwanted incoming SMS, rendering text messages an easily noticeable reminder. This contrasts with other communication channels like emails, where reminders could easily be mistaken for spam and hence, never rise to the recipient’s awareness. Moreover, text messages can be accessed at any time that is convenient for the recipient, which decreases the likelihood that the intervention is regarded as an obtrusive nuisance. More technically, text messages can easily be customised to directly address the recipient, and provide relevant information. In fact, studies that forgo the customisation of text messages tend to suffer from high rates of attrition (Fjeldsoe et al. Reference Fjeldsoe, Marshall and Miller2009).
We suggest that text messages can improve student motivation and learning via three distinct mechanisms. First, students usually take numerous courses throughout the semester, which are competing for time and attention. Hence, as the expected amount of coursework is often substantial, students may simply forget to devote sufficient time to a lecture during a week. Recurring reminders can help courses to receive the necessary weekly attention from students. Second, our reminder is designed to create a sense of urgency. Assuming that students show at least a decent a priori interest in the lecture’s topic, they might generally be inclined to commit to the assigned literature, yet decide to procrastinate. By reminding them that the next lecture is coming up soon, the reminder stresses that procrastination is not a viable option anymore. Lastly, if designed appropriately, a reminder can minimise costs on the side of the student. By including a link to the assigned literature in the weekly message, students can be directed to the online repository containing the readings. This facilitates access to the relevant material, and thereby decreases the necessary time investment to look up the literature individually. The used intervention is designed to appeal to all three suggested mechanisms. However, given that the ensuing analysis rests on only one treatment group, we are unable to isolate the potential individual effects.
A recent review on student assessment in higher education, and its relation to learning outcomes, offers two important considerations to this paper (Pereira et al. Reference Pereira, Flores and Niklasson2016). First, the effect of new teaching techniques and tools on both kinds of learning must be assessed, especially if used frequently. Second, most evaluations of teaching tools rely on interviews, questionnaires, and surveys, making it challenging to offer effective advice. Hence, we evaluate the effect of reminder text messages on learning outcomes, using the following experimental protocol, for having students engage with the readings prior to class, and providing targeted feedback during the lecture. While all students are asked to complete weekly readings before coming to lectures, only one half of them receive weekly text messages, reminding them about the coursework. At the beginning of each lecture, all students take a short multiple-choice quiz on an ARS (audience response system). The ARS provides students with instantaneous feedback about their knowledge at the beginning of the lecture. This targeted feedback on particular gaps gives students a formative assessment during learning, and affords students, the ability to improve within each lecture. Hence, the targeted feedback enriches the summative assessment at the end of the course, and enables us to continuously measure learning outcomes, as the semester progresses.
Research design
Our research design draws on a sample of BA students from a large introductory lecture course at the University of Konstanz in Germany, during the spring semester 2018. The course is a mandatory requirement for all political science students, but attendance to the weekly lecture is voluntary. Students are evaluated using a multiple-choice exam at the end of the term. Among the voluntary participants, students who were randomly assigned to the treatment group receive a weekly personalised text message, containing both a reminder about the next lecture’s topic, and a link to the assigned literature. We gauge the effect of these reminders through two measures of learning outcomes: students’ performance in weekly quizzes conducted at the start of the lecture, and the grade on the final exam.
The design is pre-registered at EGAP (Evidence in Governance and Politics).Footnote 1 In this section, we lay out the experimental design. Besides our analysis of the pre-analysis plan, we also assess the message’s effect on weekly attendance in the lecture and participation in the final exam. These two tests are not pre-registered, but help us explore alternative outcomes in the discussion.
The recruitment of participants proceeded as follows: first, we communicate our research agenda with all BA-students enrolled in the course “Introduction to Comparative Politics”. We utilised the university’s student service platform (ILIAS), for those who were interested in our research for collecting all required information. A total of 145 students volunteered to participate. We documented their voluntary participation with a signed letter of consent that collected relevant information for carrying out the study. The study and the data collection were approved by the ethics board at University of Konstanz. Due to strict privacy requirements, we were unable to collect any additional information about students’ individual characteristics, such as age, socio-economic background or current GPA.
We use simple random assignment at the individual level, for placing students in a control and treatment group of comparable size (50:50). For balancing the distribution, we use the participant’s first name to determine their gender.Footnote 2 We assigned 73 individuals to the treatment group, and 72 to the control group in R. Of those students, several failed to provide their letter of consent, resulting in 61 treatment units and 64 control units for the analysis. All data are anonymised.
Individuals assigned to the treatment group, receive a weekly personalised reminder to read the assigned literature. The reminders are delivered via text message to the participants’ mobile phones, two days prior to the weekly lecture at 8 pm. A business communication service provider delivered the weekly text messages with a shortened link to the readings. The text message is adapted to the recipient’s name and gender, and updated with regard to the topic of the specific session of the lecture. The precise wording of the text message in German is “Liebe/Lieber [FIRST NAME] [LAST NAME], in nur 2 Tagen geht es in meiner Vorlesung um [TOPIC]—schau mal in die Literatur: [LINK LITERATURE]. Viele Grüße, Christian Breunig”.Footnote 3
Our dependent variable “individual learning outcome” is measured in two ways. First, we use an ARS to post short weekly quizzes about the lecture content to the participants at the beginning of each lecture session. Whereas most ARS report answers anonymously, the tool we employ (Socrative) enables us to assign responses to individual students, and count the number of correct answers. Thereby, we are able to measure the weekly learning outcome on an individual level. We use weekly and pooled responses for gauging the overall learning performance per student. Using ARS also allows the instructor to discuss answers to each quiz question during lectures and foster formative learning. Second, we rely on grades in the final exam at the end of the term as a measure of summative learning. The exam comprises of 45 multiple choice questions, which are graded on a 5-point scale, ranging from 1.0 (excellent) to 5.0 (fail).
While the lecture itself is voluntary, the final exam is mandatory for all students. Because students have to sign up for taking the final exam during the term, some students might drop out after attending several lectures. Instead of assuming that individuals in the treatment and the control group have the same turnout probability, we explicitly test this claim. We do not expect differences in participation between individuals receiving the reminder, and those who do not.
We were able to conduct eight weekly quizzes during the experiment period. In the first session of the class, we ran a test version of the quiz for the participants to understand the interaction with the Socrative platform. In the following weeks, students, regardless of their status in terms of survey participation or treatment, answered five multiple-choice questions at the beginning of each lecture. Students first entered their student ID, and then answered the questions. In the analysis, we matched the self-reported ID with the information in the participation list. Socrative also automatically reports the absolute and the relative count of right answers.
Across all waves and participants, we collected 319 quiz results and 125 exam grades. This amount was reached, because not all of the participants always attended weekly lectures (i.e., weekly compliance rates varied). Given that self-reported IDs might be inaccurate at times (e.g., transposed digits), we carefully checked for reporting errors in the weekly quizzes. Pooling the data of all waves together, we cumulatively collected 545 person-quiz observations, of which, 319 were reported by voluntary participants of the survey. For the final grades, we were able to match 125 individuals to the self-reported ones in the survey data.
Results
Do reminders increase participation?
We first probe into the question of whether reminding text messages influences attendance patterns and participation in the final exam. If we find differences between both groups, evidence for a potential mechanism becomes apparent: reminders bring students to class and formative learning during lectures contributes to better grades. Existing experimental evidence (Chen and Lin Reference Chen and Lin2008) suggests that class attendance can lead to better exam performance.
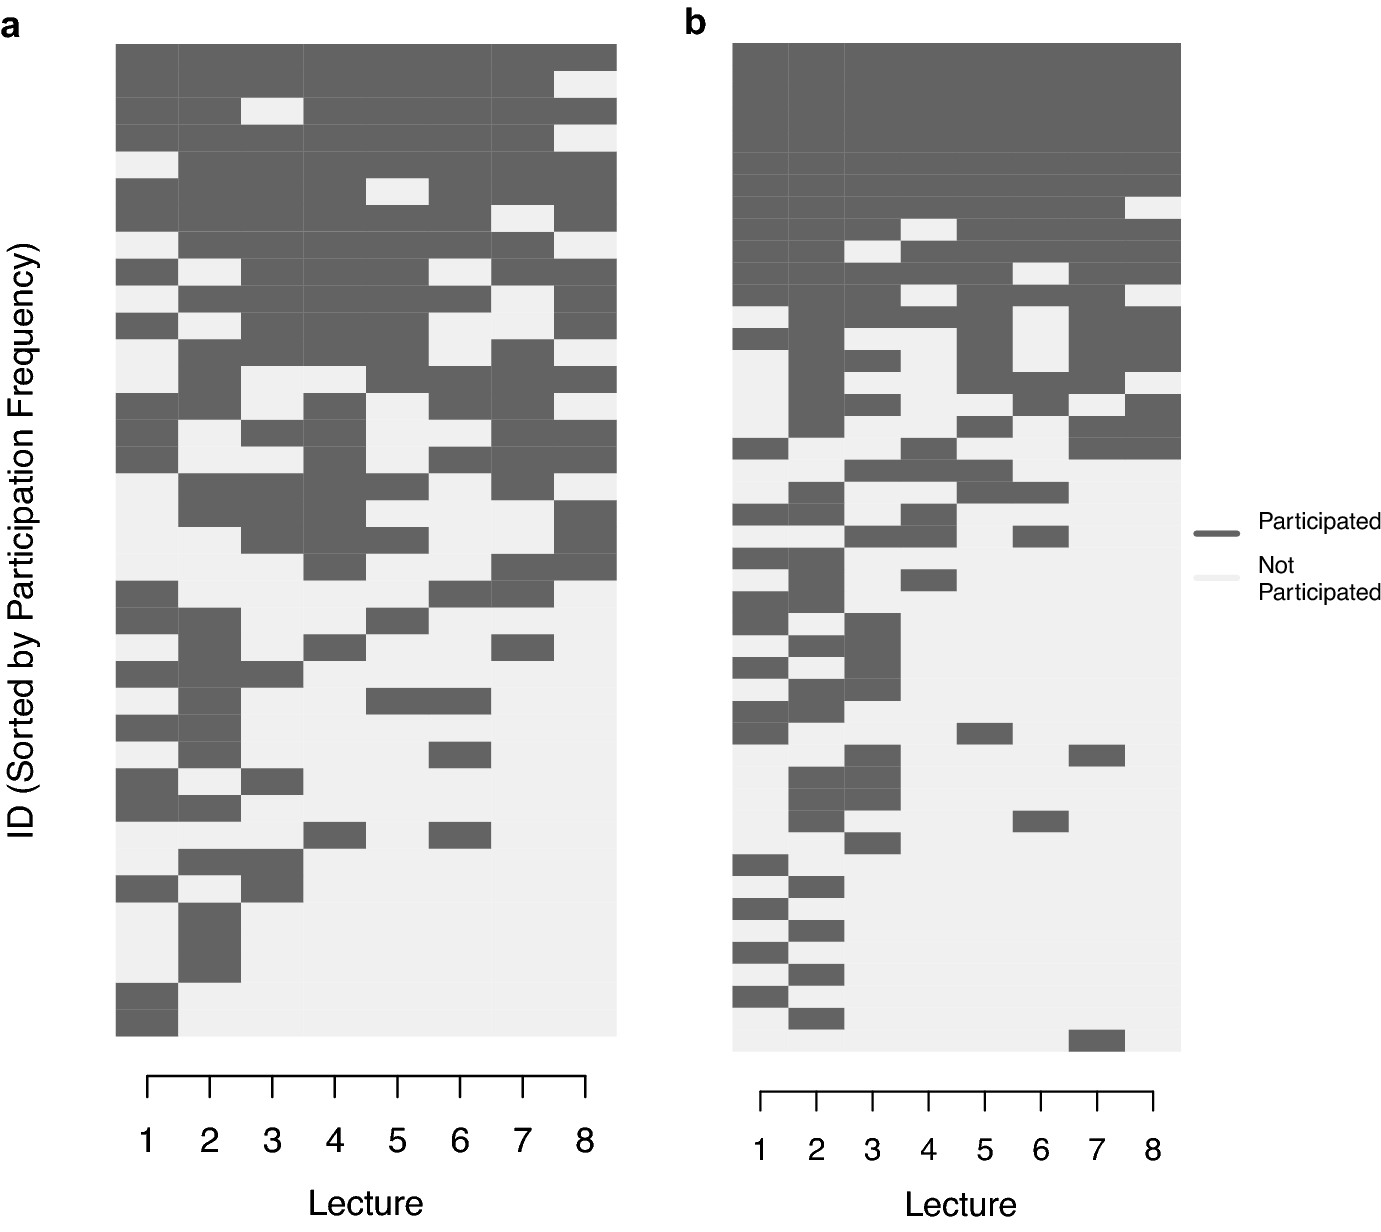
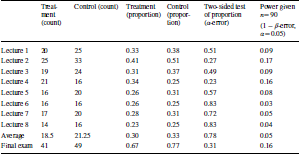
Before we analyse the realised outcomes of the experiment, we describe participation rates and attrition among our panellists. Among 125 participants, 61 are in the treatment group, and 64 in the control group. Figures 1a, b visualise weekly rates of participation in both groups. Participation in a weekly quiz is highlighted in dark grey. The graphs show that only a very small number of participants took all weekly quizzes (equivalent to the solid grey line), and that, participation abates as the semester advances. We find no difference, regarding the amount of taken quizzes between the treatment (4.00 lectures on average), and the control group (3.70 lectures; two-sided test p-value: 0.56). If we examine the turn-out rate per lecture using a two-sample proportion z-test (see Table 1), we find no differences (at the conventional 5% level) between the treated and the control groups for each lecture, as well as for the average attendance.
a Participation in weekly quizzes in treatment group. Student IDs are stacked by total number of quizzes. Dark grey shading identifies participation in quizzes in a given lecture week. N = 90. b Participation in weekly quizzes in control group. Student IDs are stacked by total number of quizzes. Dark grey shading identifies participation in quiz in a given lecture week. N = 90

Turn-out rate

The table lists weekly turn out rate for quizzes for treatment and control groups, and test for differences. The bottom two lines present weekly averages and participation in the final exam. N = 90
We conducted a power analysis, given that not all students ended up taking quizzes. Regarding the pooled average attendance (in proportion) across eight lectures, the power analysis suggests that the β-error reaches 0.8, if the significance level is set as 5%, and the sample size in each group is 45. Alternatively, we calculate the minimum detectable effect size (MDES) of mean difference proposed by Bloom (Reference Bloom2006) by setting α = 0.05, β = 0.2. Given the empirical sample setting, the MDES should reach 0.5, a conventional medium effect size by Cohen’s rule of thumb. With the assumed level of confidence, the smallest true estimate of treatment effect is expected to be larger than our empirical finding. This calculation indicates that the null hypothesis, i.e., that the reminding does not increase participation, is probably true.
For assessing long-term learning effects, we collected data on attendance in the final exam. 41 students in the treatment group (67%), and 49 in the control group (77%) took the final exam. Again, we find no difference between the two groups, regarding participation in the final exam (see Table 1). One possible reason for this null finding could be the lack of statistical power.Footnote 4 Overall, we found no evidence that, reminding students about the readings before class, changes participation in weekly quizzes, or the final exam. The null findings suggest that there is no selection effect between both groups. Reading reminders do not bring students to the classroom, and do not push them to take the final.
Beyond our pre-registration, we pooled all observations among the eight lectures, and employed the analysis of co-variance (ANCOVA), in order to increase the power of the estimate.Footnote 5 Following a multiple-regression framework (Miller and Chapman Reference Miller and Chapman2001), we calculate the F-statistics of the text reminder treatment by comparing a regression solely with the treatment, and a regression with the treatment and the lecture number. In other words, we test whether the later sessions of the lectures might increase the attendance of students’ participation in the quiz, where the students did not differ in treatment status, perhaps due to the perceived importance of lectures, as the final exam date approaches nearer. The result of ANCOVA shows that this time component is irrelevant, the F-statistics (0.96) of the treatment effect has a power of 100%, even if the number of lectures is added as a grouping variable (Given α = 0.05 in a one-way test of the F-statistics). It indicates that the text reminder tends not to exert any more positive treatment effect on quiz participation, as the final exam date comes nearer.
Do regular reminders affect formative and summative learning?
Reminding students to do the required readings and to come prepared to class would be a simple and effective tool for formative learning. Our expectation was that, sending students an SMS by the instructor about the weekly reading, alters student behavior, and increases formative knowledge. We first tested this proposition on a weekly basis, and then across all weeks.
Table 2 and Fig. 2a depict the distribution of the proportion of the correct answers in each lecture. We apply the T-Test for two sample means first. For the first week, individuals receiving the reminder answer 0.33 more questions correctly than the controlled ones at the 95% significance level (p = 0.048). This result reaches a power of 0.78, given n = 90. In the sixth lecture, the positive treatment effect is 0.5 at a 90% significance level (p = 0.062), and reports the highest power among the lectures (0.84). However, for all other weeks, we do not find statistically significant differences between both groups. Since there are only eight waves, we are not able to draw conclusions, regarding whether the intervention effects wear out, is more periodical, or even reinforcing.
Correct Answers in weekly quizzes
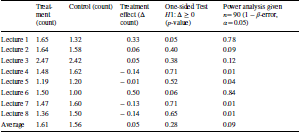
Student were asked five questions each week. Power analysis is executed with the empirical treatment size with one-sided test. Total number of observations is 319
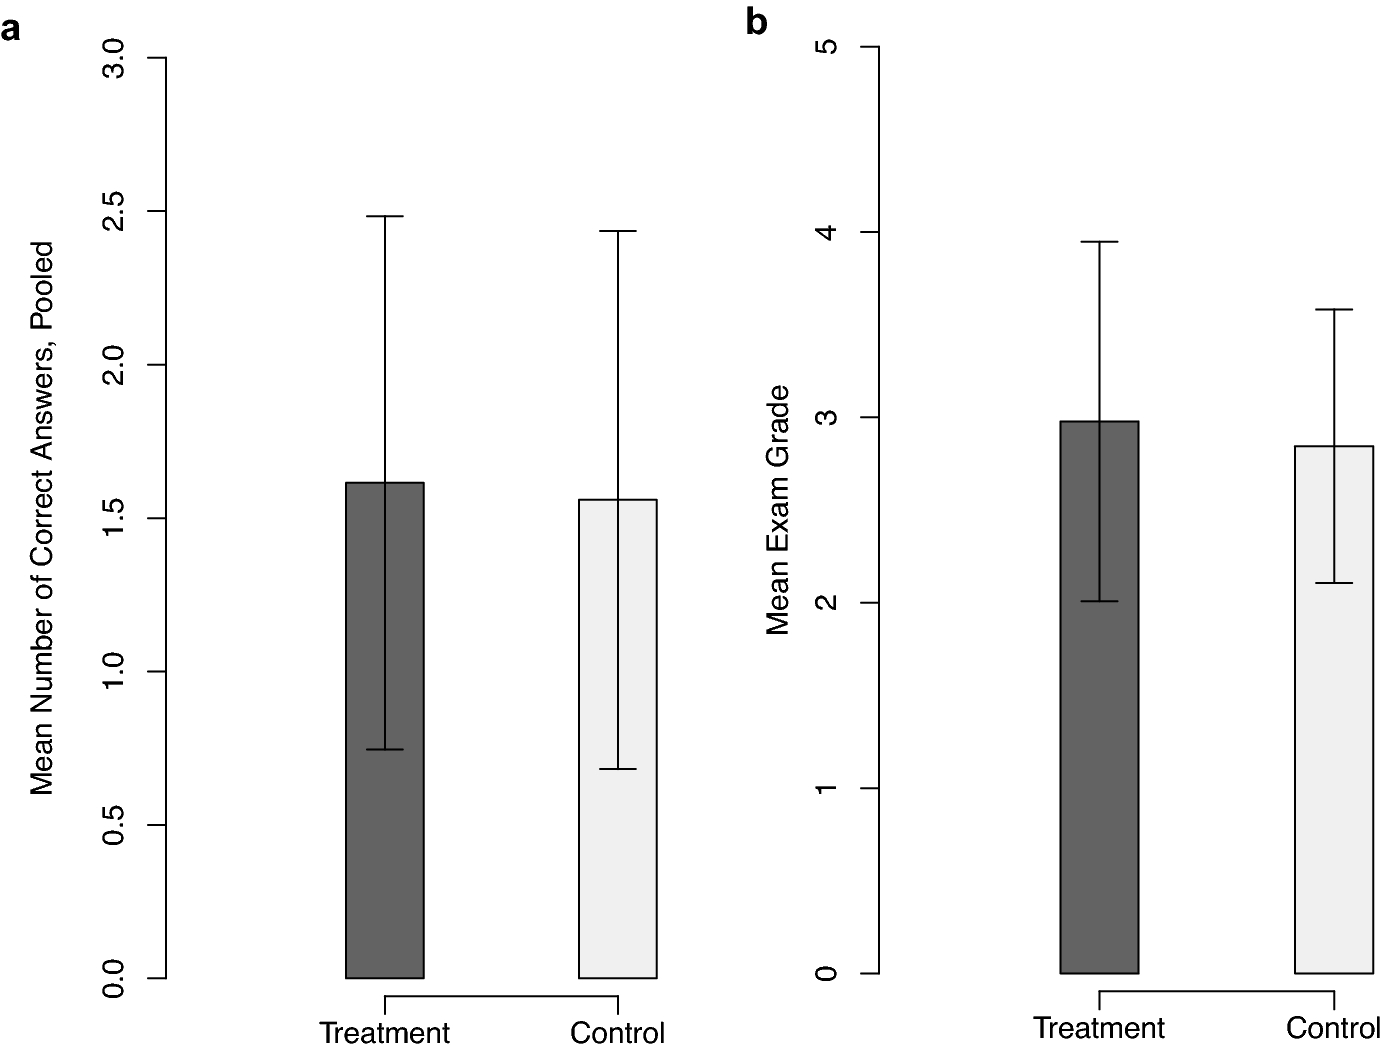
a Errorplots with standard deviation of formative and summative learning outcomes. Figure displays weekly counts of correct answers in weekly quizzes (higher score is better). b Errorplots with standard deviation of formative and summative learning outcomes. Figure exhibits differences in final grades (lower score is better)

We also detect no statistically significant differences, when comparing students’ quizzes across all lectures. If we count all correct answers over the term and compare both groups, we find that students in the treatment group on average answer 0.05 more questions correctly p = 0.28.Footnote 6 Again, a power analysis shows that reaching the estimated effect size of 0.06 in both tests, even though much lower than the conventional small size of 0.2, we would have needed about 6000 participants (given α = 0.05, β = 0.2). The null finding alludes that reminding students to read, does not lead to better performance in assessments of formative learning.
In a similar vein, we conducted ANCOVA to assess the treatment effect at the individual level. There barely exists any correlation or interdependence between the treatment status and the number of lectures as a continuous variable.Footnote 7 Here, we test whether the accuracy of quiz answers is affected by the timing of each lecture, presuming that the text reminder did not exist. The effect of the lecture does not confound the treatment effect. The F-statistics of the treatment status is reported at 0.40, with a significance level of 0.57. The power analysis suggests that given the significance level of 0.05 and other empirical settings, the power of the treatment estimate reaches 100%. This result suggests that the text reminder is likely to have no positive effect on the quiz performance, even as the total possible learning time increases.
Finally, we fail to measure a long-term retrieval effect of the reading reminder, when examining grades in the final. Figure 2b illustrates the distribution of the grades in both groups. The average performance of the treatment group is 0.14 lower than the control group, yet this difference is not statistically significant (p-value = 0.23).Footnote 8 The worse performance of the treatment group prohibits a power analysis of the intended one-sided test. We therefore focus on the two-sided hypothesis, regarding the difference in terms of the exam grades between the treated and the control groups. To reach the empirical Cohen’s d = 0.16, 1286 units are needed, given a 95% significance level and 80% power. Thus, our study is of low statistical power (0.10 given the treatment size). Overall, our analysis indicates that reminding students to read does not improve performance in a final exam.
Evidence of self-selection: participation in quizzes is positively associated with taking the final exam
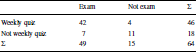
As an ancillary investigation, which was not pre-registered, we assess whether regular attendance in the lecture and participation in weekly quizzes, results in a higher turnout for the final exam. We analyse treatment and control group separately. Tables 3 and 4 demonstrate the association between taking part in the exam, and in the quiz (measured as finishing at least for one quiz). In both the treatment and the control groups, these two patterns are far from independent of each other (p treatment = 0.009, p control = 0.000 in χ 2-test with degree of freedom = 1). Provided that participation in weekly quizzes has an impact on taking the final exam, the positive association in both treatment and control groups, is significant at 95%-level (p treatment = 0.0003, p control = 0.000, one-sided T-Test). This finding indicates that students, who regularly come to and participate in the lectures, are more likely to take the final exam. This relationship holds true in both groups, suggesting that this characteristic is balanced among the untreated and treated units.
Joint distribution of participation forms of students in the treatment group
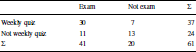
Joint distribution of participation forms of students in the control group

Conclusion
University instructors want to prompt student learning. The more a student participates in a lecture through preparation and attendance, the more successful that student will be. Especially in large lectures with limited individual interactions between students and professors, encouraging a student to prepare for class is challenging. Instead of being told what to do, we use an experiment that presents choices in a new way. Our intervention—a reminder about the readings using a text message—aims at improving individual choice, which in turn benefits a student’s success in the class. An important feature of our intervention was that students still have the freedom to read the weekly assignments. The experimental results show that a simple information treatment framed as a reminder does not lead to better formative and summative learning outcomes.
There are a couple of limitations to our findings. Unfortunately, we had to deal with a relatively small number of participants, because of an overall small course size, meaning that our analyses tend to be underpowered. This obstacle can be easily overcome by running an experiment in multiple courses at the same time. Second, a potential reason for the weak effect is that, the treatment is too weak. Receiving one more message might not be a clear signal anymore in times of continuous, instant communication. After all, a text message does not coerce students to change behaviour; it simply urges them to read course material. Lastly, we cannot exclude that students changed their behavior, due to their knowledge about participating in an experiment. Since all the students participated in regular quizzes to gauge their learning outcomes, they might have shown increased engagement with the course literature regardless of whether they were treated or not. In other words, the question is whether the provision of regular feedback itself fosters formative learning on behalf of the students. While our experimental design does not allow to tap into this issue, we advocate for future studies to employ a factorial design to disentangle the effect of reading reminders from the regular provision of feedback. However, given the ethical implications of exposing students to different learning contexts that might affect their final grades, such experiments with stronger and multiple treatments require careful and sensitive planning.
Despite the null findings, we believe in the benefits of experiments in evaluating policy interventions, including teaching techniques. Our experimental design relied on voluntary student participation, received swift and positive ethics approval, and was simple and cheap to set up and carry out. The design offered us a straightforward assessment of a new way of engaging with students in a large lecture. We hope that our template encourages more experimental tests of learning tools in political science and beyond. Indeed, experimental designs in political science education have been used, and are not limited to small interventions in large lectures. For example, McCarthy and Anderson (Reference McCarthy and Anderson2000) test, where role playing improves student performance in a classroom setting. Our positive conclusion about the presented reading reminder is that our experimental design about its effectiveness, enabled us to judge a new teaching tool. Once we know which techniques work and which do not, instructors in political science classes and elsewhere can make a difference in students’ learning outcomes.
Funding
Open Access funding provided by Universität Zürich.


 Open access