


INTRODUCTION
Campylobacteriosis is the most frequently reported bacterial enteric disease in humans in most industrialized countries including Norway [Reference Olson, Nachamkim, Szymanski and Blaser1, Reference Nygard2]. The annual incidence for domestically acquired campylobacteriosis in Norway in 2008 was 23/100 000 [3]. Handling or consumption of fresh poultry meat has been identified as risk factors for human campylobacteriosis in several studies [Reference Kapperud4–Reference Gormley6]. Poultry easily become colonized in the gastrointestinal tract with Campylobacter spp., and carcasses become contaminated with Campylobacter spp. through contamination at slaughter. Norway implemented an Action plan against Campylobacter spp. in broilers in 2001, hereafter called the Action plan, consisting of three parts: a surveillance programme including all commercial Norwegian broiler flocks slaughtered before age 50 days, a follow-up advisory service for farms delivering flocks positive for Campylobacter spp., and surveys of broiler meat products at the retail level [Reference Hofshagen and Kruse7]. In the surveillance programme, each flock is sampled twice: by the owner 4–8 days before slaughter and at the abattoir. In the period 2001–2007 the annual prevalence of broiler flocks testing positive for Campylobacter spp. varied between 3·3% and 7·7% with considerable differences between seasons and regions. From 2008 the sampling strategy was changed, with the result that the prevalence figures before and after 2008 are not comparable.
Possible sources of Campylobacter spp. for broiler flocks have been investigated extensively. Risk factors for Campylobacter spp. colonization of flocks include poor hygienic measures on the farm, thinning of flocks, contaminated water, more than one broiler house on the farm and other livestock on the farm or in the neighbourhood [Reference Kapperud8–Reference Lyngstad11]. In a Norwegian study [Reference Johnsen, Kruse and Hofshagen12], it was observed that on farms with the poorest hygiene measures, broilers became colonized at the youngest age and flocks on farms with the best hygiene measures did not become colonized. Colonization of broilers in Norway, as in other European countries, follows a seasonal pattern with a peak in the summer [Reference Hofshagen, Opheim and Brun13], possibly due to a climatic influence in colonization. Variation in climate having an effect on flock prevalence of Campylobacter spp. in broilers has been suggested earlier [Reference Patrick14, Reference Jore15], but more research is needed. It has been observed that Swedish broiler farms associated with a high incidence of Campylobacter spp. more frequently had groves in the neighbourhood rather than forest [Reference Hansson16]. From this finding one might speculate that landscape may also have an effect on flock prevalence. A possible transmission route into the broiler house could be mechanical transmission via insects. Rosef & Kapperud [Reference Rosef and Kapperud17] and Hald et al. [Reference Hald18] showed that flies adjacent to the broiler house could be contaminated with Campylobacter spp. and that a large amount of flies could have access to the broiler house via the ventilation system. Fly activity is influenced by climate [Reference Nichols19], landscape and geography [Reference Fried, Levey and Hogsette20].
The visualization and analyses of space–time patterns of disease occurrence at point locations could be useful in order to determine if a disease occurs as an epidemic and to generate hypotheses on explanatory factors that might be associated with the disease. One way to investigate such patterns is to analyse for space–time clustering. A local space–time cluster could be defined as a location in space and time where disease occurrence is higher or lower than would have been expected if it was randomly distributed in space [Reference Pfeiffer, Durr and Gatrell21]. It is also possible to test for spatial dependence over various distances where the presence, but not the location is investigated (global spatial clustering). For point locations that are regarded as cases or controls, the K-function can be used as a global spatial statistic to describe the second-order spatial effect which has led to a particular spatial pattern of cases and controls [Reference Gatrell and Bailey22]. Any apparent clustering will require further epidemiological investigation of factors that could have an impact on the occurrence of the distribution of the disease. The current study was performed to investigate space–time patterns of Campylobacter spp. in broiler flocks in Norway.
MATERIALS AND METHODS
Study design
The study area included all counties in Norway with a broiler population, e.g. all counties south of Nordland County. Data on broiler flocks slaughtered before age 50 days with corresponding Campylobacter spp. results were generated from the Action plan. Geographical coordinates of the farms were obtained from the National Agricultural Property Registry (the official census database for information of agricultural properties in Norway). In the Action plan, there were a total of 643 farms delivering 19 314 broiler flocks to slaughter during the study period from 1 January 2002 to 31 December 2006; this constitutes virtually all broiler flocks in Norway within this time period. Only the results from the testing of the first batch of a flock (some were slaughtered over a period of several days) and only one flock result per 7-day period and farm were included, resulting in a total of 643 farms and 16 523 flocks. Further, only farms where geographical coordinates were obtained could be included (623 farms). Only farms that had delivered at least three flocks for slaughter in at least one of the calendar years during the study period (farms only delivering a few flocks a year might also rear turkey in the same houses) were included. In total, 580 farms delivering 16 054 flocks during the study period were included in the study (2002: 494 farms/3088 flocks; 2003: 476 farms/3133 flocks; 2004: 469 farms/3192 flocks; 2005: 475 farms/3228 flocks; 2006: 490 farms/3413 flocks). Each flock was tested for Campylobacter spp. in caecal droppings 4–8 days before slaughter and at slaughter at the abattoir (faecal swabs until April 2004, caecal contents thereafter) as described by Lyngstad et al. [Reference Lyngstad11]. From January 2005 the culturing method on the caecal droppings was replaced by PCR. A farm was considered positive for Campylobacter spp. at the date of slaughter if at least one of the test results was positive, otherwise it was considered negative.
Analytical methods
Descriptive analyses
Statistical data handling and analyses were performed using SAS Enterprise Guide version 4 for Windows and SAS version 9.2 (SAS Institute Inc., USA), Stata version 9.2 (Stata Corp., USA) and ArcGIS 9.2 (ESRI Inc., USA).
The number of slaughter occasions per month and year was evenly distributed and ranged from 228 to 311 (mean 268) per month. In addition, maps showing the ratio of the number of slaughter occasions and number of broiler farms per month and location in each municipality were derived. This was done in order to assess if there had been any areas delivering more flocks to slaughter than others during any specific time period, and thereby influencing the possibility of a cluster. By visual exploration, these maps showed homogeneity regarding the distribution of slaughter occasions in space and time.
Space–time analyses
Relative risk maps
For point locations, kernel density estimation gives weighted means for all arbitrary locations in a defined area. Kernel density estimation of cases (number of positive flocks per farm) was performed for three time periods each year: May–June, July–August and September–October. The same procedure was performed for the population at risk (the number of all flocks per farm) to achieve maps of the population at risk per unit area and defined time period. A spatial risk function for an arbitrary location x, λ(x), was estimated from the ratio of kernel density plots of cases, λ1(x) and the population at risk, λall(x) to take account of the heterogeneity in the spatial distribution of the flocks at risk. The spatial risk function was calculated for all locations and for three time periods each year; May–June, July–August and September–October resulting in spatial relative risk maps. The spatial resolution was 10 km and a fixed bandwidth of 20 km was used. The size of bandwidth chosen for kernel density estimation determines the degree of smoothing produced. Problems with obtaining high ratios close to the borders of the estimation regions, so-called edge effects, was primarily corrected for by adding a number (ε) slightly smaller than 1 standard deviation (ε=0·02) to the denominator, thus not interfering with the more central parts of the estimation regions, ending up with a spatial relative risk function:

The kernel ratio surface estimates could be interpreted as the probability for a flock at a location x to test positive for Campylobacter spp. during a defined time period.
Local space–time cluster analysis
Presence of local space–time clusters was tested using space–time scan statistic (SaTScan version 6.1.3, Kulldorff M. and Information Management Services, Inc.) [Reference Kulldorff23]. The method is based on cylinders centred on each point, with the base representing space and the height representing time. Over all window locations and sizes, a likelihood function is maximized. The one with the maximum likelihood comprises the most likely cluster and this is the cluster least likely to have occurred by chance. In addition, secondary clusters are identified, that are ordered according to their likelihood ratio test statistic. P values are obtained through Monte Carlo hypothesis testing. Significant clusters (P<0·05) are calculated and a relative risk is estimated comparing the risk of being a case inside the cylinder with the risk of being a case outside the cylinder.
The analysis was run for each year separately, for a possible comparison between the calendar years, as well as for the whole study period. The testing was performed using a Bernoulli probability model where the flocks testing positive were considered as cases and the flocks testing negative were considered as controls. The parameter settings for maximum cluster sizes for circular clusters tested for each year were 20% of the population at risk and 10% of the time. The time aggregation was 7 days and no geographical overlapping was allowed. The same parameter settings, except for maximum 2% of time at risk, were used when running the analysis for the whole study period. Significance of clusters was tested using Monte Carlo hypothesis testing with 999 permutations.
For all broiler farms, the minimum distance to a neighbouring broiler farm at a distance ⩽10 km was calculated for each year as well as for the whole study period. Thereafter, the mean minimum distance, for all farms and for all farms located inside and outside the most likely clusters, respectively, was calculated for each year as well as for the whole study period.
Global clustering: K-function analysis
K-function analysis was performed in order to identify the presence of spatial clustering. The analysis was performed separately by year. A farm was defined as a case in a given year, if at least one flock within the farm was positive during that year. The K-function analysis was applied over the entire study area with a maximum distance between farms of 10 km. Usually, clustering is evaluated by testing if the spatial distribution of infected locations deviates from complete spatial randomness, where complete spatial randomness is modelled, e.g. using a homogeneous Poisson process. However, as previously described [Reference Ersbøll and Ersbøll24], the distribution of all herd locations (irrespective of being infected or not) does not necessarily follow a Poisson process. Therefore, the K-function analysis was performed using simulation of the null-hypothesis version of the K-function [Reference Ersbøll and Ersbøll24]. Briefly, the K-function was estimated as:

where h is a given distance, n is the number of infected farms, I h(d ij) is an indicator function taking the value 1 if d ij<h, and 0 otherwise. The simulated null-hypothesis version of the K-function is generated by random sampling of n farms among the N possible farms, assuming these n farms were the infected. In total 999 simulations were performed.
The difference D(h) between the empirical K-function K 1(h) and the simulated null-hypothesis K-function, K 0(h) is plotted vs. the distance h, together with the 95% credibility envelope.
RESULTS
Descriptive statistics
The period prevalence of flocks testing positive for Campylobacter spp. during the study period was 4·4% (715/16 054 flocks) with a 95% confidence interval of 4·1–4·8. The annual prevalence varied between 3·2% and 5·9% (Fig. 1). Each farm housed between 3 and 129 flocks during the study period. The median (25th–75th percentiles) was 31 (20–35) flocks per farm. The maximum number of flocks per farm and year ranged from 27 to 35. A proportion of 54·7% of the farms had a Campylobacter spp.-positive flock at least once during the study period. The yearly farm prevalence on farms having at least one positive flock that year varied between 16·1% and 26·4% (Fig. 1). The number of positive flocks on farms having positive flocks ranged between 1 and 19 positive flocks during the study period with a median (25th–75th percentiles) of 2 (1–3) positive flocks per positive farm. For the whole study period the mean minimum distance between broiler farms within or equal to a distance of 10 km was 2·4 km and when calculated for each year, the distance was 2·4 km in all years, except in 2003 (2·5 km).
The prevalence together with the 95% confidence interval of Campylobacter spp. in broiler flocks (–○–) and in farms (–▪–) for each calendar year in the study period.

Space–time analyses
Kernel density estimation
The kernel-smoothed ratio maps of the estimated risk for flocks to test positive for Campylobacter spp. is shown for July–August in Figure 2. The patterns in space and time of the estimated risk coincide quite well between the years 2002, 2003, 2005 and 2006 with the largest areas with a risk ratio >0·30 in the northern part of the study area. In 2004 the kernel-smoothed ratio maps had a different pattern with smaller areas with a risk ratio >0·30 than the other years and the area with the highest risk ratio located in the south-west.
Kernel-smoothed ratio maps of the estimated risk of Campylobacter spp.-positive flocks in July–August each year for 2002–2006. The areas of significant clusters calculated by space–time scan statistics are illustrated by circles. The asterisks (*) indicate overestimated risk for two farms which had only one slaughtered flock each, which were both positive.

Local space–time cluster estimation
For each year as for the whole study period the space–time scan statistics identified one or more significant clusters with relative risks ranging from 5·9 to 16·6 (Table 1). The maximum likelihood cluster for the whole study period was located in the eastern part of Norway with duration from 30 June to 3 August 2003 and a radius of 126 km. There was good agreement between the geographical location and the duration of the clusters in each of the years 2002, 2003, 2005 and 2006 and for the whole study period. For 2004, the significant clusters had a different geographical location and duration than observed in the other years (Fig. 2). The mean minimum distances to the broiler farm neighbours up to 10 km for farms within and outside the most likely clusters, respectively, were 1·5 km and 2·6 km in 2002, 1·6 km and 2·7 km in 2003, 1·5 km and 2·5 km in 2004, 2·1 km and 2·4 km in 2005 and 1·8 km and 2·6 km in 2006. There was good agreement between both geographical location and duration of the local space–time clusters and the estimated patterns in the kernel-smoothed ratio maps.
Statistically significant clusters (P⩽0·05) for Campylobacter spp.-positive broiler flocks calculated by space–time scan statistics
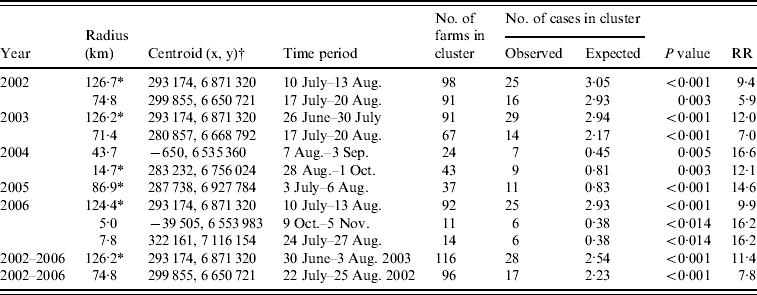
RR, Relative risk.
* Most likely cluster.
† Coordinate system WGS 1984, UTM zone 33N.
Estimation of global clustering
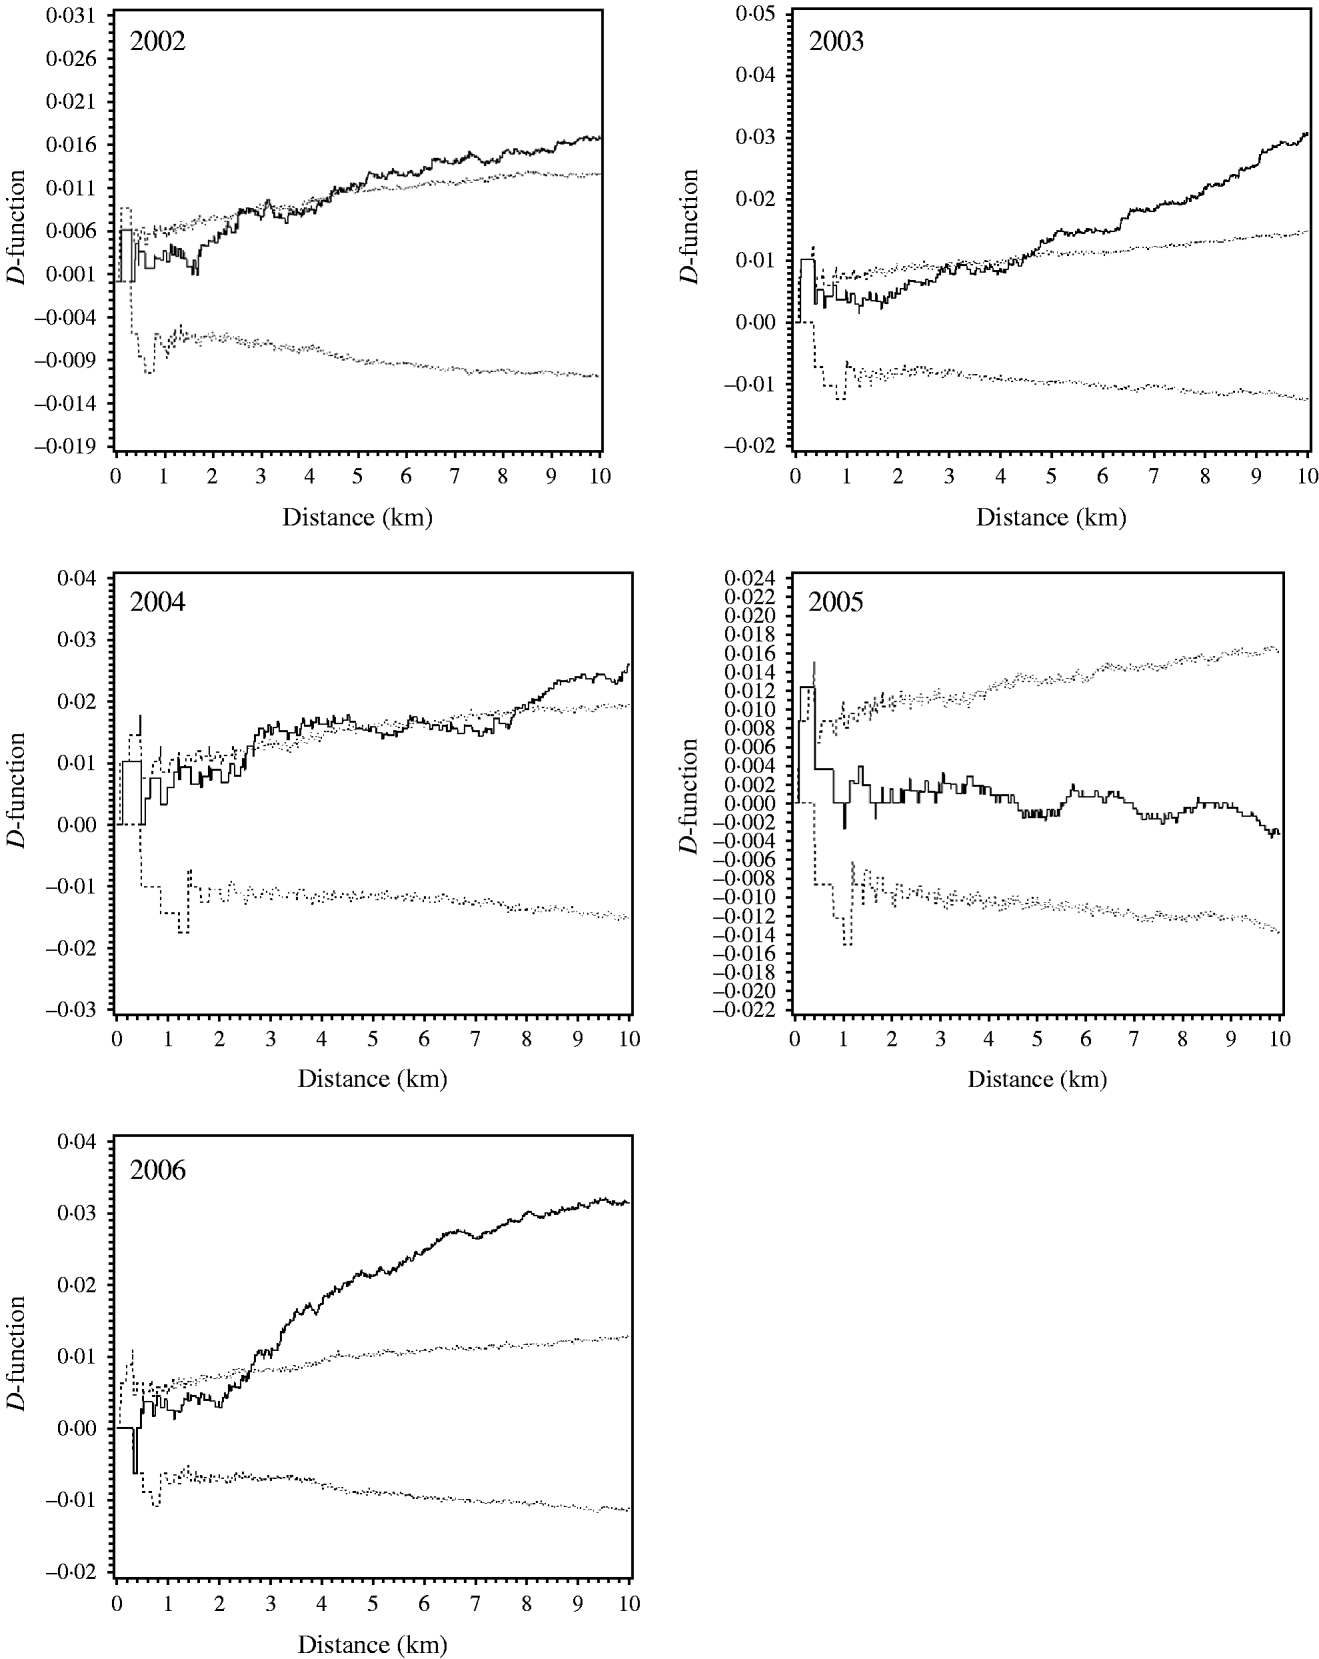
The K-function analysis indicated significant clustering at distances between 2·5 and 4 km. In 2002 and 2003 there was a pronounced clustering at 4 km, and in 2006, there was a pronounced clustering at 2·5 km. There was no significant clustering in 2005. The D-function for 2004 indicated some clustering at a distance of 2·5 km (Fig. 3). In 2003 and 2006 the D-functions indicated further clustering at even greater distances, while in 2002 and 2004 this did not appear to be the case.
For each year between 2002 and 2006, the difference D(h) between the empirical K-function and the simulated null-hypothesis K-function is plotted vs. the distance h, together with the 95% credibility envelope (dotted lines).
DISCUSSION
The observed intensity of a point may be due to first-order spatial effects (a global trend across a region) or to second-order spatial effects (local correlation between points or with environmental determinants) or a combination of both [Reference Bastin25]. In the current study various spatial statistical techniques were used to investigate second-order spatial effects. For Norwegian Campylobacter-positive broiler flocks the current study indicates the presence of local space–time clustering. There is in particular one geographical area which is included in a local circular cluster occurring almost every year and with corresponding high rates of spatial relative risk in the kernel estimation. The area is quite large (about 130 km in 2003) which may imply that large-scale environmental factors, such as landscape and geography are associated with the higher risk of Campylobacter spp. colonization in flocks in that area. The temporal patterns followed the time period of the summer peak of Campylobacter spp. in broilers. Almost all significant clusters appeared in the period July–August. In 2004 the time and location of clusters and the pattern of the probability surface differed substantially from the other investigated years. This could imply presence of risk factors for colonizing that vary in space and time, e.g. climate. This difference in 2004 is consistent with findings described elsewhere [Reference Jore15] where the trend of occurrence of Campylobacter spp. in broilers in Norway from 2001 to 2007 showed the lowest yearly prevalence in 2004.
In the current study, second-order spatial effects were also analysed with a modified K-function analysis. Interestingly, there was spatial clustering of Campylobacter spp.-positive broiler flocks at distances between 2·5 km and 4 km, indicating there may be risk factors present acting in a more narrow spatial scale as well – perhaps by vectors/vehicles transmitting Campylobacter spp. between farms. One such potential vector/vehicle could be flies. The finding that the mean minimum distance to the nearest broiler farm neighbour was smaller within a local cluster than outside also contributes to the suggestion that distance between broiler farms plays a role in introducing Campylobacter spp. into a flock. In addition, spatial clustering of cases varied somewhat with year; in 2002 and 2003 there was spatial clustering at 2·5 km, in 2004 and 2006 at 4 km and in 2005 there was no spatial dependence between cases. The effect of this potential transmission vehicle may be related to differences in climate, which varies over time. For flies, their number and activity will vary largely with daily mean temperature and proximity between farms may prove less of a risk in years with lower daily mean temperature.
The prevalence of Campylobacter spp.-positive broiler flocks are for most European countries substantially higher than for Norway [26]. For Finland and Sweden the figures are comparable to Norway. In the current study, including almost all the census population, the prevalence of farms having at least one positive flock was about 50%, but the flock prevalence was ten times lower. The same picture is reported from Sweden [Reference Hansson16]. The carry-over of infection is described as being small between flocks [Reference Shreeve27]. In Norway the most common practice in broiler production is all-in all-out. This, combined with generally good bio-security and cold winters, imply that the risk for carry-over is probably small in Norway.
Spatial randomness was not the case regarding the spatial distribution of the broiler farms and complete spatial randomness could therefore not be tested using a homogeneous Poisson process as the null-hypothesis K-function. Therefore, a modified K-function analysis was performed using the fixed farm location to model the null-hypothesis K-function. The analysis was performed for each year and a farm was defined as positive in a given year, if at least one flock was positive during that year. However, the risk for a farm to be defined as positive was associated with the number of flocks delivered for slaughter. This was not accounted for in the estimation of the K-function. For farms delivering a high number of flocks it could have resulted in underestimation bias in the results and vice versa.
An important assumption for the K-function analysis is that no first-order spatial effect is present in the study region. A first-order spatial effect is a large-scale variation and is seen as a trend across the study region. The K-function can be used to estimate clustering over distances that is small compared to the size of the study area. In the current study the K-function has been estimated at a maximum distance of 10 km in order to limit potential first-order spatial effects. In comparison to the size of the study area (about 750 km×450 km), variation within distances of ⩽10 km is considered as small scale.
The within-flock prevalence of Campylobacter spp. is found to be very high in several studies [Reference Jacobs-Reitsma28–Reference van Gerwe31]. After introduction into the flock, the agent spreads quickly and most of the birds become colonized and remain so until slaughter. Thus, sampling 10 individuals would give a good picture of the Campylobacter spp. status of a flock, despite flock size.
The sensitivity of the included laboratory tests is not known. With the practice of two samples per flock, high within-flock prevalence and a sampling regimen in accordance with the EU Baseline survey on Campylobacter spp. in broiler flocks, the flock-level sensitivity is thought to be high. The aim of the Action Plan was to identify the most possible flocks colonized with Campylobacter spp., and when a positive flock was identified interventions such as deep freezing or heat treatment of the whole flock were effected. Before May 2005, when sampling was performed with cloacal swabs, a small risk of cross-contamination from the environment in the abattoir occurred, especially if a previous flock was Campylobacter spp.-positive. However, most cases of false positives were identified by subtyping and comparing patterns to those of previous flocks. From May 2005 this risk was decreased by using caecal contents instead, and this might have had a slight impact on the specificity.
Point data is very common in veterinary medicine, but difficulties in obtaining geographical coordinates for all point locations could be a hindrance to achieving reliable results from spatial analyses. The number of farms included in the analyses was close to the total census of broiler farms in Norway during a 5-year period (geographical coordinates lacking for 3%) which make it unique in regard to the possibility of conducting high-quality statistical analyses in order to generate hypotheses and search for risk factors for Campylobacter spp. occurrence in broiler flocks.
Using various techniques to explore the space–time pattern of broiler farms defined as positive or negative in regard to Campylobacter status at each time point of the slaughtering of a flock is a novel approach in using data of the status of farms. This could be regarded as repeated measurements in space–time cluster analyses.
It could be useful to examine several spatial relative risk maps of the same samples, with different smoothing options, in order to obtain greater insight into the data. Mathematical formulas as suggested by Diggle et al. [Reference Diggle32] can be used to calculate the bandwidth. However, using the suggested formulas, the calculated bandwidth in the current study would have become extremely large because of a large study area in combination with some regions with widely clustered farms. Therefore, in the current study, it was more biologically plausible to choose a bandwidth in scale with the biological process, although this was a subjective choice. Benschop et al. [Reference Benschop33] performed spatial epidemiological investigations of Salmonella in pig production in Denmark, and calculated spatial relative risk maps where regions with a high intensity of farms had smaller bandwidths in kernel density estimation than regions with a low intensity of farms. As a result, data-rich areas with finer details received less smoothing than the geographical regions where the data were sparse. For risk mapping, each farm location was weighted by its own number of delivered flocks for slaughter and the number of times it was a case, respectively, in order to obtain corrected estimates of the population at risk and to minimize the so-called edge effects. In addition, the edge effects were handled by adding a small number (ε) to the denominator to correct the estimates of the kernel-density ratio surface where population was sparse. This was found to work satisfactorily in our study. However, both the spatial scan statistics and the kernel density estimation are methods based on circular windows. Biological processes do not usually appear as circular shapes in space. This might possibly limit the interpretation of the results but was the logical choice when no information on the possible shape of the process was available.
CONCLUSION
For specific time periods, especially during the summer months, geographical areas with higher risks for Campylobacter spp. colonization of broiler flocks were identified. This could indicate presence of risk factors that are related to regional differences and variation over time. Landscape, differences in animal husbandry (e.g. biosecurity and housing), and climate (e.g. temperature and precipitation), may be important risk factors. The finding of clustering at shorter distances indicates that additional risk factors are present and acting in a more narrow scale, for instance flies whose activity is described as being influenced by variation in climate and landscape. Further studies on Campylobacter spp. colonization of broiler flocks including risk factors related to geography and climate will be performed.
ACKNOWLEDGEMENTS
The authors gratefully acknowledge the poultry industry represented by their farms and the Norwegian Food Safety Authority for performing the sampling, and also the staff at different laboratories for performing the laboratory analyses. In addition, the authors acknowledge Anja Bråthen Kristoffersen for valuable help with statistics and notation and Mona Dverdal Janssen for language revision.
DECLARATION OF INTEREST
None.



