

Leaders and policymakers often link cooperation on economic and security issues. The final National Security Strategy of the Clinton Administration argued that “globalization of trade and investment” enhances security by “increasing economic cooperation, empowering reformers, and promoting openness.” Footnote 1 More recently, US Secretary of Defense Ash Carter connected security relations in the Asia-Pacific to US efforts in “diplomacy, economic policy, commerce, and trade.” Footnote 2 At the same time, much scholarship in international relations touches upon economic-security connections, such as the voluminous literature on the liberal peace or the more narrowly tailored literature on trade and alliances. Footnote 3 Policymakers and scholars alike often assume that cooperation in one issue area complements or encourages cooperation in the other.
This paper examines the dynamics of mutual influence or “spillover” between economic and security cooperation, with particular focus on how network influences can facilitate—or, in some cases, impede—spillover processes. We focus on two prominent types of agreements: bilateral investment treaties (BITs) and defense cooperation agreements (DCAs). BITs establish rules for states that host foreign investment and provide investors with direct access to international arbitration when disputes cannot be resolved amicably. Footnote 4 DCAs provide legal frameworks for defense cooperation—facilitating policy coordination, joint military exercises, peacekeeping operations, research and development, arms trade, and similar day-to-day defense activities. Footnote 5 As Figure 1 shows, both DCAs and BITs have proliferated dramatically since the early 1990s. Our focus on cooperation via bilateral agreements avoids limitations of prior work on economic-security interdependence, such as the conflicting roles of public versus private actors Footnote 6 and the methodological complications of multilateralism. Footnote 7 Further, because DCAs and BITs are now endemic features of the international system, our analysis sheds light on the broader post-Cold War shift toward bilateralism. Footnote 8
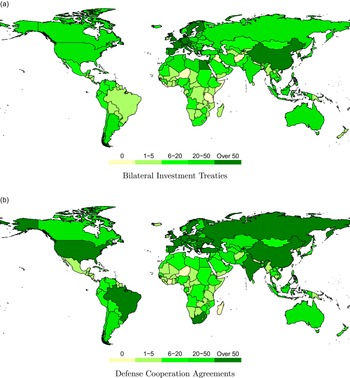
Trends in investment treaties and defense agreements, 1980–2010.
Note: Left-hand panel illustrates number of new BITs signed annually. Right-hand panel illustrates number of new DCAs signed annually. BIT data from Allee and Peinhardt (Reference Allee and Peinhardt2010). DCA data from Kinne (Reference Kinne2020).

We develop a network explanation for how economic and security cooperation influence one another. We argue that the standard bilateral logic of spillover, where the presence of an agreement between a given pair of states makes other agreements more or less likely, ignores the larger network context in which cooperation occurs. When governments develop portfolios of BITs and DCAs, they have larger structural goals in mind, and the pursuit of those goals both enables and limits the influence of cooperation in one issue area on cooperation elsewhere. Specifically, we argue that in their BIT portfolios, governments pursue a network-hierarchy strategy. That is, they favor asymmetric relationships in which economically influential countries work on behalf of multinational corporations (MNCs) to maintain ongoing access to foreign markets. By contrast, in their DCA portfolios governments pursue a network-community strategy, where defense agreements align groups of like-minded collaborators around a common set of security concerns and facilitate efficient collective responses to mutual threats.
We develop, and find empirical support for, two insights. First, because the community logic of DCAs often conflicts with the hierarchical logic of BITs, in many cases cooperation in one issue area effectively discourages cooperation in the other. For example, because governments that sign large numbers of DCAs are not easily subordinated into hierarchical relationships, as a country signs more DCAs its probability of being selected as a BIT partner declines. Second, in those situations where network logics are compatible, they generate positive spillover in unexpected and complex ways. For example, because governments that have similar BIT portfolios are more closely aligned in their foreign policy goals, the probability of two governments signing a DCA increases as their BIT profiles converge. As a general lesson for economic-security cooperation, our results show that larger structural considerations pervade bilateralism, and those structural considerations often overwhelm bilateral incentives to cooperate. Overall, our analysis reinforces the importance of comparing similar legal instruments (i.e., bilateral treaties) and assessing network context when theorizing and empirically studying the dynamics of cooperation.
Interdependence in economic and security cooperation
States face a trade-off when pursuing treaty-based cooperation. Footnote 9 Multilateral agreements reduce transaction costs and allow large numbers of states to build ambitious regimes focused on global collective action problems, but they are inflexible, prone to distributional conflicts, and difficult to enforce. Bilateral approaches, by contrast, allow partners to tailor agreements to their unique preferences and goals, but they entail a substantial increase in transaction costs and lead to patchwork institutional arrangements with potentially large discrepancies in policies and standards between states. Footnote 10 Although multilateralism prevailed in the years immediately following World War II, historical trends since then have favored bilateralism. In the 1950s, governments signed an average of 10 bilateral agreements for every one multilateral agreement. By the 1980s, that figure increased to nearly 20 to one. And by the 2010s, it increased to over 30 to one. Footnote 11 There is a clear trend toward bilateralism, and that trend has gained momentum over succeeding decades.
This increased reliance on bilateral agreements raises the question of how bilateral cooperation spreads across issue areas. Our focus on BITs and DCAs enters a crowded literature on the relationship between economic interdependence and security cooperation. Footnote 12 The long-standing study of trade and military alliances is perhaps most relevant to the current project. Gowa argues that allies should trade more than non-allies due to the security externalities of trade, while Morrow argues that security externalities only matter if states spend all gains from trade on military capabilities. Footnote 13 Empirical research generally finds that “trade follows the flag”—i.e., the presence of an alliance increases trade flows, but trade does not increase the probability of an alliance. Footnote 14 Scholars have recently pointed out that the precise relationship between trade and alliances depends on network structures. Footnote 15
As a synecdoche for overall economic-security relations, the study of trade and alliances suffers from a number of limitations. First, alliances are largely the domain of government actors, while trade is an economic activity driven by private actors. Footnote 16 Bridging this gap requires microtheoretical explanations of how private actors influence government policy. Footnote 17 An alternative approach is to limit focus to varieties of cooperation that rely more directly on government actors, such as formal treaties.
Second, scholars often conflate bilateral and multilateral agreements. This oversight complicates the theory-building process, as the creation of bilateral agreements is not equivalent to originating or joining a multilateral treaty. Footnote 18 Pooling bilateral actions with multilateral actions also poses methodological problems, such as biased parameter estimates. Statistical models typically assume that dyadic observations are conditionally independent of one another, Footnote 19 but in a multilateral setting at least some dyadic observations are correlated by definition. Footnote 20
Finally, existing work does not give sufficient attention to the network aspects of cooperation. Network scholars have repeatedly shown that international relations data are rife with statistical dependencies that, if ignored, lead to biased parameter estimates for many quantities of interest. Footnote 21 More importantly, virtually all varieties of international relations, including economic and security cooperation, are networks in fact and should be treated as such at all stages of inquiry, from theory development to empirical analysis. Footnote 22
Our approach responds to these issues. By focusing on BITs and DCAs, we examine treaty-based cooperation that clearly falls within the purview of governmental actors. Further, both BITs and DCAs are primarily bilateral, which avoids the theoretical and methodological challenges of combining bilateral with multilateral actions while also exploring interdependence between two nominally independent issue areas. And perhaps most importantly, we define both BITs and DCAs as networks. In this regard, our approach draws on an emerging literature that explicitly models different varieties of international relations as distinct layers of a global “multiplex” network. Footnote 23 Our objective is to theorize how networks of cooperation mutually influence one another, and to empirically model those influences using the appropriate methodological tools. The key methodological strengths of this network approach are that it (1) accounts for endogenous confounders within each respective network, (2) enables unbiased estimation of the influence of each network on the other, and (3) assesses the influence of higher-order network influences across networks.
Bilateral and network influences in BITs and DCAs
BITs and DCAs are bilateral institutions that establish rules, principles, and guidelines to facilitate cooperation in their respective issue areas. BITs originated with colonialism’s end and the subsequent need for capital-exporting states to protect investors from the governments of former colonies. The total number of treaties remained relatively small until the 1990s, when BITs expanded greatly due both to newly independent countries and to the enhanced desirability of foreign investment. Footnote 24 Ultimately, BITs respond to and further the expansion of production across borders by multinational corporations.
In a similar vein, DCAs respond to the shifting dynamics of post-Cold War conflict. While DCAs help states improve their security with regard to traditional interstate threats, they also address nontraditional threats like terrorism, political instability, nonstate armed groups, and maritime piracy. Footnote 25 Unlike some other security agreements—such as military alliances that contain economic provisions, or the status of forces agreements (SOFAs) frequently signed by the United States—DCAs do not formally link security cooperation to economic or other issues. This feature means that any observed empirical relationship between BITs and DCAs is not an ipso facto consequence of formal economic provisions.
Figure 2 maps treaty-making in BITs and DCAs for the period 1980–2010. In some cases, the maps clearly overlap. For example, China, South Korea, and most Western European countries are active in both BITs and DCAs, while sub-Saharan African and Central Asian countries tend to sign relatively few of either treaty type. However, in other cases, the maps diverge. Brazil and South Africa both sign large numbers of DCAs and relatively few BITs, while Egypt, Switzerland, and Austria sign large numbers of BITs and relatively few DCAs.
Total participation in investment treaties and defense agreements, 1980–2010.

BITs and DCAs at the bilateral level
We refer to the influence of cooperative ties in one issue area on ties in another issue area as “spillover.” Bilateral or “dyadic” explanations for spillover, which dominate the literature on economic-security cooperation, focus on interactions within discrete $ij$
pairs of states. Two such explanations are particularly relevant to economic-security cooperation.
$ij$
pairs of states. Two such explanations are particularly relevant to economic-security cooperation.
First, the material effects of a bilateral agreement between two states may improve conditions for other agreements between those same states. This logic informs standard “trade follows the flag” arguments. Footnote 26 For example, DCAs help states modernize their militaries, address shared security threats, and align themselves with groups of like-minded partners. Footnote 27 Because an increased probability of militarized conflict is a known political risk and increases the rate of return that firms demand, Footnote 28 the security improvements associated with DCAs may facilitate cooperation in BITs. As bilateral security conditions improve, the prospects of economic cooperation also improve. Footnote 29
Similarly, the economic integration associated with BITs may increase the cost of conflict and lay a foundation for further bilateral cooperation. Footnote 30 Commercial ties create incentives for multinational firms to lobby against conflict as a solution to shared security threats. Footnote 31
In some cases, implementation of an agreement in one issue area necessitates activities elsewhere. For example, DCAs are connected to the use of offsets, or the mandated purchase of defense products from formal treaty partners. Footnote 32 Such requirements encourage further investment as firms “follow the flag” to provide support and services in fulfillment of contracts. Footnote 33
Second, bilateral agreements offer a way for countries to reassure one another of their trustworthiness and reliability, which builds confidence for further cooperative endeavors. Footnote 34 DCAs promote trust by establishing annual high-level policy meetings, encouraging interpersonal contacts among government officials, and coordinating joint military exercises, peacekeeping operations, and other cooperative actions. The diplomatic interactions associated with BIT signature promote trust in similar fashion. BITs minimize the involvement of firms’ home states in disputes with treaty partners, which ensures that such disputes do not result in broader foreign policy conflict. BITs also enable monitoring of treaty compliance, which improves reputations over time. A reputation for trustworthiness may extend across issue areas. Footnote 35 For example, as governments build trust through economic ties, they may be more willing to accept the risks of security cooperation, such as sharing of classified information. Footnote 36 Or, if states first cooperate successfully on defense issues, an enhanced sense of trust leaves fertile ground for cooperation on investment protections.
For both of the above mechanisms, the probability that a given $ij$
dyad will sign a new BIT or DCA depends on the material or reputational effects associated solely with prior
$ij$
dyad will sign a new BIT or DCA depends on the material or reputational effects associated solely with prior $ij$
agreements. Other actors, beyond the
$ij$
agreements. Other actors, beyond the $ij$
relationship, do not play a role. Below, we contrast this dyadic logic with the network logic of cooperation, which involves more complex multiplayer considerations. The dyadic logic yields a straightforward hypothesis:
$ij$
relationship, do not play a role. Below, we contrast this dyadic logic with the network logic of cooperation, which involves more complex multiplayer considerations. The dyadic logic yields a straightforward hypothesis:
Hypothesis 1. Cooperation in a BIT (DCA) increases the probability of cooperation in a DCA (BIT)
BITs and DCAs at the network level
Both BITs and DCAs comprise larger global networks, where seemingly unrelated bilateral ties influence each other in complex ways. Our main argument is that distinct network strategies drive the formation of BITs and DCAs, and these strategies in turn influence spillover across issue areas. When a focal $i$
government forms new security and economic ties, it considers not only its bilateral relationship with a prospective
$i$
government forms new security and economic ties, it considers not only its bilateral relationship with a prospective $j$
partner, but also how an
$j$
partner, but also how an $ij$
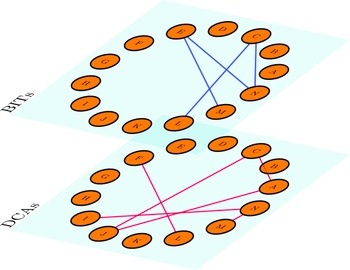
agreement would fit into its larger network of relationships. Governments develop portfolios of BITs and DCAs with larger strategic goals in mind, and those goals determine, at least in part, the extent to which cooperation in one issue area affects cooperation elsewhere. Consider Figure 3, which illustrates three archetypal local networks. Some countries avoid BITs but are highly active in DCAs (Brazil). Others sign many BITs but avoid DCAs (Egypt). Still others sign both types of agreements in abundance (Germany). In a dyadic view of BIT-DCA spillover, the probability of, say, a BIT between Brazil and Egypt depends on whether a DCA exists between those two countries. In a network view, by contrast, the probability of a Brazil-Egypt BIT depends on the larger structure of Brazil and Egypt’s respective DCA ties.
$ij$
agreement would fit into its larger network of relationships. Governments develop portfolios of BITs and DCAs with larger strategic goals in mind, and those goals determine, at least in part, the extent to which cooperation in one issue area affects cooperation elsewhere. Consider Figure 3, which illustrates three archetypal local networks. Some countries avoid BITs but are highly active in DCAs (Brazil). Others sign many BITs but avoid DCAs (Egypt). Still others sign both types of agreements in abundance (Germany). In a dyadic view of BIT-DCA spillover, the probability of, say, a BIT between Brazil and Egypt depends on whether a DCA exists between those two countries. In a network view, by contrast, the probability of a Brazil-Egypt BIT depends on the larger structure of Brazil and Egypt’s respective DCA ties.
Examples of local BIT and DCA networks.
Note: Figures illustrate each focal node’s respective local BIT and DCA networks. Lines indicated signed agreements.

As we show below, the network strategy that motivates DCAs differs from the network strategy behind BITs, which results in unexpected conflicts and complementarities between the two issue areas. To transform network insights into testable hypotheses, we draw on multilayer or “multiplex” network analysis,
Footnote 37
as illustrated in Figure 4. Whether DCAs and BITs influence one another is a question of spillover across layers—i.e., whether ties in one layer influence the creation of ties in the other layer.
Footnote 38
The dyadic logic articulated earlier represents the simplest form of spillover: an $ij$
edge in one layer increases the probability of an
$ij$
edge in one layer increases the probability of an $ij$
edge in the other layer. But spillover can take complex forms.
$ij$
edge in the other layer. But spillover can take complex forms.
BITs and DCAs as a two-layer multiplex network.
Note: Nodes correspond to countries. Edges correspond to BITs and/or DCAs in force.

The network-community DCA strategy
The primary goal of states when developing their DCA portfolios is to establish cohesive groups of like-minded defense partners. Footnote 39 DCAs play an alignment role. Signing an agreement with a new partner signals an interest in aligning not only with that state but also with its partners. For example, Brazil described its 2010 DCA with the United States as an attempt to “align itself strategically with the United States, as European nations have done with NATO.” Footnote 40 Canada referred to its 2012 DCA with Chile as part of a larger effort to collaborate with “like-minded nations to promote peace and security throughout the Americas.” Footnote 41
These cohesive groups of security collaborators in turn generate network efficiencies. Footnote 42 If a government’s defense partners are also partnered among themselves, then those connected governments can more easily share classified information, participate in trilateral or plurilateral military activities, and coordinate defense policies against mutual threats. Footnote 43 A network defined by group-based collaborations generates more utility for DCA partners. Footnote 44 This network-community logic means that when selecting defense partners, states look for signs that a prospective partner is reliable and trustworthy, aligned with the group’s broader structural goals, and capable of contributing to the achievement of those goals. While DCA-based groups may contain “central nodes,” or states that exercise disproportionate influence, such states—in contrast to the BIT network discussed below—do not typically favor hierarchical hub-and-spoke structures, preferring instead to foster direct cooperation among the “spokes” themselves.
The network-hierarchy BIT strategy
Motivations for signing BITs vary according to countries’ positions in international investment networks. Footnote 45 Historically, capital-exporting countries implemented BITs to protect the interests of their investors—for example, by mandating compensation for expropriation and requiring international arbitration for disagreements between firms and host states—while capital-importing countries used BITs as a credible commitment to improve investment inflows. Footnote 46 Although the motivation for signing BITs has evolved, with BITs signed even between capital-importing countries, Footnote 47 developed capital exporters still occupy hub positions in the network and rarely have BITs with each other. Footnote 48
Due in part to the capital importer/exporter distinction, the network strategy behind BIT formation prioritizes hierarchical relations. Power disparities allow developed countries to include stronger investor protections in the text of agreements, Footnote 49 and developing countries routinely accept existing BIT templates despite having played little role in crafting the text of those agreements. Footnote 50 Even South-South BITs often involve asymmetry. Footnote 51 In further contrast to the DCA network, capital-exporting countries do not obviously benefit from cooperation between their partners; rather, they may see greater economic advantage in signing treaties with countries that have few overlapping treaty links. Footnote 52 BIT portfolios can reach saturation points quickly as additional partners offer little economic advantage over existing ones. For example, in export-platform oriented production, one country may serve as the local producer for a larger region; multinationals would support a BIT with that country but not necessarily its neighbors. Alternatively, when global supply chains segment production across borders, the demand for BITs may extend to all countries in the supply chain, but there is little advantage to MNCs if those countries have BITs with one other. Overall, the network-level BIT strategy involves asymmetric, hierarchical relations with partners that are not typically partnered among themselves. Footnote 53
Network strategies and spillover
The primary consequence of these divergent network strategies is that the formation of new DCAs or BITs depends on the structure of the opposing network. We consider two aspects of network structure: nodal degree and structural similarity.
Degree-based network spillover
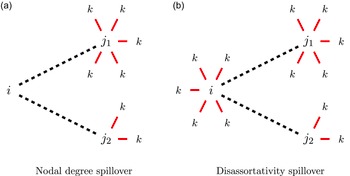
Nodal degree refers to a node’s number of ties. Figure 5(a) illustrates nodal degree spillover, where the creation of an $ij$
tie in one layer depends on node
$ij$
tie in one layer depends on node $j$
’s overall degree, or number of ties, in the other layer. The
$j$
’s overall degree, or number of ties, in the other layer. The $i$
focal node must choose between two prospective partners,
$i$
focal node must choose between two prospective partners, ${j_1}$
or
${j_1}$
or ${j_2}$
. Figure 5(b) illustrates a variant degree effect that considers the difference between
${j_2}$
. Figure 5(b) illustrates a variant degree effect that considers the difference between $i$
and
$i$
and $j$
’s respective degrees, which allows us to assess a phenomenon known as “disassortative mixing,” or the tendency for high-degree nodes to prefer ties to low-degree nodes.
Footnote 54
$j$
’s respective degrees, which allows us to assess a phenomenon known as “disassortative mixing,” or the tendency for high-degree nodes to prefer ties to low-degree nodes.
Footnote 54
Degree-based spillover between DCA and BIT networks.
Note: Actor $i$
is the focal node;
$i$
is the focal node; $j$
is the potential bilateral partner; and
$j$
is the potential bilateral partner; and $k$
represents third parties. Solid red lines indicate existing DCAs or BITs in force. Dashed black lines indicate prospective agreements of the other type.
$k$
represents third parties. Solid red lines indicate existing DCAs or BITs in force. Dashed black lines indicate prospective agreements of the other type.

Consider first the influence of the DCA network on the formation of ties in the BIT network—i.e., BITs are the black dashed lines in Figure 5(a), and DCAs are the red solid lines. According to the network-hierarchy logic of BITs, governments prefer BIT partners that are more likely to accede to capital exporters’ demands when negotiating agreements and, once a BIT is in force, less likely to interfere with the activities of their firms. Based on this logic, governments should avoid BITs with countries that sign numerous DCAs and should favor BITs with states that sign few DCAs. This expectation obtains for two reasons. First, the activities that DCAs enable—arms trade, training, officer exchanges, research and development, defense policy coordination—are crucial sources of military capabilities. As an independent factor, defense partnerships and military modernization strengthen an incumbent regime with respect to domestic challengers and increase a leader’s bargaining leverage with respect to foreign governments. Footnote 55 These effects embolden a government, thus increasing the odds that it will demand more in bargaining and enact policies that contradict MNC interests.
Second, because DCAs involve coordination in defense and security policies, a government with many DCAs must coordinate its policies with many partners. This multiparty coordination increases the odds that a BIT partner will enact policies that detrimentally affect MNCs. For example, in their efforts to address transnational threats like terrorism, trafficking, organized crime, and illicit finance, DCA partners often implement policy changes that, though targeted at security threats, necessarily affect economic issue areas, such as customs and duties, border and port inspections, immigration and movement of human capital, financing and banking, and access to internet and wireless networks. Disruptions in any of these areas can interfere with the activities and profitability of firms, especially when those disruptions are coordinated with and dependent on a larger group of defense partners.
On the demand side, a government with few DCA partners may view BITs as a means of improving its security. The classic arms-versus-allies trade-off stipulates that if a country cannot ensure its security via defense partnerships, it must pursue security through domestic spending, Footnote 56 which is in turn a function of economic growth. Footnote 57 Insofar as governments are aware of the nexus of investment, growth, defense spending, and security, a government that lacks defense partners should find BITs particularly attractive.
We therefore anticipate a negative relationship between DCA nodal degree and BIT formation: the more active a prospective $j$
partner is in the DCA network, the less likely
$j$
partner is in the DCA network, the less likely $i$
is to select
$i$
is to select $j$
as a BIT partner.
$j$
as a BIT partner.
Hypothesis 2 The greater the number of DCAs signed by a prospective partner, the lower the probability of a BIT with that country (DCA Degree)
We further anticipate a positive relationship between DCA disassortativity and BIT formation. Large discrepancies in the DCA degree of $i$
and
$i$
and $j$
, where one state is highly active in DCAs and the other is substantially less active, should increase the probability of an
$j$
, where one state is highly active in DCAs and the other is substantially less active, should increase the probability of an $ij$
BIT. This DCA asymmetry mirrors the capital exporter’s preferred network structure, maximizes bargaining leverage, and minimizes the odds that a BIT partner will entertain policies that interfere with MNC interests. On the demand side, a state with few DCAs may view a BIT with a country that has extensive DCA ties as a particularly attractive partner; because DCAs increase investment in defense-related technologies, those firms headquartered in countries that are active in the DCA network are well positioned to make foreign investments that generate security benefits for host countries.
$ij$
BIT. This DCA asymmetry mirrors the capital exporter’s preferred network structure, maximizes bargaining leverage, and minimizes the odds that a BIT partner will entertain policies that interfere with MNC interests. On the demand side, a state with few DCAs may view a BIT with a country that has extensive DCA ties as a particularly attractive partner; because DCAs increase investment in defense-related technologies, those firms headquartered in countries that are active in the DCA network are well positioned to make foreign investments that generate security benefits for host countries.
Hypothesis 3 The larger the gap between the number of DCAs signed by a focal state and a prospective partner, the greater the probability of a BIT between them (DCA Disassortativity)
In contrast to the above discussion, we do not anticipate degree-based spillover from the BIT network to the DCA network (i.e., where DCAs are the black dashed lines in Figure 5, and BITs are the red solid lines). According to the network-community logic of DCAs, governments prefer defense partners that are reliable and closely aligned with their own interests. A country’s nodal degree in the BIT network does not obviously reveal such information. For example, a capital-exporting country that signs numerous BITs—and thus has a high degree in the BIT network—may be a powerful government that exerts substantial regional or extra-regional influence, or it may simply be a highly developed economy with little interest in security politics. Large discrepancies in BIT degree, as in disassortativity, are similarly uninformative. In principle, a country with low degree in the BIT network may be disconnected from politics and thus an undesirable security partner, but many regional powers—Brazil, Saudi Arabia, India—sign few BITs and are nonetheless sought-after defense partners. In short, overall BIT activity should have little effect on defense cooperation. This null expectation is substantively meaningful for at least two reasons. First, it identifies an area where, based on theory, spillover is limited. Second, it shows that spillover does not operate symmetrically across issue areas; rather, network logics matter.
Similarity-based network spillover
The second form of network spillover we consider is structural similarity, defined as the extent to which a given $i$
and
$i$
and $j$
overlap in their respective ties to third parties. Figure 6 provides an example of overlapping BIT ties for Indonesia and Philippines in the year 1995. Although both countries have many exclusive BIT partners, they also share a half dozen partners in common. Notably, these two countries signed a bilateral DCA in 1997. This example raises the question of whether similarity in BIT or DCA portfolios increases the odds of countries signing a direct agreement in the opposing issue area.
$j$
overlap in their respective ties to third parties. Figure 6 provides an example of overlapping BIT ties for Indonesia and Philippines in the year 1995. Although both countries have many exclusive BIT partners, they also share a half dozen partners in common. Notably, these two countries signed a bilateral DCA in 1997. This example raises the question of whether similarity in BIT or DCA portfolios increases the odds of countries signing a direct agreement in the opposing issue area.
Overlapping third-party ties in the BIT network.
Note: Indonesia (INS) and Philippines (PHI) are the focal nodes. Edges are signed BITs. Blue nodes are third-party states with which both Indonesia and Philippines have signed BITs. Data are from 1995.

Structural similarity is a well-established concept in the network science literature.
Footnote 58
It also parallels efforts by IR scholars to systematically compare the multilateral portfolios of governments, as in metrics like $S$
scores and United Nations General Assembly voting affinity.
Footnote 59
The distinction here is that we consider how structural similarity in one issue area affects cooperation elsewhere. Figure 7 illustrates structural similarity in terms of spillover. The focal
$S$
scores and United Nations General Assembly voting affinity.
Footnote 59
The distinction here is that we consider how structural similarity in one issue area affects cooperation elsewhere. Figure 7 illustrates structural similarity in terms of spillover. The focal $i$
state must choose between a
$i$
state must choose between a ${j_1}$
partner with which it has highly similar third-party ties and a
${j_1}$
partner with which it has highly similar third-party ties and a ${j_2}$
with which it has less similar third-party ties.
${j_2}$
with which it has less similar third-party ties.
Structural similarity and spillover.
Note: Actor $i$
is the focal node;
$i$
is the focal node; $j$
is the potential bilateral partner; and
$j$
is the potential bilateral partner; and $k$
represents third parties. Solid red lines indicate existing DCAs or BITs in force. Dashed black lines indicate prospective agreements of the other type.
$k$
represents third parties. Solid red lines indicate existing DCAs or BITs in force. Dashed black lines indicate prospective agreements of the other type.

First consider BIT formation as the outcome of interest—i.e., BITs are the dashed black lines in Figure 7, and DCAs are the solid red lines. We expect similarity in the DCA portfolios of $i$
and
$i$
and $j$
to reduce the probability of an
$j$
to reduce the probability of an $ij$
BIT. According to network-hierarchy BIT logic, capital-exporting governments favor asymmetric relations that yield protections for their firms and greater leverage over treaty design.
Footnote 60
If two countries tend to cooperate militarily with the same third parties, they are essentially part of the same security community.
Footnote 61
Such governments should view one another as in-group peers, with complementary strategic interests.
Footnote 62
Similarity in DCA portfolios thus reflects a more symmetric distribution of influence, which is inimical to the hierarchical structure preferred in BIT relations. Capital exporters should find it more difficult to exert influence over governments with whom they’re aligned on defense issues. We thus anticipate negative spillover from DCA structural similarity to BIT formation.
$ij$
BIT. According to network-hierarchy BIT logic, capital-exporting governments favor asymmetric relations that yield protections for their firms and greater leverage over treaty design.
Footnote 60
If two countries tend to cooperate militarily with the same third parties, they are essentially part of the same security community.
Footnote 61
Such governments should view one another as in-group peers, with complementary strategic interests.
Footnote 62
Similarity in DCA portfolios thus reflects a more symmetric distribution of influence, which is inimical to the hierarchical structure preferred in BIT relations. Capital exporters should find it more difficult to exert influence over governments with whom they’re aligned on defense issues. We thus anticipate negative spillover from DCA structural similarity to BIT formation.
Hypothesis 4 The more similar two countries are in their DCAs with third parties, the lower the probability they will form a BIT (DCA Similarity)
Next, consider DCA formation as the outcome of interest—i.e., DCAs are the black lines in Figure 7, and BITs are the red lines. We anticipate that similarity in the BIT portfolios of $i$
and
$i$
and $j$
will increase the probability of a bilateral
$j$
will increase the probability of a bilateral $ij$
DCA. This expectation obtains because, unlike BIT-related nodal degree, similarity in BIT profiles reveals information about political alignment—a key focus of the network-community DCA strategy. Governments that form financial ties to the same third parties are more likely to share foreign policy goals. For example, Bunte and Kinne find that when making bilateral loans, governments tend to mirror the lending behavior of their defense partners and avoid competition with adversaries.
Footnote 63
Because DCAs improve defense capabilities, governments with similar BIT profiles can use DCAs to enhance their bargaining positions and establish hierarchical relations over prospective BIT partners. The network-community logic of DCAs means that as like-minded governments leverage cooperative defense ties to increase financial influence over third parties, the resulting gains redound to the benefit of the group.
$ij$
DCA. This expectation obtains because, unlike BIT-related nodal degree, similarity in BIT profiles reveals information about political alignment—a key focus of the network-community DCA strategy. Governments that form financial ties to the same third parties are more likely to share foreign policy goals. For example, Bunte and Kinne find that when making bilateral loans, governments tend to mirror the lending behavior of their defense partners and avoid competition with adversaries.
Footnote 63
Because DCAs improve defense capabilities, governments with similar BIT profiles can use DCAs to enhance their bargaining positions and establish hierarchical relations over prospective BIT partners. The network-community logic of DCAs means that as like-minded governments leverage cooperative defense ties to increase financial influence over third parties, the resulting gains redound to the benefit of the group.
Hypothesis 5 The more similar two countries are in their BITs with third parties, the greater the probability they will form a DCA (BIT Similarity)
Data and research design
We use DCA data from the Defense Cooperation Agreement Dataset (DCAD) on both general and sector-specific agreements.
Footnote 64
The longitudinal DCA network is operationalized as a $T=21$
stack of binary matrices,
$T=21$
stack of binary matrices, ${\bf{X}}$
, covering the period 1990–2010,
Footnote 65
where an
${\bf{X}}$
, covering the period 1990–2010,
Footnote 65
where an ${x_{ij,t}}= 1$
entry in a given
${x_{ij,t}}= 1$
entry in a given ${{\bf{x}}_t}$
annual DCA network indicates that a DCA is in force between countries
${{\bf{x}}_t}$
annual DCA network indicates that a DCA is in force between countries $i$
and
$i$
and $j$
in year
$j$
in year $t$
.
$t$
.
The BIT data are from Allee,
Footnote 66
supplemented with recent files from the Investment Policy Hub of the United Nations Conference on Trade and Development.
Footnote 67
As with the DCA network, we operationalize the BIT network longitudinally as a stack of 21 matrices, ${\bf{Y}}$
, where
${\bf{Y}}$
, where ${y_{ij,t}} =1$
in a given
${y_{ij,t}} =1$
in a given ${{\bf{y}}_t}$
BIT network indicates that a BIT was signed between
${{\bf{y}}_t}$
BIT network indicates that a BIT was signed between $i$
and
$i$
and $j$
within the past ten years, inclusive of year
$j$
within the past ten years, inclusive of year $t$
.
$t$
.
There are two methodological challenges in assessing the empirical relationship between BITs and DCAs. First, if the two networks mutually influence one another, then ties in each network are complex functions of ties in the other network. We cannot simply treat one network as an exogenous covariate in a traditional regression model. Second, as networks, both BITs and DCAs exhibit powerful statistical dependencies. The creation or termination of a given $ij$
DCA tie is a function of other ties in the DCA network.
Footnote 68
BITs similarly involve endogenous influences across dyads.
Footnote 69
When observations of a dependent variable influence one another, the data violate the basic i.i.d. assumption that underlies regression models.
Footnote 70
Our empirical model must account for these statistical dependencies in order to obtain unbiased estimates of the BIT-DCA relationship.
$ij$
DCA tie is a function of other ties in the DCA network.
Footnote 68
BITs similarly involve endogenous influences across dyads.
Footnote 69
When observations of a dependent variable influence one another, the data violate the basic i.i.d. assumption that underlies regression models.
Footnote 70
Our empirical model must account for these statistical dependencies in order to obtain unbiased estimates of the BIT-DCA relationship.
We use a modified stochastic actor-oriented model (SAOM).
Footnote 71
The SAOM is perhaps most intuitively described as an agent-based model in which statistical inference is achieved by comparing simulated network data to real-world networks, with the goal of selecting SAOM parameters that generate simulated networks that resemble as closely as possible the observed network data. A standard SAOM relies upon a single nodal utility function, ${f_i}\left( {\bf{x}} \right)$
, which is assumed to apply identically to all nodes in the network
${f_i}\left( {\bf{x}} \right)$
, which is assumed to apply identically to all nodes in the network ${\bf{x}}$
. In creating, maintaining, and/or terminating ties in the
${\bf{x}}$
. In creating, maintaining, and/or terminating ties in the ${\bf{x}}$
network, actors seek to maximize this function. To extend this single-equation model to the problem of cross-network spillover—or what the SAOM literature refers to as “coevolution”—we consider an additional network,
${\bf{x}}$
network, actors seek to maximize this function. To extend this single-equation model to the problem of cross-network spillover—or what the SAOM literature refers to as “coevolution”—we consider an additional network, ${\bf{y}}$
, with a separate corresponding utility function.
Footnote 72
Therefore, we model two utility functions,
${\bf{y}}$
, with a separate corresponding utility function.
Footnote 72
Therefore, we model two utility functions, $f_i^X\left( {{\bf{x}},{\bf{y}}} \right)$
and
$f_i^X\left( {{\bf{x}},{\bf{y}}} \right)$
and $f_i^Y\left( {{\bf{x}},{\bf{y}}} \right)$
.
Footnote 73
For notational purposes,
$f_i^Y\left( {{\bf{x}},{\bf{y}}} \right)$
.
Footnote 73
For notational purposes, $f_i^X\left( {{\bf{x}},{\bf{y}}} \right)$
always refers to the
$f_i^X\left( {{\bf{x}},{\bf{y}}} \right)$
always refers to the ${\bf{X}}$
DCA network, and
${\bf{X}}$
DCA network, and $f_i^Y\left( {{\bf{x}},{\bf{y}}} \right)$
always refers to the
$f_i^Y\left( {{\bf{x}},{\bf{y}}} \right)$
always refers to the ${\bf{Y}}$
BIT network. Each function consists of a linear combination of various effects,
${\bf{Y}}$
BIT network. Each function consists of a linear combination of various effects,
 $$f_i^X({\rm{x,y}}) = \sum\limits_{h = 1} {\beta _h^Xs_{ih}^X({\rm{x,y}})}$$
and
 $$f_i^Y({\rm{x,y}}) = \sum\limits_{h = 1} {\beta _h^Ys_{ih}^Y({\rm{x,y}}),}$$
where $s_{ih}^X\left( {{\bf{x}},{\bf{y}}} \right)$
represents those variables that determine the formation, maintenance, and/or termination of ties in the DCA network, and
$s_{ih}^X\left( {{\bf{x}},{\bf{y}}} \right)$
represents those variables that determine the formation, maintenance, and/or termination of ties in the DCA network, and $s_{ih}^Y\left( {{\bf{x}},{\bf{y}}} \right)$
represents those variables that determine the formation, maintenance, and/or termination of ties in the BIT network. In practice, these functions consist of three types of effects: (1) network influences, such as transitivity or degree centrality, that are strictly endogenous to that given network; (2) exogenous influences such as geographic distance, regime type, or economic development; and (3) cross-network influences, such as those illustrated in Figures 5 and 7, where network structures in one network influence ties in the other network. Each specified
$s_{ih}^Y\left( {{\bf{x}},{\bf{y}}} \right)$
represents those variables that determine the formation, maintenance, and/or termination of ties in the BIT network. In practice, these functions consist of three types of effects: (1) network influences, such as transitivity or degree centrality, that are strictly endogenous to that given network; (2) exogenous influences such as geographic distance, regime type, or economic development; and (3) cross-network influences, such as those illustrated in Figures 5 and 7, where network structures in one network influence ties in the other network. Each specified $s_{ih}^X$
or
$s_{ih}^X$
or $s_{ih}^Y$
effect is weighted by a respective
$s_{ih}^Y$
effect is weighted by a respective $\beta _h^X$
or
$\beta _h^X$
or $\beta _h^Y$
parameter. In most cases, a negative
$\beta _h^Y$
parameter. In most cases, a negative $\beta $
parameter estimate indicates that a specified effect discourages network tie formation, while a positive estimate indicates that a specified effect encourages tie formation.
$\beta $
parameter estimate indicates that a specified effect discourages network tie formation, while a positive estimate indicates that a specified effect encourages tie formation.
Because these utility functions contain both endogenous network influences and simultaneous cross-network influences, the model parameters must be estimated via simulation. We employ simulated method of moments estimation.
Footnote 74
The estimation algorithm incorporates a number of fundamental assumptions. First, the network evolves continuously, one tie at a time, with potentially large numbers of tie changes occurring unobserved between observation moments (i.e., years). Second, nodes exercise individual agency in that they choose ${x_{ij}}$
or
${x_{ij}}$
or ${y_{ij}}$
ties in such a way as to maximize the payoff from their respective utility function. Third, the opportunity for actors to change their ties in either network is stochastically determined by separate rate functions, which allows for the rate of change in one network to differ from the other. Fourth, once an actor changes a tie in either the
${y_{ij}}$
ties in such a way as to maximize the payoff from their respective utility function. Third, the opportunity for actors to change their ties in either network is stochastically determined by separate rate functions, which allows for the rate of change in one network to differ from the other. Fourth, once an actor changes a tie in either the ${\bf{x}}$
or
${\bf{x}}$
or ${\bf{y}}$
network, that change is immediately reflected in the other network, which ensures that the ties between the two networks interact in a continuously evolving process. This implementation of the SAOM thus models spillover in terms of coevolution of the two networks over time.
${\bf{y}}$
network, that change is immediately reflected in the other network, which ensures that the ties between the two networks interact in a continuously evolving process. This implementation of the SAOM thus models spillover in terms of coevolution of the two networks over time.
For the BIT utility function, $f_i^Y\left( {{\bf{x}},{\bf{y}}} \right)$
, we specify a series of spillover effects, where structures within the DCA network influence ties in the BIT network. To assess bilateral spillover, we include the dyadic cross-product of the two networks, defined as
$f_i^Y\left( {{\bf{x}},{\bf{y}}} \right)$
, we specify a series of spillover effects, where structures within the DCA network influence ties in the BIT network. To assess bilateral spillover, we include the dyadic cross-product of the two networks, defined as
 $${\rm{DCA}}\,{\rm{bilatera}}{{\rm{l}}_{ij}} = \sum\limits_j {{y_{ij}}{x_{ij}}.}$$
A positive $\beta $
estimate for this statistic indicates that when the
$\beta $
estimate for this statistic indicates that when the $i$
focal node forms BITs, it prefers to form BITs with current DCA partners; that is, it creates, maintains, or terminates BIT ties in such a way as to maximize Equation (3). A BIT tie to a current DCA partner would thus be preferred to a BIT tie to a non-partner. Conversely, a negative
$i$
focal node forms BITs, it prefers to form BITs with current DCA partners; that is, it creates, maintains, or terminates BIT ties in such a way as to maximize Equation (3). A BIT tie to a current DCA partner would thus be preferred to a BIT tie to a non-partner. Conversely, a negative $\beta $
estimate indicates that
$\beta $
estimate indicates that $i$
avoids BITs with current DCA partners.
$i$
avoids BITs with current DCA partners.
To assess the more complex influences behind H2 and H3, we include the following terms:
 $${\rm{DCA}}\,{\rm{degre}}{{\rm{e}}_j} = \sum\limits_j {{y_{ij}}\left( {\sqrt {{x_{j+}} } - \sqrt {\bar x} } \right)}$$
 $${\rm{DCA}}\,{\rm{degree}}\,{\rm{dif}}{{\rm{f}}_{ij}} = \sum\limits_j {{y_{ij}}\left| {\sqrt {{x_{i + }}} - \sqrt {{x_{j + }}} } \right|}$$
The DCA degree ${_j}$
term captures the tendency of
${_j}$
term captures the tendency of $i$
to select partners in the BIT network that occupy high-degree positions in the DCA network. A positive parameter estimate here indicates that as a given
$i$
to select partners in the BIT network that occupy high-degree positions in the DCA network. A positive parameter estimate here indicates that as a given $j$
’s number of DCA ties increases, it becomes a more attractive BIT partner, while a negative estimate means that large numbers of DCA ties make
$j$
’s number of DCA ties increases, it becomes a more attractive BIT partner, while a negative estimate means that large numbers of DCA ties make $j$
a less attractive partner. The DCA degree diff
$j$
a less attractive partner. The DCA degree diff ${_{ij}}$
term captures degree-based disassortivity. A positive parameter estimate indicates that large discrepancies in the DCA activity of
${_{ij}}$
term captures degree-based disassortivity. A positive parameter estimate indicates that large discrepancies in the DCA activity of $i$
and its prospective
$i$
and its prospective $j$
partners increases the probability of a BIT, while a negative estimate indicates an aversion to disassortative mixing.
$j$
partners increases the probability of a BIT, while a negative estimate indicates an aversion to disassortative mixing.
We use Jaccard similarity to assess the influence of structural similarity. This metric considers not only which $k$
third parties a pair of
$k$
third parties a pair of $ij$
states have mutual ties with, but also which third parties
$ij$
states have mutual ties with, but also which third parties $i$
and
$i$
and $j$
mutually lack ties with, as follows:
$j$
mutually lack ties with, as follows:
 $${\rm{DCA}}\,{\rm{similarit}}{{\rm{y}}_{ij}} = \sum\limits_j {{y_{ij}}\left( {{{\sum {_k{x_{ik}}{x_{jk}}} }}\over{{{x_{i + }} + {x_{j + }} - \sum {_k{x_{ik}}{x_{jk}}} }}} \right).}$$
A positive parameter estimate indicates that as $i$
and
$i$
and $j$
increasingly overlap in their DCA portfolios, they become increasingly likely to sign a BIT. By contrast, a negative estimate indicates that states avoid BITs with partners whose DCA portfolios are similar to their own.
$j$
increasingly overlap in their DCA portfolios, they become increasingly likely to sign a BIT. By contrast, a negative estimate indicates that states avoid BITs with partners whose DCA portfolios are similar to their own.
For the $f_i^X\left( {{\bf{x}},{\bf{y}}} \right)$
DCA equation, wherein DCA ties constitute the dependent variable of interest, we include the same effects as defined above in Equations (3), (4), (5), and (6), but with
$f_i^X\left( {{\bf{x}},{\bf{y}}} \right)$
DCA equation, wherein DCA ties constitute the dependent variable of interest, we include the same effects as defined above in Equations (3), (4), (5), and (6), but with $x$
ties in place of
$x$
ties in place of $y$
ties, and
$y$
ties, and $y$
ties in place of
$y$
ties in place of $x$
ties. This yields four BIT-related cross-network terms in the DCA equation: BIT bilateral
$x$
ties. This yields four BIT-related cross-network terms in the DCA equation: BIT bilateral ${_{ij}}$
, BIT degree
${_{ij}}$
, BIT degree ${_j}$
, BIT degree diff
${_j}$
, BIT degree diff ${_{ij}}$
, and BIT similarity
${_{ij}}$
, and BIT similarity ${_{ij}}$
.
${_{ij}}$
.
Consistent with our expectation that both DCAs and BITs are driven by network dynamics, we also control for endogenous influences within each respective DCA and BIT network. For each equation, we include two endogenous network terms. Transitivity reflects the tendency of states to prefer ties to “friends of friends.” Degree ${_j}$
controls for “preferential attachment,” or the tendency of states within a given network to seek out high-degree nodes. Although these terms are sometimes subjects of inquiry in their own right,
Footnote 75
here we treat them simply as control variables.
${_j}$
controls for “preferential attachment,” or the tendency of states within a given network to seek out high-degree nodes. Although these terms are sometimes subjects of inquiry in their own right,
Footnote 75
here we treat them simply as control variables.
The respective literatures on BITs and DCAs have established standard sets of control variables for each outcome. Footnote 76 Several important control variables are common determinants of both DCAs and BITs, including distance, shared interests, and trade openness. We measure distance using log distance between capital cities, Footnote 77 and we measure bilateral trade as total imports plus exports, log transformed. Footnote 78 For shared interests, we use similarity in United Nations General Assembly voting. Footnote 79 In the DCA equation, we also include controls for alliance ties, Footnote 80 and we incorporate both monadic and dyadic controls for power, Footnote 81 GDP per capita, Footnote 82 and regime type. Footnote 83 In the BIT equation, we control for dyadic similarity in GDP per capita and rule of law. We include both monadic and dyadic controls for use of credit from the International Monetary Fund (a dummy variable), foreign aid as a percentage of GDP, and dummy variables for new states. Footnote 84
Empirical analysis
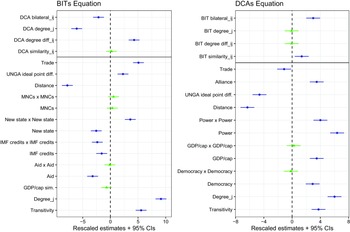
Figure 8 illustrates the results of the empirical analysis, separated into the BIT equation and the DCA equation, with estimates and confidence intervals scaled for legibility. We first consider the estimates for covariates, which are generally consistent with expectations. For BITs, geographic distance decreases the probability of a tie, while both bilateral trade and distance in UNGA voting increase the probability of a tie. Pairs of countries that receive IMF credits are less likely to form a BIT, which may reflect a south-south dynamic. By contrast, pairs of relatively new countries are more likely to sign BITs. Finally, both endogenous network dynamics, Transitivity and Degree ${_j}$
, sharply increase BIT cooperation, as expected.
${_j}$
, sharply increase BIT cooperation, as expected.
Stochastic actor-oriented model of DCA-BIT coevolution.
Note: Dots are estimated $\beta $
parameters. Lines are 95% confidence intervals. Estimates in blue are statistically significant at the 5% level. Estimates and confidence intervals scaled for legibility.
$\beta $
parameters. Lines are 95% confidence intervals. Estimates in blue are statistically significant at the 5% level. Estimates and confidence intervals scaled for legibility.

For DCAs, estimates for exogenous covariates are consistent with prior research.
Footnote 85
At the dyadic level, all three of geographic distance, UNGA ideal point distance, and bilateral trade reduce DCA formation, while alliances increase DCA formation. At the monadic level, states generally prefer to sign DCAs with partners that are powerful, wealthy, and democratic. As with BITs, both of the endogenous network dynamics, Transitivity and Degree ${_j}$
, significantly increase DCA cooperation.
${_j}$
, significantly increase DCA cooperation.
For network spillover, we first assess the bilateral relationships hypothesized in H1. With BITs as the outcome of interest (left panel of Figure 8), the results contradict H1. Rather than increasing the probability of a BIT, a bilateral DCA in fact reduces that probability. The SAOM estimates are log odds ratios and can be interpreted similarly to multinomial logit estimates. The exponent of the (unscaled) estimate indicates the relative difference in the probability of $i$
forming a tie with a DCA partner versus forming a tie with a nonpartner. In this case, the estimate for DCA Bilateral
$i$
forming a tie with a DCA partner versus forming a tie with a nonpartner. In this case, the estimate for DCA Bilateral ${_{ij}}$
indicates that
${_{ij}}$
indicates that $i$
is about 21% less likely to sign a BIT with a DCA partner than a non-DCA partner.
$i$
is about 21% less likely to sign a BIT with a DCA partner than a non-DCA partner.
Although this effect is small in magnitude—and the more complex network spillover effects, discussed momentarily, exert a much stronger influence on spillover—it deserves further consideration. This result may represent a case of network logic overwhelming bilateral incentives. In principle, for all the reasons outlined above, DCA partners should have an incentive to sign BITs. Yet, governments may find it difficult to isolate bilateral relationships from their larger network context. DCAs are symmetric agreements; at least in principle, partners benefit equally in terms of improving their capabilities and modernizing their militaries. Footnote 86 This symmetry likely interferes with the ability of capital exporters to secure the favorable terms and long-term economic influence they desire in BIT partnerships. Further, if governments factor the inevitable group dynamics and coalition politics of DCAs into their decision-making, they may be averse to signing a BIT even with a DCA partner that lacks extensive network ties; that is, the prospect of shifting security politics down the road may be sufficient to discourage efforts at establishing asymmetric financial influence in the present.
By contrast, with DCAs as the outcome of interest (right panel of Figure 8), we find support for H1. The presence of a BIT increases the probability of a bilateral DCA by about 95%. Not only is this result the opposite of that regarding the bilateral effect of DCAs on BITs, but it is also substantively stronger. Taken together, the bilateral estimates suggest the opposite of a “trade follows the flag” relationship. In the case of BITs and DCAs, economic relations actively encourage security cooperation, not vice versa. Again, the discrepant finding here may be the result of governments incorporating network logics into their bilateral decisions. The presence of a bilateral BIT, as reflected in BIT bilateral ${_{ij}}$
, indicates that the capital exporter has already determined the
${_{ij}}$
, indicates that the capital exporter has already determined the $ij$
relationship to be sufficiently asymmetric and financially beneficial. In that context, a bilateral DCA may function as a means for an aspiring regional hegemon or “central node” to establish an influential position for itself within a larger security community. More generally, the results for H1 reveal the importance of considering network logics even when assessing seemingly bilateral relationships.
$ij$
relationship to be sufficiently asymmetric and financially beneficial. In that context, a bilateral DCA may function as a means for an aspiring regional hegemon or “central node” to establish an influential position for itself within a larger security community. More generally, the results for H1 reveal the importance of considering network logics even when assessing seemingly bilateral relationships.
The network spillover effects are generally consistent with expectations. Examining first the results for BITs as an outcome, the significant negative estimate for Degree ${_j}$
indicates that states avoid BIT partners that are highly active in the DCA network, as predicted by H2. Substantively, a one-unit increase in a potential
${_j}$
indicates that states avoid BIT partners that are highly active in the DCA network, as predicted by H2. Substantively, a one-unit increase in a potential $j$
partner’s DCA degree score reduces the probability of an
$j$
partner’s DCA degree score reduces the probability of an $ij$
BIT by about 35%. This effect increases as the gap in DCA centrality between potential partners increases. For example, a potential
$ij$
BIT by about 35%. This effect increases as the gap in DCA centrality between potential partners increases. For example, a potential $j$
partner that has signed 38 DCAs (about the number of DCAs signed by Argentina) is about 75% less likely to be selected as a BIT partner than a country that has signed only eight DCAs (about the number signed by Ecuador), ceteris paribus.
$j$
partner that has signed 38 DCAs (about the number of DCAs signed by Argentina) is about 75% less likely to be selected as a BIT partner than a country that has signed only eight DCAs (about the number signed by Ecuador), ceteris paribus.
We also find support for degree-based disassortativity, as specified in H3. The probability of a bilateral BIT increases when large discrepancies exist in the DCA degree of potential BIT partners. Continuing the above Argentina-Ecuador illustration, for a focal node with 38 DCAs, the odds of forming a BIT with Ecuador are over 135% greater than the odds of forming a BIT with Argentina, ceteris paribus. In short, governments seek out BIT partnerships with countries that occupy highly different security positions than themselves.
Contrary to H4, we find no evidence that similarity in DCA portfolios affects BIT formation. One explanation for this null finding is that, according to the network-hierarchy logic of BITs, capital exporters are particularly concerned with whether potential BIT partners have the material resources to exercise disproportionate influence in treaty negotiations and/or interfere with MNC activities. While degree-based features of the DCA network reveal such information, similarity-based features of the DCA network primarily reveal information about alignment, which may be insufficient to identify suitable BIT partners.
Regarding higher-order network spillover with DCAs as the outcome of interest, as expected we find no evidence of degree-based effects of BITs on DCAs. However, we do find a significant similarity effect. As $i$
and
$i$
and $j$
grow more similar in their BIT portfolios, they are increasingly likely to cooperate directly in a DCA—conditional, of course, on strategic covariates like military capabilities and revealed UNGA preferences. Once again, this finding is consistent with network logics. Similarity in BIT portfolios reflects a potential compatibility in foreign policy goals. Governments should not only be more amenable toward cooperating with governments that share their goals, but they should also recognize such similarity as an essential ingredient in establishing stable communities of defense collaborators.
$j$
grow more similar in their BIT portfolios, they are increasingly likely to cooperate directly in a DCA—conditional, of course, on strategic covariates like military capabilities and revealed UNGA preferences. Once again, this finding is consistent with network logics. Similarity in BIT portfolios reflects a potential compatibility in foreign policy goals. Governments should not only be more amenable toward cooperating with governments that share their goals, but they should also recognize such similarity as an essential ingredient in establishing stable communities of defense collaborators.
Conclusion
We have argued that when governments develop portfolios of bilateral agreements, they pursue specific goals and implement appropriate network strategies in achieving those goals. These goals and strategies vary by issue area. In the case of BITs, governments prefer portfolios that establish hierarchical structures, where capital exporters are able to influence treaty texts and protect their firms. In DCAs, governments prefer portfolios that establish defined groups of well-connected defense collaborators. We show that these underlying network strategies strongly influence spillover across issue areas. When network strategies conflict, cooperation in one issue area may in fact discourage cooperation in another area. For example, governments prefer to sign BITs with partners that are relatively inactive in the DCA network, as highly active partners are less amenable to hierarchical influence. At the same time, the individual network processes are not entirely independent. For example, similarity in BIT portfolios signals a compatibility of larger foreign policy goals, which in turn encourages bilateral defense cooperation.
Our theory and results have implications far beyond BITs and DCAs. Bilateral cooperation in general is rife with network influences. Footnote 87 Assessing spillover across issue areas necessitates a network perspective, which both increases the investigative burden on scholars and encourages the discovery of unexpected and counterintuitive mechanisms of influence between varieties of international cooperation. Our analysis further suggests that fully accounting for mechanisms of network spillover requires attention to the specific network strategies that drive given issue areas. One crucial area of future research, then, is to determine whether there exists a standard set of network strategies that might be applied broadly across multiple issues. For example, Jung and Lake distinguish between networks, hierarchies, and markets as three basic and widely applicable forms of social organization. Footnote 88 And Kinne and Bunte find that bilateral lending, like BITs, operates according to a hierarchical logic. Footnote 89 Even in complex networks, actors often adhere to simple rules of tie formation, such as preferential attachment or homophily, which in turn yield observable structural properties. Footnote 90 Thus, while the array of issues on which governments can plausibly cooperate is large, the goals and strategies that governments implement when building their portfolios are likely much less diverse.
At a more general level, our results suggest potential answers to the question of why and how bilateral agreements have proliferated across the post-Cold War global landscape. One argument maintains that such agreements are largely demonstrative, allowing leaders—particularly democratic leaders—to claim credit for successfully completing an international negotiation. Footnote 91 That logic is difficult to sustain for BITs and DCAs, whose dramatic rise went unnoticed by mass publics. Instead, both BITs and DCAs emerged as efficient solutions to new problems. Among other benefits, BITs provided an immediate solution to the absence of institutionalized processes in resolving investor-government disputes at a time when foreign direct investment increased dramatically. Similarly, DCAs responded to the need for flexibility and partner-specific defense arrangements in a security environment characterized by nontraditional threats and great strategic uncertainty. Other forms of bilateral cooperation—from trade to human rights to the environment Footnote 92 —exhibit similar issue-specific motivations. And yet, our analysis shows that even if a government’s initial motivations in pursuing bilateralism are limited to a given issue area, as bilateral cooperative arrangements densify and grow increasingly complex, they create avenues of network spillover that may not have been foreseen even by the governments that originally created them. As a result, the trend towards bilateralism does not necessarily create complementary networks.
Supplementary material
The supplementary material for this article can be found at https://doi.org/10.1017/bap.2023.42.


 Open access