


1. Introduction
Granulites serve as a window into the deep crust by being exposed in high-grade regional metamorphic terranes. They thus play a critical role in constraining theories of crustal processes and evolution. Understanding granulites not only enables us to set limits on the nature and makeup of the lower crust of the existing continents, but it also provides insight into the dynamic tectonic and chemical processes that result in the accumulation and eventual stabilization of the changing aspects of the current crust, which in turn supports continental growth.
The principal objective of this research is to study the complex tectono-metamorphic evolution of the Mg-Al granulite, encompassing petrology, mineral chemistry, geochronology and geochemical characteristics. Using mineral chemistry data and employing various thermobarometric techniques and software, such as winTWQ, we aim to deduce the progressive history of pressure–temperature (P-T) conditions associated with distinct metamorphic stages. Furthermore, the integration of X-ray fluorescence (XRF) data derived from whole rock samples, interpreted through software platforms like Perple_X, is utilized to narrow down the trajectories of equilibrium phases during both peak and post-peak metamorphic phases. An additional aspect of this study involves shedding light on the broader tectonic implications and the inherent nature of the protolith. This is achieved through the examination of rare earth element (REE) and trace element data, which provide valuable insights into the geological processes that have influenced the formation and transformation of the pelitic granulite. Notably, despite the existing records of monazite geochronology (Mahanta et al. Reference Mahanta, Prakash and Kumar2024, Chatterjee et al. Reference Chatterjee, Mazumdar, Bhattacharya and Saikia2007, Reference Chatterjee, Bhattacharya, Duarah and Mazumdar2011) from other rock types in the Sonapahar region revealing a diverse spectrum of metamorphic and magmatic phenomena, the pelitic granulites have not received adequate attention in terms of geochronological investigations.
The studied Mg-Al granulites have been previously studied by Lal et al. (Reference Lal, Ackermand, Seifert and Halder1978). Revisiting and re-evaluating the P–T conditions of these rocks is crucial to understanding the metamorphic history and tectonic evolution of the region. By employing modern analytical techniques and advanced software programs such as PerpleX and WinTWQ, this study aims to provide a more accurate and comprehensive interpretation of the metamorphic conditions experienced by these granulites. Our study is the first to provide integrated results from phase equilibria modelling, geochemistry and monazite U-Pb geochronology, where we identify continental island arc protolith sources subjected to the common Neoproterozoic high to ultra-high temperature (UHT) metamorphism from the central part of this block, although previous studies have not reported UHT metamorphism from Shillong Meghalaya Gneissic Complex (SMGC) (viz., Lal et al. Reference Lal, Ackermand, Seifert and Halder1978, Chatterjee et al. Reference Chatterjee, Mazumdar, Bhattacharya and Saikia2007). Our findings offer ideas on the P-T path (prograde, peak and retrograde metamorphism) as well as the peak metamorphism timing. Our research provides additional proof of metamorphism from high to ultra-high temperatures, which is linked to the collisional assembly of the Gondwana supercontinent in the Late Neoproterozoic period.
2. Geological settings
The SMGC, a relatively less studied metamorphic terrain, is located in the northeastern region of India. This complex serves as the foundational base for several significant granulitic terrains, which need detailed scientific study. Spanning an east-west trending expanse of 40000 km2, the SMGC holds essential geological importance. The Dhansiri (Jamuna) fault runs north-south, separating it from the Indian shield (Evans Reference Evans1964 and Nandy Reference Nandy1980).
Additionally, it is suggested by Evans (Reference Evans1964) and Desikachar (Reference Desikachar1974), as well as Crawford (Reference Crawford1974), that the Chotanagpur Gneissic Complex (CGC) or the Eastern Ghats Mobile Belt (EGMB) could potentially be extensions of the SMGC in its western direction. The SMGC is composed of a complex group of rocks that includes (a) Archean to Paleoproterozoic Gneissic rocks, as reported by Bidyananda and Deomurari (Reference Bidyananda and Deomurari2007), Chatterjee et al. (Reference Chatterjee, Mazumdar, Bhattacharya and Saikia2007, Reference Chatterjee, Bhattacharya, Duarah and Mazumdar2011), and Kumar et al. (Reference Kumar, Rino, Hayasaka, Kimura, Raju, Terada and Pathak2017a); (b) Shillong Group metasediments from the Paleoproterozoic to Mesoproterozoic periods, as proposed by Mitra (Reference Mitra1998) and Bidyananda and Deomurari (Reference Bidyananda and Deomurari2007) and (c) Proterozoic to Paleozoic granitoids, characterized by igneous intrusions, as reported by Ghosh et al. (Reference Ghosh, Bhalla, Paul, Sarkar, Bishui and Gupta1991, Reference Ghosh, Chakraborty, Paul, Bhalla, Bishui and Gupta1994, Reference Ghosh, Fallick, Paul and Potts2005). According to Sengupta and Agarwal (Reference Sengupta and Agarwal1998) and Nandy (Reference Nandy2001), the SMGC is geologically surrounded by important tectonic features, such as the Rajmahal-Garo tectonic graben on its western edge, a belt of Schuppen to its eastern side, the Brahmaputra lineament to its north and the Dauki tear fault marking its southern boundary.
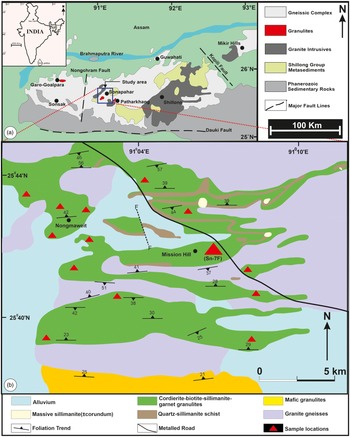
The Archean to Paleoproterozoic Gneissic Complex, commonly referred to as the Basement Gneissic Complex of the SMGC, comprises a diverse range of rock types. These include Precambrian gneisses, amphibolites, granulites (rich in garnet, cordierite and sillimanite), basic granulites, calc-silicate gneisses and a collection of granitoids. These lithologies collectively form a basement layer for the geological evolution of the region (Chatterjee et al. Reference Chatterjee, Mazumdar, Bhattacharya and Saikia2007). Overlying the Basement Gneissic Complex are the metasediments belonging to the Shillong Group. Notably, between 1862 ± 63 Ma and 497 ± 9 Ma SMGC witnessed multiple episodes of granitic emplacement, as suggested by Bidyananda and Deomurari (Reference Bidyananda and Deomurari2007), Yin et al. (Reference Yin, Dubey, Wedd, Kelty, Grove, Gehrels and Burge2010), and Kumar et al. (Reference Kumar, Pieru, Rino and Hayasaka2017a, Reference Kumar, Pieru, Rino and Hayasakab). These chronological events have contributed significantly to shaping the geological structure of the SMGC (Fig. 1a).
(a) Geological map of Shillong Meghalaya Gneissic Complex (SMGC) (modified after Dwivedi et al. Reference Dwivedi, Theunuo and Kumar2020), (b) geological map of Sonapahar (Riangdo) area of central SMGC (modified after Lal et al. Reference Lal, Ackermand, Seifert and Halder1978).

A notable geological feature that distinguishes the study area (Sonapahar) is the dominance of felsic and mafic rock granulites (Fig. 1b). According to Lal et al. (Reference Lal, Ackermand, Seifert and Halder1978) and Chatterjee et al. (Reference Chatterjee, Mazumdar, Bhattacharya and Saikia2007, Reference Chatterjee, Bhattacharya, Duarah and Mazumdar2011), this geological configuration is recognized as a key part of the Central SMGC. The primary minerals found in the felsic rock are spinel, cordierite and garnet, which are encased in a matrix of k-feldspar, plagioclase and quartz. The mafic granulite, in contrast, is abundant in minerals like orthopyroxene, clinopyroxene, biotite, sillimanite, spinel, rutile and ilmenite. The granulite facies rocks from the Sonapahar region also contain the relics of greenschist facies metapelites from the Shillong Group, as outlined by Nandy (Reference Nandy2001). According to Lal et al. (Reference Lal, Ackermand, Seifert and Halder1978), the peak metamorphic conditions experienced by the Sonapahar area are at 750°C and 5 kbar from the study of sapphirine-bearing metapelites. Neogi and Pal (Reference Neogi and Pal2021) investigated the geological history of the Sonapahar rocks, revealing a complex pattern of tectonic disturbances that the region has experienced. They established the occurrence of three separate stages of tectonic activity by analyzing the orientations of tectonic fabrics (both planar and linear) present within the rock formations. This finding gives an idea about the dynamic geological evolution of the Sonapahar area.
3. Analytical methods
3.a. Petrography
Petrographic and thin section studies were carried out using the Leica (DM 2500P) microscope at the Metamorphic Petrology Laboratory, Department of Geology at Banaras Hindu University, for comprehensive petrographic analysis. Subsequent microphotographs were also taken using the same range of microscope.
3.b. Mineral chemistry
Electron microprobe analyses and backscattered electron imaging were carried out using the CAMECA SXFive electron probe micro analyzer (EPMA) instrument in conjunction with the advanced SXFive software in the DST-SERB National Facility, Department of Geology (Center of Advanced Study), Institute of Science, Banaras Hindu University. The LEICA-EM ACE200 apparatus was used to apply a 20 nm thick carbon coating, which was administered to prepare the thin sections for their microprobe excursion. An accelerating voltage of 15 kV and a beam current of 10 nA were used with analytical precision. To establish an internal reference, the crystal positions were checked using the natural silicate mineral andradite. The routine silicate quantification process utilizes natural mineral standards, including diopside, peridot, almandine, albite and orthoclase, which are supplied by CAMECA-AMETEK. The SxSAB version 6.1 and SX-Results application from CAMECA were used to carry out regular calibration, collection, quantification and data processing. The precision of the results was below the threshold of 1% for major element oxides and 5% for trace elements.
3.c. Geothermobarometry
P-T conditions were calculated using thermodynamic data by Berman and Aranovich (Reference Berman and Aranovich1996, updated December 2006) and the internally consistent winTWQ program (Rob Berman, Reference Berman2006, version 2.32). In conventional thermobarometry, a range of methodologies have been utilized to decipher the pressure and temperature conditions that rocks have undergone. Temperature calculations were performed using the Fe-Mg exchange between garnet–cordierite and Fe-Mg exchange between garnet–biotite thermometers as described by Bhattacharya et al. (Reference Bhattacharya, Mohanty, Maji, Sen and Raith1992) and Thompson (Reference Thompson1976). In contrast, garnet–sillimanite–plagioclase–quartz and garnet–cordierite–sillimanite–quartz have been taken into consideration for barometer calculations.
3.d. Whole-rock geochemistry (XRF) and phase equilibria modelling
The complex mineral phase equilibria computations were made possible by the XRF data. The Perple_X program (version 6.9.1) was used to carry out these computations (Connolly, Reference Connolly2005 and Connolly, Reference Connolly2009). The model system, MnNCKFMASHTO (MnO-Na2O–CaO–K2O–FeO–MgO–Al2O3–SiO2–H2O–TiO2–Fe2O3), was used to address the complexities of the system under study. Based on the observed mineral assemblage, an extensive range of solution models has been considered while preparing the P-T pseudosection. These models include Gt(W) for garnet (White et al. Reference White, Powell, Holland, Johnson and Green2014), Crd(W) for cordierite (White et al. Reference White, Powell, Holland, Johnson and Green2014), Bi(W) for biotite (White et al. Reference White, Powell, Holland, Johnson and Green2014), the ternary model “feldspar_B” for feldspar (Benisek et al. Reference Benisek, Dachs and Kroll2010), Sp(WPC) for spinel (White et al. Reference White, Powell and Clarke2002), St(W) for staurolite (White et al. Reference White, Powell, Holland, Johnson and Green2014), Ilm(DS6) for ilmenite (Holland and Powell, Reference Holland and Powell2011), Mica(W) for mica (White et al. Reference White, Powell, Holland, Johnson and Green2014) and melt(W) for melt phases (White et al. Reference White, Powell, Holland, Johnson and Green2014). The thermodynamic dataset, by Holland and Powell in Reference Holland and Powell1998, subsequently revised in 2011, was employed.
The Siemens SRS-3000 WD-XRF instrument was used for the XRF analysis at the Birbal Sahni Institute of Palaeosciences (BSIP) in Lucknow, India. Several standards are used, including BHVO-2, BCR2, BIR-1a, JA2, JGb-1, JGb-2, MBH and others. For the pseudosection modelling, the bulk rock data sample which is near to the average of all the twenty samples (Sn-7F, 1–20) from the XRF analysis was used (Table. 3). However, the quantification of the presence of H2O was facilitated by the utilization of the loss of ignition (LOI) value. The O2 value was derived by preparing a T-X(Fe3+) diagram and recalculating the XRF bulk rock data using the recalc-for-PerpleX datasheet.
3.e. Whole rock geochemistry (ICPMS)
Twenty representative samples from different parts of outcrop Sn-7F (Sn-7F/1 to Sn-7F/20) were selected for analysis of whole-rock geochemical data (trace elements and REE) at the Birbal Sahni Institute of Palaeosciences, Lucknow, India. Homogenized samples were ground to a size of around 200 mesh in an agate mortar. The powdered samples were completely mixed with hydrogen borate powder in the desired proportion before being formed into pressed pellets using a motorized press (Kameyo Delta TP02). Agilent 7700 ICP-MS technology was used to assess the trace element as well as REE content in the samples. The ASTM D6357-11 method was used to break down the materials. Before ICP-MS elemental analysis, and samples are digested using trace element acids such as hydrofluoric (HF), nitric acid (HNO3) and hydrochloric acid (HCl). In addition to certain internal standards, several standards from the USGS and the Wadia Institute of Himalayan Geology, India (including BCR2, BHVO-2, BIR-1a, SL-1 and MBH) were used for calibration. With a muffle furnace, the LOI was determined.
3.f. K-Ar dating
Biotite grains from the symplectitic textural location of the Mg-Al granulite sample Sn-7F have been studied using an efficient K-Ar isotopic analysis approach, as described by Solé in 2014. The analysis was carried out at the Instituto de Geología, Universidad Nacional Autónoma de México, Mexico.
3.g. Monazite chemical dating
The monazite chemical dating was accomplished by examining the prominent subhedral to anhedral grains of monazite using the EPMA CAMECA SX-Five instrument facilities at the Department of Geology (Centre of Advance Study), Institute of Science, Banaras Hindu University. We used the most recent analytical method for U-Th-Pb monazite dating, by Pandey et al. (Reference Pandey, Pandit, Arora, Rao and Pant2019). The polished thin section of representative sample Sn-7F was coated with a fine layer (20 nm) of carbon using the LEICA-EM ACE 200 carbon coating device. A LaB6 generator in an electron cannon is used to produce an electron beam at an operating voltage of 15 kV at 200 nA.
4. Results
4.a. Petrography
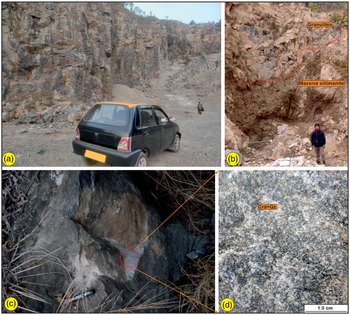
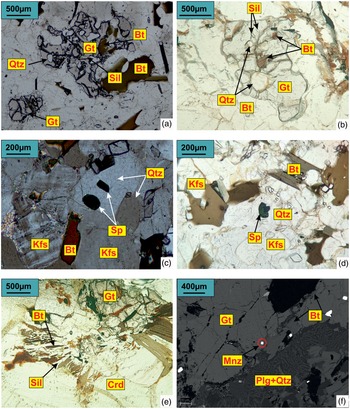
Representative samples of Mg-Al granulite were collected from exposures in road cuttings or stone quarries around Sonapahar village (refer to Fig 2). The distinguishing characteristics of the Mg-Al granulite in the study area are marked by its fine-grained texture (Fig. 2c). The rock is primarily composed of garnet (5%–10%), cordierite (20%–30%), quartz (10%–15%), plagioclase (8%–11%) and K-feldspar (3%–6%), with minor ilmenite (< 1%), spinel (2%–4%), opaques (1%–2%), biotite (5%–10%) and fine-grained sillimanite (1%). The presence of rutile is very scarce, mainly found in two or three places in the thin section. Garnet occurs as porphyroblast structures that contain inclusions of biotite, sillimanite and quartz, and it does not exhibit any distinct compositional zoning (Fig. 3, a–b). The spinel present in the rock displays well-defined grain boundaries that it shares with quartz (Fig. 3, c–d). Cordierite on the other hand occurs as medium- to coarse-grained poikiloblasts becoming the most abundant ground mass mostly associated with feldspar. The feldspar grains tend to be of medium to large size (1–4 mm) and commonly serve as hosts for biotite and sillimanite inclusions (Fig. 3, b–c). Sillimanite is densely intergrown with biotite, resembling needle-like or fibrolitic structures. The majority of the time, these sillimanite needles are discovered inside cordierite porphyroblasts and associated with biotite flakes. Garnet porphyroblasts, as seen in the matrix, and one in symplectite textures are frequently found next to cordierite or with sillimanite inclusions. The presence of a symplectite structure consisting of biotite, sillimanite and quartz with decomposed garnet (Fig. 3, e–f).
(a) Field photograph showing the exposure of MG-Al granulite in a rock quarry, (b) photograph showing contact between Mg-Al granulite and massive sillimanite in a sillimanite mine, (c) photograph showing the Mg-Al granulite, (d) close view of Mg-Al granulite showing quartz and cordierite association.

Photomicrographs of the representative sample in plane polarised light showing the evidence of prograde (a-b), peak (c-d) and retrograde (e-f) stages of ultra-high temperature metamorphism.

4.b. Mineral Chemistry
4.b.1. Garnet
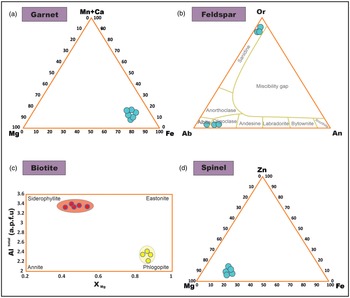
The evaluated garnet samples exhibit XMg value, ranging from 0.14 to 0.16, signifying a solid solution between almandine and pyrope end-members. The Al content within the garnet samples measures approximately 1.9 a.p.f.u. (Table. 1). To represent these garnet compositions, a triangular diagram was constructed, depicting the relationship between end members (Ca+Mn):Mg: Fe (Fig. 4a).
Representative analyses of garnet (12 oxygen basis) and cordierite (18 oxygen basis)

XMg = Mg/(Mg+Fe), C = Core, M = mantle R = rim.
(a) Triangular plot of garnet showing Fe-rich (almandine) composition, (b) triangular plot of feldspar showing a higher concentration of sanidine and oligoclase composition, (c) XMg vs Altotal plot showing the composition of biotite, (d) triangular plot showing the composition of spinel.

4.b.2. Cordierite
The XMg values attributed to cordierite range from 0.69 to 0.72, thus indicating a substantial magnesium content. Certain data points in cordierite show slightly lowered totals (97%), a phenomenon that can be attributed to the possible presence of H2O and/or CO2, as reported by Hörmann et al. (Reference Hörmann, Raith, Raase, Ackermand and Seifert1980) and Lonker (Reference Lonker1981). Zoning variations are not prominent in these samples. Negligible quantities of Na2O are detected, with values reaching up to 0.18 wt% and 0.37 wt%, respectively. Conversely, K2O remains below the limit of detection (Table. 1).
4.b.3. Feldspar
The compositions of feldspar were shown on a triangular diagram involving the end-members An, Or and Ab (Fig. 4b). Examination of alkali feldspar plots confirms the presence of orthoclase. The An-Ab solid solution indicates that the plagioclase belongs to the albite-oligoclase composition range. The XK [=K/(Ca + Na + K)] values range from 0.863 to 0.890, and the highest anorthite content extends up to 0.22. Iron, calculated as FeO, is mostly below detectable levels, barring one exception. The same trend holds for TiO2, MnO and MgO. Cr2O3 content spans from 0.2 to 0.3 wt% (Table 2).
Representative analyses of Biotite (24 oxygen basis), feldspar (8 oxygen basis) and spinel (24 oxygen basis)

XMg = Mg/(Mg+Fe), XFe = Fe/(Fe+Mg), G = groundmass, I = inclusion, S = symplectite, C = Core, M = mantle.
4.b.4. Biotite
Variability in XMg values is observed across intermediate biotite samples, ranging from 0.37 to 0.54, whereas for Mg-rich biotite (i.e. phlogopite), it is around 0.80. The Ti content within biotite samples shows variations from 0.22 to 1.24. Al content within biotite falls within the range of 2.84 to 3.32 (Table. 2). The composition of biotite (inclusions and symplectites) is shown using XMg vs Altotal (Fig. 4c). Biotite, which is associated with symplectite texture, is mostly Mg-rich in nature, whereas intermediate biotite is found to occur in almost all textural positions.
4.b.5. Spinel
The spinel present in the analysed sample predominantly constitutes a solid solution between spinel and hercynite, with XMg values ranging from 0.22 to 0.27 (Table. 2). The spinel composition concerning Zn, Fe and Mg content as end members is shown in Fig. 4d.
4.b.6. Sillimanite
The majority of the observed sillimanite grains were present as inclusions. They show significant levels of FeO, occasionally reaching up to 0.4 wt%. Except for one, Cr2O3 content ranges between 0.3 and 0.4 wt%. MnO and MgO remain undetectable, while the average TiO2 content is around 0.2 wt%.
4.c. P-T pseudosection modelling
The application of XRF analysis to average bulk rock data has played an essential role in determining invaluable insights into the mineralogical composition of representative rock samples. The sample Sn-7F has shown a diverse range of minerals, from garnet, cordierite and K-feldspar to plagioclase, biotite, sillimanite, spinel and quartz. The analytical yielded weight percentages corresponding to a range of oxides, including Na2O, MgO, Al2O3, SiO2, K2O, CaO, TiO2, MnO, FeOt and LOI (Table. 3). We have considered the sample (Sn-7F/7) containing bulk rock composition near the mean of 20 samples from Sn-7F for constructing the pseudosection. The bulk rock data used for the pseudosection modelling in molar amount are (Na2O – 1.15, MgO – 8.40, Al2O3 – 10.44, SiO2 – 66.00, K2O – 2.34, CaO – 0.74, TiO2 – 0.54, MnO – 0.09, FeOt – 6.50, H2O – 3.15 and O2 – 0.65). The O2 value has been estimated using a T-X(Fe3+) plot (Fig. S1; in the online Supplementary Material available at http://journals.cambridge.org/geo). The pressure (P) and temperature (T) considered in these computations spanned 5–11 kbar and 700–1100 °C, respectively. An important part of these calculations was the incorporation of titanium (Ti), given its profound influence on the stability of biotite. The result of these calculations emerged in the form of pseudosection and provided a thorough understanding of the stability of mineral assemblages under various pressure-temperature (P-T) conditions. The stability fields were represented using various colours to indicate different variance levels (Fig. 5a).
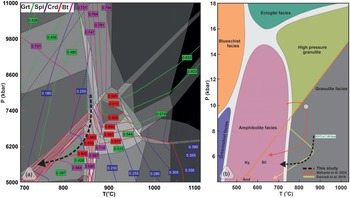
(a) P-T pseudosection calculated for the spinel + quartz bearing Mg-Al bearing granulite in the model system MnO-Na2O-CaO-K2O-FeO-MgO-Al2O3-SiO2-H2O-TiO2-Fe2O3 (MnNCKFMASHTO), b) distribution of the calculated modal isopleths of different minerals for the calculated pseudosection: biotite (Bt), cordierite (Crd), spinel (Spl) and garnet (Grt).

The pseudosection was further contoured with model proportions of garnet, biotite, spinel and cordierite. This shows the dynamic shifts in the proportions of these minerals with respect to temperature. The proportions of garnet and spinel exhibited a direct correlation with temperature. Cordierite growth in modal abundances with the decrease in pressure, whereas biotite growth proportional to decrease in temperature describes the formation of symplectite in the retrograde phase (Fig. 5b).
The delineation of the peak mineral assemblage is based on the petrographical evidence with a temperature estimate of 870°C (HT) at 7.8 kbar, as represented in Fig. 6a (blue dashed line). The peak metamorphic assemblage is characterized by the presence of spinel, biotite, garnet, sillimanite, feldspar, and quartz. Whereas the retrogradational trajectory of the granulites is based upon the implementation of compositional isopleths of XMg garnet, XMg biotite, XMg cordierite, and XMg spinel (Fig. 6a). According to the models and petrological evidence, XMg in garnet and biotite matches for the retrograde P-T estimates mostly demonstrate cooling (+ minor decompression) of the studied sample from 850°C, maybe somewhere between 6 and 8 kbar. Prograde sillimanite in garnet may have grown at these pressures at slightly lower T.
(a) Distribution of the calculated XMg [= Mg/ (Mg+ Fe)] isopleths for biotite, cordierite, spinel and garnet for the calculated pseudosection. The inferred cooling (+ minor decompression) P–T path is indicated by a black arrow and (b) comparison of metamorphic P-T evolution path from Sonapahar, SMGC. Metamorphic boundaries displayed in the background are modified after Vernon and Clarke (Reference Vernon and Clarke2008).

The stability of biotite across the compositional range was maintained, yet its XMg values exhibited variation in the matrix due to re-equilibration at lower temperatures. This pseudosection further gives the retrograde mineral assemblage at around 700°C at 5.50 kbar.
The constructed pseudosection reveals a minor pressure drop of less than 2.0 kbar with a rapid temperature change, demonstrating cooling (+ minor decompression). In concurrence with textural data, this calculation helps in the reconstruction of the P-T path that the rock had traversed, uncovering a clockwise P-T evolutionary trajectory (Fig. 6a). Comparison of P-T trajectories from this study with the earlier reported path from the Sonapahar area is shown figure 6b.
4.d. Geothermobarometry
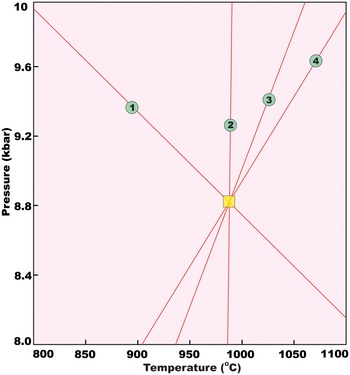
The foundation of the P-T calculation in the winTWQ computer program lies in the intersection of four distinct reactions within the P-T space. The thermodynamic data by Berman & Aranovich (Reference Berman and Aranovich1996, updated December 2006) are utilized in the winTWQ program. This dataset encompasses information about the end-member phases. Central to the winTWQ calculation are the end-member phases, each representing a distinct mineral composition. These include spinel, almandine, pyrope, cordierite, sillimanite, ilmenite, and beta-quartz. These minerals form the basis upon which the P-T conditions of the sample are inferred. These equilibria, which are formulated based on the selected end-member phases, reveal the geological evolution of the granulite. Each equilibrium compresses a unique mineralogical composition and offers a window into the conditions under which these minerals coexisted and transformed (Table. 4). Upon performing the calculations within the winTWQ program, a specific P-T condition emerged as the peak condition for the studied sample. The results indicate temperatures exceeding 950°C and pressures of approximately 8.8 kbar (Fig. 7).
Whole rock geochemistry of the pelitic granulite, major oxide (wt %), trace element and REE (ppm) (Sn-7F)

P-T calculation at peak stage using winTWQ (version 2.34) program

Results of the simultaneous calculations of pressure (P) and temperature (T) obtained using the winTWQ program.

The utilization of different conventional thermometers and barometers has yielded a range of outcomes (Table 5). By employing thermometric models such as those formulated by Vielzeuf (Reference Vielzeuf1983) and Perchuk (Reference Perchuk1991), based on the cordierite-spinel pair, temperature determinations have ranged from 850°C to 890°C and 879°C to 910°C, respectively. In the case of garnet–biotite pairs in the prograde stage, thermometer models, viz., Thompson (Reference Thompson1976), Ferry & Spear (Reference Ferry and Spear1978), Hodges & Spear (Reference Hodges and Spear1982), Pigage & Greenwood (Reference Pigage and Greenwood1982), Ganguly & Saxena (Reference Ganguly and Saxena1984), and Williams & Grambling (Reference Williams and Grambling1990), have yielded a broader range of temperatures, from 874°C to 1042°C. In the geobarometric models of Vielzeuf (Reference Vielzeuf1983) and Perchuk (Reference Perchuk1991), utilizing the peak assemblage spinel-cordierite-quartz gives a pressure range between 8.5 and 9.8 kbar. We have also utilized barometric models of Wells (Reference Wells1979), Aranovich and Podlesskii (Reference Aranovich and Podlesskii1983, Reference Aranovich and Podlesskii1989), and Nichols et al. (Reference Nichols, Berry and Green1992) based on mineral assemblage Garnet–Cordierite–Sillimanite–Quartz and give us pressure in the range of 6.6 to 7.6 kbar. This divergence in pressure and temperature outputs across different conventional thermobarometric models is because of the distinct thermodynamic datasets that each model includes in its calculations.
Average temperature and pressure obtained using different geothermobarometer

4.e. Whole-rock geochemistry
Table 3 contains the major and trace element data for representative metapelite samples. Except for sample S2, which has noticeably higher SiO2 (64.20 wt%) and MgO (6.46 wt%) contents, the samples have comparable SiO2 (61.04–63.56 wt%) and MgO (5.31–7.99 wt%) contents. With A/CNK (CaO + Na2O + K2O) values of 1.64–3.08 and high levels of Al2O3 (15.28–17.11 wt%), all samples are peraluminous. Fe2O3 (6.37–7.06 wt%), FeO (0.71–0.78 wt%), CaO (0.85-0.18 wt%), and Na2O (0.28–1.21 wt%) concentrations vary in the samples, whereas the concentration of K2O (2.04–2.98 wt%) remains in close approximation. The samples contain Mg# values between 22.60 and 40.00 (Mg# = 100 MgO/[MgO + FeO]). The samples are notably K2O-rich and Na2O-poor, with K2O/Na2O > 1.0 (1.56–8.22), showing that K-rich minerals are present in large amounts.
To understand the development of any geological region, it is essential to analyse its elemental composition at its current state. Metamorphic recrystallization is typically observed in closed systems due to diffusion-controlled chemical reactions in solid materials. To resolve this, we can correlate the levels of trace elements and REE in metamorphosed rocks with those found in chondrites and the primitive mantle. Figure 8a presents the rare earth elements (REEs) normalized to chondrites to offset the Oddo-Harkins effect. For the most part, the chondrite-normalized REEs display a smooth trend in both the light rare earth elements (LREE) and heavy rare earth elements (HREE) groups, except for Europium (Eu). Besides samples S4 and S5, other samples show varied REE concentrations (279.17–366.06 ppm), fractionated REE patterns with (La/Yb)N = 4.12–11.59 and negative Eu anomalies (Eu/Eu* = 0.37–0.98). The negative Eu anomaly is attributed to the early formation of plagioclase, as Eu2+ takes the place of Ca2+ in this feldspar. This peculiar anomaly may be linked to a reducing environment. Moreover, the cerium (Ce) anomaly is notably absent, as the graph illustrates a consistent increase in Ce content across all the samples. The range of the LREE/HREE ratios is 3.45 to 4.94. Furthermore, no correlations between REE levels and K2O or Al2O3 are seen, suggesting that the host minerals for REEs are probably accessory minerals rather than clay minerals (Gromet et al. Reference Gromet, Dymek, Haskin and Korotev1984; Bhat and Ghosh, Reference Bhat and Ghosh2001). All samples are similar to the typical upper continental crust (UCC; Taylor and McLennan, Reference Taylor and McLennan1995) in terms of their moderately fractionated chondrite-normalized REE patterns (Fig. 10a). The presence of LREE enrichment and negative Eu anomalies in metapelites are distinctive characteristics indicative of continental crust origins.
(a) Chondrite-normalised REE pattern for the pelitic granulites; (b) multi-element spider diagram normalized by the primitive mantle.

The multi-element primitive mantle pattern (spider diagram) (Fig. 8b) provides insights into the characteristics of source rock before metamorphism. In sedimentary contexts, the distribution of REEs serves as a highly accurate indicator of their origin (Taylor and McLennan. Reference Taylor and McLennan1985). In Figure 8b, we observe a notable enrichment of large-ion-lithophile elements, specifically Rb, Ba, and Pb, alongside the depletion of high-field-strength elements such as Nb and Ta. These particular geochemical signatures are indicative of primary rock sources that fall within the intermediate-felsic category (Zhao et al. Reference Zhao, Chen, Zhang, Zhang, Yang and Yan2018). Notably, the presence of a conspicuously Ti-negative peak can be attributed to the non-involvement of any magmatic and partial melting processes in the formation of protolith, which took place under conditions characterized by a low oxygen fugacity. Furthermore, to account for the presence of minerals such as rutile and ilmenite, the composition contains substantial amounts of TiO2, up to 1.00 wt.%. In primitive-mantle-normalized trace element diagrams, the samples show positive anomalies for Pb but negative anomalies for Ta, Nb, Sr, P and Ti (Fig. 10b). The negative correlation between Nb-Ta and Zr-Hf indicated that the geochemical behaviour of these two pairs of elements was identical and moderately affected by weathering and sediment deposition. Th and U show a positive association, and the Th/U ratio ranges from 9.62 to 11.90, which is much higher than the upper crust’s typical Th/U ratio of 3.8 (Taylor and McLennan, Reference Taylor and McLennan1985). This suggests that the source region has undergone moderate weathering.
The data for the samples mostly plot in the clay rock and greywacke, intermediate and alkaline volcanic-greywacke, and their overlapped areas, according to the A-C-FM ternary discrimination diagram (Fig. 9a; secondary source after Wang et al. Reference Wang, He, Chen, Zheng and Geng1987). The majority of the data were plotted in the argillaceous sedimentary rock field in the (al + fm)-(c + alk)-Si diagram (Fig. 9b; Simonen, Reference Simonen1953). The sample data are plotted in the shale, iron shale, and greywacke fields of the log (Fe2O3/K2O)-log (SiO2/Al2O3) diagram (Fig. 9c; Herron, Reference Herron1988). The shale, clay rock, and sandstone fields show the majority of the data on the La/Yb-REE plot (Fig. 9d; Gromet et al. Reference Gromet, Dymek, Haskin and Korotev1984). Thus, it can be inferred that the protoliths of the studied samples from the Sonapahar region were clay rocks and sandstones.
Classification diagrams of the samples in the Sonapahar area. (a) Ternary plot of A-C-FM (secondary source after Wang et al. Reference Wang, He, Chen, Zheng and Geng1987); (b) (al + fm)-(c + alk)-Si diagram (Simonen, Reference Simonen1953); (c) Log(Fe2O3/K2O)-Log(SiO2/Al2O3) diagram (Herron, Reference Herron1988); (d) La/Yb-ΣREE diagram (Gromet et al. Reference Gromet, Dymek, Haskin and Korotev1984).

Geochemical diagrams of the samples in the Sonapahar area. (a) Molecular proportions Al2O3-(Na2O + CaO*)-K2O triangular plot (after Fedo et al. Reference Fedo, Nesbitt and Young1995). Ka, kaolinite; Gi, gibbsite; Chl, chlorite; Sm, smectite; Il, illite; Pl, plagioclase; Kfs, K-feldspar; (b) plot of Th/Sc versus Zr/Sc (McLennan, Reference McLennan1993); (c) Al-Ti-Zr triangular diagram. The solid contour encloses the compositions observed in clastic sediments; CAS represents the field of calc-alkaline suites; SPG represents the field of strongly peraluminous granites (after Garcia et al. Reference Garcia, Fonteilles and Moutte1994); (d) La/Th-Hf source rock discrimination diagram (Floyd and Leveridge, Reference Floyd and Leveridge1987); (e) K2O-Rb provenance discrimination diagram (after Floyd and Leveridge, Reference Floyd and Leveridge1987); (f-g) tectonic discrimination diagrams of samples in the Liumao area (after Bhatia and Crook, Reference Bhatia and Crook1986). Ternary diagrams of La-Th-Sc (f) and Th-Sc-Zr/10 (g). PM = passive margin; ACM = active continental margin; CIA = continental island arc; OIA = oceanic island arc.

4.f. Weathering of the source area and sediment sorting
According to (McLennan Reference McLennan1993; Panahi et al. Reference Panahi, Young and Rainbird2000), the chemical index of alteration (CIA), first suggested by Nesbitt and Young (Reference Nesbitt and Young1982), is computed as CIA = Al2O3/[Al2O3 + CaO* + Na2O + K2O] 100 (in molar proportions). CaO* is the CaO linked with the silicate percentage of the sample. This metric has been used extensively to gauge the severity of source weathering. Indicating a reasonably high level of weathering, the CIA values of the examined samples range from 75.86 to 84.46 (average = 80.63).
The K2O/Na2O and SiO2/Al2O3 ratios can frequently be used to determine the degree of weathering and age of source rock (Roser and Korsch, Reference Roser and Korsch1986; Wei et al. Reference Wei, Yu, Wang and Shu2009). The K2O/Na2O ratios of the samples under study range from 0.63 to 8.22 (average: 3.90), indicating that K was retained in the protolith deposits while Na was lost due to weathering and leaching. The SiO2/Al2O3 ratios of the examined samples range from 2.24 to 4.61 (average = 3.26), indicating that the protolith sediments were deposited close to the source and had a low degree of maturity. The index of compositional variability (ICV = [Na2O + K2O + CaO + MgO + MnO + Fe2O3t + TiO2]/Al2O3) determines the amount of alumina relative to other major cations and the compositional maturity of a rock or mineral (Cox et al. Reference Cox, Lowe and Cullers1995; Van de Kamp and Leake, Reference Van de Kamp and Leake1985; Weaver, Reference Weaver1989). The majority of the samples under examination have an average ICV of 1.29 (1.09–1.68), suggesting that they may have originated from a tectonically active environment.
The degree of weathering of the studied samples is significantly higher than that of typical shales, as shown in the Al2O3-(CaO* + Na2O)-K2O ternary diagram (Fig. 10a; Fedo et al. Reference Fedo, Nesbitt and Young1995), indicating that plagioclase was weathered into clay minerals (LaMaskin et al. Reference LaMaskin, Dorsey and Vervoort2008). Most data plots around the top crustal field in the Th/Sc-Zr/Sc diagram (Fig. 10b; McLennan, Reference McLennan1993) depict the degree of sedimentary sorting and recycling (Asiedu et al. Reference Asiedu, Suzuki, Nogami and Shibata2000). According to Li et al. (Reference Li, Liu, Han, Zhang and Chu2005), recycled sediments show a greater rise in Zr/Sc than Th/Sc, indicating that they are directly derived from igneous rocks. The relationship between Th and Zr (Fig. 10b) indicates that neither Th nor Zr was extremely mobile during metamorphism (McLennan, Reference McLennan1993; Yang et al. Reference Yang, Kyser and Ansdell1998). Sorting processes can be seen in an Al-Ti-Zr ternary graphic. While sediments with a small range of TiO2-Zr values suggest immature compositions, sediments with a large range of values show better compositional maturity (Garcia et al. Reference Garcia, Fonteilles and Moutte1994). With a few notable outliers, the limited range of TiO2-Zr values in the analyzed samples suggests poor sorting and rapid sediment deposition (Fig. 10c).
4.g. Provenance and depositional settings
The original compositions of the source rocks can also be constrained using the Al2O3-(CaO* + Na2O)-K2O ternary diagram (Fig. 10a; Fedo et al. Reference Fedo, Nesbitt and Young1995). Since the weathering trajectories for the sedimentary rocks are parallel to the A-CN line, it is possible to deduce the source composition by extending the data backwards to the feldspar junction (Nesbitt and Young, Reference Nesbitt and Young1984, Reference Nesbitt and Young1989). The majority of the studied samples form an array that intersects the feldspar join at a point that suggests the source had a plagioclase: K-feldspar ratio of less than 3:1, a characteristic commonly found in granite and A-type granite. It appears that some samples (Fig. 10a; Fedo et al. Reference Fedo, Nesbitt and Young1995) are weathering products of granodiorite and tonalite.
The La/Th-Hf plot and discrimination diagrams for sandstone and mudstone are more accurate indicators of the source lithology for clastic deposits (Fig. 10d; Floyd and Leveridge, Reference Floyd and Leveridge1987; Roser and Korsch, Reference Roser and Korsch1988). The majority of the results show correlations with a felsic provenance and a tendency towards older sediment components in the analyzed samples. Data for nearly all samples plot in the intermediate-acid area of the Rb-K2O plot (Floyd and Leveridge, Reference Floyd and Leveridge1987) (Fig. 10e). This shows that the samples being studied had a lithology that was predominately composed of felsic source rocks.
Immobile trace elements such as Th, Sc, Zr, and La are stable and insoluble, making them useful for provenance investigations (Bhatia, Reference Bhatia1984; Bhatia and Crook, Reference Bhatia and Crook1986). The most helpful plots for tectonic discrimination (Bhatia and Crook, Reference Bhatia and Crook1986) employ the immobile trace elements La-Th-Sc and Th-Sc-Zr/10. The data for all sample plot within the field of the continental island arc (Fig. 10f and 10g).
The binary plot relating K/Rb and Rb/Sr ratios (Fig. 11a) (Abdel-Rahman and El-Kibbi Reference Abdel-Rahman and El-Kibbi2001) serves as a tectonic discrimination diagram, elucidating the orogenic aspects of the tectonic evolution. Beyond these geochemical parameters, the SiO2/ Rb/Zr ratio plot (Fig. 11b) by Harris et al. (Reference Harris, Pearce and Tindle1986) illustrates magmatic processes following a collision. The majority of sediment samples are positioned within the oceanic island arc (Field A) with some contributions from continental island arcs (Field B). This finding is supported by Figure 11c, where the La/Th ratio exceeds one for all plotted samples, aligning with the tectonic environments detailed in Bhatia (Reference Bhatia1983 and Reference Bhatia1985) and Bhatia and Crook (Reference Bhatia and Crook1986). Examining Table 4, the compositional estimates for the studied area align with those proposed by McLennan et al. (Reference McLennan, Nance and Taylor1980) and Taylor & McLennan (Reference Taylor and McLennan1985), highlighting their resemblance to Proterozoic sedimentary rock.
(a) K/Rb vs. Rb/Sr discrimination diagram for orogenic and anorogenic processes; (b) SiO2 vs. Rb/Zr discrimination diagram for syn-collision, post-collision and volcanic arcs; (c) Th vs. La plot showing the dominance of the derived sediments from the passive continental margins and oceanic island arcs.

4.h. K-Ar Geochronology
Fundamentally, K-Ar dating is based on the natural decay process of the potassium isotope 40K, which transforms into the argon isotope 40Ar. The “age” deduced through K-Ar techniques essentially reflects the time passed since the formation of radiogenic argon by the decay of 40K, and its subsequent entrapment within minerals or rocks. This chronometric insight can offer valuable information about cooling events related to the exhumation of metamorphic rock, a phenomenon (Kelley Reference Kelley2002).
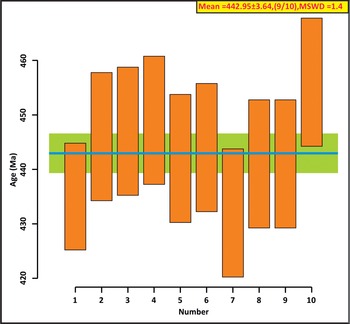
The K-Ar ages of biotite obtained from the symplectite of Mg-Al granulite range from 432 to 456 Ma with ±1 sd. The comprehensive analytical data are detailed in Table 6. Notably, the isotopic data derived from biotite grains indicate an early Devonian metamorphic cooling event for the Sonapahar region. This significant event is dated at approximately weighted mean age 442.95 ± 3.64 Ma, as described in both Fig. 12 and Table 5.
Age calculations with Ω = 0.492. Each age corresponds to a single biotite ablation with the following laser parameters: 50 Hz, 50 pulses by run, 6 runs per analysis (300 pulses in total), 70 μm diameter, 20–25 μm depth, fluence 3.5 J/cm2

The weighted average of mean ages from biotite in the sample (Sn-7F).

4.i. Monazite Geochronology
Following systematic electron microprobe-backscatter electron (EPMA-BSE) imaging, sample (Sn-7F) with monazites having a uniform mineral composition and grain sizes ranging from 50 to 150 microns is selected for microprobe dating (Fig. 13). In the BSE pictures, the monazite grains exhibit uniform compositional zones. Monazite grains come in a variety of shapes, including anhedral, subhedral and spherical, and range in size from tiny (30–80 micrometres) to big (80–150 micrometres). They can be found in garnet’s matrix and as inclusions. Monazite grains, which are found in garnet porphyroblasts, show a comparable yttrium (Y) structure from the rim to the core. The partitioning of Y in monazite is closely connected to the growth or consumption of peritectic garnet (Spear & Pyle, Reference Spear and Pyle2010; Bhowmik et al. Reference Bhowmik, Wilde, Bhandari and Basu2014). The variation in the Y values in Table 6 corresponds to different monazite grains and links to different textural positions.
Representative BSE image of monazite grains from sample Sn-7F.

The data acquired after following conventional techniques for systematic EPMA dating demonstrate two unique sets of ages. Table 7 shows that the calculated ages correspond to 623 Ma–744 Ma and 1428 Ma–1637 Ma with ±2sd. Based on the data of the monazite grains, a recent metamorphic event in the Sonapahar area has been dated at a weighted mean age of 682.20 ± 28 Ma, whereas the inherited weighted mean age is considered around 1527.4 ± 38 Ma (Fig. 14). Figure 14a shows the probability density peaks of monazite ages from several spot sites. The plot (Fig. 14b) aids in restricting a probable age of the metamorphic event, as well as the graphical distribution of all estimated ages taking into account their error values. The results obtained from the monazite geochronology in this study indicate that the existing structure of the granulite in the Sonapahar region is the result of extensive reworking during the Neo-Proterozoic (682.20 ± 28 Ma) tectonothermal event.
EPMA dating age of monazite crystal of the studied rock (Sn-7F)

(a) Representative graphs of weighted average of the distributions showing a mean age of 1527 Ma for the old thermal event; (b) representative graphs of weighted average of the distributions showing a mean age of 682 Ma for the thermal reworking event; (c) representative graph, combinedly showing the probability density plot of two thermal events.

5. Discussion
The results of this study provide light on the metamorphic evolution of the Mg-Al granulite found in Sonapahar, SMGC. A thorough understanding of the geological history is established using an extensive approach that includes petrographic investigation, mineral chemistry, P-T pseudosection modelling, geochemistry, and geochronological estimation.
5.a. Textural relations and metamorphic reactions
In terms of petrological interpretations, the observed textures reveal crucial information about the early stages of dehydration reactions. Garnet porphyroblast containing inclusions of quartz, flaky biotite and acicular sillimanite suggests early-stage dehydration reactions during the prograde stage. This is demonstrated by the presence of garnet porphyroblast (Fig. 3a and 3b). The prograde reaction is marked by the following reactions:
Biotite + Sillimanite + Quartz → Garnet + H2O
Biotite + Sillimanite + Quartz ± Plagioclase → Garnet + K-feldspar + Melt ± Ilmenite
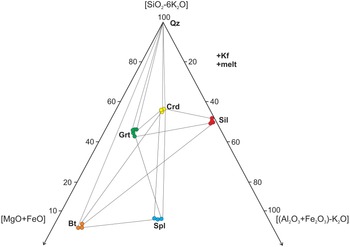
In the [SiO2-6K2O]-[MgO+FeO]-[(Al2O3+Cr2O3+Fe2O3)-K2O] diagram (Fig. 15), within the three-phase field of biotite–sillimanite–quartz, the analyzed garnet composition substantiates the aforementioned reactions. These reactions depict the discontinuous terminal nature of the metamorphic dehydration phase.
Phase relations shown in the (SiO2-6K2O)-(Fe-Mg)O-(Al, Fe3+, Cr2O3-K2O) for Spinel + quartz bearing granulites (modified after Prakash et al. Reference Prakash, Patel, Yadav, Vishal, Tewari, Yadav, Rai and Singh2020).

In the peak metamorphic stage, the combination of spinel and quartz alongside sillimanite assumes significant importance. This assemblage may form through a process wherein sillimanite and garnet are consumed to form spinel and quartz. For an assemblage to be categorized as UHT, it must exhibit spinel and quartz in direct contact (Zhang et al. Reference Zhang, Li, Liu, Li, Santosh and Wang2012). Although Qz + Sp is often found in UHT terranes and may be suggestive of UHT conditions, its presence alone should probably not be used as a diagnostic indicator of UHT conditions, as the stability of spinel is strongly affected by minor components such as Zn and Cr (Kelsey and Hand, Reference Kelsey and Hand2015 Harley, Reference Harley2020). This distinctive reaction texture is frequently observed in our samples (as shown in Fig. 3c and 3d). Therefore, the fundamental reaction used to infer peak metamorphism in the studied rock is
Sillimanite + Garnet → Spinel + Quartz
The presence of a symplectite structure consisting of biotite along with associated sillimanite and quartz suggests a probable reaction during the retrograde phase involving the transformation of garnet into secondary biotite (Fig. 3e and 3f). The conceivable reaction is
Garnet + melt → Biotite + Sillimanite + Quartz
The presence of cordierite adjacent to biotite, sillimanite and quartz symplectites in the garnet-absent zone points to additional retrograde reactions or a cooling phase.
5.b. P-T evolution
The integration of petrographic analysis with P-T pseudosection modelling and thermodynamic data implies a clockwise P-T trajectory for the granulitic terrane’s evolution. This trajectory could be attributed to collisional tectonic activities resulting in crustal thickening. The P-T pseudosection approximations yielding < 2.0 kbars of decompression with rapid decrease in temperature indicate exhumation of lower crustal rocks from the granulite facies. Based on the texture of late-stage hydration reactions, the evidence suggests rapid cooling following minute decompression. The peak of metamorphic conditions is indicated by the presence of spinel and quartz exhibiting grain boundary sharing. This notion aligns well with the peak metamorphic conditions as suggested by the winTWQ software and conventional thermobarometry. These techniques converge to propose peak temperatures exceeding 900°C and pressures of around 8 kbars. Whereas in the case of pseudosection modelling observed peak mineral assemblage is found to occur at a temperature of around 870°C. Symplectite textures, a characteristic feature of imperfect or partially progressing metamorphic reactions due to decompression, also play an important role. Such textures are valuable in classifying granulite terranes and can provide insights into uplift rates. Interestingly, the rates of reaction during decompression or rapid exhumation can lead to symplectite formation, even if the deformation is not extensive. On the other hand, a slower uplift combined with significant deformation or fluid inflow could quicken reactions and cause full recrystallization upon decompression. This complex interplay of reactions, which is deduced from the order of isopleths and prograde-retrograde mineral assemblages, illustrates a clockwise metamorphic P-T trajectory for the Sonapahar region.
The P-T path derived from the granulites in this study is characterized by a clockwise trajectory. This path, indicative of initial burial followed by rapid cooling (+ minor decompression), aligns with regional tectonic processes associated with the collision and subsequent exhumation events. Dwivedi et al. (Reference Dwivedi, Theunuo and Kumar2020) also reported a similar clockwise P-T path in their study of granulites from the Sonapahar area, suggesting a coherent tectonothermal evolution across the region. Their findings documented a clockwise P-T path with normal retrograde/decompression for granulites and characterized by peak condition at ∼6 kbar – 850°C followed by normal cooling. In contrast, Mahanta et al. (Reference Mahanta, Prakash and Kumar2024) (Fig. 6b) demonstrate high-pressure conditions peaking at ∼9 kbar and temperatures reaching ∼850°C, followed by isothermal decompression for the mafic granulites.
Neo Proterozoic to Early Paleozoic metamorphism affects the Vestfold Hills (Zhao et al. Reference Zhao, Cawood, Wilde and Lu2001), Larsemann Hills (Carson et al. Reference Carson and Hand1997) and the Brattstrand Bluffs (Fitzsimons, Reference Fitzsimons1997) in the Prydz Bay area of East Antarctica. The retrograde P-T paths of these areas are relatively similar to the ones found in this study. Probably from the Paleo-Mesoproterozoic, the metapelites residing in the mid-crust at the SMGC have been subjected to heating, reaching a peak temperature of above 900°C at roughly 8.4 kb during the Pan-African collision. Similar to the Prydz Bay metapelites, the SMGC metapelites underwent decompression and cooling after reaching peak P-T. As a result, SMGC and the Prydz Bay region had a nearly identical metamorphic history that involved a collisional setting for granulite facies metamorphism during Pan-African orogeny (Chatterjee et al. Reference Chatterjee, Bhattacharya, Duarah and Mazumdar2011).
5.c. Geochemical interpretation
The analysis of whole rock data (major and trace) from the Sonapahar region suggests that the protoliths of the examined samples were clay rocks and sandstones. The TiO2-Zr values of the analysed samples indicate a limited range, suggesting poor sorting and rapid sediment deposition. This correlation points to the origin of the studied granulite through intense metamorphism in Proterozoic rocks. Geochemical parameters, including sediment chemistry variations influenced by element mobility during sediment recycling, strongly suggest that the protolith of these pelitic granulites primarily resulted from the partial melting of ancient crustal basement rocks. The contribution of trace elements from upper mantle rocks influenced the geochemical character of the investigated granulitic terrain, indicating the complex interplay of geological events in its formation.
5.d. Geochronology
Taking into account the tectonic implications involved, the combination of K-Ar isotopic age and monazite dates brings attention to the geological history of the Sonapahar Mg-Al granulite. The granulite’s journey can be traced from its peak metamorphic stage during the Pan-African thermal event (682.20 ± 28 Ma), as evidenced by monazite chemical dating. Subsequently, it underwent an upward movement towards shallower depths and experienced temperatures around 300°C at 442.95 ± 3.64 Ma. This alignment of the K-Ar age with the temperature at which biotite closes supports a consistent chronological sequence. It is suggested that the presence of an older monazite date (1527 Ma) within the studied sample might be attributed to earlier tectonothermal events, possibly retained within robust minerals like garnet.
The clockwise P-T trajectory obtained through pseudosection modelling, combined with geothermobarometric analysis, geochronology and petrographic observations, gives credibility to the hypothesis that the Sonapahar is the farthest extension of the EGMB. This interpretation is consistent with the model proposed by Crawford (Reference Crawford1974).
5.e. Tectonic implications
The monazite found in the study sample (Sn-7F), which occurs as groundmass as well as inclusions within garnet, does not exhibit any visible zoning. The monazite under study has a mean age of 682.20 ± 28 Ma and 1527.4 ± 38 Ma, which corresponds to younger and older (inherited) metamorphic ages, respectively. The majority of the earlier age records in the monazite in the SMGC may have been obliterated by this high-grade event, leaving just the most recent event to be recorded, making it plausible that it is connected to the Pan-African tectonic event that had a global impact. Regardless of their textural predominance in metapelites, monazite grains have historically provided the primary Pan-African age records (Chatterjee et al. Reference Chatterjee, Mazumdar, Bhattacharya and Saikia2007, Reference Chatterjee, Bhattacharya, Duarah and Mazumdar2011). According to Chatterjee et al. (Reference Chatterjee, Mazumdar, Bhattacharya and Saikia2007), the metapelite is of late Cambrian age and was formed by the thermal reworking of monazite in the later phase of Pan-African orogeny, which is also reported by Mahanta et al. (Reference Mahanta, Prakash and Kumar2024) from mafic rocks of Sonapahar and correlate it with the Kuunga orogeny. Comparisons of the geochronological ages noted by various researchers from various portions of the SMGC, including the monazite ages documented in this work, show that the SMGC as a whole has been impacted by many stages of deformation and its associated metamorphism.
The Pan-African event, which occurred approximately 700–500 million years ago during the Proterozoic–earliest Paleozoic era, was one of the largest orogenies in Earth’s history (Mallard & Rogers, Reference Mallard and Rogers1997). The Pan-African Orogeny refers to the geological process that occurred between 600 and 500 Ma, 650 and 550 Ma or perhaps 950 and 500 Ma, during which the Gondwana supercontinent was formed. This process involved significant tectonic and thermal activity in the Earth’s crust (Kröner and Stern, Reference Kröner, Stern, Selley, Cocks and Plimer2004; Stern, Reference Stern1994). Gondwana accretion occurred over a long period, approximately 850 to 520 million years ago (e.g., Grunow et al. Reference Grunow, Hanson and Wilson1996; Dalziel, Reference Dalziel1991). Significant accretion occurred primarily between 650 and 520 million years ago (Collins and Pisarevsky, Reference Collins and Pisarevsky2005; Meert, Reference Meert2003). Due to its extensive distribution and prolonged duration, the Pan-African event was not regarded as a singular orogeny. The process is, in fact, a lengthy orogenic cycle that entails the repeated opening and closing of enormous ocean basins, as well as the accretion and collisions of drifting continental blocks.
In this study, we have obtained a Pan-African age of 682.20 ± 28 Ma from the studied granulite. This suggests that the Pan-African event started its influence over SMGC during the Cryogenian Period. Whereas earlier literature from the study area reported a much younger age of around (ca. 570–480 Ma) from the same domain (Chatterjee et al. Reference Chatterjee, Mazumdar, Bhattacharya and Saikia2007, Mahanta et al. Reference Mahanta, Prakash and Kumar2024). Mahanta et al. (Reference Mahanta, Prakash and Kumar2024) further correlate this age with the final phase of Pan-African orogeny, i.e. Kuunga Orogeny, suggesting the possibility of the Pan-African resetting effect. This could probably be due to a pair (or more) tectono-metamorphic events that have influenced SMGC during Pan-african orogeny, which is similar to the Pan-African event reported in the EA and EAO (Liudong et al. Reference Liudong, Shi, Yanbin and Chong2018).
Moreover, during the East Gondwana assembly, the Prydz orogenic belt along the Prydz Bay to Denman Glacier along with EGMB and SMGC may represent the collision zone of this orogeny (Liudong et al. Reference Liudong, Shi, Yanbin and Chong2018). Chatterjee et al. (Reference Chatterjee, Mazumdar, Bhattacharya and Saikia2007) highlighted the western boundary of the Pan-African collision zone involving India, Australia and Antarctica. The SMGC was most likely the leading edge of an oblique collision between India and Australo-Antarctica in the Rodinia supercontinent’s reconstructed Neoproterozoic-Cambrian assembly. The SMGC exhibits several similarities with its counterparts in the Prydz Bay region of East Antarctica (Chatterjee et al., Reference Chatterjee, Mazumdar, Bhattacharya and Saikia2007), owing to the predominant of Pan-African dates and the presence of late tectonic Cambro-Ordovician-Neoproterozoic granites in the reconstructed collision setting (Fig. 16). The Pan-African suture, which crossed via Prydz Bay in Antarctica and entered India via the SMGC, might have continued north via the Sonapahar and Garo-Goalpara Hills regions.
Reconstruction of the early Neoproterozoic supercontinent showing the correlation between Greater Indian Landmass and Eastern Antarctica. SMGC – Shillong Meghalaya Gneissic Complex, CGC – Chotanagpur Gneissic Complex, NSMB – Northern Singhbhum Mobile Belt, SC – Singhbhum Craton, and EGMB – Eastern Ghats Mobile Belt. A Possible extent of the Pan-African suture through Prydz Bay and the SMGC is shown by the Dotted line (modified after Chatterjee et al. Reference Chatterjee, Mazumdar, Bhattacharya and Saikia2007).

The older monazite grain (1527 Ma) found in this study, however, may be connected to the high-grade metamorphism link between the pre-Grenvillian and Palaeoproterozoic eras. In the SMGC, widespread granite magmatism occurred between 1800 and 1400 Ma as a result of pre-Grenvillian tecnonothermal processes, which correlate to the Columbia supercontinent (Kumar et al. Reference Kumar, Rino, Hayasaka, Kimura, Raju, Terada and Pathak2017a; Yin et al. Reference Yin, Dubey, Wedd, Kelty, Grove, Gehrels and Burge2010). Notably, the older dates are quite uncommon in the Mg-Al granulites, which most likely indicates that these monazites were crystallized during or after the first cycle of deformation-metamorphism’s cooling phase. The age corresponds to ∼1.5 Ga, which may have been connected to a later stage of the Columbia supercontinent’s assembly, which is thought to have begun at ∼1.8 Ga (Li et al. Reference Li, Bogdanova, Davidson, Collins, De Waele, Ernst, Fitzsimons, Fuck, Gladkochub, Jacobs, Karlstrom, Lu, Natapov, Pease, Pisarevsky, Thrane and Vernikovsky2008; Rogers and Santosh, Reference Rogers and Santosh2002; Zhao et al. Reference Zhao, Sun, Wilde and Li2004). Coastal East Antarctica is connected to India (Greater India) in all widely recognized reconstructions (Li et al. Reference Li, Bogdanova, Davidson, Collins, De Waele, Ernst, Fitzsimons, Fuck, Gladkochub, Jacobs, Karlstrom, Lu, Natapov, Pease, Pisarevsky, Thrane and Vernikovsky2008; Rogers and Santosh, Reference Rogers and Santosh2002; Zhou et al. Reference Zhou, Kennedy, Sun, Malpas and Lesher2002), while the remainder of East Antarctica (Mawson Craton) is connected to South Australia. Thus, it is unclear, therefore, how India and coastal East Antarctica came to be connected. The Rayner–Napier Complexes have events of around 1.6 Ga in age (Kelley, Reference Kelley2002; Owada et al. Reference Owada, Baba, Läufer, Elvebold, Shiraishi and Jacobs2003), although it is unclear how these events relate to collisions or the formation of the Columbia supercontinent.
6. Conclusion
The present study delivers a multi-faceted understanding of the geological and tectonic complexities underlying the Sonapahar region. The study sheds light on the rock classifications, metamorphic processes, geochemical signatures and temporal markers that collectively contribute to a more comprehensive comprehension of the geological history of the region and its broader implications in the context of plate tectonics and continental amalgamation.
The primary findings encompass several key aspects:
1. P-T Evolutionary Path: Findings reveal a clockwise pressure-temperature (P-T) evolutionary path. This suggests an initial phase of decompression, followed by subsequent cooling processes.
2. Metamorphic Conditions: By using a variety of techniques, including traditional thermobarometry, pseudosection modeling, and the winTWQ software, the observed P-T conditions indicate high to UHT metamorphism.
3. Geochemical Rock Analysis: Major and trace element data imply that clay rocks and sandstones with a predominately felsic provenance that originated in a continental island arc environment may have been the protoliths of the metamorphic rocks in the Sonapahar area.
4. Monazite Dating and Tectonic Events: The monazite chemical dating shows the prevalence of Neo-Proterozoic metamorphic age (dated at approximately 682 million years ago) within the central region of the Sonapahar area (SMGC). This age could potentially be linked to the broader context of the Pan-African collision event between the landmasses of India and Australia-Antarctica. This collision, an essential episode during the assembly of East Gondwana, holds global significance. The preponderance of earlier monazite grain (1527 Ma) identified in this study could be linked to the final phase of the Columbia supercontinent’s formation.
Supplementary material
The supplementary material for this article can be found at https://doi.org/10.1017/S0016756824000487
Acknowledgements
Bikash Mahanta would like to thank the Department of Science and Technology (DST) for financial assistance in the form of a research fellowship (DST-INSPIRE SRF, IF-190669). Saurabh Singh also acknowledges the financial assistance received through RJP-PDF (R/SRICC/RJP-PDF/23-24/8720). We thank Dr. Roopali Yadav and Dr. J. Solé for carrying out the K-Ar dating at the Instituto de Geología, Universidad Nacional Autónoma de México. We also thank the head of the department, Department of Geology, Banaras Hindu University, for providing the necessary infrastructure and equipment to softly carry out the work. The authors would like to express their gratitude to Jonas Kaempf and an anonymous reviewer for their constructive comments and suggestions that led to substantial improvement of the manuscript. A special thanks to Jonas Kaempf for his valuable input on the construction of the P-T pseudosection.
Authors’ contributions
Bikash Mahanta: Conceptualization, resource and writing (original draft, reviewing and editing), Divya Prakash: Writing (reviewing and editing). Saurabh Singh: Software and validation, Chandra Kant Singh: validation, Manish Kumar: software and validation, Rajeev Kumar Pandey: software and validation and Suparna Tewari: software.
Financial support
This research did not receive any specific grant from funding agencies in the public, commercial or not-for-profit sectors.
Competing interests
The authors declare that they have no known competing financial interests or personal relationships that could have appeared to influence the work reported in this paper.


 Open access