





Introduction
Many studies suggest that rising inequality between places has favored the emergence of populist parties that propose other kinds of compensatory measures than the traditional political left, including protection against foreign competition, restrictions on immigration, and welfare provisions tailored to the needs of ‘natives’ while restricting access of ‘undeserving recipients’ (Adler and Ansell Reference Adler and Ansell2020; Carreras, Irepoglu Carreras, and Bowler Reference Carreras, Irepoglu Carreras and Bowler2019; Dijkstra, Poelman, and Rodríguez-Pose Reference Dijkstra, Poelman and Rodríguez-Pose2020; Patana Reference Patana2020; Schraff and Pontusson Reference Schraff and Pontusson2024). Economic grievances emerging from regional inequality are argued to drive political discontent (Ejrnæs, Jensen, Schraff et al. Reference Ejrnæs, Jensen, Schraff and Vasilopoulou2024), and especially rural places have been shown to become increasingly resentful due to a combination of cultural, economic, and representative place-based grievances (Cramer Reference Cramer2016; Hegewald and Schraff Reference Hegewald and Schraff2025; Munis Reference Munis2020).
Even though political conflict on inter-territorial inequality appears to play a crucial role in understanding salient political developments in Western democracies (e.g., Beramendi Reference Beramendi2012; Jacques, Béland, and Lecours Reference Jacques, Béland and Lecours2022), current research still has a limited understanding of how individuals form inter-territorial redistributive preferences. Does regional inequality cause economic distributive grievances, as the place-based resentment literature suggests (Cramer Reference Cramer2016; Munis Reference Munis2020)? And if so, under which conditions? The existing studies on inter-territorial redistributive preferences disagree in their answer to this question by either following a self-interested-based stream inspired by the classical political economy literature on individual income redistribution (Balcells, Fernández-Albertos, and Kuo Reference Balcells, Fernández-Albertos and Kuo2015; Beramendi Reference Beramendi2012) or an identification approach stipulating that territorial identity conditions the causal effect of self-interest (Holm and Geys Reference Holm and Geys2018; Jacques, Béland, and Lecours Reference Jacques, Béland and Lecours2022). These accounts, however, do not identify the conditions under which inter-territorial redistributive preferences become polarized across places and currently rest on a limited empirical base. Not all contexts are politically polarized around regional inequality, as inequalities often are accepted by large parts of the population and therefore continue to persist.
We address this gap by proposing a novel theoretical argument that is tested with original comparative data. Theoretically, we introduce the concepts of prospective and aspirational voting to the study of regional inequalities, as we argue that relative regional income – meaning the degree of equality shared economic growth across places – serves as a cue for voters to evaluate their individual future benefits from inter-territorial redistribution. We propose that absolute regional income, defined as a region being richer or poorer today, polarizes preferences over inter-territorial redistribution under contexts of rising inequality in relative income gains. Contexts of equality in relative income gains, however, diminish place-based polarization of redistributive preferences.
Empirically, we present a factorial survey experiment in France and Germany, where respondents are randomly exposed to different combinations of relative and absolute regional income scenarios and then are asked about their support for inter-territorial redistribution. We find that absolute regional income differences are an important determinant of preferences for inter-territorial redistribution if relative income gains are skewed to the richest areas. This effect is mainly driven by people from richer areas becoming less solidaristic as they are confronted with unequal gains steered in their direction. Absolute regional income, however, loses relevance for redistributive preferences as all regions have more similar relative income gains, demonstrating that equality in relative regional income gains can – at least partially – bridge the gap between redistributive demands across poor and rich areas. This interactive relationship between relative and absolute regional income is also found in an observational study of inter-territorial redistributive preferences across 146 regions from nine European countries, underlining the external validity of our findings.
These findings advance our knowledge of the conditions under which regional redistributive issues become polarized in democratic societies. Relative place-based deprivation, due to skewed regional growth, polarizes individuals across poor and rich areas in their demand for inter-territorial redistribution. On the other hand, inter-territorial redistributive demand is depolarized as regions grow equally, even as absolute inequalities across territories persist. An understanding of inter-territorial redistributive preferences, therefore, requires the consideration of prospective and aspirational theories of political behavior, combining relative and absolute regional inequality in our explanatory accounts. This helps us to understand why regional disparities do not automatically translate into economic grievances, as some political economy accounts would suggest. Our findings also qualify the conditions under which inter-territorial distributive grievances emerge, providing important insights into one central mechanism explaining place-based political resentment.
Moreover, in line with research on inter-personal redistributive demand, our experiment shows that exposure to unequal regional income gains mainly affects redistributive support within wealthy areas, underlining the finding that exposure to inequality decreases solidarity among the better off (cf. Sands, Reference Sands2017). Our observational results, however, suggest that a divergence in relative income gains increases redistributive support among the poorer regions, while decreasing support among the richer areas in a rather symmetrical way. Here, we highlight potential ceiling effects in the experiment as an explanation for these divergent patterns and call for future research to further investigate how symmetric rich and poor areas respond to changes in relative regional income.
Our empirical findings also add to existing debates about the role of individual income and territorial identification for inter-territorial redistributive demand. While individual income conditions the effect of regional wealth in line with self-interest-based arguments (Balcells, Fernández-Albertos, and Kuo Reference Balcells, Fernández-Albertos and Kuo2015), we do not find a moderating role of territorial identification (Holm and Geys Reference Holm and Geys2018). This raises important questions on the nature of in-and out-group concerns that might shape support for inter-territorial redistribution. While we do not find support for the relevance of other-regarding concerns among people with strong federal identities, our findings suggest that self-interest-driven concerns for in-group benefits are dominant as people in rich areas appear to defend their advantaged position. This aligns with some of the psychological dynamics theorized in the place-based resentment literature (Munis Reference Munis2020) and raises important questions on the conditions that might generate in-and out-group concerns about inter-territorial redistribution, which promises to be an important avenue for future research. Moreover, while previous research has found an effect of territorial identification on support for regionally redistributive policies, this effect could only be found for general support of inter-territorial redistribution but not for support of increasing redistribution (Jacques, Béland, and Lecours Reference Jacques, Béland and Lecours2022). While our measure of redistributive support cannot disentangle status quo from policy change, respondents might have understood the item formulation as a statement about more inter-territorial redistribution. Arguably, support for changes of the status quo is a politically more relevant orientation, which appears to be independent of territorial identities in the Canadian context studied by Jacques, Béland, and Lecours (Reference Jacques, Béland and Lecours2022) as well as our European setting.
This paper will proceed as follows. First, we will review existing studies on preferences for inter-territorial redistribution and the remaining research gaps. In a second step, we will present our argument on the role of positional deprivation and voter aspirations for our understanding of regional redistributive demand. We will then present the research design and our main findings. After a discussion of validity checks and additional results, we close with a discussion and outlook.
Preferences for inter-regional redistribution
Similar to the research on individual-level redistributive preferences, inter-territorial redistributive preferences can play a crucial role in politics, by, for example, shaping political grievances and the development of political institutions (e.g., Beramendi Reference Beramendi2012). The existing studies about inter-territorial redistributive preferences can be summarized by two streams. First, there is a self-interest-based stream inspired by the classical political economy literature on inter-personal redistributive preferences (Balcells, Fernández-Albertos, and Kuo Reference Balcells, Fernández-Albertos and Kuo2015; Beramendi Reference Beramendi2012). Second, another strand of literature expands the self-interest-based arguments with social identity theory to allow for a deviation of redistributive preferences from pure economic self-interest (Holm and Geys Reference Holm and Geys2018).
The self-interest-based approach suggests that poorer regions are more supportive of regional redistribution than richer regions (Balcells, Fernández-Albertos, and Kuo Reference Balcells, Fernández-Albertos and Kuo2015). This is due to individuals’ desire to maximize their income based on the existing regional inequalities (Beramendi Reference Beramendi2007, Reference Beramendi2012). This argument aligns with the standard assumptions in the inter-personal redistribution literature (Meltzer and Richard Reference Meltzer and Richard1981). This self-interest-based approach also integrates the role of personal income for our understanding of inter-regional transfers. Here, the expectation is that individual income and regional inequality could jointly determine preferences toward interregional transfers. Indeed, Balcells, Fernández-Albertos, and Kuo (Reference Balcells, Fernández-Albertos and Kuo2015) suggest that rich individuals in rich regions and poor individuals in poor regions should have rather clear diametrically diverging preferences toward interregional transfers. However, ‘[t]he preferences of ‘cross-pressured’ groups (poor individuals in rich regions and rich individuals in poor regions) depend on assumptions about the nature of the transfer and the structure of inequality across and within regions’ (Balcells, Fernández-Albertos, and Kuo Reference Balcells, Fernández-Albertos and Kuo2015: 1323). These cross-pressured groups might fall somewhere in the middle of the preference distribution, but current empirical evidence on this is scant.
Following this self-interest-based approach, recent research has investigated popular support for fiscal federalism in the European Union. Here, regional self-interest also seems to relate systematically to redistributive support, as more needy areas express stronger support for EU-wide inter-territorial redistribution (Hetzer and Burgoon Reference Hetzer and Burgoon2024). However, conjoint experiments also uncovered support for EU social policy among people from rich regions, which, however, depends on a policy context of limited redistribution (Reinl, Nicoli, and Kuhn Reference Reinl, Nicoli and Kuhn2023).
A second strand of research diverges from the purely self-interest-based arguments presented above and introduces social identification with territorial units as an important extension (Holm and Geys Reference Holm and Geys2018). This literature argues that identification with a territorial construct can lead to shifts in individuals’ redistribution preferences that contradict their economic interests (Holm Reference Holm2016). The core argument in this literature is that identification with the federal/national level conditions the effect of regional inequality on redistributive preferences. While support for interregional redistribution declines with stronger federal identification in poorer regions, support for regional redistribution increases with stronger federal identification in richer regions. This is due to the stronger sense of altruism (e.g., concern for the other group’s interests) under higher federal identification (Holm and Geys Reference Holm and Geys2018: 1153). While this argument has been substantiated with correlational evidence, the empirical foundation is still sparse (Holm and Geys Reference Holm and Geys2018; Jacques, Béland, and Lecours Reference Jacques, Béland and Lecours2022).
The identification approach to inter-territorial redistribution shares important commonalities with the affinity-based approach in the inter-personal redistribution literature. This literature also argues that greater concern for the well-being of out-groups leads to higher support for redistribution, using social identity theory as a theoretical foundation (Cavaillé and Trump Reference Cavaillé and Trump2015). Social affinity is argued to potentially emerge around a range of social attributes, such as income, ethnicity, religion, or occupation. If out-group affinity is not given, well-off groups are shown to withdraw solidarity when confronted with inequality (Sands Reference Sands2017). If we consider that residence (place-affinity) could be an equally relevant social attribute, the affinity-based argument aligns well with the literature on territorial identification and inter-regional transfers. Indeed, residence has been shown to be an increasingly important source of identity conflicts in today’s politics, acting as a strong social identity source (Hegewald and Schraff Reference Hegewald and Schraff2025; Lyons and Utych Reference Lyons and Utych2023) and increasingly overlapping with other important social divides, such as class (Eidheim Reference Eidheim2025; Hegewald Reference Hegewald2026).
While the existing literature provides a good theoretical base for understanding preferences for inter-regional redistribution, it still leaves open important theoretical and empirical questions. Crucially, regional inequality is subject to misperceptions, as psychological reactions to geographic social sorting and issues of ‘center bias’ raise questions of how far people can adequately assess the existing nature of regional inequality (Dawtry, Sutton, and Sibley Reference Dawtry, Sutton and Sibley2015; Diehl and Wolter Reference Diehl and Wolter2025). Here, more experimental investigations promise better control over the information individuals have about regional inequality.
Moreover, the existing interest-based arguments struggle to engage with some recent debates on relative regional decline and political backlashes (Broz, Frieden, and Weymouth Reference Broz, Frieden and Weymouth2021; Colantone and Stanig Reference Colantone and Stanig2018; Lipps and Schraff Reference Lipps and Schraff2021; Walter Reference Walter2021). Particularly, the current argument that poor regions should support regional redistribution while the rich should oppose it struggles to explain why support for inter-regional transfers often remains low and regional inequalities persist. The territorial identification literature could potentially address this puzzle (Amat Reference Amat2012) but currently comes with limited empirical support. Moreover, the literature on inter-territorial redistribution so far does not consider important insights into the role of social mobility expectations for economic preferences. Below, we provide a theoretical framework that integrates this political economy literature into this theoretical debate.
The argument we propose in this paper comes to the aid of self-interest-based approaches by extending existing theories on the role of absolute regional income with arguments highlighting the importance of changes in relative regional income. As we outline below, we suggest that the distributive patterns of relative regional income across territories are a crucial contextual factor explaining why regional inequality does not always polarize regional redistributive preferences.
How diverging relative regional income gains amplify the effect of regional income inequality on redistributive preferences
While currently absent from studies on inter-territorial redistribution, the literature on inter-personal redistribution strongly relies on the distinction between relative and absolute income. Accordingly, it is argued that redistributive demand not only emerges from absolute income inequalities but also from positional deprivation in the form of relative changes in individuals’ incomes (Burgoon, Baute, and van Noort Reference Burgoon, Baute and van Noort2022; Weisstanner Reference Weisstanner2023).Footnote 1 The idea of positional deprivation is defined as a situation in which an individual experiences economic loss relative to others in society (Burgoon, Baute, and van Noort Reference Burgoon, Baute and van Noort2022). This can activate feelings of unfairness and alienation that translate into an increased demand for redistribution. Consequently, the focus on relative economic gains and losses allows for a situation in which the demand for redistribution increases without any personal economic losses but simply because others are gaining more (Weisstanner Reference Weisstanner2023).
Studies of inter-territorial redistribution have not considered the role of relative economic gains/losses. Yet, the relative economic performance of regions appears to have played a large role in understanding the local globalization backlash (Carreras, Irepoglu Carreras, and Bowler Reference Carreras, Irepoglu Carreras and Bowler2019; Colantone and Stanig Reference Colantone and Stanig2018; Nicoli, Guelen Walters, and Reinl Reference Nicoli, Guelen Walters and Reinl2022; Schraff and Pontusson Reference Schraff and Pontusson2024). Moreover, studies on inter-personal redistributive preferences underline the importance of economic context, such as the relative rise or decline in inequality (Jæger Reference Jæger2013; Lupu and Pontusson Reference Lupu and Pontusson2011; Schmidt-Catran Reference Schmidt-Catran2014). It therefore appears plausible that the distribution of relative income gains across areas conditions the effect of absolute regional inequality on demand for inter-territorial redistribution. Indeed, relative deprivation could explain well the demand for redistribution among the many European regions that have not become poorer in absolute terms but have experienced much lower growth in relative terms. Yet, the focus of relative deprivation theory on the relatively poorer areas struggles to explain how differences in relative gains could alter preferences in richer places.
Building on the standard Richard-Metzler model of redistributive preferences, we expect higher demand for redistribution in poorer, declining regions and lower support in wealthier, growing regions. However, this framework does not fully capture more nuanced dynamics, such as relative decline within affluent regions or accelerated growth in disadvantaged areas. To address these complexities, we extend the model by incorporating geographic mobility as a key factor. Political economic theories about social mobility expectations and economic preferences can provide important insights into how voters react to unequal growth in the presence of mobility (Friedman and Iversen Reference Friedman and Iversen2024). Here, we follow the model of the ‘aspirational voter’ who is not primarily concerned about the contemporary benefits of capitalism but who is mainly steered by prospects (Iversen and Soskice Reference Iversen and Soskice2020). This theory suggests that social mobility is consequential for political preferences, as voters with low incomes may have aspirations that they, or their children, can move upwards in socioeconomic terms, whereas those with high incomes will be concerned that they, or their children, may move down (Häusermann, Kurer, and Zollinger Reference Häusermann, Kurer and Zollinger2023). Applying this logic to regional income inequalities, voters are expected to form their inter-territorial redistributive preferences around concerns about future relative differences in economic prosperity across regions, focusing on the geographical distribution of economic opportunities and prospects for individuals to move to economic opportunity. The distribution of economic opportunities across regions and individuals’ abilities to move will also shape the extent to which inter-territorial redistribution serves as future social insurance (Rehm Reference Rehm2011). We therefore argue that regional growth trajectories serve as an indication of economic opportunity, which can create a prospective insurance logic for voters when forming their economic preferences.
This suggests that high-income people living in rich and growing regions would be very optimistic, expecting further rising incomes for themselves or their children. They therefore would have little reason to move or expectations that they would need to move, and they would consequently have little concern for securing income and opportunity outside their own region, e.g., via inter-territorial redistribution. But if economic growth, and hence opportunity, is more dispersed, rich voters in rich areas would likely have such concerns, which would lead them to support more fiscal solidarity across territories. Therefore, a more or less equal distribution of regional income growth could explain variation in inter-territorial redistributive concerns among richer voters in richer places.
In contrast, voters in poor regions will instead have more straightforward material concerns about redistribution, especially under a concentration of growth in richer areas. Yet, voters in poorer regions also have a strong incentive to move to places with more opportunities, which would reduce their demand for inter-territorial redistribution. But this effect, of course, will depend on the opportunities of the poor to move, which is stratified by socioeconomic status (e.g., Maxwell Reference Maxwell2020). Rich voters in poor places might have more opportunities to move, while the poorest are likely to have the highest risk of being stuck at their place of residence, therefore supporting inter-territorial redistribution the most.
Building on this theory about the geography of future economic opportunity and solidarity, we argue that the distribution of relative income growth moderates the effect of absolute regional inequality on redistributive demand. An equal distribution of economic gains spreads economic opportunity across areas. Such a context of more homogeneity in relative income increases perceptions of fairness and solidarity and increases popular support for redistribution across areas. Indeed, the positive effects of equally shared benefits across regions for depolarizing political preferences have previously been argued to be driven by optimism about a shared future (Lipps and Schraff Reference Lipps and Schraff2021). Equally large income gains signal to individuals that things are developing in the right direction and that everyone benefits from the current economic context. Equally shared income gains also weaken conflicts about future mobility perspectives, as future opportunity is distributed more equally across places. This is likely to foster fairness conceptions and decrease polarization around pre-existing inequalities.
We, therefore, expect that more equally distributed regional income gains reduce the effect of absolute regional inequality on preferences for inter-territorial redistribution, leading to a less polarized and moderately high support for territorial transfers overall. Yet, a very different picture emerges under an unequal distribution of income gains. Under this scenario, income gains tend to become an in-group benefit of the richest areas, as these usually are the drivers of economic growth. Rich areas might then respond with strong opposition to a potential redistribution of their in-group benefit (Sands Reference Sands2017). A concentration of income gains in rich areas reduces the required scope of solidarity among the rich, as future opportunities for social mobility are restricted to their places. Poorer areas, on the other hand, will feel relatively more deprived as the richer areas benefit from economic growth to a larger extent. This means that an unequal distribution of income gains across territories will lead to a larger differential in individuals’ fairness perceptions across territories. Individuals from poorer areas might perceive a context of unequally distributed economic gains as more unfair, while individuals from richer regions might view the same context as fairer (e.g., due to merit-based heuristics and reduced need for solidarity). We hence expect that an unequal distribution of economic gains amplifies the effect of regional inequality on inter-territorial redistributive demand. Our theoretical argumentation is summarized by the following pre-registered hypothesisFootnote 2 :
H1 – absolute income: People in the poor-region condition show higher support for territorial redistribution than people in the rich-region condition.
H2 – relative income: People in the unequal relative income condition show higher support for territorial redistribution than people in the more equal relative income condition.
H3 – interaction: Demand for territorial redistribution depends on whether the distribution of relative regional income amplifies or attenuates existing absolute income divides.
H4: People in the poor-region condition and the unequal relative income condition should perceive regional inequality as less fair.
Besides the novel argument on the moderating role of regional income gains presented above, the empirical analysis will investigate two important theoretical arguments that emerge from the existing literature reviewed above, both of which have so far received limited empirical scrutiny. First, following the interest-based account, we expect that individual income moderates the effect of regional inequality on support for inter-territorial redistribution. Second, as an alternative to our argument on the role of fairness and relative economic gains, we test whether territorial identification moderates the effect of regional inequality.
Research design
Experimental study
To test the interactive effect of absolute and relative regional income on redistributive demand, we have fielded a 2 × 2 factorial survey experiment in Germany and France in 2022.Footnote 3 The research design has received ethical approval and was pre-registered.Footnote 4 Participants were asked about consent and received a short debriefing text at the end of the survey (see full questionnaire in the online Appendix). The two selected countries constitute two different welfare states and vary substantially with respect to the degree of regional decentralization, with Germany being a federal state that delegates sizeable fiscal authority to the subnational level and France being a centralized unitary state. This variation ensures a certain level of external validity of our findings. Moreover, both states are also relatively big European countries with substantial subnational variation in economic wealth, which constitutes a practical advantage. While France is a country with a rather weak institutionalized fiscal federalism (e.g., its own tax base for subnational authorities), it still has, like most democratic countries, a system of sizable inter-territorial transfers in place to distribute tax money across regions (Siliverstovs and Thiessen Reference Siliverstovs and Thiessen2015). The fundamental political issue of inter-territorial redistribution, therefore, exists in all democracies. The major difference comes from whether the country-specific redistributive processes and institutions are decentralized. Our case selection is a way to test how these institutional differences matter for people’s formation of inter-territorial preferences.
The factorial design allows for a causal identification of interaction effects, in our case, the interaction between absolute regional income and relative regional income. Table 1 presents the research design of the factorial experiment employed in this study, which is fielded in France and Germany, resulting in a pooled sample of N = 2,500 (and N = 3,000 including the untreated control group). Causal identification of the interactive effect in a factorial experimental design does not require a dedicated control group, as the quantities of interest can be calculated from all logical combinations of the factors. However, we still included an untreated group that did not receive any textual vignette to quantify absolute effect sizes, rather than just relative effect sizes between factor levels (see Figure A1 in the online Appendix).
Factorial experiment on territorial redistributive demand
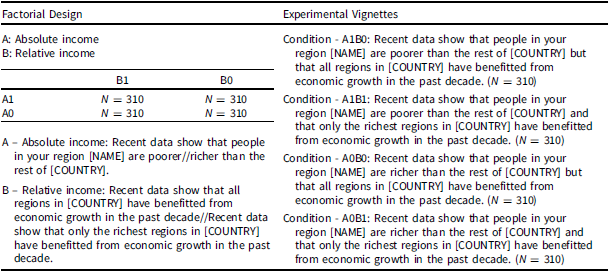
Table 1. Long description
The table outlines the factorial design used to identify interaction effects between absolute regional income and relative regional income. It includes two main sections: Control and No treatment page, each with various conditions and sample sizes. The Control section has four conditions (A1B0, A1B1, A0B0, A0B1) with N values of 310 each. The No treatment page also lists four conditions with the same N values. The table specifies the text for each condition, indicating how people in a region are compared economically to others in the country. The design allows for causal identification of interactive effects without requiring a dedicated control group, though an untreated group is included to quantify absolute effect sizes. The experiment is fielded in France and Germany, resulting in a pooled sample of 2,500, or 3,000 including the control group.
Note: The design includes an untreated group (N = 310) receiving no textual vignette to estimate absolute effect sizes, rather than relative effects between factor level.
During the study, respondents first had to pass an attention check, which required them to select a specific value on a response item within an item battery (‘please select 10 here’) just before the treatment assignment. Only respondents passing the attention check before the treatment assignment were allowed to complete the survey. Note that attentive participants were sampled according to the socio-economic quotas, ensuring representative samples. After the attention check, respondents were randomly assigned to a treatment page, which was introduced with a short paragraph: ‘Before continuing the questionnaire, please pay special attention to the information provided below. It is important that you read carefully’.
Following our theoretical argumentation, we propose two distributive scenarios on the inter-territorial level: (1) A situation of income gains being shared rather equally across regions, and (2) a situation of income gains being concentrated within the richest regions. Of course, other scenarios, such as larger growth in poorer areas, are theoretically possible, but empirically, these two scenarios appear most relevant. Focusing on these two distributive scenarios is supported by the New Economic Geography literature, which points to the role of agglomeration effects that sustain pre-existing territorial inequalities (Krugman Reference Krugman1998). Agglomeration effects suggest that economic growth is usually concentrated in already rich and competitive areas, reproducing regional inequalities. Indeed, empirical studies of the developments of regional inequality in Europe confirm that rising within-country territorial inequality can largely be attributed to disproportionately higher growth in richer regions (Bouvet Reference Bouvet2010).
Respondents were randomly exposed to one of the four vignettes presented in Table 1. Table A1 in the Appendix shows that randomization was successful, producing balanced samples across socio-demographic covariates. Respondents had to check a box below the vignette to confirm that they had read the information provided, ensuring some engagement with the content of the page. Each vignette in Table 1 represents one logical combination of the two conditions, absolute regional income (A) and relative regional income (B).
Absolute income (A) was assigned as an informational treatment telling respondents whether (‘according to recent data’) people in their region are poorer or richer than the rest of the country. This treatment manipulates an individual’s perception of their residential region’s position in the country-wide regional income distribution. The relative income gains (B) treatment follows as a second informational treatment, reporting how the income gains of the recent decade were distributed across regions. Under the more equal relative income condition (B0), the vignette says that all regions benefited from economic growth. Under the more unequal relative gains condition (B1), the text informs respondents that only the richest regions benefited from economic growth over the past decade.Footnote 5
To contextually locate respondents in the experimental setup, the survey collected respondents’ postcodes of residence and piped the actual name of a respondent’s region of residence into the vignette (denoted as the [NAME] placeholder in Table 1). Here, the mid-tier level of NUTS2Footnote 6 regions was chosen, corresponding to 22 French and 38 German regions. Note that the NUTS2 level is also the territorial level at which the EU’s territorial redistributive policy (regional policy) is administered. It is therefore an administrative unit of analysis that plays a central role in inter-territorial redistributive politics in the EU (Beramendi Reference Beramendi2012; Schraff Reference Schraff2019). NUTS2 regions are important for regional development policies and are frequently the unit of analysis in studies of economic geographies in Europe (Comim, Abreu, and Borges Reference Comim, Abreu and Borges2024).
One important decision for this experimental design is to either treat respondents with information on the actual level of regional inequality or with a hypothetical scenario. We opted for a hypothetical scenario, which has the advantage that it fully randomizes the perception of individuals’ position in the regional wealth distribution. However, this comes at the cost of being (potentially) less plausible for respondents who have a good understanding of the actual level of regional inequality in their country. Yet, it is not clear how well-informed individuals are about the actual level of regional inequality in their country. Moreover, many regions have a sizable internal heterogeneity in wealth that might make the treatment plausible for at least a share of respondents in each area.Footnote 7
A straightforward way to check the plausibility of this design choice is to see whether the actual level of regional income (e.g., regional GDP per capita) conditions the success of the regional inequality treatment (A). We can check this for different territorial tiers recorded in the data (NUTS2 & NUTS3 regional income). As shown in Appendix A2, actual regional income does not condition the treatment effects of absolute regional income, suggesting that randomizing regional inequality was equally successful across different levels of regional income.
The alternative strategy for the experimental design would have been to treat respondents with information on the actual level of regional income. Yet, this approach does not fully randomize regional inequality, e.g., meaning people’s position in the regional wealth distribution. Rather, it reduces the treatment to a correction of potential misperceptions of regional inequalities. This is not the goal of our study, but this has been investigated in previous research (Balcells, Fernández-Albertos, and Kuo Reference Balcells, Fernández-Albertos and Kuo2015). Overall, our experimental design can therefore be described as an implicitly hypothetical situation, adding limited contextual information (Brutger, Kertzer, Renshon et al. Reference Brutger, Kertzer, Renshon, Tingley and Weiss2023). As Brutger, Kertzer, Renshon et al. (Reference Brutger, Kertzer, Renshon, Tingley and Weiss2023) show, hypothetical experimental scenarios tend to work equally well (or even better) as more realistic ones. Adding context, such as piping respondents’ region of residence into the vignette, rather attenuates treatment effects, as more context distracts from the treatment. Yet, we still think the region name is an important feature that helps us to link the experiment to debates about inter-territorial redistribution, which take place on the level of such regions (e.g., NUTS2 regions).
The main outcome variable for the experiment is respondents’ support for inter-territorial redistribution. This variable is measured with the following survey item: ‘Government should redistribute tax income from wealthier regions to poorer regions in [COUNTRY]’. The response scale for this item is a 5-point Likert scale ranging from (1) ‘strongly disagree’ to (5) ‘strongly agree’. A second outcome of interest is the fairness perception, tapping into the mechanism of our theoretical argument. Respondents could evaluate the state of regional inequality in their country with the following outcome measure: ‘In your opinion, are the differences in regional wealth in [COUNTRY]…’. Respondents could then assess regional inequality as ‘unjustly too high’, ‘just’, or ‘unjustly too low’. We code unfairness perceptions as a dummy variable that takes the value of 1 if respondents rated regional inequality as ‘unjustly too high’.
Theoretical expectations from the existing literature regarding the role of individual income and territorial identification are investigated with corresponding survey items. Income is measured as the reported net household income over five brackets (e.g., under 1,000, 1,001–2,000, 2,001–4,000, 4,001–6,000, and over 6,001 euros). Territorial identification is captured with an item measuring an individual’s attachment to the region of residence as well as the country (e.g., ‘On a scale of 0 to 10 (where 0 means ‘not attached at all’ and 10 means ‘strongly attached’), how attached do you feel to…? [COUNTRY] [REGION]’). While existing research emphasizes that attachment to the country/federation matters (Holm and Geys Reference Holm and Geys2018), we will also test whether attachment to the subnational territory plays a role. Table 2 presents descriptive statistics for the two outcome measures and socio-demographic covariates in our experimental data.
Descriptive statistics

Table 2. Long description
The table presents descriptive statistics for various survey items. It includes six rows and six columns, with headers for Statistic, N, Mean, St. Dev., Min, and Max. The statistics cover support for inter-territorial redistribution, regional inequality unfairness, household income, age, gender, and tertiary education. Support for inter-territorial redistribution has a mean of 3.419 and a standard deviation of 1.047. Regional inequality unfairness has a mean of 0.596 and a standard deviation of 0.491. Household income has a mean of 2.688 and a standard deviation of 0.960. Age has a mean of 45.009 and a standard deviation of 14.226. Gender, with 1 representing male and 2 representing female, has a mean of 1.510 and a standard deviation of 0.500. Tertiary education has a mean of 0.366 and a standard deviation of 0.482.
Observational study
The factorial experiment provides a test of our causal theoretical argument with high internal validity, but this comes at the cost of reduced realism (e.g., external validity). To further support the plausibility of our argument, we are using original survey data from nine European countries collected in spring 2023. The survey was administered by the survey company Bilendi and covers a representative sample of ca. N = 1,000 for each country. The nine countries are selected to cover different parts of Europe: Czechia, Germany, Denmark, Spain, Greece, France, Hungary, Italy, and Poland. The survey is particularly useful for our purpose, as it measures inter-territorial redistributive support using the same survey item as the experimental study introduced above. Moreover, the survey includes NUTS2 regional codes to locate respondents within one of the 146 NUTS regions of the nine countries. This allows us to provide an observational test of our argument.
To measure relative and absolute regional income, we merged GDP per capita data on the NUTS2 level provided by Eurostat with our survey data. We capture absolute income as the regional level of GDP per capita in 2022. Relative income is defined as the gap in a region’s gain in GDP per capita in the past ten years (2012–2022) relative to the country’s richest region (Lipps and Schraff Reference Lipps and Schraff2021). This relative income measure effectively captures how far a region has kept up or fallen behind in economic growth compared to the most dynamic region in the country. A low gap suggests that regions of the same country have gained equally from economic growth during the past ten years, while a larger gap indicates that a region gained much less within the national context. This operationalization fits well with our measurement of relative income in the experimental design.
To sensibly interpret our observational regression results, we introduce a parsimonious set of control variables that could potentially identify the causal effect of regional income on redistributive support (Keele, Stevenson, and Elwert Reference Keele, Stevenson and Elwert2020). As outlined in the Directed Acyclic Graph (DAG) in Figure 1, we expect that regional population density could act as an antecedent cause that blocks backdoor paths. Population density is causally related to regional inequality and is also a result of the major societal forces that shape regional inequality, such as people’s movements to opportunity or structural factors behind the economic geography (e.g., trading routes, natural resources). We also account for a set of individual-level socio-demographic factors, such as gender, age, education, migrant background, urban-rural residence, and left-right ideology, which we expect to be bidirectionally related to population density (e.g., via socio-demographic differences in moving patterns). Descriptive statistics for the observational data can be found in Table A5 of the Appendix.
DAG for observational regression model.
Note: The direct acyclic graph was created with the ‘ggdag’ package in R. The variable U describes unobserved confounders.

Figure 1. Long description
The directed acyclic graph (DAG) illustrates an observational regression model with multiple variables and their relationships. The graph includes nodes labeled as Relative income, Absolute income, Redistributive support, Population density, Individual-level covariates, and U. Arrows indicate the direction of influence between these variables. Relative income influences Absolute income and Redistributive support. Absolute income is influenced by Population density and Individual-level covariates, and it also influences Redistributive support. Population density influences Individual-level covariates. Individual-level covariates are influenced by U. All values are approximated.
For our observational data, we estimate a linear multi-level model with nested random effects for regions within countries. In line with our theoretical argument, the regression includes an interaction term between a region’s relative and absolute income, as we expect that a relative change of regional income amplifies the effect of absolute regional income inequality on inter-territorial redistributive support.
Experimental results
Model 1 of Table 3 presents the independent treatment effects of the absolute and relative regional income conditions, including a dummy for systematic country differences across France and Germany. Assigning individuals to the poorer-region condition increases support for inter-territorial redistribution by 0.28. Treating individuals with the relative income condition also affects redistributive demand, but to a much lesser extent. Individuals under the unequal relative income gains condition express a slightly lower demand for inter-territorial redistribution compared to respondents in the similar relative gains condition. The independent treatment effects suggest that absolute regional income is the more relevant determinant of redistributive preferences.
OLS estimates of treatment effects on support for inter-territorial redistribution
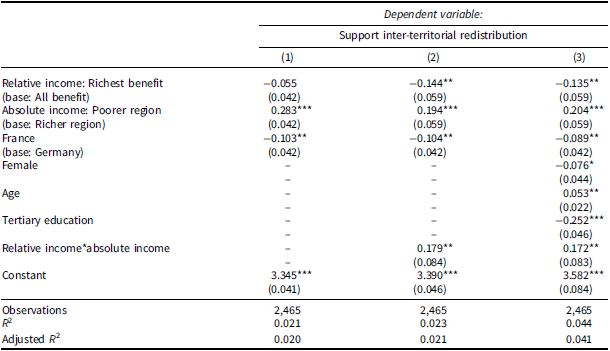
Table 3. Long description
The table presents OLS estimates of treatment effects on support for inter-territorial redistribution. It includes three columns of data and several rows with variables such as relative income, absolute income, country dummies, and demographic factors. The table shows coefficients and standard errors for each variable, indicating their impact on support for redistribution. Notable trends include the positive effect of being in a poorer region and the negative effect of being in France compared to Germany. The interaction between relative and absolute income also shows a significant positive effect.
Note: *p < 0.1; **p < 0.05; ***p < 0.01.
Model 2 of Table 3 introduces the randomized interaction between the two experimental conditions. The interaction term has a positive sign and is statistically significant at the five percent level. Figure 2 presents the marginal effects (Panel A) of the interaction to facilitate a substantive interpretation. The plot shows that the distribution of relative regional income moderates the effect of absolute income on redistributive demand. Under a scenario of similar relative income growth across areas, absolute regional inequality becomes less important for respondents’ support of inter-territorial redistribution. Specifically, under similar regional income growth, regional inequality has a statistically significant effect on redistributive demand of 0.2 points. This means that absolute regional inequality still matters for redistributive demand under a scenario of equal income growth, but overall preferences for regional redistribution are – on average – rather close together across rich and poor regions under this scenario.
Marginal effects and predicted probability plots of the interaction effect between absolute and relative regional income on inter-territorial redistributive support.
Note: Based on the regression results of model 2 in Table 3. The absolute regional income treatment in Panel (A) shows the marginal effect of the poorer region treatment, using the richer region treatment as the reference category.
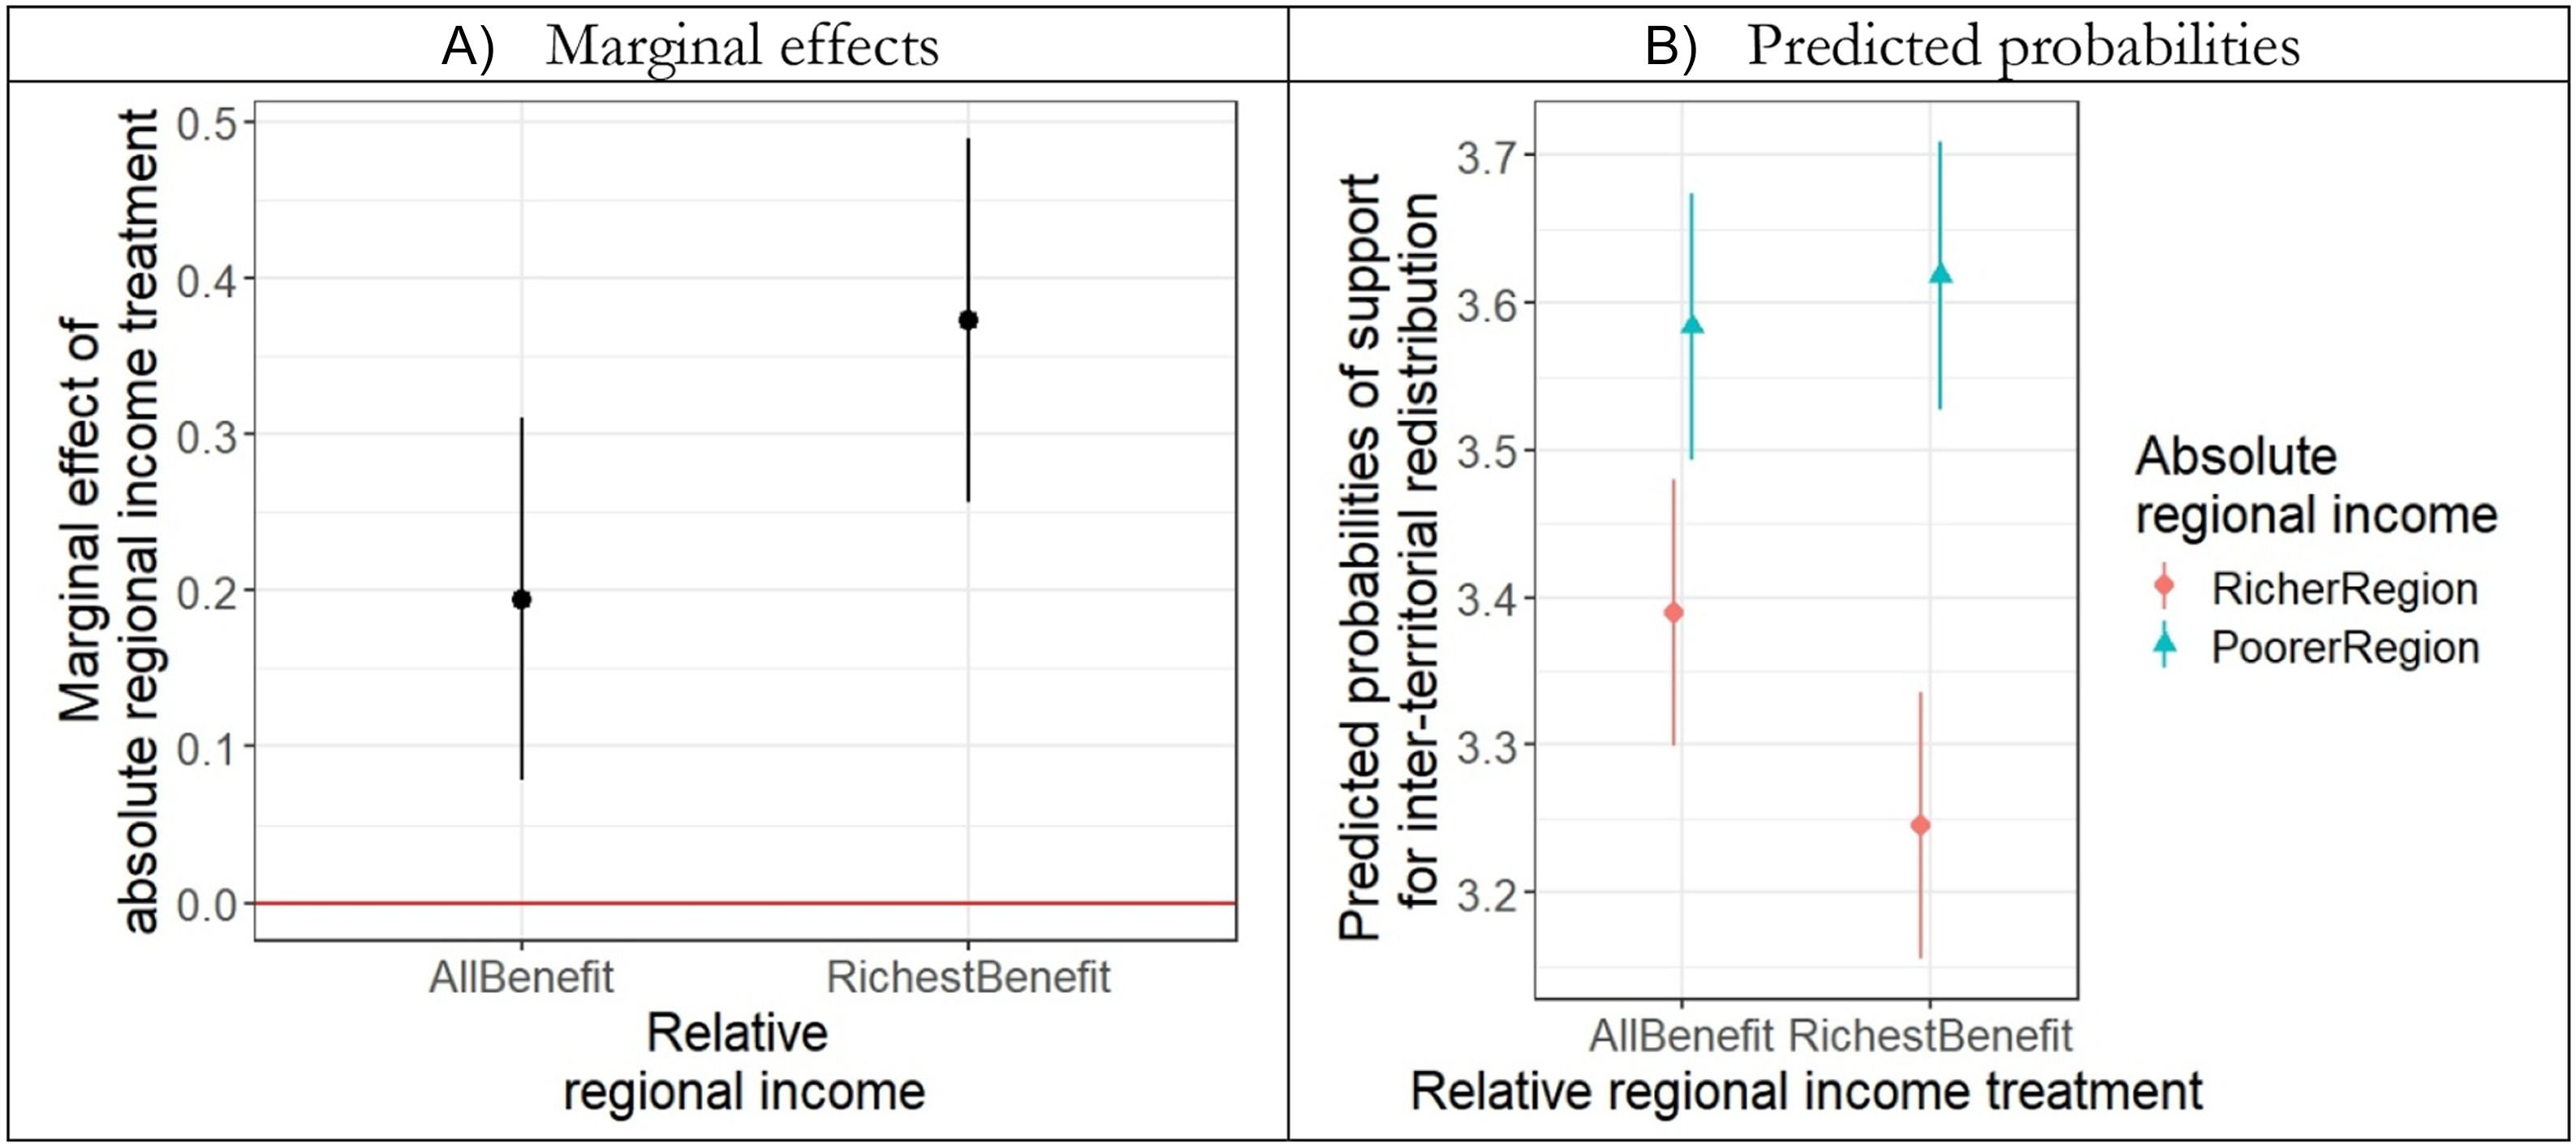
Figure 2. Long description
The image contains two graphs side by side. The left graph, labeled ‘Marginal effects,’ shows the marginal effect of absolute regional income treatment on the y-axis against relative regional income on the x-axis. Two data points are plotted: one for ‘AllBenefit’ and another for ‘RichestBenefit,’ with error bars indicating variability. The right graph, labeled ‘Predicted probabilities,’ displays the predicted probabilities of support for inter-territorial redistribution on the y-axis against relative regional income treatment on the x-axis. Two sets of data points are shown, one for ‘RicherRegion’ in red and another for ‘PoorerRegion’ in blue, each with error bars. The graphs illustrate how different levels of regional income affect support for redistribution, with richer and poorer regions responding differently to the benefits.
Preferences for inter-territorial redistribution, however, more clearly diverge under unequal relative regional income growth. If regional inequalities occur together with unequal relative income growth, preferences for inter-territorial redistribution polarize more strongly. The effect of absolute regional income is substantially larger under a scenario of unequal relative income gains, doubling from 0.2 to nearly 0.4 points. The predicted probabilities plot presented in Panel (B) of Figure 2 for this interaction shows that this finding is mainly driven by individuals in the rich-region scenario. Individuals from the rich-area condition become much more opposed to redistribution as relative regional gains are presented as skewed towards them. Individuals in the poor-region condition remain on a high level of support for inter-territorial redistribution. For individuals in the poor condition, average support for redistribution increases under the unequal relative gains condition, but this increase does not reach conventional levels of statistical significance.
Overall, the treatment effects of the factorial experiment demonstrate a pronounced interactive relationship between the absolute and relative regional income conditions. Redistributive support differs by 0.4 points between respondents in the poor-region-rich-gain scenario vs. respondents in the rich-region-rich-gain scenario. More specifically, this effect corresponds to 0.38 standard deviations of the dependent variable, suggesting a moderate effect size. Moreover, Figure A1 in the Appendix shows absolute effect sizes compared to the non-treated group (no-vignette condition) included in the survey. As expected, the untreated group scales in the middle of the factorial scenarios, with the biggest effect differences of 0.26 to the rich-region-rich-gain scenario, which amounts to 0.24 standard deviations of the dependent variable.
The main findings of the factorial experiment confirm that the effect of absolute regional income on support towards inter-territorial redistribution is dependent on the nature of relative income gains. In a context of equally shared growth across territories, redistributive preferences are more homogenous across areas, reducing political polarization over the issue of regional inequality. However, in contexts of skewed relative income growth, e.g., meaning higher gains in wealthier areas, voters polarize more strongly over the issue of inter-territorial redistribution. This polarization is mainly driven by individuals from richer areas, who become much more critical of redistribution under more unequal relative gains.
Self-interest-based explanations of inter-territorial redistribution are therefore highly dependent on patterns of distributive fairness across areas. This finding is in line with the aspirational voter model, as material inequalities can be colored by fairness perceptions about the geographic distribution of future economic opportunities. As future economic opportunities (e.g., relative regional economic growth rates) are more equally distributed across areas, voters from rich areas are more willing to support inter-territorial redistribution to ensure the potential to share these opportunities in the future. In contrast, as future economic opportunities are concentrated in rich areas, voters from rich regions support inter-territorial redistribution less, as their judgment of economic context requires less solidarity to ensure their future opportunities.
Specifically, our argument presented above proposes that the distribution of relative income can make existing inequities appear as more or less fair, depending on how future economic opportunities are distributed across richer and poorer areas. Figure 3, therefore, presents insights into this mechanism by showing the treatment effects of the factorial experiment on individuals’ evaluation of the fairness of existing regional inequalities within their country. For this purpose, we analyze a secondary outcome (dichotomous), asking respondents how fair/unfair they perceive the regional inequality in their country. This fairness perception measure takes a value of one if respondents rate regional inequalities as ‘unfair’ and a value of zero otherwise.
Marginal effects and predicted probability plots of the interaction effect between absolute and relative regional income on fairness perception.
Note: Full regression results are presented in Table A3 in the Appendix. The absolute regional income treatment in Panel (A) shows the effect of the poorer region treatment, using the richer region treatment as the reference category. The outcome is a dummy variable, taking the value of one if regional inequality is perceived as unfair. The pre-analysis plan registered estimation with normal standard errors, but the findings of this estimated linear probability model are the same with robust standard errors (see replication material).
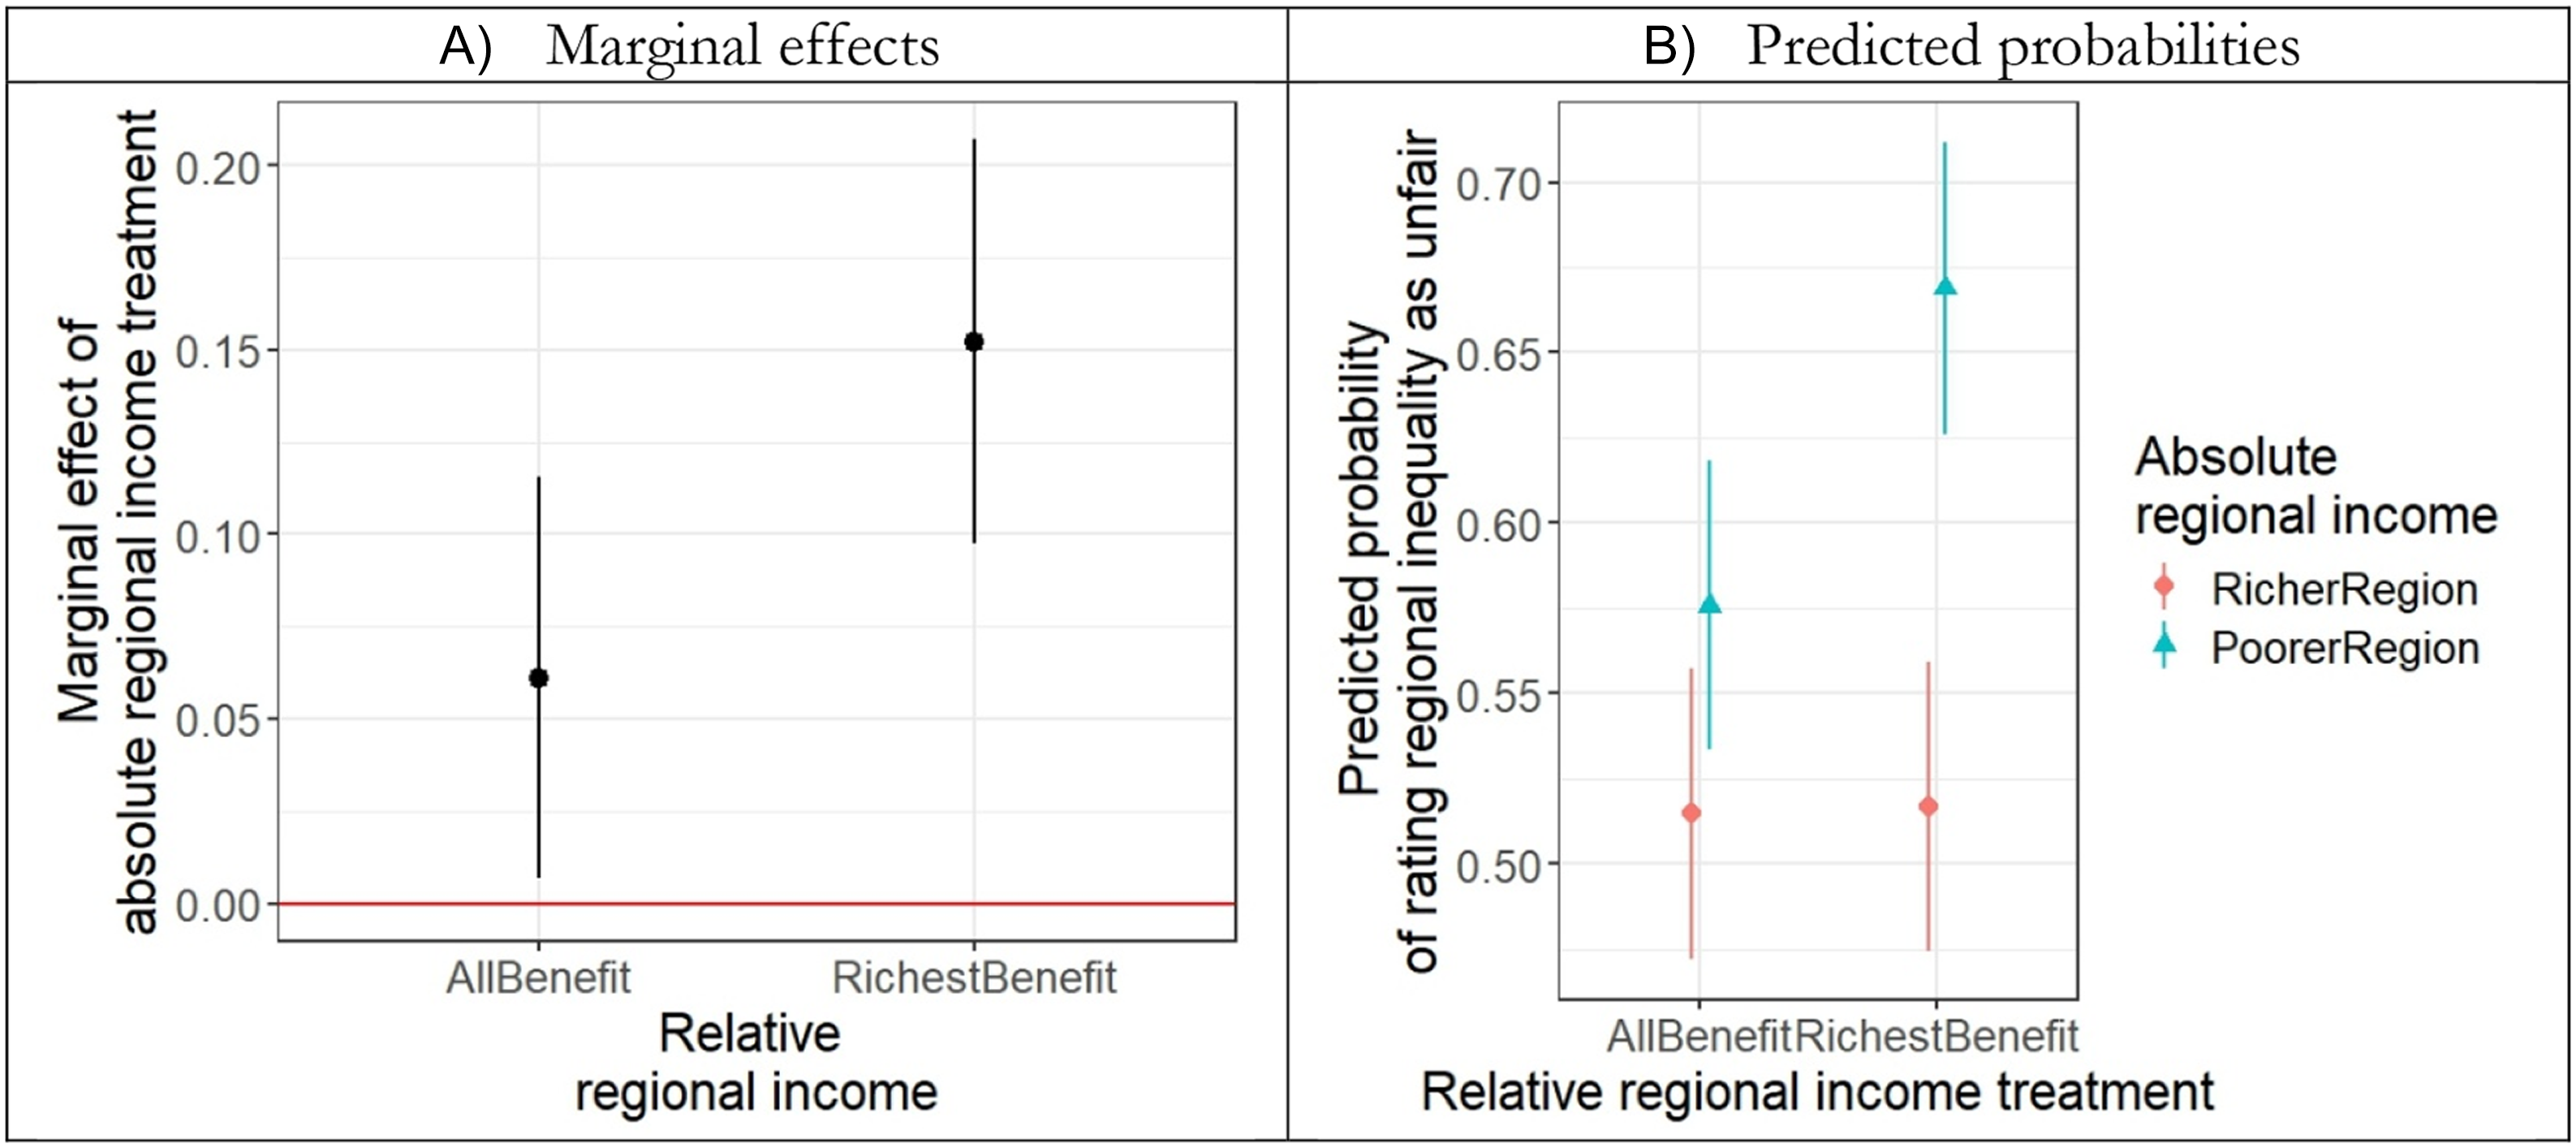
Figure 3. Long description
The image contains two graphs: a scatter plot on the left and a line plot on the right, illustrating the interaction effect between absolute and relative regional income on fairness perception. The left graph, labeled ‘Marginal effects,’ shows the marginal effect of absolute regional income treatment on the y-axis against relative regional income on the x-axis. Two data points are plotted: one for ‘AllBenefit’ and another for ‘RichestBenefit,’ with error bars indicating variability. The right graph, labeled ‘Predicted probabilities,’ displays the predicted probability of rating regional inequality as unfair on the y-axis against relative regional income treatment on the x-axis. Two sets of data points are shown: one for ‘RicherRegion’ in red and another for ‘PoorerRegion’ in teal, each with error bars. The graphs collectively illustrate how perceptions of fairness vary with regional income dynamics.
Figure 3 demonstrates that the probability of judging regional inequality as unjust is similar across the absolute regional income conditions if relative income is more equally distributed (Panel B). This confirms that a more equal distribution of relative income across areas diminishes the role of material self-interest for fairness assessments. However, as relative income is disproportionately skewed towards the richest territories, fairness judgments diverge strongly. The predicted probabilities plot (Panel B) shows that respondents under the rich-region condition perceive regional inequality as significantly fairer if economic growth is presented as concentrated in their areas. Individuals in the poor-region condition, however, perceive regional inequalities as significantly less fair, as relative income is skewed towards the rich. The divergence of fairness perceptions across the rich-and poor-region conditions under unequal relative income amounts to a 15 percentage point difference.
The analysis of the fairness perception outcome lends further support to our theoretical argument. Opinions about distributive fairness become polarized if absolute regional income inequalities coincide with unequal relative income gains. This divergence in fairness perceptions mirrors the polarization in the inter-territorial redistribution preferences presented in Figure 2. An equal distribution of relative income, in contrast, leads to a convergence in the fairness perception across the poor and rich scenarios. This aligns with the attenuation of the geographic polarization over inter-territorial redistribution under equal relative gains in Figure 2, even though the convergence is even stronger with the fairness outcome. Moreover, the fairness results in Figure 3 (Panel B) also point to a significant increase in perceived unfairness among individuals from the poor-region condition, as relative income is skewed towards rich areas. This increase was much smaller and not statistically significant for the redistribution outcome (see Figure 2 Panel B), maybe due to ceiling effects in the redistributive support measure. Overall, these findings support our theoretical expectation that a concentration of economic opportunities in wealthy areas polarizes opinions about regional inequality, while more dispersed economic growth increases solidarity among rich areas and moderates demand for redistribution among poor areas.
Existing arguments and robustness
The role of individual income
Up until this part of the analysis, we tested pre-registered hypotheses from our pre-analysis plan.Footnote 8 The remaining parts of the analysis constitute exploratory analyses that are of particular theoretical interest, given existing research. Self-interest-based arguments suggest that individual income conditions the effect of regional inequality on redistributive demand. According to Balcells, Fernández-Albertos, and Kuo (Reference Balcells, Fernández-Albertos and Kuo2015), rich individuals in rich regions and poor individuals in poor regions should have rather clear diametrically diverging preferences towards interregional transfers, while the remaining individuals are cross-pressured and should fall in the middle of the distribution. Interestingly, Balcells, Fernández-Albertos, and Kuo (Reference Balcells, Fernández-Albertos and Kuo2015) have not found support for the moderating role of income in their study of Spanish data.Footnote 9
Figure 4 presents findings for interactions of the experimental treatments with individual household income. Panel (A) of Figure 4 shows the interaction of individual income with the absolute regional income treatment, mirroring the original debate in the literature about the role of individual income for the self-interest-based approach. The findings align with Balcells, Fernández-Albertos, and Kuo’s (Reference Balcells, Fernández-Albertos and Kuo2015) argument that the poor in poor regions and the rich in the richest regions should diverge most strongly in their redistributive preferences, while the rich respondents in the poor-region condition fall into the middle. The poor individuals in the rich-region-condition, however, still have a very high preference for inter-territorial redistribution, which is statistically not different from the redistributive support of the poor in the poor-area condition.
Predicted probabilities for the effect of absolute regional income treatments across individual income.
Note: Results based on the regression estimates presented in Table A6 of the Appendix. Panel (A) presents predicted probabilities for the interaction between the absolute regional income treatment and respondents’ individual household income. Panel (B) presents predicted probabilities for the factorial treatment interaction for the lowest (Min) and highest (Max) household income brackets.
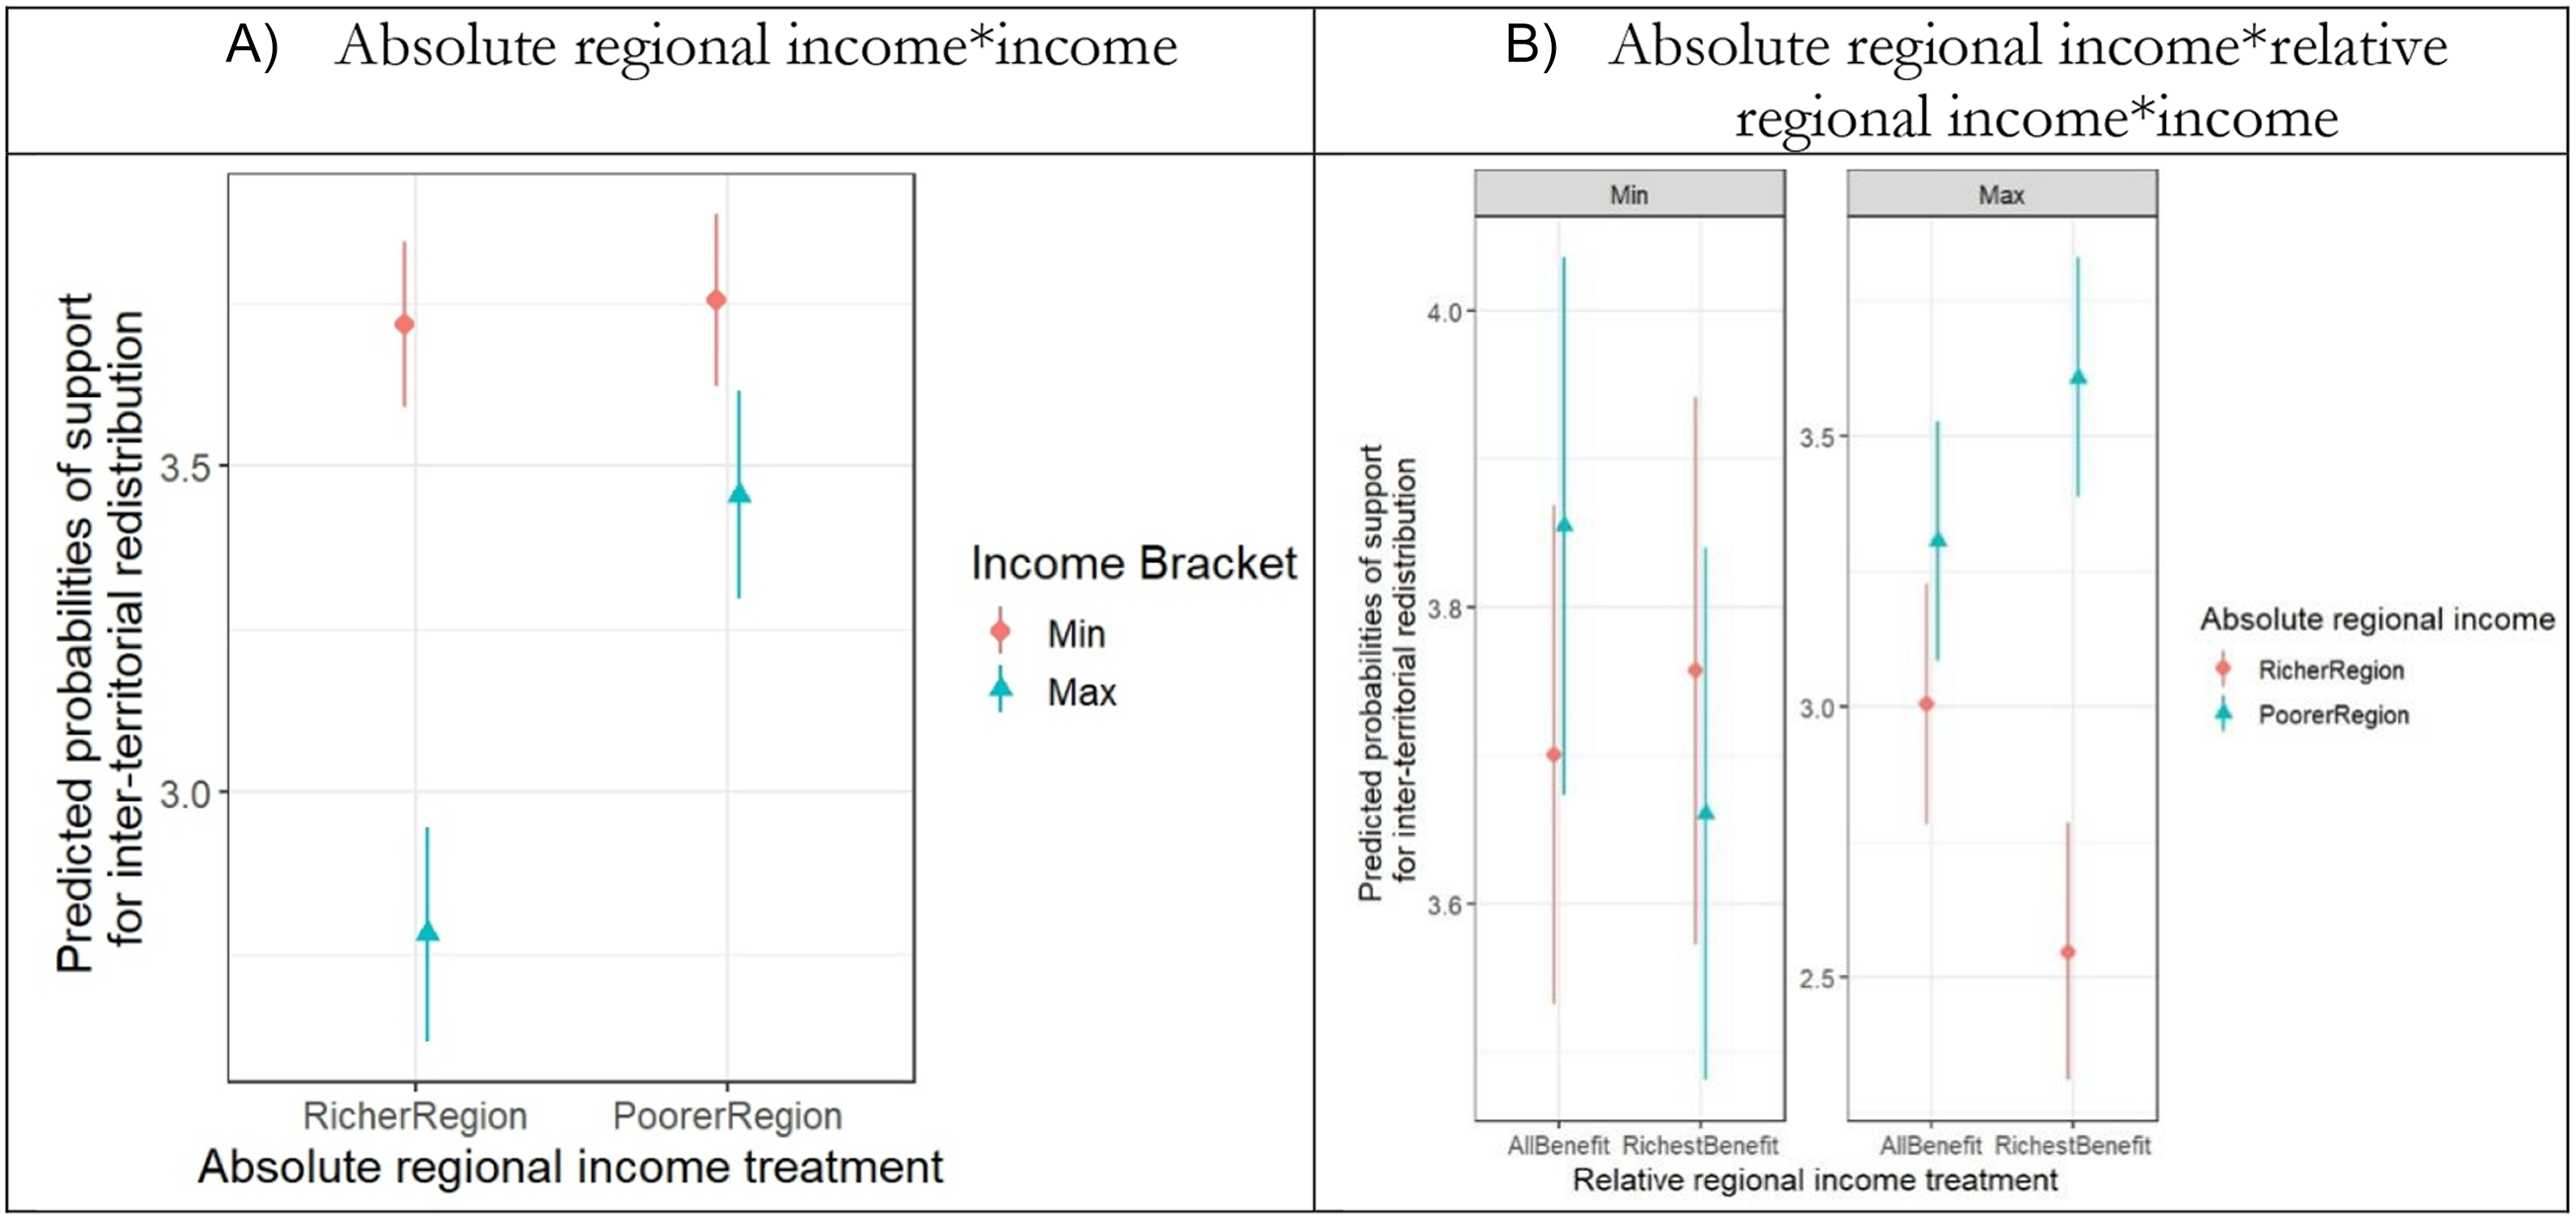
Figure 4. Long description
The image contains two graphs labeled A and B. Graph A on the left shows the predicted probabilities of support for inter-territorial redistribution across different income brackets in richer and poorer regions. The x-axis represents the absolute regional income treatment, divided into RicherRegion and PoorerRegion, while the y-axis shows the predicted probabilities. Two income brackets, Min and Max, are represented by red and blue markers, respectively. Graph B on the right is divided into two panels, each showing the predicted probabilities for different relative regional income treatments. The left panel shows the Min treatment, and the right panel shows the Max treatment. Each panel compares the probabilities for richer and poorer regions, with the x-axis representing the relative regional income treatment and the y-axis showing the predicted probabilities. The markers indicate the absolute regional income, with red for RicherRegion and blue for PoorerRegion. The graphs illustrate how support for inter-territorial redistribution varies with both absolute and relative regional income, highlighting differences between richer and poorer regions and across income brackets.
The high support for inter-territorial redistribution of poor individuals in richer areas is of particular interest to existing theories of the politics of inter-territorial redistribution. Some arguments suggest that poor individuals in richer regions might be relatively opposed to inter-regional transfers, as the transfers could be perceived as exclusively benefiting the poor in other regions instead of financing inter-personal transfers (Beramendi Reference Beramendi2012). This argument is not supported by our findings here. One reason for that might be that poor individuals in rich regions are less affected by the redistribution of tax income to other regions, as the tax burden is mainly carried by higher-income groups. Moreover, a substantial part of poorer people in rich regions might have moved from poorer areas to the richer regions, creating a stronger sense of solidarity and less out-group discrimination within this group of voters (Hegewald and Schraff Reference Hegewald and Schraff2025).
Indeed, the findings from Figure 4 suggest that absolute regional income becomes relevant for preferences on inter-territorial transfers as individual incomes increase. This supports a self-interest perspective, as individual support for redistribution aligns with the size of voters’ potential tax contributions to the redistributive policy. This finding replicates in the three-way interaction of the experimental interaction and income in Panel (B) of Figure 4. The statistical interaction of absolute and relative regional income becomes stronger as individual incomes increase. Support for inter-territorial redistribution, however, is similarly high across all treatment conditions under very low individual income.
The role of territorial identification
Following the identity approach to inter-territorial redistribution, we have also investigated the moderating role of territorial identification strength. Existing arguments suggest that regional inequality should polarize inter-territorial redistributive preferences more strongly if federal identity is weak, while support for inter-territorial transfers is less polarized across areas if there is a strong common federal identification (Holm and Geys Reference Holm and Geys2018). Table 4 presents interactions of the treatment conditions with individuals’ regional and national identity. Models 1 and 2 present interactions with the absolute regional income condition, while models 3 and 4 estimate three-way interactions by adding the relative regional income condition. As Table 4 demonstrates, there is no evidence for the moderating role of territorial identification across all model specifications. This poses questions for the identification approach in the inter-territorial redistribution literature.
OLS estimates of treatment effects on support for inter-territorial redistribution, interactions with territorial identification
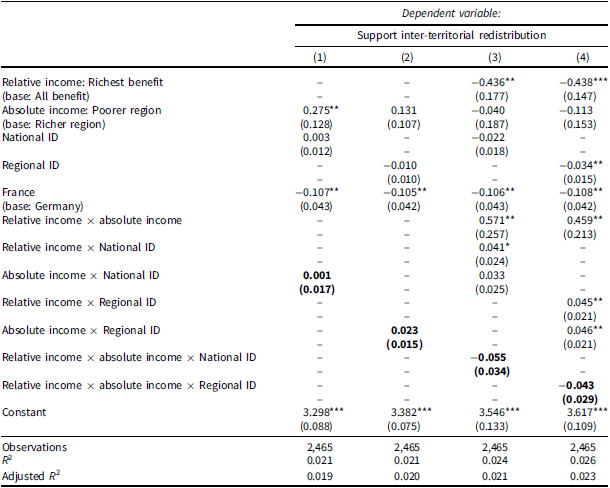
Table 4. Long description
The table presents OLS estimates of treatment effects on support for inter-territorial redistribution, focusing on interactions with territorial identification. It includes four models, each examining different interactions of treatment conditions with individuals’ regional and national identity. Models 1 and 2 present interactions with the absolute regional income condition, while models 3 and 4 estimate three-way interactions by adding the relative regional income condition. The table has 18 rows and 5 columns, with column headers including Relative income, Absolute income, National ID, Regional ID, and France. Row labels are not explicitly provided but include various interaction terms and their coefficients. Notable trends include the lack of evidence for the moderating role of territorial identification across all model specifications, which raises questions for the identification approach in the inter-territorial redistribution literature.
Note: *p < 0.1; **p < 0.05; ***p < 0.01.
The role of local context
As already outlined in the research design section above, the effectiveness of the factorial experiment could hinge on the local economic context. Respondents might find information about regional inequality and economic gains more or less convincing depending on the actual economic situation in their region of residence. As presented in Table A2 of the Appendix, the treatment effects are independent of the actual level of regional wealth of a respondent’s area of residence. This is true for alternative levels of aggregation in the regional GDP per capita data (NUTS3 and NUTS2). However, other local economic contexts than the general wealth divide captured by GDP might be relevant for individuals’ political preferences. Especially highly salient and visible local economic trends might have affected treatment uptake.
One contextual factor that recently has received great attention in political economy is the decline of the manufacturing sector in advanced industrialized democracies (Broz, Frieden, and Weymouth Reference Broz, Frieden and Weymouth2021; Colantone and Stanig Reference Colantone and Stanig2018; Dijkstra, Poelman, and Rodríguez-Pose Reference Dijkstra, Poelman and Rodríguez-Pose2020; Nicoli, Guelen Walters, and Reinl Reference Nicoli, Guelen Walters and Reinl2022). This literature diagnoses a geography of the globalization backlash due to the declining manufacturing sector’s adverse effects on social and economic conditions in affected communities (Broz, Frieden, and Weymouth Reference Broz, Frieden and Weymouth2021). The concentration of import shocks in formerly highly industrialized areas of Western democracies has been highly visible and consequential in socio-economic and political terms (Colantone and Stanig Reference Colantone and Stanig2018; Nicoli, Guelen Walters, and Reinl Reference Nicoli, Guelen Walters and Reinl2022). The associated status decline of manufacturing occupations, therefore, is one important explanation for the current polarization of the political landscape in advanced industrialized democracies (Kurer Reference Kurer2020).
Given the importance of the economic transformations in the manufacturing sector for current political conflicts, local manufacturing might be a more visible and salient economic factor that shapes treatment uptake about economic gains and regional inequality. We, therefore, interacted the treatment with a measure of regional change in manufacturing, captured by the percentage change in local manufacturing employment shares over the past five years.Footnote 10 Figure 5 presents marginal effects for a three-way interaction between the factorial treatment and local manufacturing shares (see Table A4 in the Appendix for the full regression results). Overall, manufacturing shares did decline in most areas in Germany and France. Our main finding of a significant interaction between absolute income and relative income holds in contexts of average decline (manufacturing share change = −5.17) and no decline (manufacturing share change = −0.95). However, in areas with pronounced manufacturing decline (manufacturing share change = −9.39), the role of relative regional income ceases to matter for redistributive support. This suggests that respondents in areas with strong signals of absolute economic decline are not convinced by the experimental manipulation of relative regional income gains. We interpret this as a reassuring sign that objective economic conditions matter for inter-territorial redistributive preferences. However, while broader measures of regional wealth (e.g., GDP per capita) have not affected our treatments, more visible and pronounced local economic changes are able to trump our hypothetical vignettes and produce effects that are in line with the self-interest-based approach. These empirical patterns fit well with existing evidence on the importance of clarity and local proximity of economic conditions for political behavior (Bisgaard, Dinesen, and Sønderskov Reference Bisgaard, Dinesen and Sønderskov2016).
Marginal average treatment effect of absolute regional income plotted over relative income scenarios and actual local changes in manufacturing employment.
Note: Three-way interaction plot based on regression results presented in Table A4 in the Appendix. The plot depicts the marginal effect of being in the poorer absolute regional income condition relative to the richer absolute regional income condition. The interaction of absolute with relative regional income ceases to be relevant for areas with particularly strong manufacturing decline.
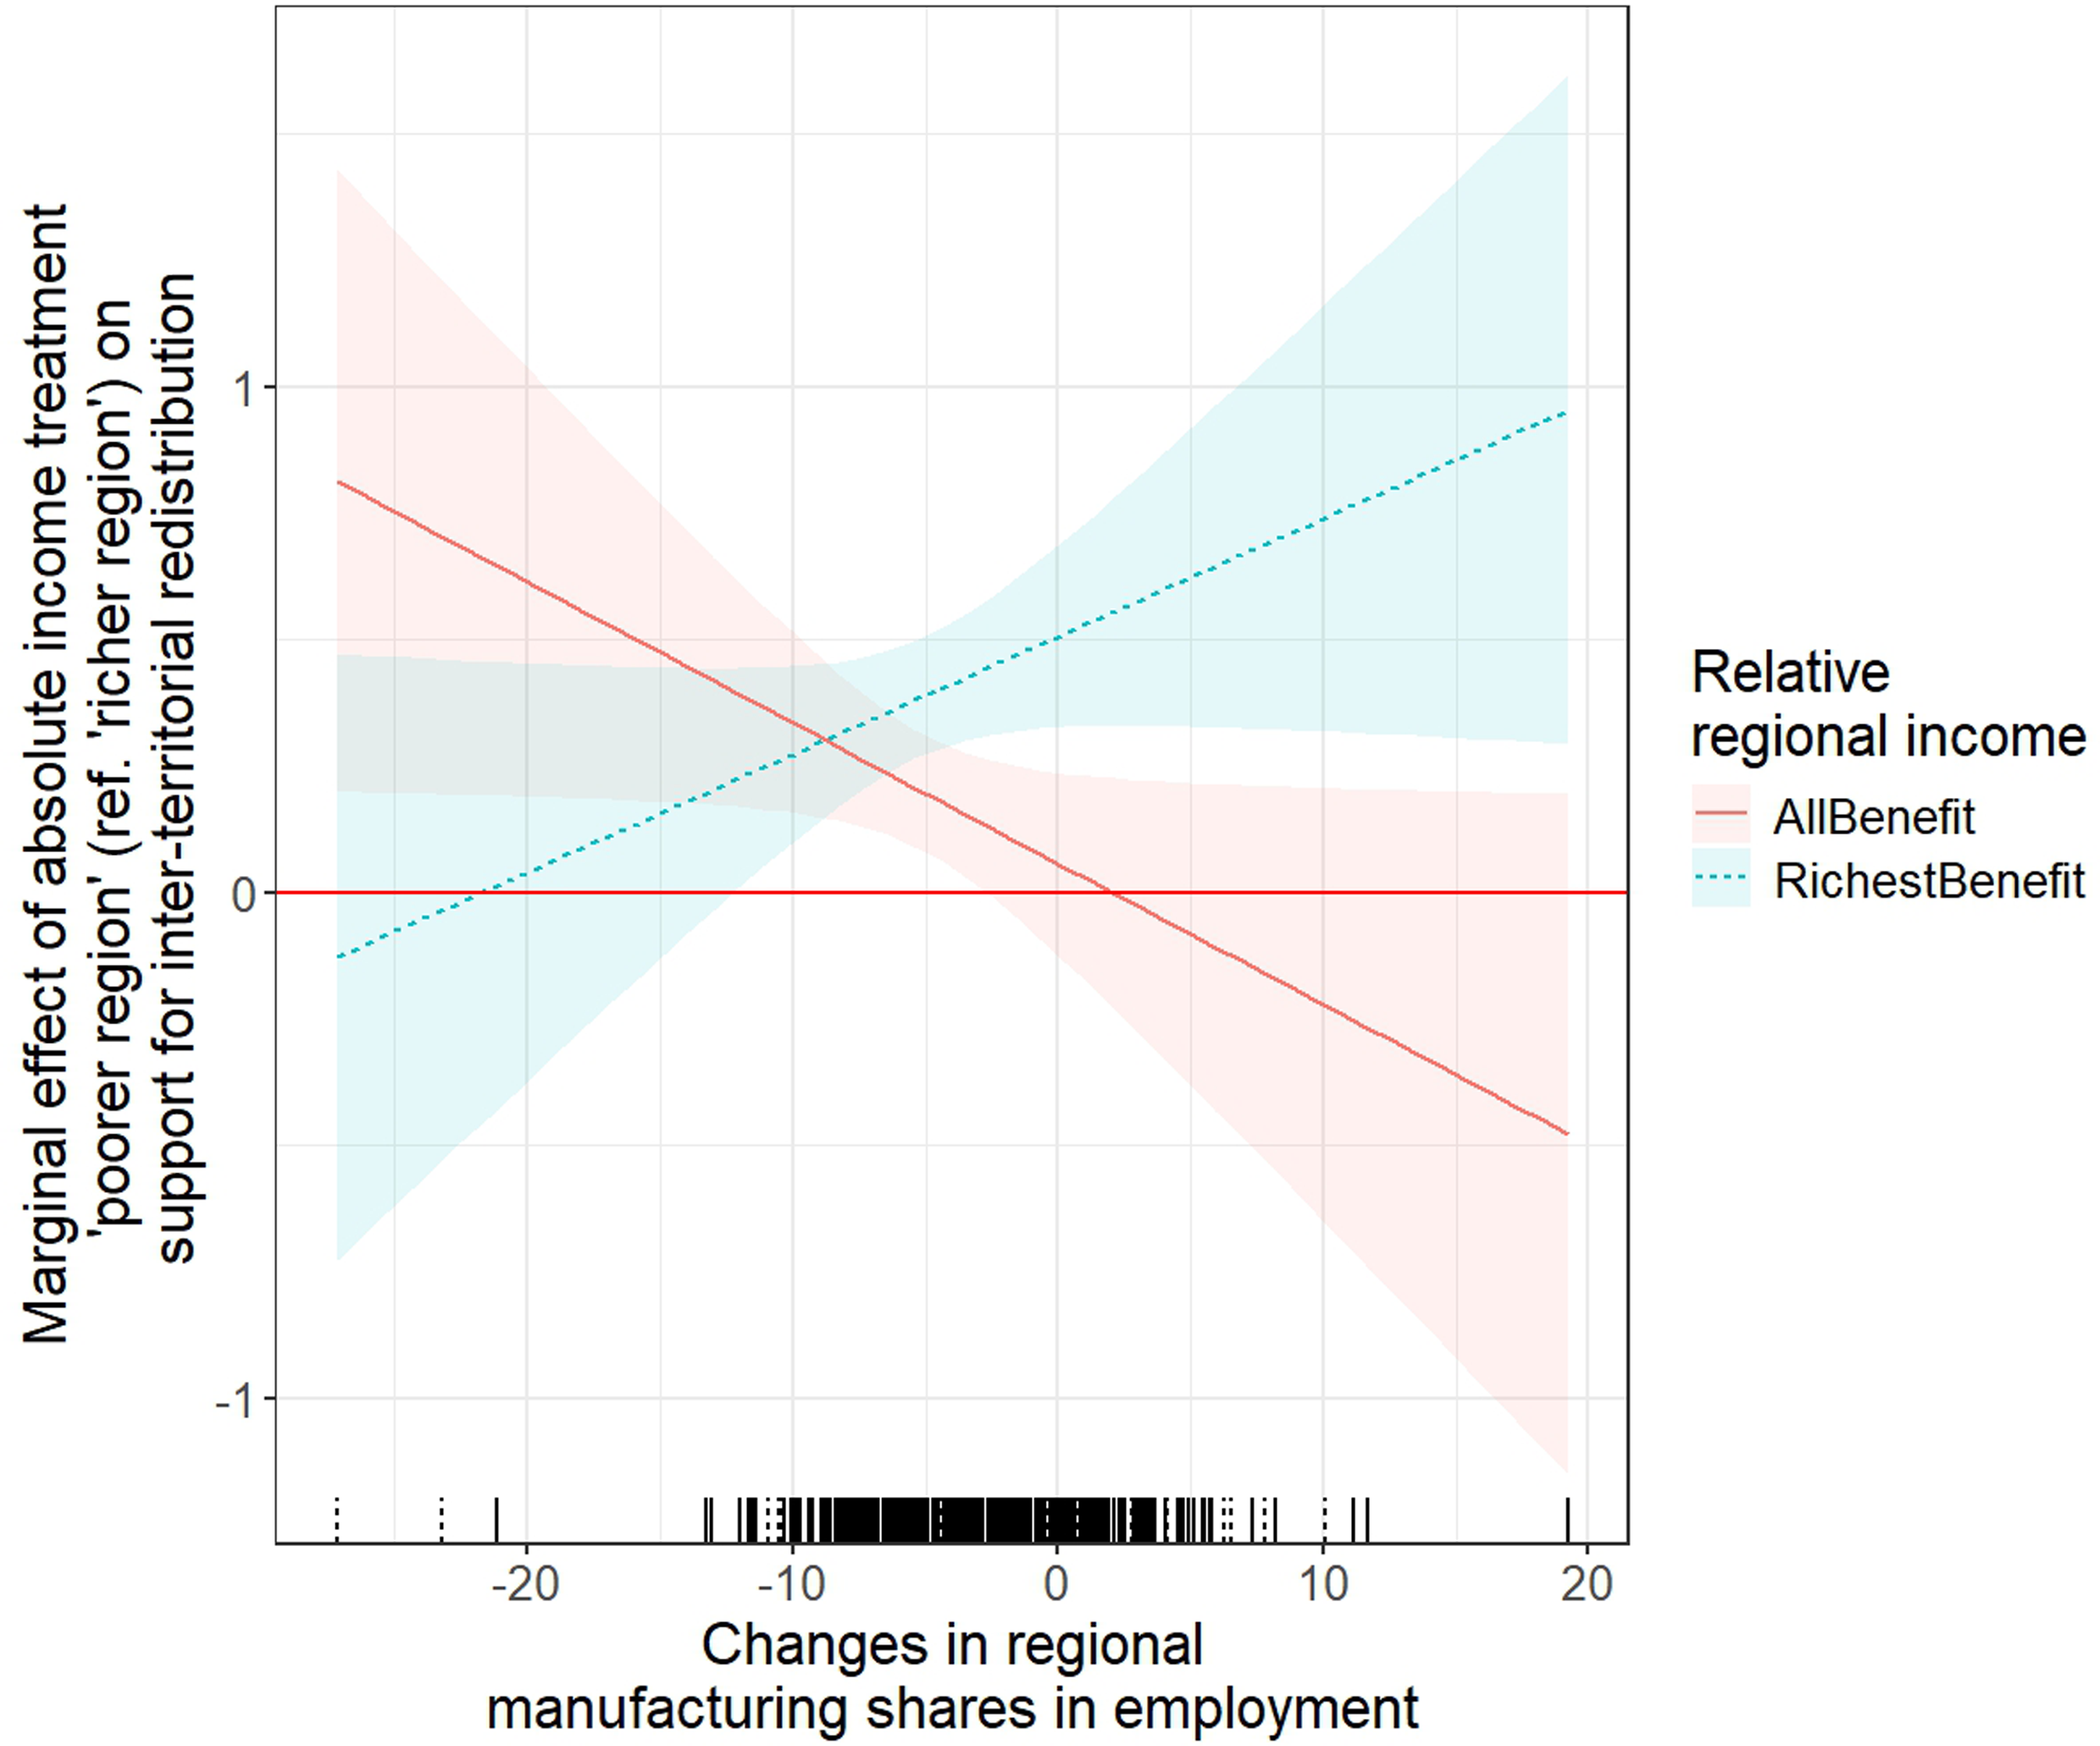
Figure 5. Long description
The line graph presents the marginal effect of absolute income treatment on support for inter-territorial redistribution, plotted against changes in regional manufacturing shares in employment. The x-axis represents changes in regional manufacturing shares in employment, ranging from -20 to 20. The y-axis represents the marginal effect of absolute income treatment, ranging from -1 to 1. Two data lines are shown: one for ‘AllBenefit’ in red and another for ‘RichestBenefit’ in blue. The ‘AllBenefit’ line shows a negative slope, indicating a decrease in support for inter-territorial redistribution as manufacturing shares increase. The ‘RichestBenefit’ line shows a positive slope, indicating an increase in support for inter-territorial redistribution as manufacturing shares increase. The shaded areas around the lines represent confidence intervals. The graph includes a legend on the right side, indicating the relative regional income scenarios. The bottom of the graph shows a rug plot representing the distribution of data points along the x-axis. All values are approximated.
Finally, we assess the robustness of our experimental results across different places of residence. The distributive grievances activated by our vignette treatments are often assumed to be of particular concern to peripheral and rural areas (Cramer Reference Cramer2016). Indeed, political polarization across the urban-rural divide in Europe seems to be asymmetric, as urbanites are more weakly mobilized by economic grievances (Haffert, Palmtag, and Schraff Reference Haffert, Palmtag and Schraff2024). We therefore analyze how the degree of urbanization of a respondent’s residential context conditions our treatment effect. For this, we have merged Eurostat’s DEGRUBA (Degree of Urbanization) classification to our experimental data, classifying respondents’ postcode area of residence as either ‘city’, ‘semi-densely populated area’, or ‘rural area’.Footnote 11
Figure A2 in the Appendix shows that the interactive treatment effects are most pronounced for respondents from semi-densely populated and rural areas, while the interaction is much weaker for city dwellers. While city residents still polarize around absolute regional inequalities as relative income gains are skewed towards richer areas, the effects are much smaller and marginally significant. The reduced statistical significance is, of course, also due to reduced statistical power in this subsample analysis. The effects are much more pronounced for non-city residents, showing that especially individuals outside the larger cities respond to the distributive grievances implied by the experimental design. Hence, while the overall direction of the treatment effects is similar across the urban and rural subsamples, we see a stronger reaction to our regional income inequality treatments in semi-densely populated and rural areas.
External validity
Finally, we provide further validity checks for our empirical results by considering external validity concerns and potential limitations due to case selection. Our case selection follows the idea of purposive variation, as outlined in the research design part above. A more systematic approach would have been the recently developed synthetic purposive sampling (SPS) estimator (Egami and Lee Reference Egami and Lee2024), which, however, was not available at the time this study was designed. The SPS method by Egami and Lee (Reference Egami and Lee2024) selects diverse cases such that non-selected cases are well approximated by the weighted average of the selected cases, building on ideas from the synthetic control method. Even though this approach is intended for case selection prior to data collection, we can use an SPS analysis to provide the reader with a more systematic idea of where our two cases lie in the overall case universe.
Appendix Figure A4 presents the output of an SPS analysis, using five country-level variables from 28 European countries from the 2022 Comparative Political Dataset (Armingeon, Engler, Leemann et al. Reference Armingeon, Engler, Leemann and Weisstanner2025), reflecting the case selection strategy outlined above. Specifically, we stratify case selection by federalism and electoral system and additionally include socio-economic variables on unemployment, political representation, and income inequality. Based on this, the method suggests France and Switzerland as the two most representative cases, meaning that the German case might not have been the most representative choice. The SPS Figure A4 shows where Germany, France, and Switzerland are located in the multivariate distribution of the case universe, demonstrating that Germany is located rather close to the Swiss case. This suggests that while the SPS method does not recommend Germany as the optimal choice, the comparative data suggest that Germany and Switzerland could serve similar purposes in this case selection exercise. The SPS plot also visualizes how our case selection currently falls short in covering potentially relevant cross-country variation. France and Germany, for example, have moderate levels of income inequality, both representing the most ‘typical’ condition for Europe. Future studies might want to vary case selection more strongly on this dimension to probe the external validity of our findings.
Moreover, following the advice by Egami and Hartman (Reference Egami and Hartman2023), we considered several dimensions of external validity, such as sample-, treatment-, outcome-, or context-based external validity concerns. We adjusted potential imbalances in our samples using covariate adjustments in our main regression analyses (so-called X-validity). More advanced adjustment methods, such as doubly robust estimation of the T-PATE as recommended by Egami and Hartman (Reference Egami and Hartman2023), are currently not available for our factorial experimental design. Our study does not have a variation in treatment design, as treatments were administered in the same way in both countries. But future studies should carefully consider potential variations in treatment design choices (the so-called T-validity).
We also already tested treatment effects for our alternative outcome (unfairness perception), referring to so-called Y-validity. However, we have so far not considered potential heterogeneity in treatment effects across the two countries – France and Germany.Footnote 12 The so-called contextual exclusion restriction (C-validity) assumes that the causal effect is the same regardless of context, which is violated if context moderators condition the mechanism relating treatment and outcome (Egami and Hartman Reference Egami and Hartman2023). As our theory and pre-analysis plan specify fairness perceptions as a mediating variable, we provide a more detailed analysis of causal mechanisms across our two contexts in the Appendix. As Table A7 in the Appendix shows, separate analyses for France and Germany suggest heterogeneity in effects, as there is no clear interactive effect on redistributive support in France but a significant interactive effect on fairness perceptions. In contrast, there is no clear interactive effect on fairness perceptions in Germany, but a significant interactive effect on redistributive support.
To more explicitly estimate the mechanisms across the two country contexts, we estimate a moderated-mediation analysis for each country sample. In Figure A5 of the Appendix, we estimate the effects of absolute inequality on fairness (mediator) and redistributive support (outcome), moderated by relative inequality, using the mediation method by Imai, Keele, and Tingley (Reference Imai, Keele, Tingley and Yamamoto2011). This is a more complex analysis, but it is closest to our pre-registration and the theoretical argument (e.g., fairness as a mediator). The results show that in both contexts (France and Germany), absolute inequality (poorer-region condition) increases unfairness perceptions and demand for redistribution in the presence of unequal relative gains across regions. Under the equal relative gains condition, the mediation via fairness loses relevance, and effects are more heterogeneous across the two countries. These analyses show that our central finding – the polarization of redistributive preferences and fairness concerns under unequal relative regional income gains – holds similarly in both contexts.
Observational results
The experimental results from France and Germany provide for a causally valid test of our pre-registered hypothesis about the interactive relationship between relative and absolute regional income. However, the hypothetical nature of the survey experiment and its limitation to two Western European countries raise important questions about the external validity of our findings. We therefore proceed by presenting observational findings from a multi-level regression of inter-territorial redistributive support in nine European countries, using the data outlined in the research design section above.
Table 5 shows that relative regional income, as measured by the growth gap (2012–2022) of a region towards the country’s richest region, and absolute regional income, measured as regional GDP per capita in 2022, have a statistically significant and negative interaction term. Controlling for individual-level characteristics and regional population density, the effect of absolute regional income appears to depend on the nature of relative regional income gains.
Multi-level linear regression estimates of absolute and relative regional income on support for inter-territorial redistribution
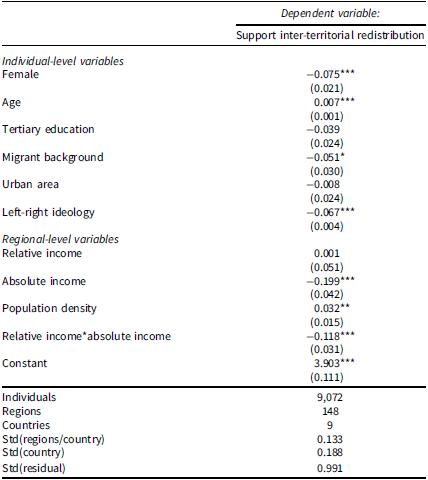
Table 5. Long description
The table presents a multi-level linear regression analysis of how absolute and relative regional income influence support for inter-territorial redistribution. It includes individual-level variables such as gender, age, education, migrant background, urban area, and left-right ideology, as well as regional-level variables like relative income, absolute income, and population density. The table shows coefficients and standard errors for each variable, indicating their impact on the dependent variable. Notable trends include the negative effect of absolute income and the interaction between relative and absolute income on support for redistribution.
Note: *p < 0.1; **p < 0.05; ***p < 0.01.
All regional variables are centered around the mean and standardized by the standard deviation; Std = Standard Deviation.
Figure 6 plots predicted probabilities for a substantive interpretation of the interaction effect and shows that regional differences in absolute income result in similar levels of redistributive demand as regions have grown more equally in the past ten years. Yet, demand for inter-territorial redistribution polarizes around absolute regional income divides as people reside in contexts with more unequal gains in relative regional income. The observational data, therefore, clearly indicate that as relative regional income gains become more unequal, richer regions become less supportive of redistribution, while poorer regions become more supportive. These findings align well with our experimental results and provide additional support to our theoretical argument.
Predicted probabilities of inter-territorial redistributive support over relative and absolute regional income, observational data from nine European countries.
Note: This plot is based on the regression results with observation data presented in Table 5. Relative and absolute income measures are standardized by standard deviation and centered around the mean.

Figure 6. Long description
A line graph displays the predicted probabilities of support for inter-territorial redistribution over relative and absolute regional income. The x-axis represents relative income, measured as the gap in a region’s growth in gross domestic product per capita from 2012 to 2022 compared to the richest region. The y-axis represents the predicted probability of support for inter-territorial redistribution. Three lines represent different levels of absolute income, measured as regional gross domestic product per capita in 2022, standard deviation. The solid line represents one standard deviation below the mean, the dashed line represents the mean, and the dotted line represents one standard deviation above the mean. The solid line shows an upward trend, indicating that support for inter-territorial redistribution increases with relative income. The dashed line remains relatively flat, indicating a constant level of support regardless of relative income. The dotted line shows a downward trend, indicating that support for inter-territorial redistribution decreases with relative income. All values are approximated.
Conclusion
How do regional economic inequalities cause distributive grievances and polarize voters’ economic preferences? This paper demonstrates that the polarization of inter-territorial distributive preferences is driven by a combination of inequality in absolute and relative regional income. We propose that differences in relative regional income condition the effect of absolute regional income on redistributive demand, as the geographic distribution of future economic opportunities shapes individuals’ assessment of regional inequality and its fairness. Inequality in absolute regional income strongly polarizes support for inter-territorial redistribution under contexts of unequal relative regional income gains. Contexts of more equal relative income gains, however, diminish the role of absolute income for explaining redistributive preferences.
Using a factorial survey experiment in France and Germany, we show that absolute regional inequality is an important determinant of preferences for inter-territorial redistribution if relative income is skewed towards the richest areas. This effect is mainly driven by decreased solidarity among richer areas if they reap disproportionate economic gains. Absolute regional inequality, however, loses relevance for redistributive preferences as all regions’ income grows more equally, demonstrating that equality in relative regional income gains can unite poor and rich areas in their redistributive preferences. We also find that individual income conditions these effects, while we find no support for the role of territorial identification. The interactive relationship between absolute and relative regional income is further supported by results from a multi-level linear regression with observational data from nine European countries.
These findings advance our knowledge of how inter-territorial redistributive issues become polarized in democratic societies. Self-interest-based explanations of inter-territorial redistributive preferences are highly relevant in contexts of unequal relative income gains across regions. This suggests that inter-territorial inequalities can become politically polarized as territories gain asymmetrically from economic growth, a pattern that has been characteristic of many Western European countries in recent decades (Schraff and Pontusson Reference Schraff and Pontusson2024). There is, in contrast, a smaller potential for inter-territorial redistributive conflict as relative regional income is more equally distributed among areas, as we found a depolarization of redistributive conflict under this scenario.
The contexts of (or the perception of a) rather equally shared economic growth across territories and the behavioral consequences documented in this study, therefore, could be one promising explanation for the persistence of regional inequalities in many democracies. Future research should try to relate these findings to the supply side of politics, investigating how politicians’ and parties’ portrayals of regional inequalities affect the activation of economic grievances in public opinion. It is important to note that our case selection has likely not shown the full potential of inter-territorial redistributive politics, as countries with important sub-state nationalist movements will probably show an even stronger polarization over inter-territorial redistribution, as local political elites are likely to mobilize more intensely around inter-territorial distributive conflicts.
Our empirical findings add to existing academic debates about individual income, territorial identification, and demand for inter-territorial redistribution. While we could show that individual income conditions the effect of regional wealth in line with self-interest-based arguments (Balcells, Fernández-Albertos, and Kuo Reference Balcells, Fernández-Albertos and Kuo2015), we do not find a moderating role of territorial identification (Holm and Geys Reference Holm and Geys2018). This raises important questions on the nature of in-and out-group concerns that might shape support for inter-territorial redistribution. While we do not find support for the relevance of other-regarding preferences among people with strong federal identities, we show that self-interest-driven concerns for in-group benefits are dominant as people in rich areas appear to defend their advantaged position. This raises important questions about the conditions that might generate in-and out-group concerns about inter-territorial redistribution, which promises to be an important avenue for future research. Here, the non-finding on the role of territorial identification might also be a result of an important limitation of our experimental design. Our experiment presents inequalities as objectively given (e.g., ‘data shows’) – providing a rather clean way to test the interactive effect. Yet, in real-world settings, political actors usually frame inequality issues in various ways to mobilize political support. Relating regional inequalities to social group identities can be an effective political mobilization strategy (Haffert, Palmtag, and Schraff Reference Haffert, Palmtag and Schraff2024), which future research could integrate with this study’s findings about the interactive effect of relative and absolute inequalities on political preferences.
Supplementary material
The supplementary material for this article can be found at https://doi.org/10.1017/S1475676526101339.
Data availability statement
All data and code are publicly available on the Harvard Dataverse: https://doi.org/10.7910/DVN/MIGWSK.
Acknowledgements
For helpful feedback on earlier drafts, I thank all participants in seminars held at the Department of Society and Politics at Aalborg University and the European Politics group at ETH Zurich. Finally, I thank the three anonymous reviewers for their insightful and constructive feedback.
Funding statement
Data collection was financed by an Ambizione Grant from the Swiss National Science Foundation (grant number 186002).
Competing interests
The author has no conflicts of interest to declare.
Ethical standards
The experimental research design was approved by the Ethics Commission of ETH Zurich (under ref. 2022-N-221).
AI statement
The author declares that he has used AI to improve formulations and check spelling mistakes. AI was not used for any other aspect of the research, including the development of the research question, analysis, interpretation of results, or manuscript writing.
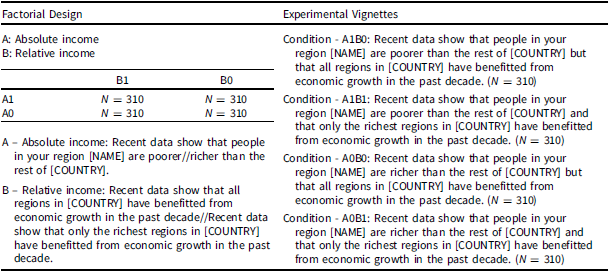

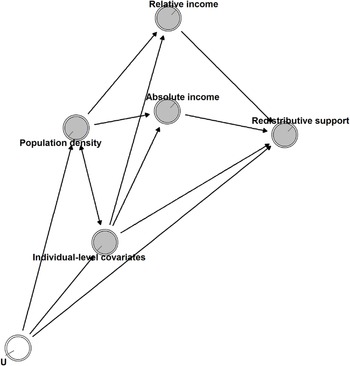
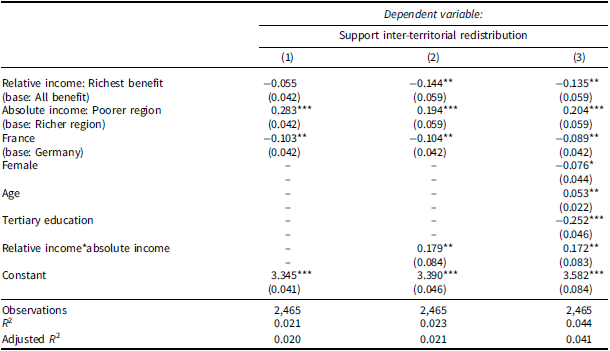
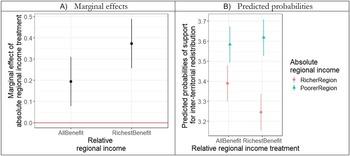
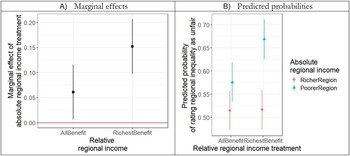

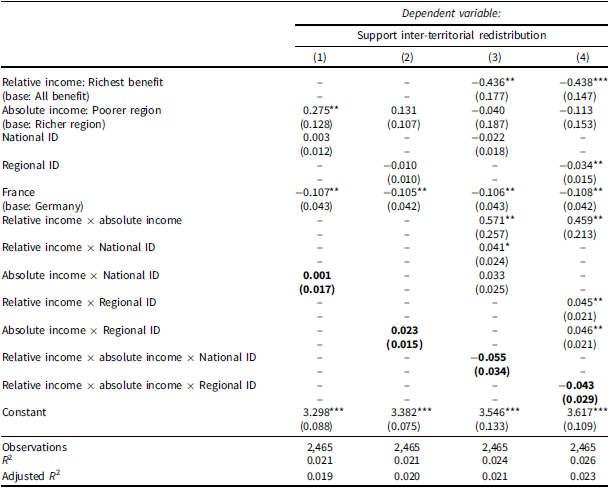

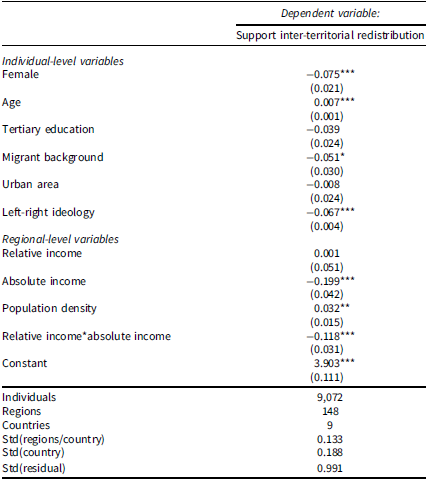


 Open access

