


Introduction
Integrating nature and green space into urban landscapes is a growing social challenge. Over 80% of the U.S. population resides in urban areas, where local officials and policymakers are increasingly looking for ways to protect and expand access to green spaces (Hobbs Reference Hobbs2002, U.S. Census Bureau 2023). These efforts are motivated by benefits such as improved air, water quality, the ability to negate urban heat islands, and spaces for recreation that promote physical and mental well-being (Young Reference Young2010, Nowak et al. Reference Nowak2013, Bertram and Rehdanz Reference Bertram and Rehdanz2015, Gunawardena et al. Reference Gunawardena, Wells and Kershaw2017, Borsky et al. Reference Borsky, Fesselmeyer and Vogelsang2024). An implicit assumption appears to be that most, if not all, residents will benefit from efforts to increase urban green space.
However, socioeconomic differences among households can produce sorting patterns across neighborhoods that result in distributional inequities in public goods, with some groups enjoying greater access to higher-quality amenities. Renters represent a population especially vulnerable to these inequities. They comprise approximately 36% of U.S. households, 48% of whom identify as members of a racial minority group, and their median income is roughly half that of homeowner households (Thompson Reference Thompson2023). This suggests that household preferences for public amenities likely vary by housing tenure, income level, and racial or ethnic identity. When homeowners make location decisions, they account for future expectations of neighborhood quality, whereas renters, being more mobile, are likely more concerned with current amenity levels. These groups face different preferences and trade-offs given income levels, budget constraints, cultural ties, and idiosyncratic tastes for neighborhood quality. While there is a wealth of literature valuing public goods like open space using property transactions, these studies elicit the revealed preferences of homeowners, leaving those of renters unexamined in comparison (Irwin Reference Irwin2002, Anderson and West Reference Anderson and West2006, Black Reference Black2018, Blanchette et al. Reference Blanchette, Lang and VanCeylon2021, Lang et al. Reference Lang, VanCeylon and Ando2023). Moreover, these approaches rarely account for how unobserved racial or ethnic preferences and structural constraints may affect choices and access to public goods. The dollar value that renters place on public amenities when choosing where to live is essential for policymakers and urban planners seeking to ensure equitable access to environmental amenities.
This study estimates renter willingness to pay (WTP) for urban green space in Boston using a sorting model framework and neighborhood-level data on census, transit, and other local amenities. The results suggest that renter households are WTP between $1.17 and $1.64 for each additional percentage point of green space in their location decisions. To assess differences in WTP across groups, I separately examine the moving decisions of white and minority renter households. While baseline WTP for green space is similar across groups, disparities in sorting behavior emerge when accounting for preferences over different types of green space and complementary effects. Overall, I estimate that green space provided over $6.9 million in economic benefits to renters during the study period, with white renters receiving approximately 20% more in benefits per household than minority renters. I conclude with a descriptive partial equilibrium welfare analysis, which suggests that more equitable outcomes could be achieved through targeted green space expansion policy.
This research builds on non-market valuation studies that use hedonic price models to compare owner and rental housing market responses to changes in public goods, including environmental amenities such as air and water quality (Grainger Reference Grainger2012, Bento et al. Reference Bento, Freedman and Lang2015, Lang Reference Lang2015, Mei et al. Reference Mei, Liu and Gao2023) and disamenities like Superfund sites (Greenstone and Gallagher Reference Greenstone and Gallagher2008). Identifying renter WTP for amenities using hedonic models is challenging, as price changes may not fully pass through from landlords to tenants (Grainger Reference Grainger2012), and rising rents can also represent financial burdens rather than clear indicators of value (Lang and VanCeylon Reference Lang and VanCeylon2025a). Additionally, hedonic models often rely on property price data, which are frequently unavailable or costly for rental markets. As a result, many studies depend on census-based measures of median rent, despite its poor reflection of actual market prices (Bishop et al. Reference Bishop2020) and limited capacity to capture the value of spatial amenities compared to other price indices (Banzhaf and Farooque Reference Banzhaf and Farooque2013). To address these limitations, I apply a residential sorting model that leverages population changes across locations over time to estimate renter WTP for green space, public transit, and multiuse paths – amenities that have largely been examined for homeowners (Armstrong and Rodriguez Reference Armstrong and Rodriguez2006; Ohler and Blanco Reference Ohler and Blanco2017).Footnote 1
This paper also contributes to the literature on environmental justice and is motivated by the unequal distribution of green space across socioeconomic and racial groups (Banzhaf et al. Reference Banzhaf, Ma and Timmins2019, VanCeylon and Melstrom Reference VanCeylon and Melstrom2025). Minority and lower-income communities often have less access to protected land (Sims et al. Reference Sims2022) and receive fewer benefits from conservation efforts (Lang et al. Reference Lang, VanCeylon and Ando2023). Renters, who are disproportionately lower-income and racially diverse, may face greater barriers to accessing high-quality environmental amenities. In Boston, for example, although all residents live within a 10-minute walk of a park and nearly 19% of the city’s land is dedicated to recreation, significant disparities remain: low-income neighborhoods have 10% less park space per person than the citywide average, while Black and Hispanic neighborhoods experience 9% and 25% less, respectively (Trust for Public Land 2024). The sorting model employed in this study allows for the identification of heterogeneous preferences for green space between white and minority renters, offering insight into the value placed on urban environmental amenities and the resulting patterns of residential mobility. By calculating group-specific welfare estimates, the analysis reveals substantial economic disparities in the distribution of green space benefits, insights that are essential for informing more equitable urban planning and policy design.
Methods
Sorting model
My approach to identifying renter preferences for urban green space uses a sorting model that leverages aggregate population data (Depro et al. Reference Depro, Timmins and O’neil2015, Melstrom and Mohammadi, Reference Melstrom and Mohammadi2022). The model describes the probability of renters moving across the greater Boston area between 2014 and 2018.Footnote 2 Moving is a function of the mean utility in location k,
 $${\delta _k} = f\left( {{X_k},{\xi _k};\beta } \right)$$
where
 ${\delta _k}$
is a function of observable location attributes
${\delta _k}$
is a function of observable location attributes
 ${X_k}$
, unobserved characteristics
${X_k}$
, unobserved characteristics
 ${\xi _k}$
, and parameters
${\xi _k}$
, and parameters
 $\beta$
. Total utility takes the general form
$\beta$
. Total utility takes the general form
 $${U_{ik}} = {\delta _k} + {\eta _{ik}}$$
where the utility of household i living in location k equals the sum of mean utility
 ${\delta _k}$
and idiosyncratic deviations
${\delta _k}$
and idiosyncratic deviations
 ${\eta _{ik}}$
. Following Depro et al. (Reference Depro, Timmins and O’neil2015), renters move or stay depending on the utility of different locations
${\eta _{ik}}$
. Following Depro et al. (Reference Depro, Timmins and O’neil2015), renters move or stay depending on the utility of different locations
 $${U_{ij}} - {U_{ik}} = \left( {{\delta _j} - {\delta _k}} \right) - \mu M{C_{j,k}} + ({\eta _{ij}} - {\eta _{ik}})$$
where the coefficient
 ${\mu}$
measures the marginal disutility of moving cost
${\mu}$
measures the marginal disutility of moving cost
 $M{C_{j,k}}\;$
which can be interpreted as the marginal utility of income. For renters who do not move there is no change in utility and no associated moving costs. Assuming renters move to the location with the highest utility and that
$M{C_{j,k}}\;$
which can be interpreted as the marginal utility of income. For renters who do not move there is no change in utility and no associated moving costs. Assuming renters move to the location with the highest utility and that
 ${\eta _{ik}}\;$
is i.i.d. Type I extreme value, then the population share of renters who move from k to j can be written as the sum of move shares to j over the preceding period,
${\eta _{ik}}\;$
is i.i.d. Type I extreme value, then the population share of renters who move from k to j can be written as the sum of move shares to j over the preceding period,
 $$\sigma _j^{2018} = {\mathop \sum \limits_{k = 1}^{N + 1} \left( {\frac{{{e^{\left( {{\delta _j} - {\delta _k} - \mu M{C_{j,k}}} \right)}}}}{{\mathop \sum \nolimits_{l = 1}^N {e^{\left( {{\delta _l} - {\delta _k} - \mu M{C_{l,k}}} \right)}}}}} \right)\sigma _k^{2014}}$$
where
 $\sigma _l^t\;$
is the share of renters living in a location l in period t,
$\sigma _l^t\;$
is the share of renters living in a location l in period t,
 $\sigma _l^t = {{pop_l^t}}{{TOTPOP}}$
. N is the number of locations that also includes a catch-all location representing moves in and out of the greater Boston area. To achieve identification, an additional equation is needed for the population share of renters that did not move,
$\sigma _l^t = {{pop_l^t}}{{TOTPOP}}$
. N is the number of locations that also includes a catch-all location representing moves in and out of the greater Boston area. To achieve identification, an additional equation is needed for the population share of renters that did not move,
 $$Share\;Stay = \;{{{\mathop \sum \nolimits_{k = 1}^N {s_{jj}}\;pop_j^{2018}}}\over{{\mathop \sum \nolimits_{l = 1}^N pop_j^{2014}}}}$$
where
 ${s_{jj}}$
is the share or renters that stay in j and
${s_{jj}}$
is the share or renters that stay in j and
 $pop_j^t\;$
is the population in location j in period t.
Footnote
3
Thus, we now have a system of N+1 equations to estimate the mean utilities
$pop_j^t\;$
is the population in location j in period t.
Footnote
3
Thus, we now have a system of N+1 equations to estimate the mean utilities
 ${\delta _j}$
and the moving cost parameter
${\delta _j}$
and the moving cost parameter
 $\mu $
.
$\mu $
.
To solve this system of equations, estimates of
 ${\delta _j}$
and
${\delta _j}$
and
 $\mu $
are required to satisfy Equations (4) and (5). First, population shares (
$\mu $
are required to satisfy Equations (4) and (5). First, population shares (
 $pop_j^t)\;$
are gathered from census data measuring the share of renters in each location in 2014 and 2018. The catch-all location is assigned two times the value of the change in renter population for the greater Boston area representing the population outside the research area.Footnote
4
The share of renter households in the greater Boston area who do not move from 2014 to 2018 are identified from responses in the ACS macrodata. I construct a moving cost index that calculates moving costs between every origin and destination location, which I describe in the following section. Finally, I normalize one location’s mean utility to zero and make an initial guess for
$pop_j^t)\;$
are gathered from census data measuring the share of renters in each location in 2014 and 2018. The catch-all location is assigned two times the value of the change in renter population for the greater Boston area representing the population outside the research area.Footnote
4
The share of renter households in the greater Boston area who do not move from 2014 to 2018 are identified from responses in the ACS macrodata. I construct a moving cost index that calculates moving costs between every origin and destination location, which I describe in the following section. Finally, I normalize one location’s mean utility to zero and make an initial guess for
 ${\delta _j}$
and
${\delta _j}$
and
 $\mu $
. A contraction mapping procedure, based on Depro et al. (Reference Depro, Timmins and O’neil2015) and outlined in Berry (Reference Berry1994), updates guesses of
$\mu $
. A contraction mapping procedure, based on Depro et al. (Reference Depro, Timmins and O’neil2015) and outlined in Berry (Reference Berry1994), updates guesses of
 ${\delta _j}\;$
until
${\delta _j}\;$
until
 $\left| {\delta _j^{m + 1} - \delta _j^m} \right| \lt {10^{ - 8}}\;\forall \;\;j$
, where m is the number of iterative guesses after the initial guess. I use a bisection method to find values of
$\left| {\delta _j^{m + 1} - \delta _j^m} \right| \lt {10^{ - 8}}\;\forall \;\;j$
, where m is the number of iterative guesses after the initial guess. I use a bisection method to find values of
 $\mu $
that match the predicted and actual shares of renters who stay in the same location, re-solving for
$\mu $
that match the predicted and actual shares of renters who stay in the same location, re-solving for
 ${\delta _j}\;$
during each iteration.
${\delta _j}\;$
during each iteration.
I first estimate this model using the moving decisions of all renters in the Boston area, which I refer to as the homogenous preferences model. Then, to identify the preferences of different renter populations, I separate white and minority renter moving decisions and repeat this process, which I refer to as the heterogeneous preferences model. For each group used in my analysis, I recover a vector of group-specific location mean utilities
 $\delta _j^s$
and move cost parameters
$\delta _j^s$
and move cost parameters
 ${\mu^s}$
that are then used in the second-stage regression, described in the following section.Footnote
5
${\mu^s}$
that are then used in the second-stage regression, described in the following section.Footnote
5
The first-stage sorting model estimates location-specific mean utilities that reflect an equilibrium outcome based on observed changes in population shares, implicitly capturing both supply and demand constraints. On the supply side, limited rental availability may restrict migration flows, whereas greater housing supply and lower moving costs facilitate mobility. On the demand side, renters in high-amenity areas may exhibit lower turnover due to higher utility, while elevated rents associated with desirable amenities can further restrict in-migration. My modeling approach accounts for these dynamics in two ways. First, moving costs capture some of the financial barriers and supply-side frictions that may arise in the rental market. Second, to mitigate potential biases the second-stage regression includes a series of controls for prices and public amenities.
Measuring willingness to pay
Using the estimates from the first stage, I convert the group-specific mean utilities
 $\delta _j^s$
into comparable dollar values by dividing each by the corresponding moving cost parameter
$\delta _j^s$
into comparable dollar values by dividing each by the corresponding moving cost parameter
 ${\mu ^s}$
. Let
${\mu ^s}$
. Let
 $\widehat {\delta _j^s} = \frac{{\delta _j^s}}{{{\mu ^s}}}$
. I then run the following regression,
$\widehat {\delta _j^s} = \frac{{\delta _j^s}}{{{\mu ^s}}}$
. I then run the following regression,
 $$\;\widehat {\delta _j^s} = {a^s} + \beta _r^sGreen\;Spac{e_j} + {X_j}\beta _l^s + {\pi _m} + \varepsilon _{j,m}^s$$
where
 $Green\;Spac{e_j}$
measures the percent of green space in block group location j and
$Green\;Spac{e_j}$
measures the percent of green space in block group location j and
 ${X_j}$
is a vector of other location attributes accounting for urban transit, census demographics, and other location amenities. I include tract fixed effects
${X_j}$
is a vector of other location attributes accounting for urban transit, census demographics, and other location amenities. I include tract fixed effects
 ${\pi _m}\;$
to control for tract-specific variables important to renters as well as spatial unobservables. I use the following functional form for the preference parameters,
${\pi _m}\;$
to control for tract-specific variables important to renters as well as spatial unobservables. I use the following functional form for the preference parameters,
 $$\beta _{\left( n \right)}^s = \;{\beta _{\left( n \right),0}} + \;\sum \;{\beta _{\left( n \right),\;k}}\;z_k^\;\;\;\;\;for\;\left( n \right)\; = \left\{ {r,l} \right\}$$
where
 ${\beta _{\left( n \right),0}}$
identifies the WTP for the base group, which I define as white renters, and
${\beta _{\left( n \right),0}}$
identifies the WTP for the base group, which I define as white renters, and
 ${\beta _{\left( n \right),k}}$
measures any deviations in WTP from the base group given
${\beta _{\left( n \right),k}}$
measures any deviations in WTP from the base group given
 $z_k^\;$
, an indicator for minority renters. Equivalent to an interaction term, this functional form expresses the difference in WTP for
$z_k^\;$
, an indicator for minority renters. Equivalent to an interaction term, this functional form expresses the difference in WTP for
 $Green\;Space$
and other location variables
$Green\;Space$
and other location variables
 ${X_\;}$
, between white and minority renters. The parameter on the variable of interest,
${X_\;}$
, between white and minority renters. The parameter on the variable of interest,
 $\beta _r^s\;$
, is identified using within-tract variation. My hypothesis is that renter WTP for green space is positive,
$\beta _r^s\;$
, is identified using within-tract variation. My hypothesis is that renter WTP for green space is positive,
 $\beta _r^\; \gt 0$
, for the homogenous preferences model. For the heterogeneous preferences model I expect white WTP to be greater than, or equal to, minority WTP,
$\beta _r^\; \gt 0$
, for the homogenous preferences model. For the heterogeneous preferences model I expect white WTP to be greater than, or equal to, minority WTP,
 $\beta _r^{white} \geqslant \;\beta _r^{minority} \gt 0$
.Footnote
6
$\beta _r^{white} \geqslant \;\beta _r^{minority} \gt 0$
.Footnote
6
While this study does not focus on a single green space expansion policy or smart growth initiative, there were notable investments in green space during this period. Between 2012 and 2022, per capita green space investment in Greater Boston rose from $105 to $168, and over 190 acres of new parks and recreational land were established between 2014 and 2018 (Trust for Public Land 2024). These changes in green space, together with existing disparities in accessibility, are likely to influence location decisions in ways that the model should capture.
One final consideration when estimating the first stage of the sorting model is identifying the mean utilities of locations with no population. In the main analysis (i.e., the homogenous preferences model), this does not present an issue as only 1.1% of locations have no renters, so I simply drop these locations. However, in the heterogeneous preferences model, 4.8% of locations have no white renters and 23.9% have no minority renters. Locations with zero choices could potentially occur due to block groups being primarily occupied by homeowners (i.e. no rental units), segregation, or other structural barriers (Christensen and Timmins Reference Christensen and Timmins2022). I address this issue in the heterogeneous preferences model by estimating Eq. (6) using censored regression. I use a Tobit model, designating the zero-population locations as lower-limit censored observations (i.e.
 $\delta _{missing}^s = {\rm{min}}\left( {\hat \delta } \right)$
).Footnote
7
$\delta _{missing}^s = {\rm{min}}\left( {\hat \delta } \right)$
).Footnote
7
Data
Population data and moving cost index
The research area for this study is all census block groups within a 20-mile radius around Boston city center.Footnote 8 The primary data used in the first stage sorting model comes from American Community Survey (ACS) census microdata. Census data provides population counts of renter households living in each block group location in the Boston area in 2014 and 2018. I use ACS microdata from IPUMS to estimate the percentage of renter households in the metro area who did not move during this period. Then, I gather cross-tabulated census population estimates to identify renter households that moved or stayed during this period, separately for white and minority households.Footnote 9 Figure 1 displays the distribution of renters across the greater Boston area.
Distribution of renter households in the greater Boston area. Notes: Data come from the 2016 5-year American Community Survey. The research area encompasses a 20-mile radius around Boston city center. White/blank areas are not observed. (N = 2,153).

The first stage estimation of this sorting model requires the construction of a moving cost index, estimating the cost of moving from one location to another. Moving costs cover a series of physical, financial, and psychological costs. For the physical cost of moving, I use the mid-point estimate from moving.com for a 2-3 bedroom apartment for a household moving across the Boston metro of $1,896 (Melstrom et al. Reference Melstrom2022). Given an average move distance of 12 miles for the study area, I estimate a fixed cost of $1,877 with an additional per-mile cost of $1.51 (Melstrom and Hyink Reference Melstrom and Hyink2024). I add to this the opportunity cost of time spent moving for a two-adult household. I assume a total of 8 hours of packing and unpacking for the two adults, and the travel time driving between locations at a rate of 20 miles-per-hour (VanCeylon and Melstrom Reference VanCeylon and Melstrom2025). For the value of moving time, I use the median wage in the Boston metro in 2016 at $33.26/hour. Additionally, for all moves to and from the catch-all location, I assume a fixed cost of $4000 (Melstrom and Mohammadi Reference Melstrom and Mohammadi2022).
I calculate the financial cost of moving as half the median rent in the destination location, representing a non-refundable deposit and capturing general rental price levels. For the catch-all, I use the state-level median rent in Massachusetts in 2016. I also assume a psychological search cost of $20 per mile based on the distance between origin and destination location (Donnelly and Melstrom Reference Donnelly and Melstrom2023). Finally, these costs are all summed and annualized at a 5% discount rate for a time horizon of two years representing the average length of tenure for a renter household (Marlay and Fields Reference Marlay and Fields2010). The final product is a matrix of moving costs between all locations in the study area.
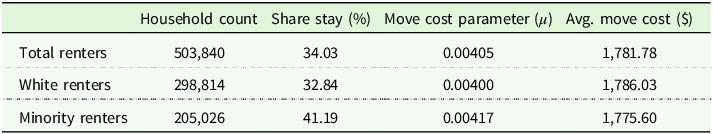
Table 1 presents the summary statistics and estimates used in the first stage estimation procedure. Of the 504 thousand renter households in the greater Boston area, 59% identified as white and 41% as minority. Responses from the ACS microdata indicate that 33% of white renter households remained in their current residence, compared to the 41% of minority renter households who did not move during this period. White households were more mobile during this period and have a lower move cost parameter compared to minority households. Differences in the moving cost parameter may also reflect underlying income disparities, as lower-income minority renters are likely to be more sensitive to the financial costs of relocating.
Summary statistics for renter households

Notes: Stay (%) comes from ACS microdata survey responses on households that did not move between 2014 and 2018. The group-specific move cost parameter (μ) is estimated in the first stage sorting model. White renter households are defined as White and non-Hispanic. Minority renter households are defined as Black, Asian, American Indian, Alaska Native, or Other Race households including Hispanic households. Group-specific average moving costs are calculated from renter move shares from origin to destination locations.
Location characteristics
For the second stage, I characterize locations using 2016 block group attributes from several sources. The Massachusetts Bureau of Geographic Information (MassGIS) provides an extensive array of spatial data for my analysis. These data include information on transportation services, public amenities, and various geographic features. I measure the distance from the centroid of each block group to the nearest hospital, police station, fire station, and airport. I also identify the number of colleges or universities, libraries, and farmers markets within the boundaries of each location. Transportation data include the number of train, bus, and metro stations in each location, as well as information on multiuse trails and paths, which I measure as the total length in miles within each block group location. Lastly, I estimate the amount of water area and the distance to the coast for each location.
From the ACS, I gather data on median income, median rent, percent college educated, percent white population, percent change in minority population (2000–2016), percent unemployment, commute distance, and population density. Next, I construct a measure of school quality using 2016 5th-grade reading and math assessments from the U.S. Department of Education’s EDFacts database. For each block group, I identify the three closest schools and average the percentage of students scoring above a proficient level on math and reading exams as a metric of local school quality. Crime index data comes from the FBI’s uniform crime reporting program. Each block group location is assigned a value based on total violent and non-violent crime counts which is a measure of local crime relative to the national average.
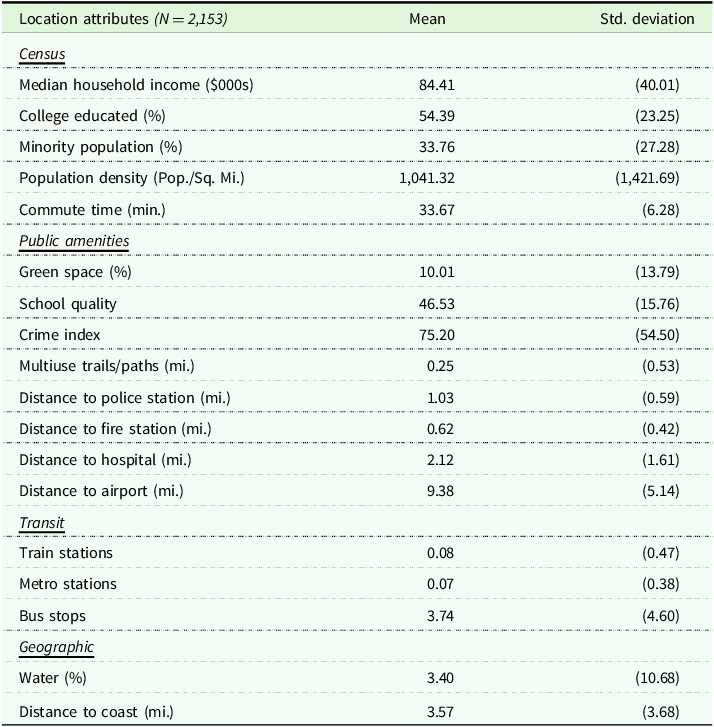
Finally, I collect parcel-level data on green space from MassGIS. These data include the type of land (e.g., parks, greenways, easements, cemeteries, farmland), date of establishment, and parcel size. Using GIS, I calculate the percentage of green space within each block group, which serves as the key explanatory variable in the second-stage model. Summary statistics for green space and selected location characteristics are presented in Table 2.
Summary statistics for locations

Notes: Observations are at the block group level. Transit variables indicate the number of train stations, metro stations, or bus stops for each location. Multiuse trails/paths indicate the length in miles of bike trails or walking paths within a block group. School quality is calculated as the percentage of students scoring proficient or higher on math and reading exams, averaged across tests, then averaged across the three closest schools. Additional location variables (number of libraries, colleges, and farmers markets) are not included in the table due to spatial constraints.
Results
Renter preferences for urban green space
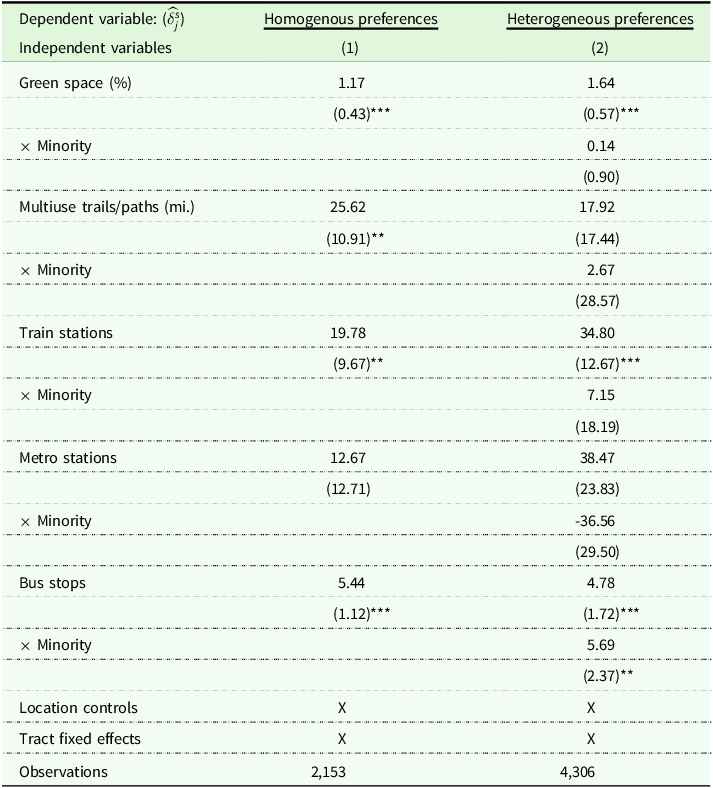
Table 3 presents the second-stage regression results for the homogenous and heterogeneous preference models. The coefficients reported represent a selection of urban amenities, but all models include additional location attributes and tract level fixed effects. Column 1 reports the homogenous preferences model. The coefficient on the variable of interest, Green Space, is positive and statistically significant at the 1% level. This suggests that, on average, renters are willing to pay $1.17 for an additional percentage point of green space in a given location. The other estimates in Column 1 show that renters also value other urban amenities, such as public transit options. On average, renters are willing to pay $19.78 for an additional train station and $5.44 for an additional bus stop. The coefficient on Metro Stations is not statistically different from zero, suggesting renters could be indifferent to metro stations compared to other transit options. The coefficient on Multiuse Trails/Paths is statistically significant at the 5% level and suggests that renters are willing to pay $25.62 for an additional mile of bike paths or walking trails.
Second-stage sorting model results

Notes: Column 2 model is estimated via Tobit specification. Observations are at the block group level. Location controls and minority interactions included in the model but not displayed in the table are median household income, median rent, percent college educated, percent white population, population density, percent change in minority population (2000–2016), commute time, distance to the nearest police station, hospital, fire station, and airport, the number of libraries, colleges, or farmers markets, and percent water. Standard errors clustered at the tract level in parentheses *** p < 0.01, ** p < 0.05, * p < 0.1.
Column 2 presents the heterogeneous preferences model. Parameters specific to white renters are reported with the minority group interactions immediately below. These estimates suggest white renter WTP is $1.64 for an additional percentage point of green space. The interaction between Minority and Green Space is positive at $0.14, and the combined coefficients indicate that total WTP for minority renters is $1.78. However, the interaction is not statistically significant, suggesting little evidence of a difference in WTP for green space between white and minority renters. Results in Column 2 suggest that there are few race-based differences for other urban amenities as well. However, the minority interaction with Bus Stops is positive and statistically significant at the 5% level, suggesting that minority renters value an additional bus stop in their chosen neighborhood; the estimates imply minority WTP is $10.47, which is higher than the white WTP of $4.78.
These estimates are within the range of prior research on renter WTP and green space using hedonic models. Liebelt et al. (Reference Liebelt, Bartke and Schwarz2018) find a renter valuation of $0.48 per additional hectare of proximate urban green space, while Schläpfer et al. (Reference Schläpfer2015) finds a 1% increase in urban park space increases rent prices by approximately $1.62.Footnote 10 My results provide little evidence that white and minority renter WTP are significantly different. Although both groups may value an additional percentage point of green space at approximately $1.64, this amount represents a larger share of income for minority renters, whose median household income is roughly 30–35% lower than that of white households (Thompson Reference Thompson2023).
Renter preferences for types of green space
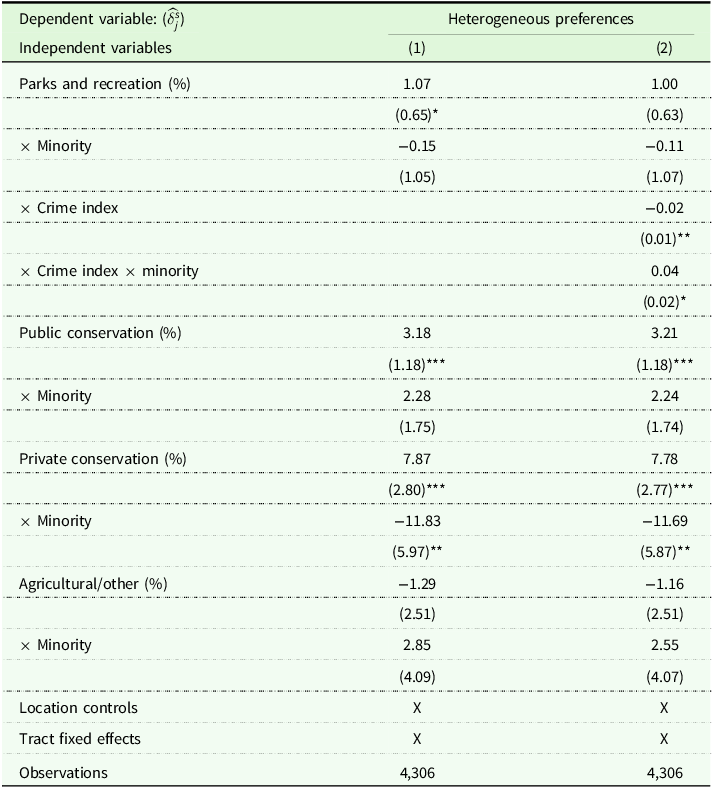
An important consideration for my analysis is that renter preferences for green space may differ by type and quality. Additionally, minority and white renters are likely to sort into neighborhoods with different kinds of local green space. Klaiber and Phaneuf (Reference Klaiber and Phaneuf2010) provide evidence that sorting behavior may be driven by preference heterogeneity in both household characteristics and specific types of open space. Table 4 presents a specification that models renter preferences for specific types of green space, including 1) parks and recreation spaces, 2) public conservation lands, 3) private conservation lands, and 4) agricultural or other green space.Footnote 11
Heterogeneous preferences for green space types

Notes: Columns 1 and 2 are estimated via Tobit specification. Observations are at the block group level. In Column 2, both parks and recreation (%) and crime index have been demeaned. Location controls and minority interactions included in the model but not displayed in the table are median household income, median rent, percent college educated, percent white population, population density, percent change in minority population (2000–2016), commute time, distance to the nearest police station, hospital, fire station, and airport, the number of libraries, colleges, or farmers markets, and percent water. Standard errors clustered at the tract level in parentheses *** p < 0.01, ** p < 0.05, * p < 0.1.
The first set of results, reported in Table 4 Column 1, suggest that renter preferences vary for different types of urban green space. WTP is highest for public and private conservation lands followed by parks and recreation spaces, while the coefficients on Agriculture/Other are not statistically significant. The coefficient on Parks and Recreation is positive and similar in magnitude to the Table 3 results. However, the estimate is only statistically significant at the 10% level. In contrast, the coefficient on Public Conservation is positive and statistically significant at the 1% level suggesting a WTP of $3.18 for an additional percentage point for conservation areas. The minority interaction on Public Conservation is not statistically different from zero.
Now consider the estimates associated with Private Conservation. Here, the interaction with minority renters enters negative and significantly. Specifically, the results indicate that white renters are WTP $7.87 for an additional percentage point of private conservation land in their block group, but that minority households are WTP $11.83 less than white households for same change. The combination of effects reveals that minority renters are WTP $3.96 to avoid an additional percentage point of private conservation. This difference could reflect white households consistently outbidding minority renters for locations with this amenity, minority renters being less willing to pay for or avoiding these amenities, or a combination of the two. In general, private conservation areas are primarily comprised of conservation easements and the occasional golf course or country club. These areas are often farther from the city center and tend to be wealthier, whiter suburbs, which may be less accessible to minority renters and may reflect patterns of displacement or avoidance.
The results in Column 1 suggest that white and minority renters value public conservation land similarly but have large differences in WTP for private conservation. However, the relatively low valuation of parks and recreation areas is somewhat surprising given that these areas are a common focus of public investment and constitute a significant share of green space in the Boston area. One potential explanation, explored in depth by Albouy et al. (Reference Albouy, Christensen and Sarmiento-Barbieri2020), suggests that as local crime increases, the valuation of parks may be zero or even negative in revealed preference models. Following this logic, I test for potential complementary effects between crime and local parks by including an interaction term between Crime Index and Parks and Recreation, with both variables demeaned. This specification allows the interaction to capture how deviations from average crime and park levels jointly influence willingness to pay.
Column 2 presents the results accounting for the interaction between crime and park areas. The coefficient on the interaction between Crime Index and Parks and Recreation is negative at -$0.02 and statistically significant at the 5% level, suggesting that white renters place a lower value on parks in areas with higher crime. Specifically, for each additional point of crime, the WTP for parks decreases by $0.02. For minority renters, the coefficient on the interaction between crime and parks is positive at $0.04 and statistically significant at the 10% level. The total effect, combining the baseline interaction and the minority indicator of $0.02, suggests that minority renters may be more likely to sort into areas with both parks and above-average crime, though the effect is small in magnitude.Footnote 12
While these estimates suggest diverging preferences for the complementary effects of crime and parks, it is unlikely that minority households derive utility from higher crime levels. Rather, these patterns likely reflect constrained choices and trade-offs shaped by affordability and access to other neighborhood amenities, such as racial or ethnic homophily, cultural ties, or unobserved location attributes that may be correlated with crime. This interpretation is consistent with Depro et al. (Reference Depro, Timmins and O’neil2015), who caution against interpreting residential sorting patterns as a preference for disamenities. Instead, disparities can emerge when minorities households are less able or willing to trade off other forms of consumption to avoid disamenities like crime. The observed complementarity between crime and parks may therefore capture only a small piece of broader sorting dynamics and valuation patterns for green space in the Boston area.
Additional discussion
While Table 3 indicates no significant differences in WTP for overall urban green space between white and minority renters, modeling heterogeneous preferences for specific types of green space reveals some meaningful variation. These differences may be partially shaped by unobserved factors such as residential segregation, discriminatory steering practices, or constraints that limit the location choices of minority households. Recent research documents that minority renters are disproportionately directed toward lower-quality neighborhoods across several dimensions, including environmental conditions (Christensen et al. Reference Christensen, Sarmiento-Barbieri and Timmins2022). Additionally, cultural ties, social networks, lifestyle preferences, and household composition may all influence residential sorting in ways not fully captured by the model (Patacchini and Zenou Reference Patacchini and Zenou2012). This analysis cannot isolate the specific impacts of discrimination or structural barriers on location outcomes, and I acknowledge this as a limitation of the study.
My results deviate from prior work investigating the correlation between race and environmental disamenities, as these studies find large and statistically significant differences between race groups (Depro et al. Reference Depro, Timmins and O’neil2015, Melstrom & Mohammadi, Reference Melstrom and Mohammadi2022). However, these studies do not condition on socioeconomic factors or tenure status as I do here.Footnote 13 It is possible that controlling for socioeconomic variables like median income helps attenuate estimated disparities in WTP. Group differences in WTP for an environmental amenity like green space would likely be attributable to mediating factors including wealth or perhaps sorting behavior related to race-based preferences for homophily. Evidence for racial homophily in location decisions comes from additional coefficient estimates from the Table 3 Column 2 model, which suggest that minority renters are willing to pay $8.24 to avoid a percentage point increase in the white population of a given location.Footnote 14
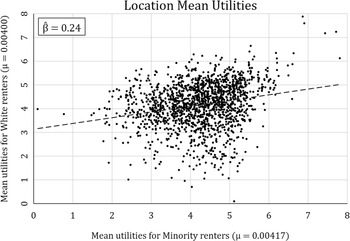
Figure 2 offers some additional insights on white and minority renters’ preferences by plotting the mean utilities for both groups. The distribution exhibits a marginally positive slope. The utilities in the lower right-hand quadrant display locations that are less preferable to white renters and preferable to minority renters. Summary statistics reveal that these are more segregated locations with smaller white populations. We observe that the mean utilities for both groups gradually increase as we move to the upper right-hand quadrant, indicating highly desirable locations for both white and minority renters. The group mean utilities have a correlation coefficient of 0.23, and the bivariate regression coefficient of the utilities is 0.24, suggesting a positive relationship or general agreement in location rankings. However, as previously noted, there exist highly segregated locations, with roughly one-quarter of block group locations having no minority renters.
Location mean utilities for white and minority renters. Notes: Each point in the scatter plot represents the group-specific mean utility for a block group location. Data come from first stage sorting model estimation of white renters and minority renters using American Community Survey data of renter populations from 2014 and 2018. The group-specific move cost parameter (μ) is reported next to x and y-axis labels.
 $\hat \beta $
comes from a bivariate regression of white mean utilities on minority mean utilities for locations where both groups are observed. (N = 1,535).
$\hat \beta $
comes from a bivariate regression of white mean utilities on minority mean utilities for locations where both groups are observed. (N = 1,535).

In the online appendix, I present a suite of robustness checks by altering underlying assumptions made to the modeling approach and moving cost index, as well as estimating alternative specifications for further comparison. I examine the effects of omitting search costs, adding fixed moving costs for inter-county moves, and adjusting the opportunity cost of time for white and minority renters based on relative income. These changes have a minimal impact on the overall results, with small variations in renter WTP. I also test the robustness of the heterogeneous preferences model by modifying population assumptions, imputing small populations in segregated locations, and increasing moving costs for minority renters. None of these adjustments significantly alter the main findings. Additional robustness checks include an instrumental variables model to address endogeneity and a hedonic model estimating WTP for green space using median rents.
Welfare analysis
The sorting model approach provides a straightforward framework for evaluating partial equilibrium welfare changes under policy shocks. For example, how would renter welfare – or total willingness to pay for urban green space – respond to a city-wide green space expansion initiative in Boston? Such a policy aligns with current smart growth programs like Massachusetts’ Community Preservation Act (CPA), which supports communities in preserving open space, developing recreational facilities, and creating affordable housing opportunities. Despite the CPA’s success and equitable goals, access to environmental capital remains highly disparate for minority and low-income communities in this area (Sims et al. Reference Sims2022). Results from my analysis also suggest that, while WTP for green space is similar between white and minority renters, disparities in income, access, and segregation likely drive differences in how environmental benefits are distributed across communities. This section evaluates welfare changes under a hypothetical policy scenario focused on achieving equitable outcomes by prioritizing green space in locations with higher minority populations.
For a policy intervention that increases green space across the city, I adjust the mean utilities for affected locations in the first stage sorting model as follows:
 $${\delta_{j}^{s,policy}} = {\delta _{j}^{s,baseline}} + {{\beta^{\prime}}_{r}^{s} \times \Delta {G_{j}}}$$
I convert
 $\beta _r^s$
, the coefficient from the second-stage regressions, from WTP into utility terms as
$\beta _r^s$
, the coefficient from the second-stage regressions, from WTP into utility terms as
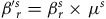 ${\beta^{\prime}}_r^{s} = \beta _r^s \times {\mu ^s}$
, which now represents the the portion of marginal utility derived from green space in location j to group s. represents the policy-induced change in green space for locations j impacted by the policy.
${\beta^{\prime}}_r^{s} = \beta _r^s \times {\mu ^s}$
, which now represents the the portion of marginal utility derived from green space in location j to group s. represents the policy-induced change in green space for locations j impacted by the policy.
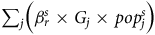
The policy influences renter household location decisions by altering the relative utilities of treated locations, thereby shifting the distribution of renter households across the city. To calculate the welfare change, I compare aggregate WTP for green space under baseline and policy scenarios. The implementation proceeds in three steps. First, I adjust the mean utilities of treated locations using Equation (8). Second, I update the first stage sorting model, allowing move shares to reflect the changes in location utilities. Finally, I estimate the resulting shift in renter households across the city and calculate total welfare under both the baseline and policy scenarios.Footnote 15
 $$\Delta {W^s} = \mathop \sum \limits_j^\; \beta _r^s\left( {G_j^{policy} \times pop_j^{s,policy} - G_j^{baseline} \times pop_j^{s,baseline}} \right)\;$$
For Equation (9), measures the total welfare change resulting from the policy-induced expansion of green space to group s. This approach isolates the marginal welfare contributions of each treated location, aggregates these contributions across the new equilibrium of renter households predicted under the policy scenario, and quantifies the total welfare gains or losses in dollar terms.
I construct a hypothetical policy targeting equitable outcomes by prioritizing minority-dominant communities for green space expansion. The policy is applied randomly to 5%, 10%, and 20% of locations, selected from those where the percent minority population is greater than or equal to 50%, while using a fixed random seed to ensure consistency across scenarios. Using the median park size in Boston, each policy location is expanded by 1.4 acres of green space.Footnote 16 I assess baseline disparities in green space distribution across renter groups and compare them to the policy scenario.
Under the current green space distribution, benefits total $4.5 million for white renters and $2.4 million for minority renters. When considering per-household benefits, the gap narrows, with white renters receiving $15.67 and minority renters $12.88, reflecting approximately 20% higher benefits for white renters. This gap may reflect differences in location choices; summary statistics indicate that areas with a higher population of white renters have about 5% more green space than those dominated by minority renters. This pattern may also reflect sorting behavior, as shown in Table 4, where white households appear to outbid minority households for access to safer parks or privately conserved areas. Alternatively, segregation and related structural barriers may limit minority renters’ access to these environmental amenities, or minority households may be prioritizing other location-specific amenities. Regardless of the mechanism, the baseline estimates point to an inequitable distribution of green space benefits.
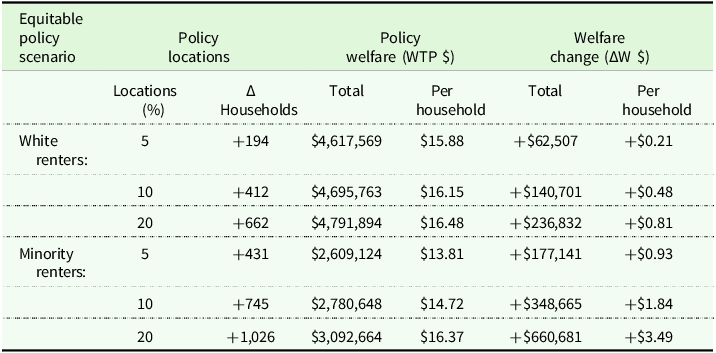
Table 5 presents policy welfare estimates for both white and minority renters. In the most conservative of expansion scenarios, an increase in 5% of locations results in a welfare gain of $63 thousand for white renters and $177 thousand for minority renters. Intuitively, targeting expansions in minority areas will increase welfare for minority renters at a higher rate than white renters, reducing the gap from 20% to about 14% in this case. Increasing the share of policy locations from 5% to 20% raises welfare for minority renters to $660 thousand, compared to $237 thousand for white renters. This expansion reduces the gap to less than 1%, shifting 1,026 minority renters from their predicted location choice to policy-designated locations. These results suggest that a policy expanding green space in minority communities could significantly narrow the racial gap in benefits, promoting more equitable outcomes and improving accessibility.
Welfare analysis for green space expansion policy

Notes: Baseline welfare is $4,555,062 ($15.67 per household) for White renters and $2,431,983 ($12.88 per household) for minority renters. Welfare change is calculated as the difference from the baseline estimates.
It is important to note that these results should be viewed as a descriptive exercise under a partial equilibrium analysis. While the results indicate clear and equitable gains in welfare, this approach captures demand-side effects through renter sorting but does not account for supply-side impacts. Potential increases in housing prices or reductions in rental unit availability due to limiting developable land could partially offset these gains. Additionally, this analysis excludes other important welfare benefits from green space, such as property capitalization or ecosystem services, offering only a snapshot of the full value of green space investments.
Conclusion
This paper employs a sorting model framework to estimate the value renter households place on urban green space and other public goods in the greater Boston area. Results indicate that renters are willing to pay between $1.17 and $1.64 for an additional percentage point of green space in their location decisions. I also find evidence that renters value access to transit systems and multiuse paths and trails. Differentiating by green space type reveals notable patterns, including a complementary relationship between local parks and crime levels, and disparities in preferences for private conservation areas
Although the recovered WTP estimates may appear modest relative to total rental costs, they are economically significant when aggregated across the population – amounting to $6.9 million for this period and representing a rarely quantified component of the benefits of urban green space. Importantly, while the baseline WTP for green space does not differ significantly between white and minority renters, disparities in access and benefits remain. This suggests that minority households may be prioritizing other neighborhood attributes – such as cultural ties, racial or ethnic homophily, and proximity to community networks – or may face structural barriers like discriminatory steering or limited housing options (Patacchini and Zenou Reference Patacchini and Zenou2012, Christensen and Timmins Reference Christensen and Timmins2022). These factors contribute to sorting patterns that reduce minority access to environmental amenities. Recognizing these disparities is critical for informing more equitable urban planning and ensuring that investments in green space benefit all communities.
This study also demonstrates that even small increases in urban green space can significantly enhance the value of neighborhoods for both white and minority renters, who both seemingly value green space. Policymakers should continue to invest in urban greening initiatives, which not only improve the quality of life but also promote greater access to environmental amenities, particularly for low-income and minority communities where such amenities are currently underprovided (Sims et al. Reference Sims2022, Lang et al. Reference Lang, VanCeylon and Ando2023, Trust for Public Land 2024). The results from my welfare analysis, though descriptive, indicate that green space expansion focused on equity can generate sizeable welfare gains, especially for minority renters when policies prioritize their communities for green space development. However, renter welfare is just one aspect of the total benefits of green space, and considerations such as reduced housing supply and the potential for environmental gentrification must also be considered (Walsh Reference Walsh2007, Banzhaf et al. Reference Banzhaf, Ma and Timmins2019). Future studies could benefit from individual data on renter characteristics and more comprehensive approaches to understanding the broader social and economic impacts of current green space and smart growth policies on renters.
Data availability statement
Link for data replication package available at https://osf.io/4js59/
Supplementary material
The supplementary material for this article can be found at https://doi.org/10.1017/age.2025.10011
Funding statement
This research received no specific grant from any funding agency, commercial or not-for-profit sectors.
Competing interests
The authors declare no known conflicts of interest related to this manuscript.


 Open access