


Introduction
Since the onset of the Eurozone crisis peripheral countries have come under strong exogenous pressure to implement austerity measures and structural reforms aimed at achieving so‐called ‘internal devaluation’. The intrusiveness of European Union (EU) authorities (along with the International Monetary Fund in Portugal and Greece) has led several scholars to call into question the capacity of peripheral governments to autonomously shape their labour market reform agendas (Armingeon & Baccaro Reference Armingeon and Baccaro2012; Mair Reference Mair2011). While the intensity of exogenous constraints has varied across countries and over time, it is beyond doubt that governments on the Eurozone periphery have been severely constrained in their policy options, producing a generalised trend towards liberalisation (Baccaro & Howell Reference Baccaro and Howell2017). Nevertheless, more recent contributions have highlighted how, even at the peak of the crisis, elected governments have retained some room for manoeuvre in shaping the content of structural adjustment measures, leading to cross‐country variation in labour market reform trajectories and outcomes (Afonso Reference Afonso2019; Cioffi & Dubin Reference Cioffi and Dubin2016; Moury & Standring Reference Moury and Standring2017; Picot & Tassinari Reference Picot and Tassinari2017). How can these seemingly divergent views be reconciled? What room for manoeuvre did governments of crisis‐struck peripheral countries really have in shaping their labour market reform strategies, and how can we explain the eventual variation observed?
In this paper, we develop a two‐step argument to address these questions, focusing on Southern European countries as case studies. First, through a detailed analysis of the content of the labour market and collective bargaining (CB) reforms implemented in Greece, Italy, Portugal and Spain since the onset of the crisis in 2008, we identify and differentiate between elements of labour market policy change common across all our cases, and those that vary across countries and partisan families. Second, we explain this pattern of similarities with limited variation as being the product of the interaction of two sets of factors: economic constraints and electoral dynamics.
In line with recent contributions on the political economy of European monetary integration, we argue that the common core of labour market deregulation – loosening of dismissal protections for open‐ended contracts and CB decentralisation – can be traced back to the shared economic constraints Southern European countries faced due to the imperatives of generating employment and stimulating export competitiveness within the Economic and Monetary Union (EMU) (Höpner & Lutter Reference Höpner and Lutter2018; Johnston & Regan Reference Johnston and Regan2018; Perez & Matsaganis Reference Perez and Matsaganis2019). This involved satisfying the preferences of export‐oriented segments of business, EU authorities and foreign lenders for specific forms of liberalisation of labour market policy. These shared constraints fail, however, to explain the cross‐country, and at times even intra‐country, variation observed in the extent and scope of labour market deregulation and in the type of compensatory measures included in labour market policy reform packages.
We claim that variation in the corollary measures accompanying the core of labour market policy deregulation can be explained in light of electoral dynamics, and specifically in light of the social class composition of the electoral bases of support that partisan governments rely on or aim to assemble. Alongside the primary concern of generating growth, governments need indeed to gather sufficient electoral support for their reform agendas. They can do so by either clinging to their traditional support base or by breaking with past reform legacies to create a new one (Amable & Palombarini Reference Amable and Palombarini2009). Hence, we argue that in shaping the content of the corollary measures accompanying the core of deregulation, governments are influenced by the preferences of the voter groups supporting them or that they wish to attract (Walter Reference Walter2016). We identify four ideal‐typical reformist strategies available to Southern European governments, depending on the composition of their support base: preservation of the social democratic coalition, creation of a centrist pro‐EU coalition, neoliberal rupture and coalescing of the anti‐bourgeois bloc; alongside a fifth possible scenario of stasis, describing situations in which governments are unable to pursue a reformist agenda consistent with their support base. We illustrate our argument through analysis of survey data and case studies of labour market policy reforms in Portugal, Spain, Italy and Greece between 2009 and 2019.
Our contribution is twofold. First, we systematically distinguish between the core elements of deregulation common across Southern European countries and the elements of variation in corollary compensatory measures, thus introducing greater analytical clarity into the debate on labour market policy and industrial relations reforms in crisis‐ridden countries. Second, we show how structural economic constraints and electoral dynamics interact in shaping policy agendas, and provide a systematic categorisation of ideal‐typical reform strategies available to parties depending on the composition of their electoral base. Our argument contributes to bridging the literatures on EU‐related exogenous pressures, growth models (Baccaro & Pontusson Reference Baccaro and Pontusson2016; Johnston & Regan Reference Johnston and Regan2016), producer group politics and electoral politics (Amable & Palombarini Reference Amable and Palombarini2009; Beramendi et al. Reference Beramendi, Hausermann, Kitschelt and Kriesi2015; Bürgisser & Kurer Reference Bürgisser and Kurer2019).
The rest of the paper is organised as follows. The second section presents our theoretical framework. The third section presents the research design, methods and data sources. The fourth section illustrates patterns of similarity and variation in labour market policy reforms in the four countries during the crisis decade. The fifth section analyses the class composition of the electorate of the main party families in Southern Europe, based on survey data. In the sixth section, we then illustrate our theoretical argument with qualitative case studies from the four countries. The seventh section concludes the article.
Theoretical framework: Economic constraints, electoral politics and labour market policy
Explaining the common core of deregulation: Economic constraints and export‐led growth
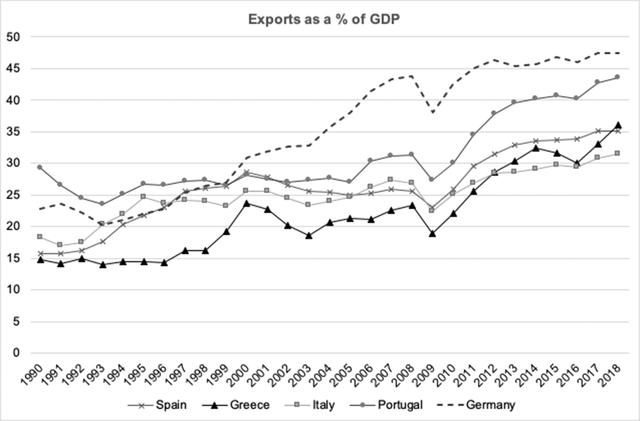
Under conditions of deep economic crisis, governments face the imperatives of kick‐starting economic growth and stimulating employment creation. Due to the institutional framework of the EMU, however, when the 2008 crisis hit the peripheral countries of Southern Europe had limited macroeconomic tools available to stimulate their economies (Scharpf Reference Scharpf2016). Simultaneously, the sudden halt of capital inflows from core member states limited the viability of the demand‐led growth models based on construction, public sector employment, cheap credit and rising household indebtedness on which Southern European economies had relied during the first decade of the EMU (Johnston & Regan Reference Johnston and Regan2018). Consequently, Southern European governments were left with little choice but to attempt to reorient their economies towards export‐led growth (Perez & Matsaganis Reference Perez and Matsaganis2019). This imperative was consistently reinforced by the substance of the policy recommendations made by EU authorities through implicit or explicit conditionalities (Sacchi Reference Sacchi2015; Theodoropoulou Reference Theodoropoulou2015).
Building on this well‐established insight, we argue that this EMU‐induced forced reorientation towards exports (cf. Figure 1) accounts for the core elements of labour market liberalisation observed across all our case studies. This core liberalisation revolves around two pillars: the deregulation of employment protection legislation (EPL) for open‐ended employees – with measures aimed at making individual and collective dismissals easier and the related costs for employers more certain – and the decentralisation of CB to the firm level, which allows employers to achieve internal and functional flexibility by deviating from working time and other operational constraints laid down in industry‐wide agreements.
Exports as per cent of GDP in selected Eurozone countries.
Source: Stats.OECD.

In a context characterised by a relatively small export‐oriented manufacturing base (with the exception of Italy), the predominance of small and medium enterprises (SMEs) and constraints on public spending, encouraging export‐led growth necessarily relies either on promoting the external cost competitiveness of the few (large) domestically‐owned export‐oriented firms, or on attracting foreign direct investment (FDI). We argue that EPL liberalisation and CB decentralisation at firm level moved to the forefront as key measures for fostering export reorientation for three reasons. First, both measures contribute to lowering labour costs, thus improving cost‐competitiveness (cf. Afonso Reference Afonso2019). Second, they increase firms’ functional and operational flexibility in terms of workforce size, working time and work organisation, factors crucial to maintaining competitiveness in globalised value chains. Third, they signal to prospective investors the government's resolve to promote policy frameworks encouraging business confidence.
The interaction between governments and (foreign or domestic) large multinational enterprises, we argue, became particularly important in the crisis context. This helps to explain why Southern European governments occasionally implemented measures contradicting the preferences of most domestic employers (Bulfone & Afonso Reference Bulfone and Afonso2020). Indeed, for Southern European economies, FDI attraction often involved joining the transnationally‐distributed value chains controlled by foreign multinationals, in a dynamic common to many peripheral member states, such as Ireland and the Visegrad countries (Johnston & Regan Reference Johnston and Regan2018; Šćepanović Reference Šćepanović2019). Competition for FDI implies that large multinationals can choose between multiple investment outlets (Reurink & Garcia‐Bernardo Reference Reurink and Garcia‐Bernardo2020), putting them in a structurally strong position vis‐á‐vis governments from prospective investment destinations. To be sure, it is not only foreign multinationals that have a preference for liberalising EPL and CB. For instance, in Italy, large domestic export‐oriented companies, such as automotive manufacturer FIAT, also played a prominent role in influencing government action. The increased structural power of large export‐oriented firms, and of multinationals in particular, we argue, helps to explain why governments implemented EPL loosening and CB decentralising measures irrespective of their partisan affiliation, and why these measures proved difficult to reverse once exogenous pressure abated (Afonso & Bulfone Reference Afonso and Bulfone2019).
In this regard, it is important to specify that, while we argue that EPL loosening and CB decentralisation constituted part of a strategy of export reorientation common to all partisan governments in Southern Europe, there is no automatic link between these measures and improved export performance or employment creation (Perez & Matsaganis Reference Perez and Matsaganis2019: 268–77). But the effectiveness of these measures, or lack thereof, does not detract from the political rationale of export reorientation, crucial in explaining their implementation and persistence.
Explaining variation in corollary labour market policy measures: Electoral considerations and social blocs
While the push to engineer a shift towards export‐led growth helps to explain the common elements of core deregulation, we argue that electoral considerations shape the content and design of the corollary labour market policy measures accompanying them. These corollary measures encompass the regulation of temporary employment, the regulation and level of minimum wages, the design and generosity of unemployment protection and of active labour market policies (ALMPs).
We posit that Southern European governments used the room of manoeuvre they had in designing corollary measures accompanying deregulation to either protect their core voters from the costs associated with liberalisation (Walter Reference Walter2016), or to create a new base of support – or ‘social bloc’ – for their reform agenda, breaking away with past reformist legacies (Amable Reference Amable2017; Amable & Palombarini Reference Amable and Palombarini2009). We follow Amable and Palombarini in emphasising how office‐seeking party leaders retain some room for manoeuvre in creating these ‘social blocs’. We thus posit that reform strategies are not only shaped by the extant composition of parties’ electorates and by the imperative of protecting or retaining the support of groups that are preserves of a given party family (cf. Oesch & Rennwald, Reference Oesch and Rennwald2018). They can also serve the function of constructing or consolidating a new social bloc by attracting support from groups contested among different party families (Rennwald & Evans Reference Rennwald and Evans2014). Crisis junctures are therefore typically characterised by the co‐existence, and competition, of several alternative reformist strategies (Amable & Palombarini Reference Amable and Palombarini2009), especially in countries lacking a clear growth model, such as those of Southern Europe (Baccaro & Pontusson Reference Baccaro and Pontusson2016).
To establish the connection between reform strategies and the composition of parties’ electoral bases, we consider four factors that, we argue, influence partisan governments when approaching the design of labour market reform strategies: the relative size of voter groups; the extant class composition of a party's electoral base; the dynamics of political competition between party families (that is, which social groups are preserves of a party family and which are contested – cf. Oesch & Rennwald Reference Oesch and Rennwald2018); and the policy preferences of key electoral groups. In general terms, adopting Oesch's (Reference Oesch2006) class schema to operationalise social classes, we expect the following:
-
(1) Parties reliant on, or competing for, ‘traditional’ working class voters on open‐ended contracts – that is, production workers – tend to implement compensatory measures, such as generous unemployment insurance or targeted exemptions from the liberalisation of EPL, and defend centralised industry‐wide CB.
-
(2) Parties reliant on, or competing for, ‘new’ working class voters – that is, service workers, more likely to be in atypical employment – prioritise compensatory measures such as higher EPL for fixed‐term/atypical contracts, inclusive unemployment protection and higher minimum wages.
-
(3) Parties reliant on, or competing for, the salaried middle classes (e.g., technical and socio‐cultural professionals, managers) – likely to prioritise ‘flexicurity’ policies over strong EPL by virtue of their higher skill level – will support measures such as strengthened ALMPs and inclusive unemployment support (cf. Häusermann et al. Reference Häusermann, Kurer and Schwander2015), while being less electorally affected by EPL liberalisation.
-
(4) Parties reliant on, or competing for, SME owners prioritise measures aimed at lowering labour costs – such as deregulation of fixed‐term employment – while retaining elements of state support for small businesses (e.g., tax incentives and social security rebates, sectoral CB and state‐funded short‐time working).
-
(5) Parties reliant on, or competing for, the votes of self‐employed professionals and large employers accompany the ‘core’ of deregulation with interventions that provide strengthened protections for the solo self‐employed or pro‐business tax incentives/social security discounts.
We posit that, depending on the composition of their extant or intended support base, partisan governments in Southern Europe have four possible categories of labour market reform strategies available, based on those presented by Amable and Palombarini (Reference Amable and Palombarini2009, Reference Amable, Palombarini, Magara and Amable2017) and Beramendi et al. (Reference Beramendi, Hausermann, Kitschelt and Kriesi2015). These are the preservation of the social democratic coalition, creation of a centrist pro‐EU coalition, neoliberal rupture and coalescing of the challengers’ coalition. A fifth possible scenario, stasis, can emerge when governments are not able to pursue a coherent reformist strategy that is compatible with the diverse composition of their electoral base.
The consolidation of the social democratic coalition aims to gather support from voter groups traditionally associated with social democratic parties: production workers, socio‐cultural professionals and other public sector employees. It implies labour market policy reforms that seek to combine timid attempts at EPL deregulation and decentralisation of CB with compensatory measures such as strengthening unemployment protection, re‐regulating temporary employment or expanding supportive ALMPs. Because this strategy centres on sheltering production workers on open‐ended contracts, it was not compatible with the pressure to deregulate EPL experienced by Southern European governments at the peak of the crisis.
The neoliberal rupture is a pro‐market strategy, largely compatible with EMU‐related constraints, aimed at consolidating the core electoral bloc of centre‐right parties: large employers and self‐employed professionals, SME owners and managers (cf. Amable & Palombarini Reference Amable and Palombarini2009). It involves deregulatory labour market policy and CB reforms that reduce labour costs and increase employment flexibility, tax cuts and incentives in favour of selected sectors or professions, and compensatory measures that reduce labour costs for SME owners in the domestic sector.
The creation of a centrist pro‐EU coalition aims at breaking away from the traditional left–right cleavage and is available to moderate centre–left or centre–right parties. It relies on a ‘centrist’ bloc (akin to Amable and Palombarini's ‘bloc bourgeois’) including socio‐cultural and technical professionals, managers, other non‐unionised private sector workers and highly skilled atypical workers (for example, self‐employed professionals), based on shared support for the process of European integration (Amable et al. Reference Amable, Guillaud and Palombarini2011). It implies labour market policy reforms aimed explicitly at reducing protections for open‐ended employees and costs for businesses, while strengthening protections for the highly skilled segments of the atypical workforce with supportive ALMPs and more inclusive out‐of‐work income protection schemes.
The coalescing of the anti‐bourgeois bloc (Amable & Palombarini Reference Amable, Palombarini, Magara and Amable2017) is the mirror image of the creation of a centrist coalition. It entails gaining support from the ‘losers’ of EU integration and globalisation: SMEs owners/shopkeepers, low‐skilled production and service workers and the unemployed (Beramendi et al. Reference Beramendi, Hausermann, Kitschelt and Kriesi2015). It implies labour market policy reforms that combine attempted (re‐)regulation of EPL and expansion of social safety nets in favour of working‐class voters with compensatory measures favouring SMEs and the self‐employed, such as tax cuts and incentives. This strategy is hardly compatible with the constraints arising from EU integration.
The last possible scenario, which we name stasis, arises when, irrespective of partisan affiliation, governments are incapable of implementing a coherent reformist strategy because of the incompatibility between the preferences of the diverse electoral groups supporting them. We expect this scenario to be associated with the presence of strong clientelistic linkages between governing parties and their electorate.
Methodology
This study follows the logic of ‘most similar systems design’, focusing on countries that share significant features in their labour market policy and wage‐setting institutions, and were subject to comparably strong exogenous pressures for structural reforms, internal devaluation and growth model reorientation in the Great Recession context: Portugal, Spain, Italy and Greece. Our units of analysis are the labour market policy reform strategies pursued by partisan governments in the four countries since the crisis’ onset.Footnote 1 We chose labour market policy as an empirical sphere of investigation, and considered the following policy areas: EPL; unemployment benefits and other social shock absorbers; ALMPs; CB and wage‐setting institutions. Labour market policy is relevant to analysing governments’ reform strategies under exogenous pressures as it is an electorally visible policy area, with clear implications for growth strategies, that underwent a wave of EU‐induced reforms during the crisis period.
Our empirical strategy proceeds in three steps. First, we classify all labour market policy reforms undertaken by partisan governments during the crisis decade, assessing their liberalising/deregulatory or de‐liberalising/expansionary impact on different spheres of labour market policy (LMP). In this way, we distinguish between the core of deregulation common across countries, and the corollary elements of labour market policy reforms which vary across countries and party families. Second, we analyse the class composition of the electorate of the main party families in our countries of interest, applying Oesch's (Reference Oesch2006) eight‐class schema (cf. Supporting Information Table A1) and using survey items on party voted for at the last general election (cf. Supporting Information Table A2) from the European Social Survey (2002, 2004, 2006, 2008, 2010, 2012, 2014, 2016, 2018) and the Hellenic National Election Study (ELNES) of 2015 (Andreadis Reference Andreadis2019).Footnote 2 Third, we test our argument through qualitative case studies showing empirically how economic constraints and electoral considerations interacted in shaping the labour market policy reform strategies of partisan governments in our four countries of interest. Our case studies draw on press reports, documentary analysis of legislative and policy documents and secondary sources.
Similarities and variation in the content of labour market policy reforms
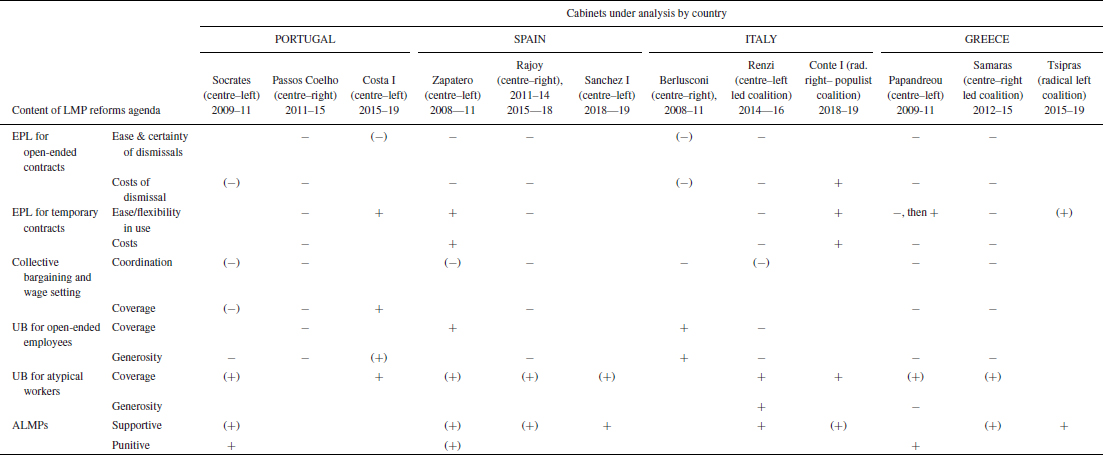
The first step of our empirical strategy entails analysing and classifying the content of the labour market policy reforms implemented by partisan governments in the four countries over the crisis and immediate post‐crisis period (2009–2019) (Table 1). We evaluate the extent to which each reform led to a liberalisation/deregulation/retrenchment (–) or deliberalisation/re‐regulation or expansion of protections (+) in each policy area. The full list of the reforms analysed for each cabinet and the details of the main beneficiary, negatively affected and compensated groups for each reform agenda are reported in the Supporting Information Tables A4–A7. From this comparative overview, two main findings emerge.
Content of main labour market reforms implemented in Portugal, Spain, Italy and Greece, 2009–2019

Legend: – indicates reforms that introduce liberalisation/deregulation/retrenchment in a policy area; + indicates reforms that introduce de‐liberalisation/re‐regulation/expansion in a policy area.
Note: All reforms considered for each cabinet and the main beneficiaries, affected and compensated groups are listed in the Supporting Information Tables A4–A7.
First, we find evidence of a ‘common core’ of labour market policy liberalisation across all Southern European countries and partisan families. This common core comprises the deregulation of EPL for open‐ended employment (increasing in particular the ease and certainty of individual and collective dismissals), and the provision of increased flexibility in CB through decentralisation of the main bargaining locus from sectoral to firm level, coupled with the enhancement of possibilities for deviations from centralised agreements at firm level. These elements of liberalisation were implemented by governments of all political persuasions during the acute crisis period, and, so far, have not been reversed, even after exogenous pressures partly abated and government partisanship changed. Even when some elements of CB decentralisation were reversed, this only amounted to re‐instating coverage of sectoral bargaining through statutory extensions, without eliminating the possibility for firm‐level deviations from sectoral agreements.
Second, we identify variation in the direction and packaging of measures affecting other labour market policy spheres that we deem ‘corollaries’ to the core of liberalisation. These include EPL for temporary/atypical employment, unemployment protection, ALMPs and minimum wage setting. For example, the Spanish, Portuguese and Greek left‐leaning executives accompanied their core liberalising reforms with the (partial) re‐regulation of temporary employment or, post‐2014, minimum wage increases; while the Italian centre–left actively deregulated temporary employment, implementing instead compensatory measures in unemployment protection and ALMPs, alongside fiscal incentives to employers. Similarly, while over 2011–2014 the Spanish and Portuguese centre–right refrained from accompanying core deregulatory reforms with compensatory measures, the Italian centre–right (2008–2011) expanded short‐time working schemes, and the recent populist right‐wing government (2018–2019) partly re‐regulated temporary employment and strengthened unemployment assistance. These findings highlight the need for a more nuanced categorisation than straightforward partisanship to account for the observed variation. We now show how a fine‐grained analysis of the social class composition of the electorates of partisan families across countries can shed some light in this respect.
Electoral bases in southern Europe
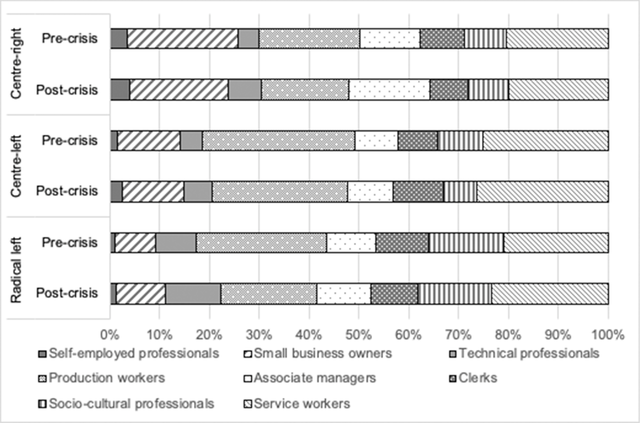
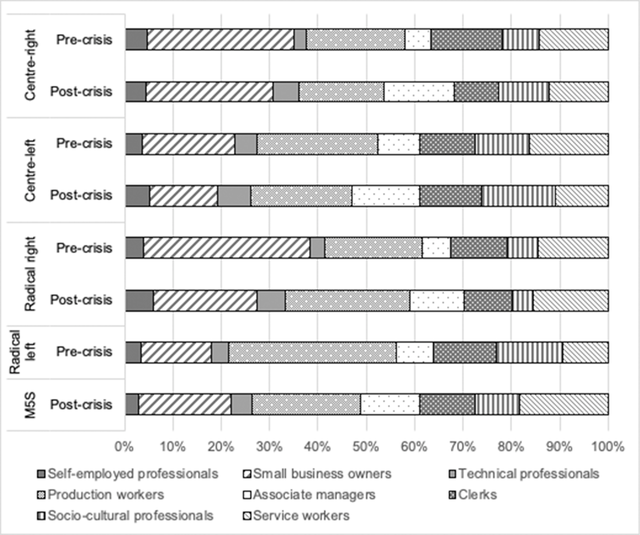
The relative size of social classes is crucial for understanding their electoral salience. Figure 2 shows the social class composition of the electorate in Portugal, Spain, Greece and Italy on the basis of Oesch's (Reference Oesch2006) eight‐class schema, based on pooled data from European Social Survey waves 1–8.Footnote 3
Size of social classes (Oesch's eight categories) in Portugal, Spain, Italy and Greece.
Source: Spain, ESS waves 1–8; Portugal, ESS waves 1–8; Italy, ESS waves 1, 2, 6 and 8; Greece, ESS waves 1, 2, 4 and 5. Total N = 37,756.
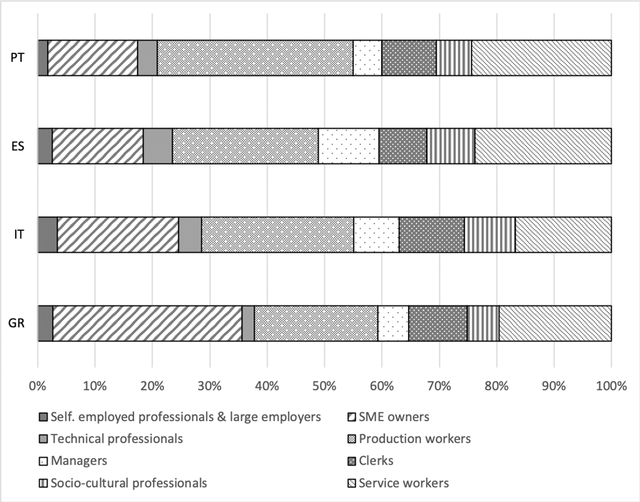
The data allow us to identify three unique features characterizing the class composition of Southern European countries: the large size of the combined working class (production and service workers), accounting for almost half the electorate (compared with around 35 per cent on average in Western European countries – Oesch & Rennwald Reference Oesch and Rennwald2018: 11); the large proportion of SME owners (15–33 per cent compared with around 10 per cent in Western European countries – ibid.); and the relatively small size of the salaried middle classes (socio‐cultural/technical professionals and managers), which make up less than 10 per cent of the population (compared with around 15 per cent across Western Europe – ibid). Overall, these findings indicate that, in Southern Europe, winning the support of either the working classes or SME owners is electorally crucial (Afonso & Bulfone Reference Afonso and Bulfone2019).
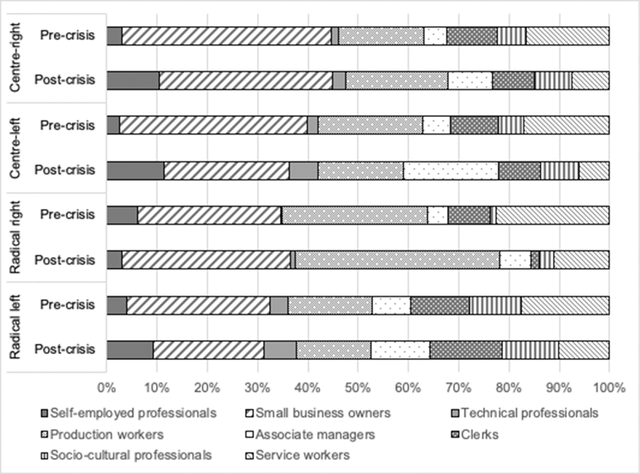
We now present a comparative descriptive analysis of the class composition of the electorate of different partisan families (see Supporting Information Table A3 for categorisation of parties), distinguishing between the pre‐2008 (pre‐crisis) and post‐2008 (post‐crisis) periods. For each country, we show the relative weight of each social class in parties’ electorates and how this changes over the two periods (see Figures 3, 5, 7 and 9). Following Oesch and Rennwald (Reference Oesch and Rennwald2018), we also calculate the vote breakdown for each social class, which allows us to distinguish between groups that are preserves of a party family (that is, groups from which a party family receives above‐average electoral support); contested strongholds (groups from which two parties receive above‐average electoral support); and groups over which there is open competition among party poles (see Figures 4, 6, 8 and 10).
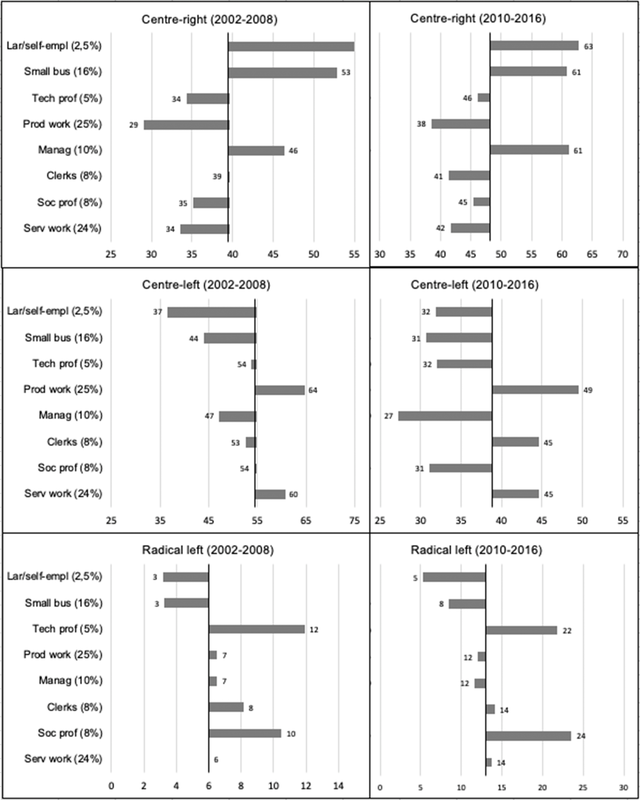
Class composition of the electorate of the main party families in Spain.
Source: Centre–right: pre‐crisis, ESS waves 1–4 (2002–2008), N = 1,224; post‐crisis, ESS waves 5–8 (2010–2016), N = 1,641. Centre–left: pre‐crisis, ESS waves 1–4 (2002–2008), N = 1,789; post‐crisis, ESS waves 5–8 (2010–2016), N = 1,338. Radical left: pre‐crisis, ESS waves 1–4 (2002–2008), N = 211; post‐crisis, ESS waves 5–8 (2010–2016), N = 463. Data weighted.

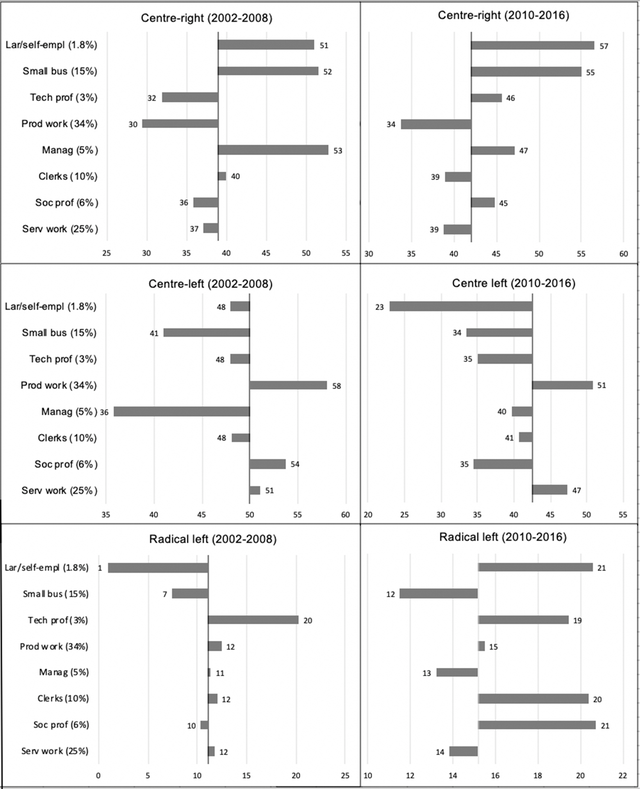
Spain: Vote for the main party families by social class group (in per cent).
Legend for classes: Lar/self emp = Large employers and self‐employed professionals, Small bus = Small business owners; Tech prof = Technical professionals; Prod work = Production workers; Manag = Managers; Clerks = Clerks; Soc prof = Sociocultural professionals; Serv work = Service workers. The percentages in parentheses next to the classes show the size of each class in the electorate.
Note: The y‐axis cuts the x‐axis at a party's overall electoral score (i.e., the mean score over all the classes in the period of reference).
Source: 2002–2008, ESS waves 1–4, N = 3,125; 2010–2016, ESS waves 5–8, N = 3,394. Data weighted.

In Spain (Figures 3, 4) and Portugal (Figures 5, 6) we distinguish between three main party families: the centre–right (PP and, post‐2011, Ciudadanos in Spain; PSD and CDS in Portugal), the centre–left (PSOE in Spain, PS in Portugal) and the radical‐left (IU and Podemos in Spain, PCP and Bloco de Esquerda in Portugal). Their class composition has remained fairly consistent over the pre‐ and post‐crisis period. The centre–right in both countries has its strongholds among capital owners and their agents (large employers and self‐employed professionals, SME owners and managers) (although PP in Spain grew its support across all social groups), while the centre–left draws on support from the working class (production and service workers). The main electoral preserves of radical‐left parties are instead salaried professionals – although production and service workers also account for a sizeable chunk of their electorate, especially for the Portuguese PCP. Clerks are instead contested by all three party poles. In Portugal, the combined working class vote constitutes a sizeable proportion of both centre–left and centre–right electorates, confirming the inter‐classist composition of the PS and PSD (Jalali Reference Jalali2007), while socio‐cultural and technical professionals are less relevant for the centre–left than in Spain or Italy.
Class composition of the electorate of the main party families in Portugal.
Source: Centre–right: pre‐crisis, ESS waves 1–4 (2002–2008), N = 1,285; post‐crisis, ESS waves 5–8 (2010–2016), N = 1,179. Centre–left: pre‐crisis, ESS waves 1–4 (2002–2008), N = 1,715; post‐crisis, ESS waves 5–8 (2010–2016), N = 1,215. Radical left: pre‐crisis, ESS waves 1–4 (2002–2008), N = 382; post‐crisis, ESS waves 5–8 (2010–2016), N = 438. Data weighted.

Portugal: Vote for the main party families by social class group (in per cent).
Legend for classes: Lar/self emp = Large employers and self‐employed professionals, Small bus = Small business owners; Tech prof = Technical professionals; Prod work = Production workers; Manag = Managers; Clerks = Clerks; Soc prof = Sociocultural professionals; Serv work = Service workers. The percentages in parentheses next to the classes show the size of each class in the electorate.
Note: The y‐axis cuts the x‐axis at a party's overall electoral score (i.e., the mean score over all the classes in the period of reference).
Source: 2002–2008, ESS waves 1–4, N = 3,194; 2010–2016, ESS waves 5–8, N = 2,707. Data weighted.

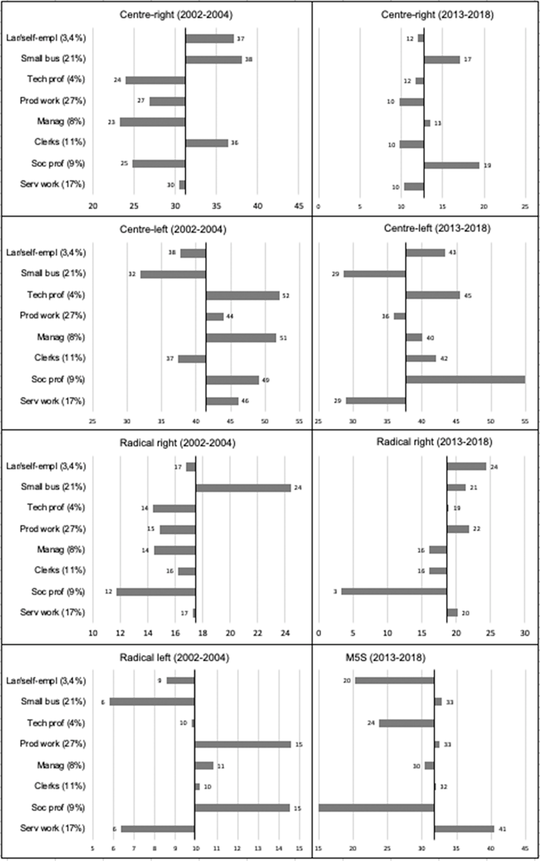
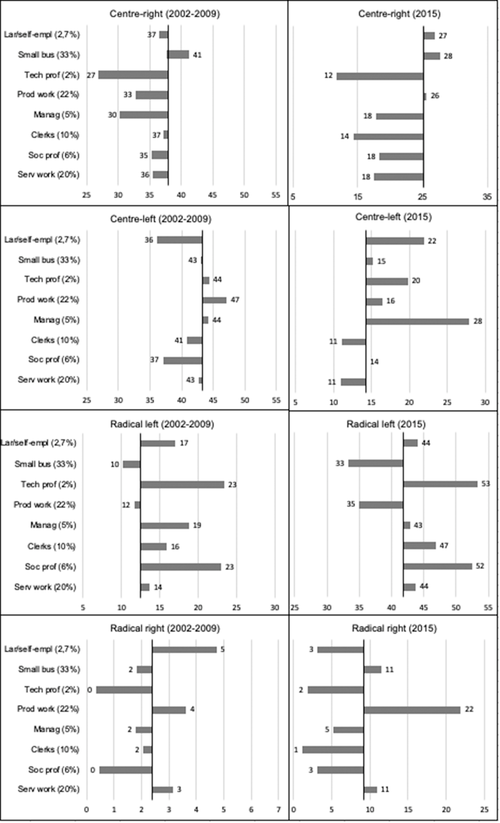
In Italy, we distinguish five party families: the centre–right (PDL and other centrist–Catholic–liberal political forces); the centre–left (the Partito Democratico and allied parties); the radical right (comprising the Lega, Alleanza Nazionale and its successor FDI); the radical left (comprising various communist/green parties, which disappeared electorally post‐2008); and the ‘populist’ Movimento 5 Stelle (M5S) after 2013. The data (Figures 7, 8) highlight some distinctive features in parties’ electorate class composition. The Italian centre–right has its strongholds among shopkeepers and SME owners, but since the collapse of Christian Democracy in the early 1990s, has also commanded support among agricultural production workers and public sector employees (for example, clerks) in the South (Amable et al. Reference Amable, Guillaud and Palombarini2011; Barta Reference Barta2018). Before the crisis, the Italian centre–left's support base was more internally coherent, with an important share of production workers and socio‐cultural professionals. The weight of the working class vote in the centre–left electorate has however decreased since 2008, mainly because of declining support among service workers, whilst that of salaried professionals has grown alongside that of managers (now contested between the PD and the centre–right). The radical right has historically contended the centre–right's stronghold of SME owners. Since the crisis it has however attracted growing support among production workers, now contended with M5S (resulting in a relative decline of SME owners’ weight in its electorate). The high share of the working class vote – around 40 per cent – in the constituencies of both the M5S and the radical right indicates how, since the crisis, these forces have occupied a political space left empty by the PD's centrist shift.
Class composition of the electorate of the main party families in Italy.
Source: Centre–right: pre‐crisis, ESS waves 1–2 (2002–2004), N = 355; post‐crisis, ESS waves 6, 8 and 9 (2013–2018), N = 271. Centre‐left: pre‐crisis, ESS waves 1–2 (2002–2004), N = 472; post‐crisis, ESS waves 6, 8 and 9 (2013–2018), N = 844. Radical right: pre‐crisis, ESS waves 1–2 (2002–2004), N = 199; post‐crisis, ESS waves 6, 8 and 9 (2013–2018), N = 417. Radical left, pre‐crisis, ESS waves 1–2 (2002–2004), N = 113; M5S, post‐crisis, ESS waves 6, 8 and 9 (2013–2018), N = 715. Data weighted.

Italy: vote for the main party families by social class group (in per cent).
Legend for classes: Lar/self emp = Large employers and self‐employed professionals, Small bus = Small business owners; Tech prof = Technical professionals; Prod work = Production workers; Manag = Managers; Clerks = Clerks; Soc prof = Sociocultural professionals; Serv work = Service workers. The percentages in parentheses next to the classes show the size of each class in the electorate.
Note: The y‐axis cuts the x‐axis at a party's overall electoral score (i.e., the mean score over all the classes in the period of reference).
Source: 2002–2004, ESS waves 1 and 2 (questions on 2001 General Elections); N = 1,100. 2013–2018, ESS waves 6, 8 and 9 (questions on 2013 and 2018 General Elections); N = 2,247. Data weighted.
In Greece, the political landscape has been characterised since democratisation by de facto stability, followed by substantial reconfiguration after 2010. Three main party families co‐existed before the crisis: the centre–right (New Democracy, ND), the centre–left (PASOK and its split‐off party, DIKKI – Democratic Social Movement), and the radical left (Greek Communist Party (KKE) and Syriza). Our data partly confirm the historical inter‐classist composition attributed to ND and PASOK (Close Reference Close2014), arising from their shared reliance on cross‐class patronage as means of consensus‐generation (cf. Afonso et al. Reference Afonso, Zartaloudis and Papadopoulos2015; Barta Reference Barta2018). While both parties relied on the votes of the two largest electoral groups, SME owners and production workers (including farmers), the former were more prominent within ND's electorate, while the latter represented the core of PASOK's (Figure 9); and service workers were the main contested group. Radical left parties found their core domains among socio‐cultural and technical professionals (faring well also among associate managers), while attracting significantly lower support among SME owners.
Class composition of the electorate of the main party families in Greece.
Source: Centre–right: pre‐crisis, ESS waves 1, 2, 4 and 5; N = 1,570. Post‐crisis ELNES 2015 (Andreadis Reference Andreadis2019); N = 172. Centre‐left: pre‐crisis, ESS waves 1, 2, 4 and 5; N = 1,841. Post‐crisis ELNES 2015 (Andreadis Reference Andreadis2019); N = 154. Radical right: pre‐crisis, ESS waves 1, 2, 4 and 5; N = 106. Post‐crisis, ELNES 2015 (Andreadis Reference Andreadis2019); N = 46. Radical left: pre‐crisis, ESS waves 1, 2, 4 and 5; N = 615. Post‐crisis, ELNES 2015 (Andreadis Reference Andreadis2019); N = 362.
After the crisis onset, according to ELNES data (and bearing in mind their limitations – see note in Supporting Information), overlaps in parties’ voter bases persisted despite the considerable reconfiguration of the party‐political space. SME owners and production workers remained the two most important voter blocs for all party families (Figure 9 and 10), but the collapse of the centre–left and the rise of the radical right (ANEL and Golden Dawn) altered competition over these groups (Figure 10). SME owners became contested between the centre–right and the radical right. Production workers, prior preserves of the centre–left, instead seemingly gained weight in the radical right electoral base. For its part, the radical left (Syriza and KKE) attracted increased support across all social classes (accounting for its electoral success in 2015), but also retained its support among socio‐cultural professional, technicians and clerks (more likely to be public sector employees). Service sector workers (under‐sampled in ELNES) were instead contested between the radical right and the radical left.Footnote 4 On the basis of the data, the Syriza–ANEL government of 2015–2019 appears as expression of a coalition comprising primarily salaried workers in the public sector and the educated middle classes (clerks, socio‐cultural and technical professionals) on one hand, and production workers on the other.
Greece: vote for the main party families by social class group (in per cent).
Legend for classes: Lar/self emp = Large employers and self‐employed professionals, Small bus = Small business owners; Tech prof = Technical professionals; Prod work = Production workers; Manag = Managers; Clerks = Clerks; Soc prof = Sociocultural professionals; Serv work = Service workers. The percentages in parentheses next to the classes show the size of each class in the electorate.
Note: The y‐axis cuts the x‐axis at a party's overall electoral score (i.e., the mean score over all the classes in the period of reference).
Source: 2002–2008, ESS waves 1, 2, 4 and 5; N = 4,235. 2015: ELNES 2015 (Andreadis Reference Andreadis2019), N = 789. Data weighted.

Labour market reform strategies in southern Europe
We now illustrate our theoretical argument through qualitative case studies, showing how economic constraints and electoral considerations interacted in shaping the labour market policy reform strategies of partisan governments in the four countries. Table A21 in the Supporting Information summarises our categorisation of governments’ reform strategies.
Portugal
At the onset of the crisis the PS minority government led by Prime Minister Jose Socrates (2009–2011) attempted a strategy of consolidation of the social democratic bloc, implementing a package of counter‐cyclical measures aimed at limiting employment destruction, and resisting the growing pressure from EU institutions to achieve wage devaluation via the loosening of EPL for workers on open‐ended contracts. This stance, however, was short‐lived. In 2011, under strong pressure from the EU authorities, the PS government eventually committed to reducing the maximum dismissal compensation for new hires, but stopped short of extending the grounds for justified dismissals for employees on permanent contracts (Cardoso & Branco Reference Cardoso and Branco2018). This effort to shelter its core base of production workers from liberalisation ultimately proved incompatible with the level of exogenous pressure on Portugal. After the fourth austerity package was defeated in parliament in March 2011, Socrates was forced to resign before implementing the planned reforms.
The centre–right Partido Social Democrata (PSD) won the general elections of June 2011, forming a coalition with the liberal conservative party CDS‐PP under the leadership of Prime Minister Pedro Passos‐Coelho (2011–2015). The government used the crisis and the memorandum of understanding (MoU) conditionality as a ‘window of opportunity’ to pursue a strategy of neoliberal rupture combining far‐reaching austerity, labour market deregulation and welfare retrenchment (Moury & Standring Reference Moury and Standring2017). In electoral terms, this involved breaking away from the catch‐all legacy that had characterised the PSD in the pre‐crisis period, in order to consolidate support among SME owners and more highly skilled groups. Through repeated modifications of the Labour Code (in 2012, 2013 and 2014), the government reduced dismissal protection for permanent employees; increased the scope for firm‐level negotiation of working time flexibility; cut overtime payments; and restricted the scope for the statutory extension of CB agreements to whole sectors.
Elements of this export‐focused reform strategy caused tensions with some segments of domestic employers. In particular, the decision to unilaterally eliminate extension mechanisms for sectoral CB agreements attracted the joint opposition of all four employers’ confederations, keen to avoid downward wage competition in a landscape dominated by SMEs (Bulfone & Afonso Reference Bulfone and Afonso2020). Besides these areas of disagreement, however, the broad trajectory of labour market policy reform pursued by the PSD government was aligned with employers’ interests, especially large firms and foreign investors (Jornal De Negocios 2013; Missão Crescimento 2014)
Therefore, the labour market policy reform strategy was aimed not only at consolidating a basis of consensus among large employers, executives and SME owners, but also at laying the foundations for a growth strategy centred around exports (Rodrigues & Reis Reference Rodrigues and Reis2012), as explicitly acknowledged by Minister of Finance Pires de Lima (Jornal De Negocios, 2014). Since 2013, Portugal has experienced a rapid decrease in nominal unit labour costs, a reversal of its current account deficit, and a corresponding rapid increase in FDI inflows and proportion of exports to GDP. Portugal's strong export performance is not solely the result of record tourism and agricultural revenues, but also of attraction of shared service centres, that is, multinational subsidiaries providing centralised support services for the parent company (Reurink & Garcia‐Bernardo Reference Reurink and Garcia‐Bernardo2020).
Despite the successful attraction of FDI promoted by lower labour costs, at the 2015 general elections the PSD‐CDS alliance paid the price for austerity, losing 12 per cent of their votes. The conservative alliance fared particularly badly among unemployed and low‐income voters, hit hard by austerity (Fernandes et al. Reference Fernandes, Magalhães and Santana‐Pereira2018). The underperformance of the PSD‐CDS meant that the PS could obtain a parliamentary majority by forming an alliance with two radical left parties: the Bloco de Esquierda (BE) and the PCP (ibid.). Once in power, the Costa government attempted to regain support among the traditional constituencies of the social democratic bloc, above all production workers, through the implementation of compensatory measures, such as the broadening of the coverage and generosity of the minimum income and old‐age income support schemes, and the increase of the minimum wage (Wise Reference Wise2019). These were accompanied by measures targeting middle‐class groups in atypical employment, a core base of the radical left, such as the partial re‐regulation of temporary employment.
Despite these encompassing compensatory measures, however, the PS repeatedly resisted calls from the BE and the Communists to reverse the core of the labour market policy reforms implemented by the PSD (Afonso & Bulfone Reference Afonso and Bulfone2019). After the 2019 elections, the negotiations for a new government alliance between the PS and the BE were derailed because the PS refused to commit to dismantle key elements of the 2012–2013 EPL reforms for open‐ended employment and CB (Soeiro Reference Soeiro2019). The PS resisted the reversal of these reforms (Patricio Reference Patricio2019) in an attempt to preserve Portugal's attractiveness as an investment destination, explicitly acknowledging the crucial importance of employment flexibility and wage repression for high‐skilled employees in attracting FDI (Government of Portugal 2018: 29–31). This shows how, once implemented, deregulatory measures affecting core preferences of domestic and foreign export‐oriented employers are difficult to reverse.
Spain
When Spain was hit by the crisis, the PSOE government of Jose Luis Zapatero (2008–2011) reacted by implementing a counter‐cyclical ‘Keynesian’ plan, including strengthening unemployment benefits. This was a way to consolidate and broaden the social democratic bloc the PSOE had relied on since its return to power in 2004. Attempting to shelter production workers from the crisis, Zapatero initially resisted pressures from the employers’ confederation Confederation of Employers and Industries of Spain (CEOE) and EU authorities to deregulate EPL for open‐ended contracts. However, the PSOE's strategy became increasingly difficult to sustain from 2010 onwards, as pressure on the bond markets increased. Consequently, in June 2010 the executive implemented a labour market policy reform that combined reduction of redundancy pay for open‐ended contracts with moderate re‐regulation of temporary contracts, while broadening the clauses that allowed firms in distress to opt out of industry‐level CB.
Facing growing pressure from the EU, in July 2011 Zapatero implemented a second labour market policy reform, pursuing the decentralisation of CB, which further alienated unions and their membership (Cioffi & Dubin Reference Cioffi and Dubin2016). The failure to reconcile the preferences of its supporting groups with the growing pressure to achieve internal devaluation originating from EU authorities led the PSOE to suffer a major electoral defeat in 2012, to the benefit of the centre–right PP, which won an absolute majority in parliament.
The PP took advantage of the crisis and its large parliamentary majority to implement a strategy of neoliberal rupture, combining strict austerity measures with radical labour market deregulation. The main pillar of the PP agenda was the 2012 labour market policy reform, which reduced the cost of collective and individual dismissals for all workers on open‐ended contracts, created a new unprotected contract for new entrants and led to a radical decentralisation of the CB framework, sanctioning the absolute prevalence of firm‐level over industry‐wide agreements (Picot & Tassinari Reference Picot and Tassinari2017). This radical deregulatory agenda had three goals: consolidating the PP's support base among SME owners, managers, executives and large business groups (Fernández‐Albertos & Kuo Reference Fernández‐Albertos and Kuo2016), stimulating employment growth in low‐end services and attracting FDI from large foreign multinationals by lowering labour costs.
The reduction in unit labour costs was ultimately aimed at shifting Spain's growth model from construction to FDI‐dependent export‐led growth. This FDI attraction effort focused in particular on the automobile sector, in which Spain has a tradition dating back to the 1960s (Šćepanović Reference Šćepanović2019). With the 2012 reform, the government aimed to lure back to Spain FDI from large foreign car‐makers by combining EPL deregulation and CB decentralisation with industrial policy measures, such as tax exemptions on FDI projects (Guimón Reference Guimón2013). Investment in car making grew considerably between 2013 and 2015 – peaking at 2.9 million in 2016, up by 45 per cent since 2012.Footnote 5 The association of foreign car producers Anfac highlighted the important role the labour market reform played in their decision to relocate to Spain, praising especially the possibility to negotiate more internal flexibility on wages and working time at firm level (Anfac 2012: 33–6).
The shift towards export‐led growth bore some fruit. Spain reversed a current account deficit that had exceeded 9 per cent of Gross Domestic Product in 2007, constantly posting surpluses since 2013.Footnote 6 In 2018, car‐making alone contributed 13.7 billion euros to Spain's trade surplus (Anfac 2019: 26). The chemicals industry, where foreign multinationals also play a key role, had a similarly strong performance (de Otamendi Reference de Otamendi2017: 32). Although the tough austerity measures eroded its support base, the PP remained the largest party at the 2015 elections. When the Rajoy government had to step down in 2018, it was because of the unveiling of several corruption scandals, rather than for lack of popular support.
Two years of political instability followed, during which the PSOE formed a minority government and, in late 2019, an alliance with the radical left Podemos. Although it is too early to evaluate the reform outcomes of the Podemos–PSOE alliance, in an effort to reorganise the social democratic bloc and consolidate support among working class voters the executive implemented substantial increases in the statutory minimum wage in 2018 and 2019 (Carreño Reference Carreño2018). As with the Costa government in Portugal, however, this compensatory measure has not been accompanied thus far by a reversal of the core deregulatory measures introduced in 2012, which is strongly opposed by all main employer groups.
Italy
When the borrowing costs on Italy's sovereign debt spiralled out of control in 2011, the country was ruled by Silvio Berlusconi's centre–right coalition. Berlusconi's supporting bloc was heterogeneous, comprising SME owners, a segment of northern production workers and vulnerable and rural voters from Southern Italy (cf. Amable et al. Reference Amable, Guillaud and Palombarini2011; Barta Reference Barta2018). The heterogeneity in the centre–right's support base, coupled with the reliance on clientelistic ties with the Southern electorate, made it particularly difficult for the executive to elaborate a coherent reformist strategy, leading to a scenario of stasis.
The only relevant reform implemented by the centre–right was a measure included in the 2011 budget law affecting CB, which shifted the main bargaining locus from the sectoral to the firm level, in accordance with the preferences of car manufacturer FIAT. The new firm‐level agreement allowed FIAT to achieve more internal flexibility in terms of working time and employment conditions. However, this radical decentralisation of the CB framework was swiftly neutralised by a bipartite agreement between the employers’ association Confindustria, which favours industry‐wide bargaining because of the prevalence of SMEs within its membership, and the main trade unions (Bulfone & Afonso Reference Bulfone and Afonso2020). Eventually, failing to bring about any radical reform of the labour market, in October 2011, Berlusconi was forced to step down, and was replaced by Mario Monti's technocratic executive (2011–2013).
As a grand coalition government with a strong technocratic component, the Monti cabinet falls outside the scope of our analysis. However, its labour market agenda is analytically relevant because of the strategy of one of the main parties supporting the executive, the centre–left Partito Democratico (PD) under the leadership of Pierluigi Bersani. During the negotiation of Monti's flagship labour market intervention in 2012 (the so‐called Fornero labour law), the PD used its pivotal role in the parliamentary majority to soften the impact of the reform on one of the traditional constituencies of the social democratic bloc, unionised production workers on open‐ended contracts (Picot & Tassinari Reference Picot and Tassinari2017).
The strategy of the PD changed markedly under the leadership of Matteo Renzi, who became Prime Minister between 2014 and 2016. Renzi shifted the PD towards the centre in an attempt to create a centrist pro‐EU coalition (Picot & Tassinari Reference Picot and Tassinari2017; Sacchi Reference Sacchi2018). The main pillar of Renzi's reformist strategy was the 2015 labour market reform, known as the Jobs Act. The Jobs Act combined elements of core deregulation, especially a far‐reaching loosening of EPL for open‐ended contracts, with compensatory measures such as the expansion of rights‐based unemployment benefits coverage, especially for atypical employees and the self‐employed and an expansion of ALMPs (Picot & Tassinari Reference Picot and Tassinari2015).
Renzi's deregulatory interventions were fully compliant with domestic large employers’ (especially large export‐oriented manufacturers like FIAT) long‐standing preference for the deregulation of dismissal protection (Picchio Reference Picchio2014; Rai News 2015). While liberalisation was also conducive to consolidate electoral support among managers and large employers, the expansion of unemployment benefit coverage for the atypically employed, ALMPs and other measures favouring the self‐employed constituted part of an attempt to attract the support of ‘new middle class’ groups favouring welfare expansion, such as socio‐cultural professionals (Vesan & Ronchi Reference Vesan and Ronchi2019).
Government actors argued that the labour market deregulation achieved with the Fornero reform and the Jobs Act had positive repercussions on Italy's export performance. Indeed, Italy's current account balance has turned into surplus since 2013, while the overall value of Italian exports grew by a cumulative 34 per cent between 2009 and 2018.Footnote 7 Compared with Spain and Portugal, Italy relied considerably less on FDI due to the presence of a larger domestic manufacturing export base in sectors such as machine tool production. The automotive sector also contributed to the improved export performance, with domestic vehicle production increasing by 61 per cent between 2013 and 2018.Footnote 8
Renzi's attempt to form a centrist pro‐EU coalition failed nonetheless, as he did not win support from the two pivotal groups: production workers and SME owners (Vesan & Ronchi Reference Vesan and Ronchi2019). The electoral fragility of Renzi's reformist project became apparent at the 2018 elections when the PD attracted below 20 per cent of the votes (Afonso & Bulfone Reference Afonso and Bulfone2019). The radical right Lega and the catch‐all populist M5S emerged victorious from the 2018 Italian general elections and went on to form a coalition government (2018–2019), which we consider an example of an ‘anti‐bourgeois bloc’ (Amable & Palombarini Reference Amable, Palombarini, Magara and Amable2017). The M5S had campaigned on two electoral promises aimed at attracting votes from unemployed and lower income working class voters (especially in the South): the introduction of a universal guaranteed minimum income and the repeal of the Jobs Act. For its part the Lega won support among SME owners and sizeable segments of Northern production workers with a programme built around a tough immigration stance, reduction of the pensionable age and introduction of a flat‐tax regime (Afonso & Bulfone Reference Afonso and Bulfone2019).
The Lega/M5S government's labour market policy agenda reflected the tensions in its support base. In 2018 the government adopted an EPL reform sponsored by M5S, the ‘dignity decree’, which targeted its working class base by reducing the maximum number of renewals allowed for temporary contracts and marginally increasing monetary compensation in cases of unfair dismissal for open‐ended contracts. Contrary to its electoral promises, however, the M5S fell short of restoring the pre‐crisis level of EPL for open‐ended contracts, thereby leaving the main provisions of the Jobs Act intact. This volte face was due mainly to joint opposition from both small and large employers, which put pressure on Lega to prevent the reintroduction of Article 18 and include some business‐friendly provisions in the decree (La Repubblica 2018).
While the dignity decree, along with the guaranteed minimum income scheme introduced in 2019, represent clear attempts by M5S to strengthen its support among unemployed and working class voters, the Lega attempted to shape the labour market policy agenda according to the interests of its SME voters (for example, by limiting the re‐regulatory reach of the ‘dignity decree’) and of Northern production workers (through relaxation of rules to access short‐time working schemes for large firms in crisis).
Greece
The centre–left PASOK government of George Papandreou came into office in October 2009, shortly before the onset of the crisis. PASOK relied on a heterogeneous support base, comprising production workers, sociocultural professionals in the public sector, as well as a considerable share of SME owners in sheltered sectors (Barta Reference Barta2018: 124). As Barta (Reference Barta2018: 118–123) and Afonso et al. (Reference Afonso, Zartaloudis and Papadopoulos2015) document, since the 1980s both PASOK and the conservative ND have relied heavily on clientelistic networks and public spending to gather electoral support; making their core voters hostile to fiscal consolidation and liberalisation.
When the Greek sovereign debt crisis exploded in full force, the Papandreou government, shut out of international bond markets, had to seek a EUR 110 billion bailout from the Troika in 2010, accompanied by a memorandum outlining detailed conditionality regarding the structural reforms to be undertaken to achieve fiscal consolidation and internal devaluation (Koukiadaki & Kretsos Reference Koukiadaki and Kretsos2012: 282). PASOK thus faced the task of implementing harsh reforms directly affecting its core constituencies – especially production workers and public sector employees. The impossibility of harmonising the measures requested by the Troika with its social support base precipitated a situation of stasis, similar to that of Berlusconi's government in Italy.
Under acute pressure from creditors, PASOK implemented several reforms over 2010–2011, directly harming its base: reduction of dismissal compensation for open‐ended employees, deregulation of collective dismissals, increase in working time flexibility and a substantive decentralisation of CB from sectoral to firm level (Koukiadaki & Kretsos Reference Koukiadaki and Kretsos2012; Matsaganis Reference Matsaganis and Theodoropoulou2018; Theodoropoulou Reference Theodoropoulou2015). Several of these measures directly benefited large firms in the private sector, and aligned with large employers’ long‐standing demands for increasing wage and EPL flexibility (Theodoropoulou Reference Theodoropoulou2015). PASOK still attempted to protect some powerful components of its base – in particular, segments of public sector employees and farmers – by exempting them from austerity measures (Matsaganis Reference Matsaganis2011: 506). This selective sheltering strategy was nonetheless insufficient to avoid mass public protest, the ensuing resignation of Papandreou and the electoral annihilation of PASOK.
At the 2012 general elections, centre–right ND suffered huge electoral losses but still emerged as the first party (with around 30 per cent of the vote), followed closely by radical left Syriza. The elections sanctioned the emergence of a new political cleavage, separating ‘pro’ and ‘against’ memorandum forces. ND leader Samaras proceeded to form a government of national unity, bringing together the political forces broadly in favour of the memorandum (ND, PASOK and smaller parties). This broad coalition implemented a deregulatory agenda aimed at increasing external competitiveness via internal devaluation and kick‐starting export‐led growth (Matsaganis Reference Matsaganis and Theodoropoulou2018: 61). Samaras’ reformist strategy resembles that of Passos‐Coelho in Portugal, with a conservative party taking advantage of the MoU conditionality to shift rightwards by implementing a neoliberal rupture. The scope for this strategy proved even more narrow than in Portugal, however, as ND relied on support from voter groups hard hit by austerity, and hostile to further liberalisation (such as public‐ and private sector‐dependent workers). To attenuate the heavy political costs of liberalisation, the Samaras government implemented some minor compensatory measures targeted at contested segments of the electorate (such as service sector workers and self‐employed professionals) (Lalioti Reference Lalioti2016; Matsaganis Reference Matsaganis and Theodoropoulou2018).
PASOK's meltdown at the 2015 general elections paved the way for the triumph of radical left Syriza, with ND finishing a distant second. Syriza's leader Tsipras formed a government in coalition with the right–nationalist party ANEL. An expression of a wide cross‐class coalition combining middle class groups heavily affected by the MoU alongside production workers and farmers, the Tsipras government promised to implement an agenda of discontinuity with the MoU. We interpret this as an attempt to coalesce a social democratic bloc by making PASOK's traditional electoral base more internally coherent and reducing the weight of SME owners (cf. Matsaganis Reference Matsaganis and Theodoropoulou2018).
In May 2015, the executive presented several proposals to reverse the internal devaluation implemented during the crisis (Kennedy Reference Kennedy2018: 25). This agenda failed to translate into reforms, however, as Syriza had to seek prior Troika approval before implementing measures that could affect MoU targets (such as, for example, re‐regulating the CB framework). Furthermore, the executive never even attempted to re‐regulate EPL, fearing that this might discourage prospective foreign investors (Stournaras Reference Stournaras2017). Consequently, Syriza's interventions were limited to introducing new ALMP schemes for the long‐term unemployed, and increasing the minimum wage. Hence, similar to Portugal and Spain in 2010–2011, strong exogenous pressures contributed to the failure of Syriza's attempt to organise a social democratic bloc.
Despite the radical labour market deregulation implemented during the crisis and the steep decline in nominal wages, internal devaluation failed to translate into export‐led recovery (Perez & Matsaganis Reference Perez and Matsaganis2019). This was mainly because Greece underperformed in terms of FDI attraction compared with Portugal, Spain and even Italy – which can nonetheless rely on a considerably larger manufacturing base (IHS Markit 2018).
To address this poor performance, the new ND cabinet, led by Kyriakos Mitsotakis called for a business‐friendly agenda, centring on privatisation, tax cuts and FDI attraction (Hope Reference Hope2019), in line with the strategy of neoliberal rupture and export reorientation previously attempted by the Samaras executive.
Conclusions
This paper makes a twofold contribution to the debate on the political economy of labour market deregulation on the EU periphery. First, by developing the first systematic analysis of all labour market policy and CB reforms implemented in Portugal, Spain, Italy and Greece since the outbreak of the 2008 crisis, we reconcile the debate between those highlighting homogeneity in a common trajectory of liberalisation (Armingeon & Baccaro Reference Armingeon and Baccaro2012), and more recent contributions observing cross‐country and cross‐party variation in labour market reform outcomes (Afonso Reference Afonso2019; Cioffi & Dubin Reference Cioffi and Dubin2016; Moury & Standring Reference Moury and Standring2017; Picot & Tassinari Reference Picot and Tassinari2017). Through this careful mapping exercise, we distinguish between the two elements of core deregulation of labour market policy common across Southern European countries (that is, loosening of EPL for open‐ended contracts and decentralisation of CB), and the corollary measures accompanying this kernel of labour market policy liberalisation that vary across countries and party families (namely, the regulation of temporary employment and minimum wage setting, and the design of unemployment protection and ALMPs).
Second, we develop an original argument to account for these patterns of similarity and variation. We link the elements of core deregulation, which so far have been difficult to reverse, to the common economic imperative facing Southern European countries to shift towards export‐led growth in the crisis aftermath (Perez & Matsaganis Reference Perez and Matsaganis2019). We then show how the observed variation in the content of the accompanying corollary measures can instead be explained in light of electoral politics – and in particular, in light of the socio‐economic profile of governments’ traditional electoral support base and of the voter groups they wish to attract. Drawing on Beramendi et al. (Reference Beramendi, Hausermann, Kitschelt and Kriesi2015), Amable et al. (Reference Amable, Guillaud and Palombarini2011) and Amable and Palombarini (Reference Amable and Palombarini2009, Reference Amable, Palombarini, Magara and Amable2017), we develop four categories to classify the reform strategies of elected governments: preservation of the social democratic coalition, creation of a centrist pro‐EU coalition, neoliberal rupture and coalescing of the anti‐bourgeois bloc.
Our analysis suggests that parties’ reformist preferences are neither unconstrained nor easily interchangeable. Indeed, within our sample of countries, we observed that partisanship goes some way towards explaining reformist outcomes in Portugal, Spain and Greece, while Italy emerges as an outlier. Further research should investigate more closely the conditions under which parties choose to deviate from their prior electoral legacies, accounting for the role played by factors such as ideology, patterns of party competition and growth models.
Overall, our findings show that, although domestic political dynamics still matter in shaping the trajectories of adjustment, not all reformist strategies are equally compatible with EMU constraints. In countries lacking the social bases to consolidate a neoliberal rupture or a centrist pro‐EU bloc strategy, political tensions are likely to persist, as the viability of alternative reform pathways remains constrained by the imperative of preserving export‐led growth.
Turning to the limitations and extensions of our argument, variation in the ‘corollary elements’ of labour market reforms could be ascribed to factors alien to electoral politics, such as the lobbying and strength of trade unions and employers’ associations. Due to space constraints, in this paper we were not able to consider systematically their role, and we assumed that their weight in shaping government agendas co‐varies with the centrality of the voter groups they represent in parties’ electoral bases. Future research should explore systematically how links with organised producer groups interact with electoral considerations in shaping reform strategies.
Concerning the external validity of our argument, we believe that the categories of reform strategies developed here could also be applied to other Western European countries, covering most reform options available to elected governments. A further category could nevertheless be needed to capture the reform trajectory of continental moderate conservative governments combining elements of EPL deregulation and a pro‐business agenda with targeted measures of welfare chauvinism. A thorough analysis of this reformist agenda, unlikely to be observed in Southern Europe, goes beyond the scope of the present study and is left for future research.
Acknowledgements
Previous versions of this paper were presented at the 2018 ECPR Joint Sessions of Workshops; at the EUI Political Economy Working Group (May 2018); at the 2019 Conference of Europeanists; and at the 2019 SASE Annual Meeting. We are grateful to all participants, to three anonymous reviewers and to Kostas Gemenis, Manos Matsaganis, Reto Burgisser, Björn Bremer and Dorothee Bohle for the valuable comments and suggestions. Arianna Tassinari gratefully acknowledges financial support received by the UK Economic and Social Research Council (grant number: ES/J500203/1).
Supporting Information
Additional supporting information may be found online in the Supporting Information section at the end of the article:
Table A1: Oesch's eight class schema, with illustrative typical occupations
Table A2: Variables used in analysis
Table A3: List of parties included in each party family
Table A4: Portugal, main labour market policy reforms under analysis (2009–2019), by cabinet
Table A5: Spain, main labour market policy reforms under analysis (2009–2019), by cabinet
Table A6: Italy, main labour market policy reforms under analysis (2008–2019), by cabinet
Table A7: Greece, main labour market policy reforms under analysis (2008–2019), by cabinet
Table A8: Size of social classes (Oesch's eight categories) in Portugal, Spain, Italy and Greece, with confidence intervals
Table A9: Class composition of the electorate of the main party families in Spain, with 95 confidence intervals
Table A10: Spain: vote by social class group (2002–2008)
Table A11: Spain: vote by social class group (2010–2016)
Table A12: Class composition of the electorate of main party families in Portugal (in per cent), with 95 confidence intervals
Table A13: Portugal: voting by social class group (2002–2008)
Table A14: Portugal: vote by social class group (2009–2015)
Table A15: Class composition of the electorate of the main party families in Italy, with 95 confidence intervals
Table A16: Italy: vote by social class group (2002–2004)
Table A17: Italy: vote by social class group (2013–2018)
Table A18: Class composition of the electorate of the main party families in Greece, with 95% confidence intervals
Table A19: Greece: vote by social class group (2002–2009)
Table A20: Greece: vote by social class group (2015)
Table A21: Classification of partisan governments under analysis and their labour market reform strategies, 2008–2019


 Open access