


The emergence of social media platforms was widely touted as a technological revolution that would bring about many beneficial outcomes such as political learning and participation (Dimitrova et al., Reference Dimitrova, Shehata, Strömbäck and Nord2014; Tucker et al., Reference Tucker, Theocharis, Roberts and Barberá2017). However, such early hopes are being overshadowed by mounting concerns about aggressive political communication. In recent days, one can easily encounter uncivil political discussion both from political elites as well as ordinary users. Also, various types of hate speech—targeted at women, ethnic minorities, and partisan opponents—are common and viral on social media (Mathew et al., Reference Mathew, Dutt, Goyal and Mukherjee2019). Accordingly, much scholarly attention has been paid to detect such speech and curb its spread (Siegel, Reference Siegel2020). However, we know very little about another, perhaps most deleterious, type of aggressive political speech: violent political rhetoric. Violent political rhetoric, expressing the intention of physical harm against political opponents, has drawn significant media attention. Numerous media reports show that malevolent users on social media write posts that threaten violence against political opponents on the basis of partisanship, ideology, and gender and that such posts are even associated with the actual incidences of offline violence (Brice-Saddler, Reference Brice-Saddler2019; Daugherty, Reference Daugherty2019; Vigdor, Reference Vigdor2019). In particular, many social media platforms are implicated in the extremist effort to motivate and organize the Capitol Riot that left a vivid and deep scar on American democracy. Plenty of evidence shows that not only niche extremist online forums but also mainstream social media platforms, including Twitter, were exploited by users who called for violence in the days preceding the riot on January 6, 2021 (Guynn, Reference Guynn2021; Lytvynenko and Hensley-Clancy, Reference Lytvynenko and Hensley-Clancy2021; Romm, Reference Romm2021).
Violent political rhetoric is worrisome not only because it serves as a harbinger of extremist offline violence but also because exposure to such rhetoric has harmful consequences such as increased tolerance for offline violence against political opponents (Kalmoe, Reference Kalmoe2014) and ideological polarization (Kalmoe et al., Reference Kalmoe, Gubler and Wood2018). It is particularly concerning because violent political rhetoric can widely spread through the communication network on social media, amplifying its negative effects. Besides, such rhetoric is in itself a behavioral manifestation of violent partisanship where individuals not just hate out-partisans (Abramowitz and Webster, Reference Abramowitz and Webster2018) but also support and even enjoy the use of violence against them (Kalmoe and Mason, Reference Kalmoe and Mason2018). The rhetoric is an online mirror image of the recent instances of inter-partisan offline violence surrounding contentious political issues (e.g., Black Lives Matter movements, the controversies about the 2020 Presidential Election) and is no less concerning than its offline counterpart (Pilkington and Levine, Reference Pilkington and Levine2020).
How prevalent is violent political rhetoric on social media? How do posts containing such rhetoric relate to offline-world politics? What types of politicians are targeted? What users use violent rhetoric against political opponents? How diffusive is violent political rhetoric and what predicts its spread? Given the significance of violent political rhetoric, it is urgent to investigate these questions. Due to the massive size of the content generated in real time, however, it is prohibitively expensive to manually identify violent content on a large scale, leaving only anecdotal and incomprehensive evidence (Lytvynenko and Hensley-Clancy, Reference Lytvynenko and Hensley-Clancy2021; Romm, Reference Romm2021). Therefore, I propose an automated method for detecting violent political rhetoric from a continuous stream of social media data, focused on Twitter. I then apply the method to build a data set of tweets containing violent political rhetoric over a 16-week period surrounding the 2020 Presidential Election. Finally, I provide comprehensive data analyses on the characteristics and spread of violent political rhetoric.
By doing so, I contribute to three areas of research in political science. First, I shed light on the literature on political violence by extending the study of individuals’ engagement in political violence to online domains. While a body of research in offline political violence has taken a bottom-up approach to study individuals who take part in collective violence in the offline world (Horowitz, Reference Horowitz1985; Scacco, Reference Scacco2010; Fujii, Reference Fujii2011; Tausch et al., Reference Tausch, Becker, Spears, Christ, Saab, Singh and Siddiqui2011; Claassen, Reference Claassen2016), few studies have taken a similar approach to investigate individuals who threaten violence against political opponents in online space. I fill part of the gap by showing that individuals who threaten violence against political opponents on social media are ideologically extreme and located on the fringe of the online communication network. I also show that they threaten opposition politicians, in the context of heightened contentious politics offline. The online–offline links identified in my study open up a future research agenda on what causal mechanisms connect threats of political violence online and contentious offline politics, including offline political violence.
By identifying and characterizing violent political rhetoric on Twitter, I also extend the study of aggressive online political communication where incivility and hate speech have been the key areas of inquiry (Berry and Sobieraj, Reference Berry and Sobieraj2013; Gervais, Reference Gervais2015; Munger, Reference Munger2017; Suhay et al., Reference Suhay, Bello-Pardo and Maurer2018; Gervais, Reference Gervais2019; Popan et al., Reference Popan, Coursey, Acosta and Kenworthy2019; Sydnor, Reference Sydnor2019; Siegel, Reference Siegel2020; Munger, Reference Munger2021; Siegel et al., Reference Siegel, Nikitin, Barberá, Sterling, Pullen, Bonneau, Nagler and Tucker2021). Building on a new data set spanning the crucial period surrounding the 2020 Presidential Election, I show that, although tweets containing violent political rhetoric are rare (0.07 percent of political tweets, on average), they spread beyond those without direct ties to violent users. I find that almost 40 percent of the retweets of such content spread through indirect ties (i.e., my friend's friend, a friend of my friend's friend, etc.), thereby creating huge potential for incidental exposure to such abhorrent language. I also demonstrate that, although threatening tweets are shared primarily among ideologically similar users, there is a considerable amount of cross-ideological exposure as well, calling for further investigation into the effects of exposure to violent political rhetoric both from an in-party member and from an out-party member.
Finally, I shed light on the literature on mass partisan polarization and negative partisanship by demonstrating that violent partisanship is manifested online in the form of threats against partisan opponents. Recent studies on mass partisan polarization highlight that partisans are not just ideologically far apart (Abramowitz and Saunders, Reference Abramowitz and Saunders2008; Fiorina and Abrams, Reference Fiorina and Abrams2008) but also dislike or even endorse violence against our-party members (Iyengar et al., Reference Iyengar, Sood and Lelkes2012; Abramowitz and Webster, Reference Abramowitz and Webster2018; Kalmoe and Mason, Reference Kalmoe and Mason2018; Iyengar et al., Reference Iyengar, Lelkes, Levendusky, Malhotra and Westwood2019). However, there was little effort to explore how violent partisanship is expressed online. My work contributes to the literature by providing an easy-to-access indicator for tracking the level of violent partisanship. Considering the evidence that there are significant discrepancies between survey self-reports and actual online behavior (Guess et al., Reference Guess, Munger, Nagler and Tucker2019), my study provides an excellent complement to survey-based measurement as it enables researchers to directly observe the over-time trend of violent partisan behavior expressed online.Footnote 1 For instance, I illustrate that the level of violent political rhetoric on Twitter corresponds to the violent partisan tension offline, reaching its peak in the days preceding the Capitol Riot.
1 Related work
In this paper, I build on and contribute to three streams of literature. First, a large body of works takes a micro-level approach to study participation in offline political violence, helping shed light on those who threaten political opponents online. Second, an extensive body of research in political communication investigates violent political metaphors offline and aggressive speech in online political discussion, providing a rich context for an inquiry into violent rhetoric in online political communication. Third, research on political polarization and negative partisanship helps understand why social media users express a violent intention against out-partisans (a form of behavioral manifestation of extreme negative partisanship) and what consequences such behavior has.
1.1 Offline political violence
Although few studies exist to explain political violence online, there is an extensive body of literature explaining why individuals engage in offline political violence in various settings. Focused on conflict-ridden contexts, studies seek to explain why individuals participate in inter-group violence (ethnic, religious, partisan). Major explanations include selective incentives that alleviates the problem of free-riding (DiPasquale and Glaeser, Reference DiPasquale and Glaeser1998; Humphreys and Weinstein, Reference Humphreys and Weinstein2008), social pressure (Scacco, Reference Scacco2010; Fujii, Reference Fujii2011), and perceived distributive inequality (Claassen, Reference Claassen2016). Also, an interdisciplinary stream of studies on violent extremism seeks to identify a host of risk factors associated with individuals’ tendency to join violent extremist activities (LaFree and Ackerman, Reference LaFree and Ackerman2009; Borum, Reference Borum2011a, Reference Borumb; Gill et al., Reference Gill, Horgan and Deckert2014; McGilloway et al., Reference McGilloway, Ghosh and Bhui2015). Lack of stable employment, history of mental illness, low self-control, perceived injustice, and exposure to violent extremism are among the factors highlighted in the literature (Schils and Pauwels, Reference Schils and Pauwels2016; Pauwels and Heylen, Reference Pauwels and Heylen2017; LaFree et al., Reference LaFree, Jensen, James and Safer-Lichtenstein2018).
1.2 Aggressive political communication
Raising concerns about political elites’ violent rhetoric in the USA, a recent strand of studies investigates its political consequences (Kalmoe, Reference Kalmoe2014; Matsumoto et al., Reference Matsumoto, Frank and Hwang2015; Kalmoe et al., Reference Kalmoe, Gubler and Wood2018; Kalmoe, Reference Kalmoe2019). Kalmoe (Reference Kalmoe2019) shows that violent political metaphors (metaphors that describe politics as violent events such as a battle or a war) increase willingness to vote among individuals with highly aggressive personalities but the opposite effect is found among individuals low in aggressive personalities. Focusing on issue polarization, Kalmoe et al. (Reference Kalmoe, Gubler and Wood2018) find that violent political metaphors prime aggression in aggressive partisans and thus lead to intransigence on issue positions.
While violent political rhetoric is studied mainly in the context of political elites’ offline speech, many works in online political communication focus on incivility and hate speech. They point out that the reduced gate-keeping power of traditional media outlets and online anonymity gave rise to uncivil and hateful content targeted at people of a different race, gender, and partisan affiliation (Kennedy and Taylor, Reference Kennedy and Taylor2010; Berry and Sobieraj, Reference Berry and Sobieraj2013; Munger, Reference Munger2017; Shandwick, Reference Shandwick2019; Munger, Reference Munger2021). Aggressive online speech is reported to have crucial consequences for many political outcomes, including participation (Henson et al., Reference Henson, Reyns and Fisher2013; Sydnor, Reference Sydnor2019), information seeking (Sydnor, Reference Sydnor2019), inter-group evaluations, and deliberative attitudes (Gervais, Reference Gervais2019).Footnote 2 Accordingly, a large body of works is devoted to detecting (Waseem and Hovy, Reference Waseem and Hovy2016; Davidson et al., Reference Davidson, Warmsley, Macy and Weber2017; Zimmerman et al., Reference Zimmerman, Kruschwitz and Fox2018; Siegel, Reference Siegel2020) and discouraging uncivil and hateful speech (Munger, Reference Munger2017, Reference Munger2021).
1.3 Affective polarization and negative partisanship
Recent scholarship on political polarization highlights affective polarization, the degree to which citizens dislike and distrust out-partisans (Iyengar et al., Reference Iyengar, Sood and Lelkes2012, Reference Iyengar, Lelkes, Levendusky, Malhotra and Westwood2019). Documenting an increase in affective polarization over the last several decades (Iyengar et al., Reference Iyengar, Lelkes, Levendusky, Malhotra and Westwood2019), the scholarship seeks to uncover its negative consequences, including anti-deliberative attitudes, social avoidance, and outright social discrimination (MacKuen et al., Reference MacKuen, Wolak, Keele and Marcus2010; Iyengar et al., Reference Iyengar, Sood and Lelkes2012; Abramowitz and Webster, Reference Abramowitz and Webster2016; Huber and Malhotra, Reference Huber and Malhotra2017; Hutchens et al., Reference Hutchens, Hmielowski and Beam2019; Broockman et al., Reference Broockman, Kalla and Westwood2020; Druckman et al., Reference Druckman, Klar, Kkrupnikov, Levendusky and Ryan2020). Extending the study of negative partisanship, some works take one step further, evaluating the extent to which partisans rationalize harm and even endorse violence against partisan opponents (Kalmoe and Mason, Reference Kalmoe and Mason2018; Westwood et al., Reference Westwood, Grimmer, Tyler and Nall2021). Such negative partisanship has mainly been measured using survey self-reports. While there exist a handful of other approaches, such as implicit association test (Iyengar et al., Reference Iyengar, Lelkes, Levendusky, Malhotra and Westwood2019), survey self-reports have been the only strategy to measuring violent partisanship (Kalmoe and Mason, Reference Kalmoe and Mason2018; Westwood et al., Reference Westwood, Grimmer, Tyler and Nall2021).
2 Targeted violent political rhetoric
Building on the psychology literature on aggression (Anderson and Bushman, Reference Anderson and Bushman2002), I define violent political rhetoric as rhetoric expressing the intention of severe physical harm against political opponents.Footnote 3 This involves a threat and support of physical harm against political opponents and hopes of extreme physical harm inflicted on them (schadenfreude).Footnote 4
Existing studies on violent political rhetoric have employed various conceptualizations (Kalmoe, Reference Kalmoe2014; Kalmoe et al., Reference Kalmoe, Gubler and Wood2018; Kalmoe, Reference Kalmoe2019; Zeitzoff, Reference Zeitzoff2020). Zeitzoff (Reference Zeitzoff2020) employs an expansive definition of violent political rhetoric: “any type of language that defames, dehumanizes, is derogatory, or threatens opponents.” Thus, violent political rhetoric is conceptualized as a spectrum that encompasses “name-calling and incivility at the lower end and threats or calls for violence at the upper end.” Closely related to my study is the type of violent political rhetoric at the upper end of the spectrum.
Kalmoe and his coauthors’ works focus specifically on violent political metaphors (Kalmoe, Reference Kalmoe2014; Kalmoe et al., Reference Kalmoe, Gubler and Wood2018; Kalmoe, Reference Kalmoe2019). In their work, violent political metaphors are defined as “figures of speech that cast nonviolent politics of campaigning and governing in violent terms, that portray leaders or groups as combatants, that depict political objects as weapons, or that describe political environments as sites of non-literal violence.” In contrast to the definition employed in my study, this type of violent political rhetoric does not threaten (or support, incite) any physical violence against political opponents.
3 Detecting violent political rhetoric on Twitter
Many approaches have been proposed to detect hostile speech on social media, including incivility (Davidson et al., Reference Davidson, Sun and Wojcieszak2020; Theocharis et al., Reference Theocharis, Barberá, Fazekas and Popa2020) and hate speech (Siegel, Reference Siegel2020), employing various approaches from dictionary (Dadvar et al., Reference Dadvar, de Jong, Ordelman and Trieschnigg2012; Magu et al., Reference Magu, Joshi and Luo2017; Isbister et al., Reference Isbister, Sahlgren, Kaati, Obaidi and Akrami2018) to machine learning methods (Nikolov and Radivchev, Reference Nikolov and Radivchev2019; Williams et al., Reference Williams, Burnap, Javed, Liu and Ozalp2020).Footnote 5 However, there has been little effort to identify violent political rhetoric, a distinct form of hostile speech. While a small body of research on YouTube proposes several methods to identify threatening comments from YouTube videos (Wester, Reference Wester2016; Wester et al., Reference Wester, Øvrelid, Velldal and Hammer2016; Hammer et al., Reference Hammer, Riegler, Øvrelid and Velldal2019), they are narrowly focused on a small sample of videos in a highly specific context.Footnote 6 In this section, I introduce a new method that combines keyword filtering and machine learning to detect violent political rhetoric from a massive stream of content on Twitter (Figure 1).
Data collection pipeline.
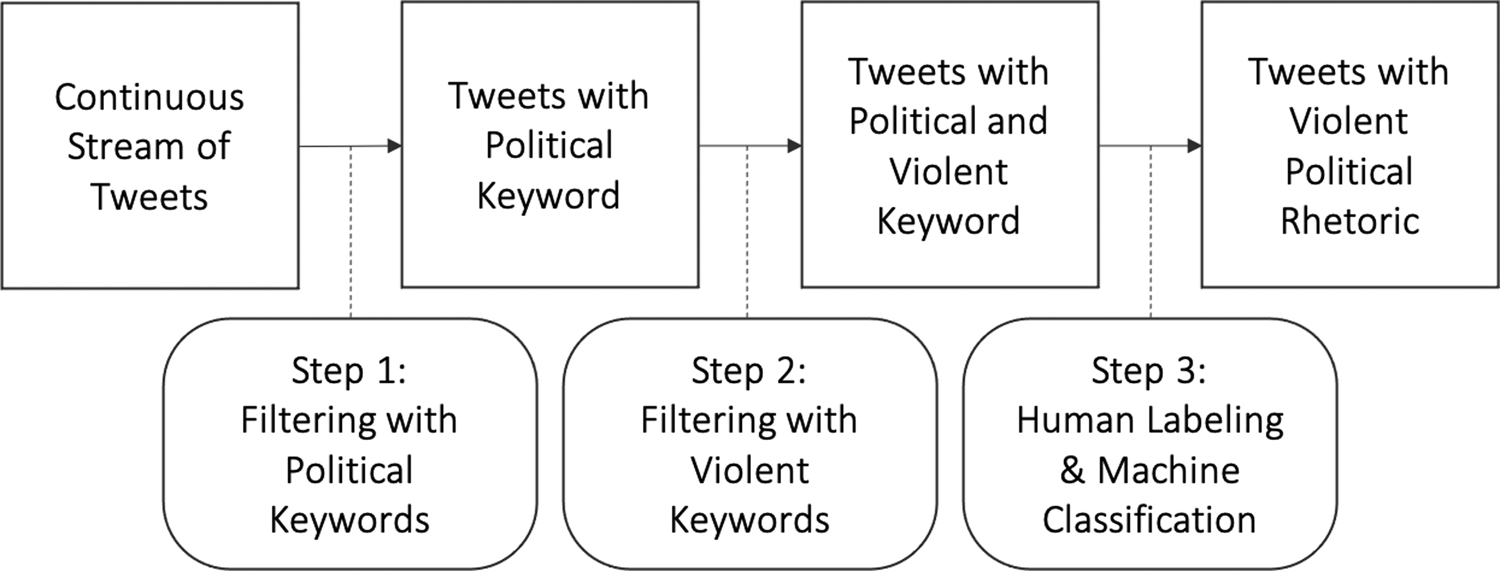
3.1 Step 1: filtering through political keywords
I start with compiling a list of political keywords to download tweets from a Twitter API (Application Programming Interface).Footnote 7 Since a massive number of heterogeneous tweets are generated in real time, I first filter the tweet stream through a set of political keywords. The keywords involve a broad sample of politicians’ accounts (members of Congress, governors, and the four candidates of the 2020 Presidential Election) as well as those belonging to major parties. The tweets filtered and downloaded through the list of accounts “mention” (Twitter, 2021a) at least one of the political accounts in the list.Footnote 8 Naturally, the keywords of my choice make the downloaded tweets political in nature. In addition, focusing on tweets mentioning these accounts is an effective approach to gather political tweets that engage (and threaten) politicians in conversation.Footnote 9
I then run a computer program that scrapes live tweets that contain any of the keywords in the list. The program is designed to scrape live tweets continuously via the Streaming API (Twitter, 2021c). This API allows researchers to scrape live tweets as they are published while another major API, the Search API, provides access to historical tweets up to a certain number of days in the past (Twitter, 2021f). The decision to opt out of the Search API is due to the potential for the platform to engage in censorship. That is, a set of tweets retrieved via the Search API will leave out violent tweets that have been deleted by Twitter for violating its terms of service.Footnote 10
3.2 Step 2: filtering through violent keywords
Once I have collected a corpus of tweets with at least one political keyword, I move on to the task of splitting it into violent and non-violent tweets. Here, my approach is very similar to the one taken in the previous step. I first compile a list of violent keywords and filter the existing tweets through those keywords. A challenge here is that any human-generated list of keywords might leave out potentially relevant tweets. As King et al. (Reference King, Lam and Roberts2017) demonstrate, humans are not particularly capable of coming up with a representative list of keywords for a certain topic or concept. In other words, it is hard for any single researcher to compile a comprehensive set of keywords used to express a violent intention against partisan opponents (e.g., kill, shoot, choke, etc.).
To deal with this, I combine model-based extraction of keywords with human judgment. First, I start with fitting a model to score terms in an external corpus that was already human-labeled in terms of whether a text is threatening or not. Here, I intend to extract violent keywords from a corpus that already contains information about what multiple people deem to be threatening. Specifically, I use a data set built by Jigsaw, a unit within Google (Jigsaw, 2020). The data set contains around two-million online comments labeled by human coders for various toxic conversational attributes, including “threat.” I fit a logistic regression model and extract terms (uni- and bi-gram features) that are most predictive of perceived threat (in terms of the size of the weights assigned to them). Second, given the weighted terms, I then use human judgment to set a threshold above which terms are included in the list of violent keywords. I set the threshold at the top-200 because over the top-200 terms, the terms were too generic to indicate any intention of violence. Using the list of terms, I divided the political tweets from step 1 into ones with and without at least one violent keyword. For more detailed information about keyword filtering in general and my violent keywords, see Online Appendix B.
3.3 Step 3: manual labeling and machine classification
Although the previous round of filtering relies on a list of violent keywords that people frequently use online and consider violent, only a small fraction of the violent-keyword tweets contain the intention of violence. This is because many tweets contain a violent keyword without expressing any intention of physical harm against political opponents. The major sources of false positives involve (a) when violent keywords are used as a metaphor that describes non-violent political events (Kalmoe, Reference Kalmoe2013, Reference Kalmoe2014; Kalmoe et al., Reference Kalmoe, Gubler and Wood2018; Kalmoe, Reference Kalmoe2019), (b) a religious curse that does not threaten physical harm (e.g., “burn in hell!”), (c) quoting (or even criticizing) violent political rhetoric from someone else, and (d) irony (e.g., “why don't you just shoot them all if you believe violence solves the problem?”). To more accurately identify tweets containing violent political rhetoric, three human coders, including myself and two undergraduate assistants, classified tweets in terms of whether the author expresses the intention of severe physical harm against a political opponent (see Supplementary materials for detailed coding rules). The coders manually labeled a set of 2500 tweets together and then individually labeled over 7500 tweets. The inter-coder agreement score in terms of Krippendorff's alpha is around 0.6, higher than the standard in the relevant literature (Krippendorff, Reference Krippendorff2018). For more information on the manual labeling, see Online Appendix C.
In addition, I used active learning (Settles, Reference Settles2009; Linder, Reference Linder2017; Miller et al., Reference Miller, Linder and Mebane2020) to more efficiently identify tweets with violent political rhetoric. Since the corpus compiled through steps 1 and 2 is highly imbalanced with only a small fraction containing violent political rhetoric, randomly sampling a training set for regular supervised learning will lead to inefficiency. That is, the training set will contain too few relevant tweets for any classifier to learn about what features predict violent political rhetoric. Using active learning, I go through an iterative process where I start with manually labeling randomly sampled texts to train a classifier, select (not randomly) texts whose predicted probabilities are around the decision threshold (ones whose class the classifier is most uncertain about), manually label the around-the-threshold texts, and finally accumulate those texts to re-train the classifier.
Through the iterative process, I compiled a training set of violent-keyword tweets labeled for violent rhetoric. I then trained various machine learning classifiers and the performance of the classifiers was evaluated on unseen (or held-out) data using fivefold cross validation in terms of precision, recall, and F-1 (Han et al., Reference Han, Pei and Kamber2011). To label the rest of the tweets, I selected the best performing classifier (precision: 71.8, recall: 65.6, F-1: 68.4), one built on BERT (bidirectional encoder representations from transformers) (Devlin et al., Reference Devlin, Chang, Lee and Toutanova2018). For more information on the active learning and machine classification process, see Online Appendix D.
4 Characteristics and spread of tweets containing violent political rhetoric
How prevalent is violent political rhetoric on social media? How do posts containing such rhetoric relate to offline-world politics? What types of politicians are targeted? What users use violent rhetoric against political opponents? How diffusive is violent political rhetoric and what predicts its spread? In this section, I provide comprehensive data analyses concerning the characteristics and spread of tweets containing violent political rhetoric. The following analysis is based on a data set of tweets collected between September 23, 2020 and January 8, 2021.Footnote 11 This 16-week period covers major political events concerning the 2020 Presidential Election, including the Capitol Riot and the suspension of Trump's Twitter account.
The key findings include the following. Violent political rhetoric on Twitter is closely related to offline contentious politics, spiking to its highest level in the days preceding the Capitol Riot. In terms of targeting, women and Republican politicians are more frequently targeted than men and non-Republican politicians. Violent users are ideologically extreme, located on the fringe of the communication network, and their ideological makeup varies over time depending on what issues violent political rhetoric arises from. The spread of violent tweets takes place primarily among ideologically similar users but there is also a substantial amount of cross-ideological spread, raising concerns about co-radicalization. While violent political rhetoric is rare (0.07 percent of political tweets) but almost 40 percent of retweets of violent tweets take place between users without a direct following tie, incidentally exposing a potentially huge audience to such appalling content.
4.1 Content and timeline of violent tweets
To shed light on how tweets containing violent political rhetoric differ from non-violent political tweets in terms of content, Figure 2 shows the terms that divide non-violent political tweets from violent political tweets. I rely on a feature selection/weighting method for comparing word usage across different groups called Fightin’ Words (Monroe et al., Reference Monroe, Colaresi and Quinn2008).Footnote 12 In the figure, the x-axis indicates the relative frequency with which the keyword occurs in each type. The y-axis in each panel depicts the extent to which the keyword is associated with each type (see Online Appendix E for the top-30 keywords). Note that some of the words included as indicating violent political tweets have already been baked in as part of the violent-keyword filtering.
Comparison of terms by type of tweets. Note: For the analysis, I took a sample of 10,000 tweets, with 5000 from each type. I used an R package quanteda for text preprocessing. Punctuation, symbols, numbers, stopwords, and URLs were removed from the text. The text was lower-cased and stemmed.
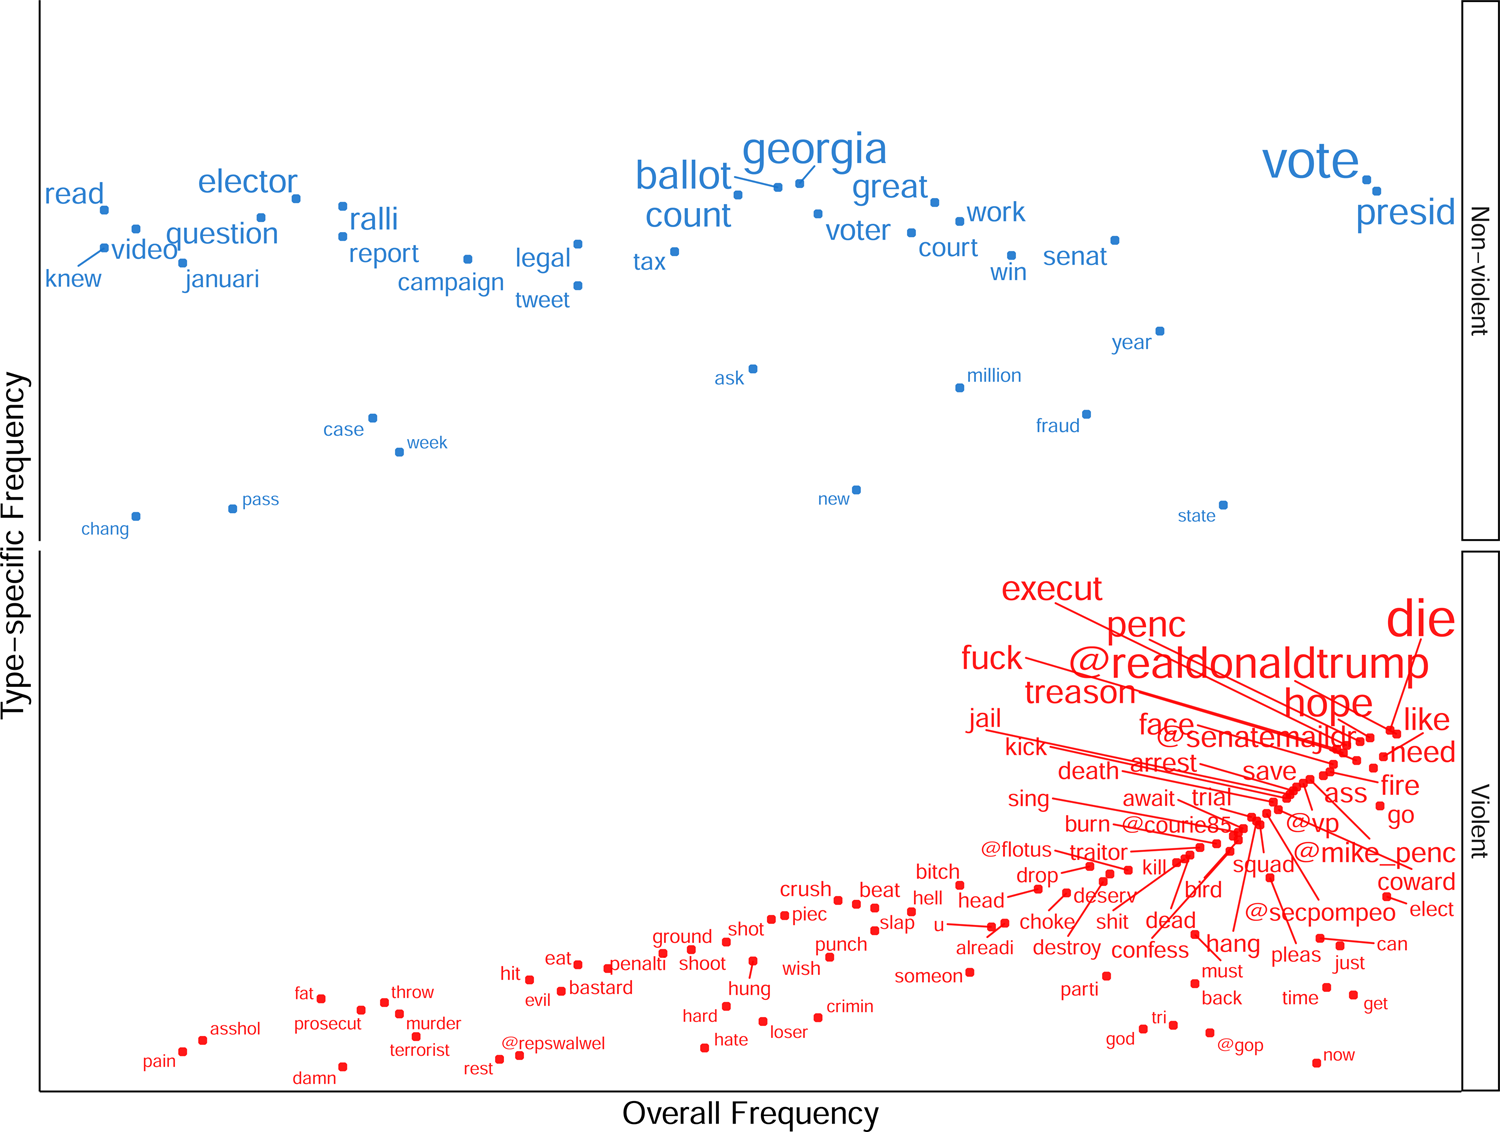
What is most noteworthy is that words that indicate certain political entities are much more frequent for violent tweets than for non-violent ones. We can see that, while no entity-specific words were included in the keywords for non-violent tweets, the violent keywords include many accounts that belong to high-profile political figures such as @realdonaldtrump (Donald Trump), @senatemajldr (Mitch McConnell), @mike_pence (Mike Pence), and @secpompeo (Mike Pompeo). In particular, the account for Trump, “@realdonaldtrump,” demonstrates that he was at the center of violent and divisive communication on Twitter. The prevalence of entity-specific words is also consistent with our focus on targeted violent political rhetoric. For the words indicating non-violent tweets, many general political terms are included (e.g., presid, vote, tax, elector, campaign) along with words that represent particular political events such as “georgia” (the Senate election in Georgia) or “fraud” (misinformation about election fraud).
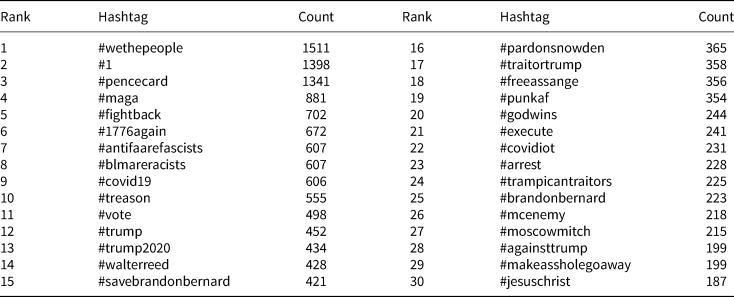
Now that we understand the stylistic characteristics of violent political rhetoric, what is talked about in violent tweets? To provide a general sense of the content in violent tweets, Table 1 reports the top-30 hashtags that are most frequently used in violent tweets.Footnote 13 Note that I had lower-cased the text of the tweets before extracting hashtags to match ones that only differ in capitalization. In general, the hashtags together show that the content of violent political rhetoric is highly variegated, revolving around diverse political/social issues: general partisan hostility (#wethepeople, #1), racial conflict (#antifaarefascists, #blmareracists), moral issues (#brandonbernard, #pardonsnowden, #freeassange), election campaigning (#vote, #trump2020), disputes over the election result (#pencecard, #fightback, #1776again), and the COVID-19 pandemic (#covid19, #walterreed, #covidiot). For the hashtags reflecting general partisan hostility (“#wethepeople” and “#1”), close manual reading reveals that they are used when users emphasize their in-partisans as representing the whole country (the former) and their out-partisans as the foremost enemy of the country (the latter). Although it is beyond the scope of this study to review every hashtag in the list, they together make it clear that violent political rhetoric is closely related to various political/social issues in offline politics.
Most frequent hashtags in violent political rhetoric (entire period)
Then, how frequent are violent tweets over time? Figure 3 illustrates the timeline of tweets containing violent political rhetoric. The trend is expressed in their count and proportion to the total number of political-keyword tweets. Regardless of the metric, the figure shows very similar trends. First, we can see that the proportion of violent political rhetoric is quite rare: an average of 0.07 percent of the tweets that include the political keyword(s) contain violent political rhetoric. Such rarity is consistent with findings from recent research on aggressive political communication on social media. For instance, Siegel et al. (Reference Siegel, Nikitin, Barberá, Sterling, Pullen, Bonneau, Nagler and Tucker2021) report that around 0.2 percent of political tweets contain hate speech during the period from June 2015 to June 2017. Although violent tweets comprise only a small fraction of political discussion, it is important to note that it amounts to hundreds of thousands of tweets containing violent political rhetoric, per day, and it is seen by the number of users that is far greater than that of such tweets themselves.Footnote 14
Timeline of violent political rhetoric (September 23, 2020–January 8, 2021). Note: The y-axis on the left side indicates the number of tweets containing violent political rhetoric while the other y-axis on the right side depicts the proportion of such tweets relative to tweets containing a political keyword. Each point in the lines indicates the three-day moving average.
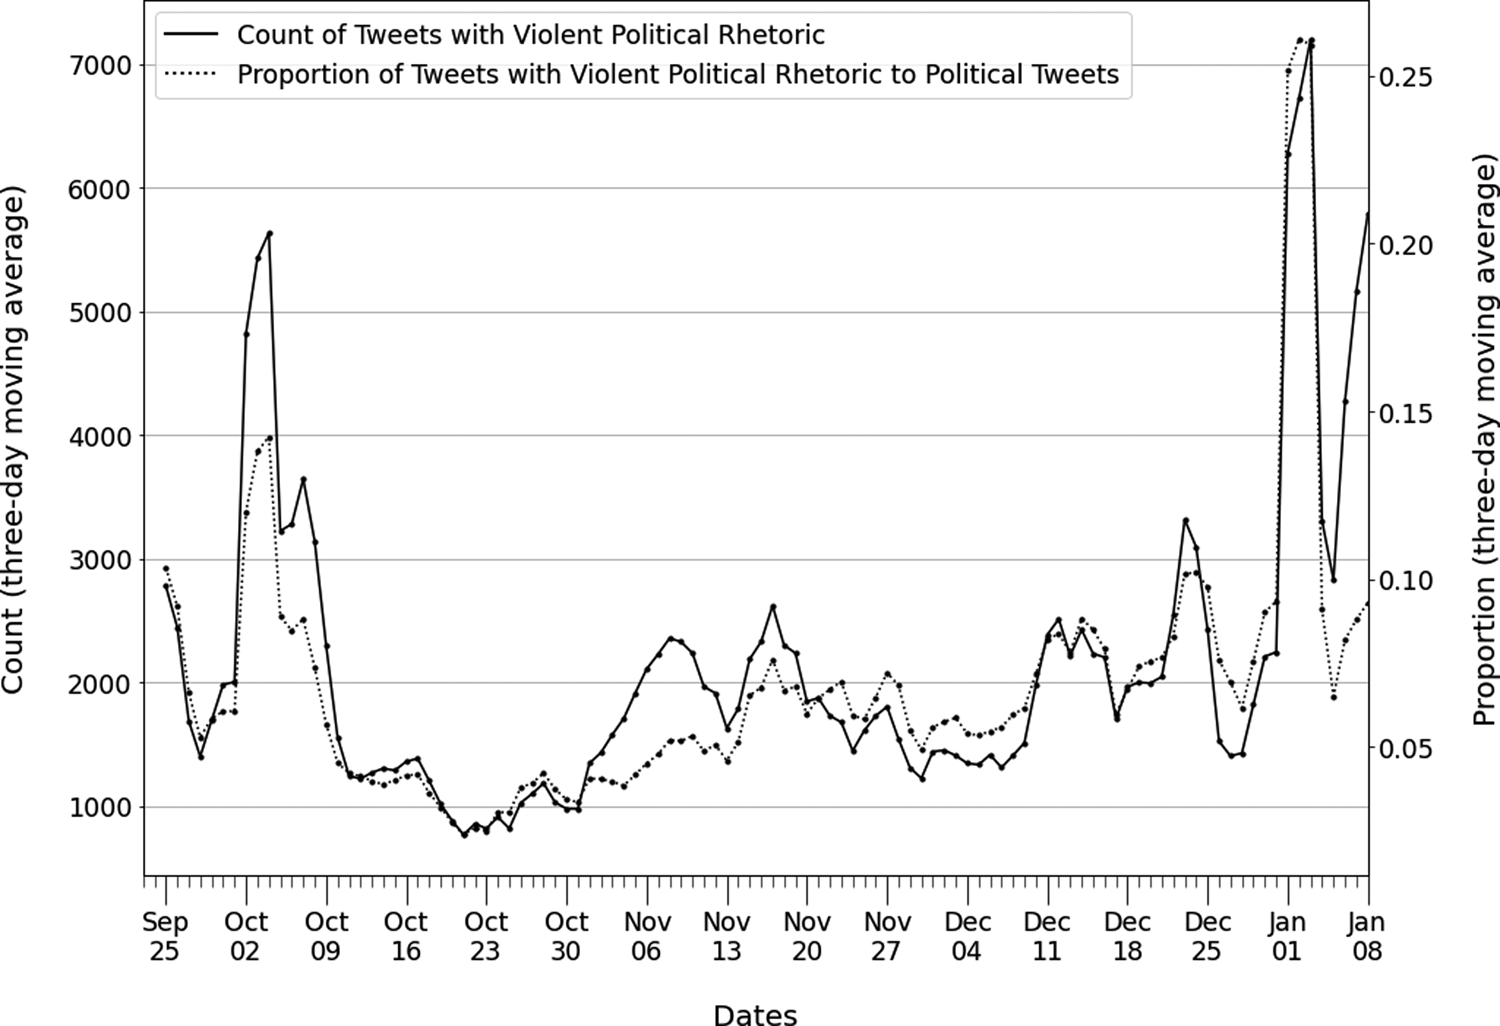
As illustrated in Figure 3, there is a considerable over-time variation in the trend of violent political rhetoric. In particular, two big spikes are prominent in early October 2020 and early January 2021 along with a steady increase toward the election and the period of power transition. To provide a detailed look into issues driving the trend, Table 2 reports the weekly top-5 hashtags included in violent tweets. While the steady uptrend toward the election and the period of power transition appears associated with the partisan competition/tension over the election and its results (#vote, #trump2020, #electionday, #laptopfromhell, #tonybobulinski), the two big spikes require further explanation. First, the hashtags for the week from September 30 to October 6 (e.g., #walterreed, #trump, #covidiot, #covid19) show that the earlier spike reflects political animosity surrounding Trump's infection of COVID-19 and his much-criticized behavior during his three-day hospitalization at Walter Reed military (O'Donnell, Reference O'Donnell2020). In addition, manual reading of the tweets on October 2 and the following several days verifies that numerous tweets express a violent intention against Trump.
Most frequent hashtags in violent political rhetoric (weekly)
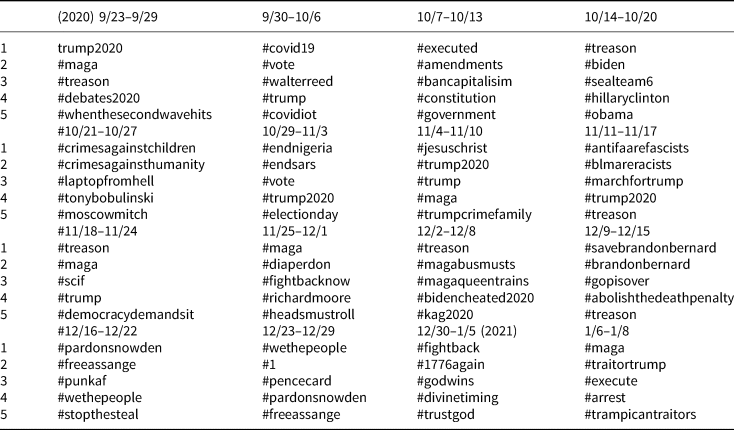
As for the later spike, the hashtags for the last couple of weeks, such as #fightback, #1776again, and #pencecard, are the ones that grew substantially among far-right extremists and conspiracy theorists who attempt to delegitimize the election results. We can also see that anti-Trump users, in turn, responded to the far-right discourse using hashtags such as “#arrest and #execute #traitortrump,” leading to the massive upsurge in the amount of violent political rhetoric during the last phase of the period under study.Footnote 15 It is also important to note that, while the general prevalence of violent political rhetoric in November and December reflects the partisan tension over the election results (#treason, #diaperdon, #fightbacknow, #stopthesteal) along with other politically salient issues, the drastic uptrend starting in the last week of 2020 appears to be predominantly driven by the extremist discourse agitated by Trump's continuous mobilization effort, on and off Twitter. Considering Trump's tweet instigating his radical supporters to gather in D.C. on January 6 and the riot on that day,Footnote 16 it is abundantly clear that offline political conflict is intertwined with violent political rhetoric on Twitter.Footnote 17
4.2 Politicians in violent tweets
Then, what politicians are mentioned in violent tweets? Tweets can “mention” an account either by directly including it in its text or by replying to tweets written by the account (Twitter, 2021a). Table 3 reports what politicians’ accounts are mentioned in violent tweets and presents them by the type of position, political party, and gender. Each cell records the average number of violent tweets that mention politicians’ accounts in a given category. First, the table shows that Trump is at the center of violent partisan expressions on Twitter. As a single political figure, he appears in far more violent tweets than all the other political accounts combined. Pence, the former vice president, attracts the second largest number of violent tweets followed by the contender for the presidency, Biden, and by the vice-presidential candidate from the Democratic Party, Harris. Also, representatives, compared to governors and senators, receive a small amount of attention in violent political tweets. Presumably, it might be due to the large number of representatives that makes them less likely to get sufficient individualized attention to stimulate violent partisan expressions.
Mean mention count
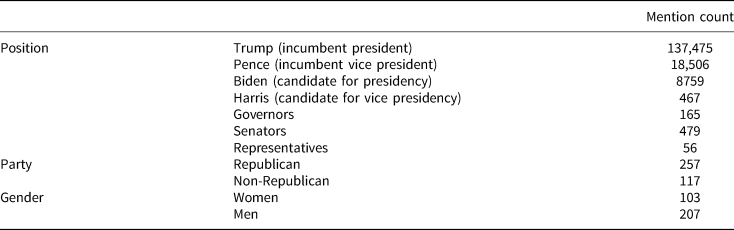
Given that Trump (Republican and man) can obscure the comparison based on political party and gender, statistics for political party and gender are reported without violent tweets that mention his account. The second part of the table shows that Republicans appear more frequently than non-Republicans (Democrats and a handful of independent/minor party politicians). Also, we can see that, on average, men politicians appear more frequently in violent tweets than women politicians.
To further explore how political party, gender, and the type of position correlate with the mentioning of politicians in violent tweets,Footnote 18 Table 4 reports the results from a negative binomial regression where the count of mentions in violent tweets, the outcome variable, is regressed against the type of position, political party, and gender. In line with the literature (Southern and Harmer, Reference Southern and Harmer2019), I include the number of followers to consider the amount of attention given to each politician. To prevent a tiny subset of the observations from being overly influential, I exclude the candidates for the presidential election (Biden, Trump, Harris, Pence) who attracted so much attention during the period around the election. For the details of modeling and robustness analysis, see Online Appendix F.
Mentioning of political accounts: negative binomial regression
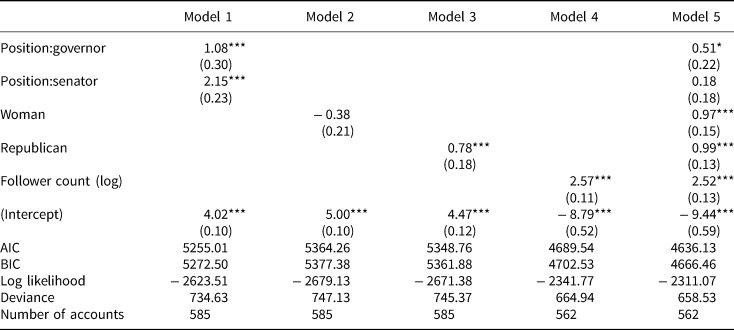
* Statistical significance: ***p < 0.001; **p < 0.01; *p < 0.05
* For models 4 and 5, the follower count was not retrieved for some accounts due to screen name change, suspension, etc.
First, the results reveal that being Republican correlates positively with mentioning in violent tweets (model 5). Why do Republican politicians appear more frequently in violent tweets than Democratic ones? One possibility is that politicians who belong to the party holding presidency are more frequently targeted as they might draw more attention and criticism, particularly given the amount of violent intention directed at Trump. Also, as often pointed out in the literature, Twitter users are younger and more likely to be Democrats than the general population (Wojcik and Hughs, Reference Wojcik and Hughs2019). Therefore, liberal users who outnumber conservative ones might write more violent tweets that target Republican politicians than their conservative counterparts do against Democratic politicians. Second, the results show that being a woman is positively associated with mentioning in violent tweets (model 5). This is consistent with both academic and journalistic evidence for online abuse against women politicians (Fuchs and SchÄfer, Reference Fuchs and SchÄfer2019; Rheault et al., Reference Rheault, Rayment and Musulan2019; Southern and Harmer, Reference Southern and Harmer2019; Felmlee et al., Reference Felmlee, Rodis and Zhang2020; Cohen, Reference Cohen2021; Di Meco and Brechenmacher, Reference Di Meco and Brechenmacher2021).
4.3 Engagement in political communication network by tweeter type
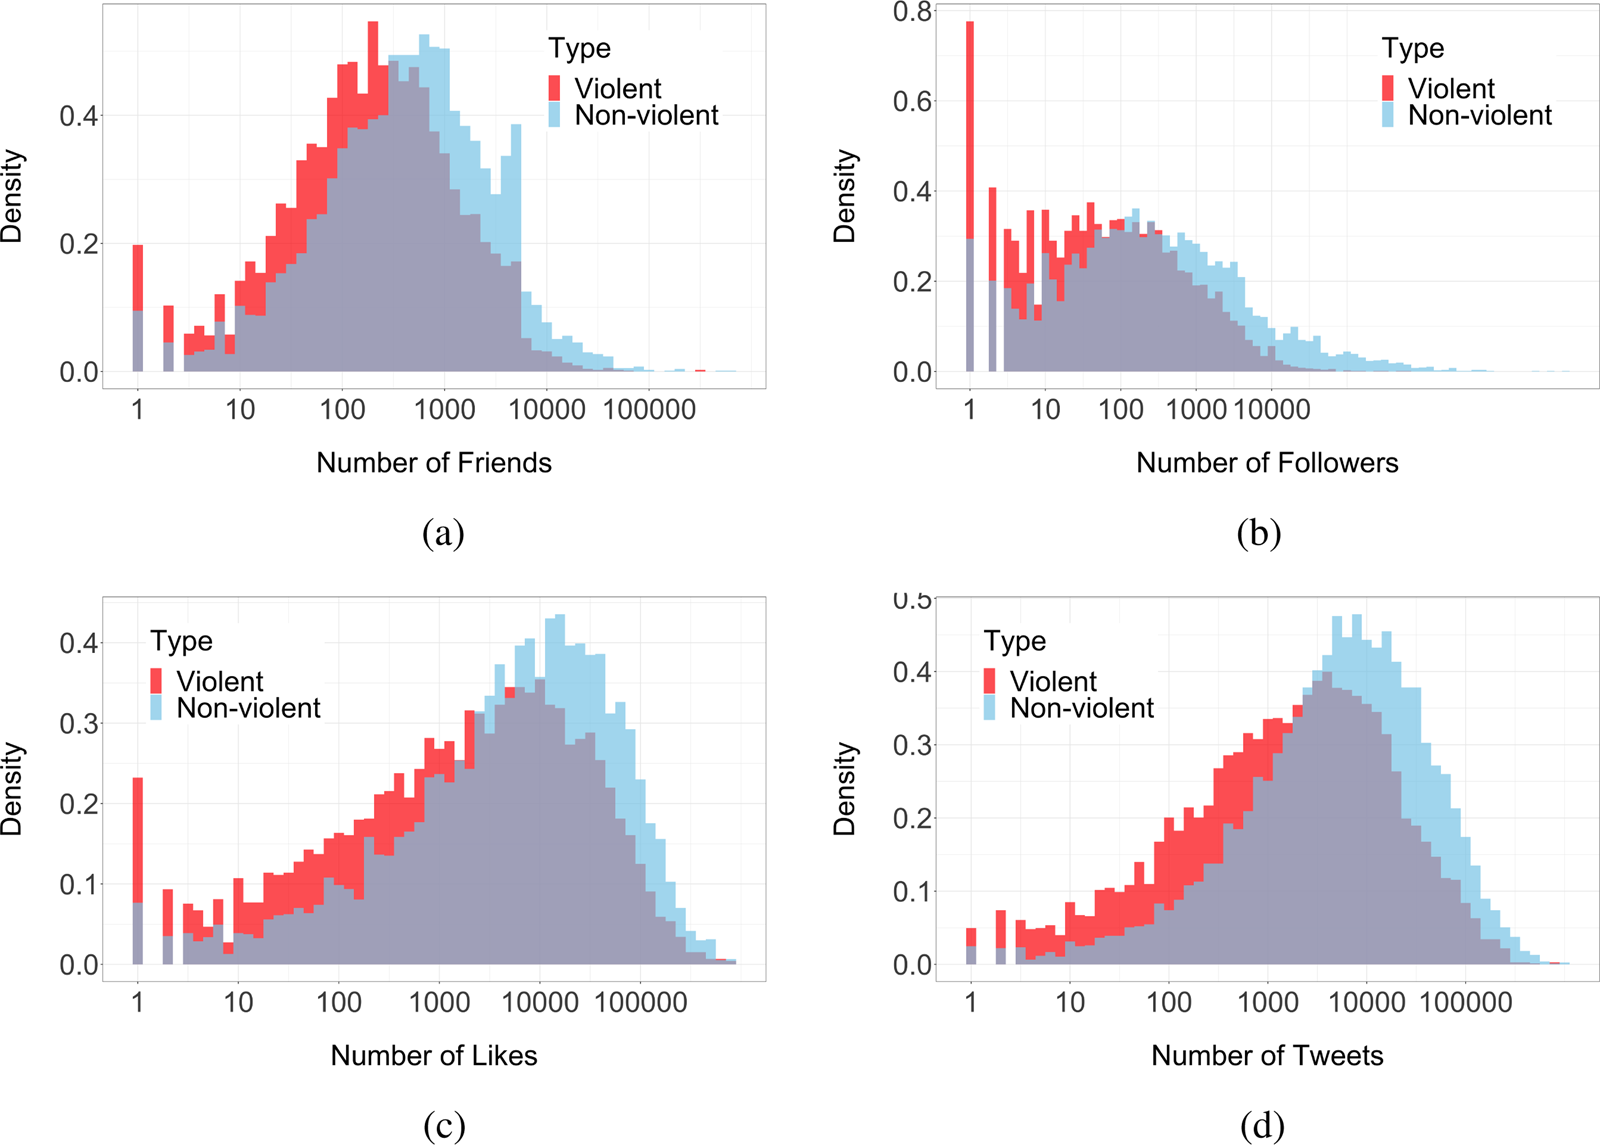
How central and active are violent and non-violent users in the political communication network on Twitter? This question is important because the more central to the network and active violent users are, the more likely ordinary users are exposed to violent political rhetoric. Figure 4 depicts the logged distribution of four user-level indicators in the political communication network (see Online Appendix G for the median values). Here, violent users follow (and are followed by) other users, “like” others’ tweets, and write tweets to a lesser degree than non-violent users, implying that violent users are on the fringe of the communication network (the number of friends and followers, and likes) and less active (the number of tweets).Footnote 19
Distribution for network engagement indicators. Note: The unit of observation is an account. Each of the four network engagement indicators is depicted on the x-axis. The original linear distribution for each indicator was log-transformed (base 10) after adding 1 in order to clearly visualize outliers. The y-axis depicts the probability density. “Friends” are whom a given user follows and “followers” are those who follow a given user.
4.4 Distribution of ideology by tweeter type
While there is plenty of evidence that far-right extremism is more responsible for offline political violence in the USA than their left-wing counterpart (e.g., Jones, Reference Jones2020), it is unclear whether such asymmetry holds in online political communication. How are violent users distributed on the ideological continuum? In panel (a) in Figure 5, I report the distribution of an ideology score for violent and non-violent tweeters, measured using an ideal point estimation approach introduced by Barberá (Reference Barberá2015).Footnote 20 Here, higher scores indicate greater conservatism. First, the distribution for non-violent tweeters shows that they are slightly more liberal (since the vast majority of political tweeters are non-violent ones, the distribution for non-violent tweeters is nearly identical to that of political tweeters). This is consistent with the fact that Twitter users tend to be liberal, younger, and Democrats (Wojcik and Hughs, Reference Wojcik and Hughs2019). Second, it is noteworthy that violent tweeters are more liberal than non-violent tweeters. We can see that the mean ideology score of violent tweeters leans toward the liberal direction. The results of Welch two-sample t-test also show that the difference is 0.18 and statistically significant (95 percent confidence interval (C.I.): 0.15, 0.20). This analysis reveals that liberals are no less violent than conservatives in online political communication, in contrast to the asymmetry in the offline world.
Ideology and ideological extremity by type of political tweeters. Note: The unit of observation is an account. For panels (a) and (b), larger values indicate greater conservatism. For panels (c) and (d), larger values indicate greater extremity. The vertical lines in panels (a) and (c) indicate the mean value for each group.
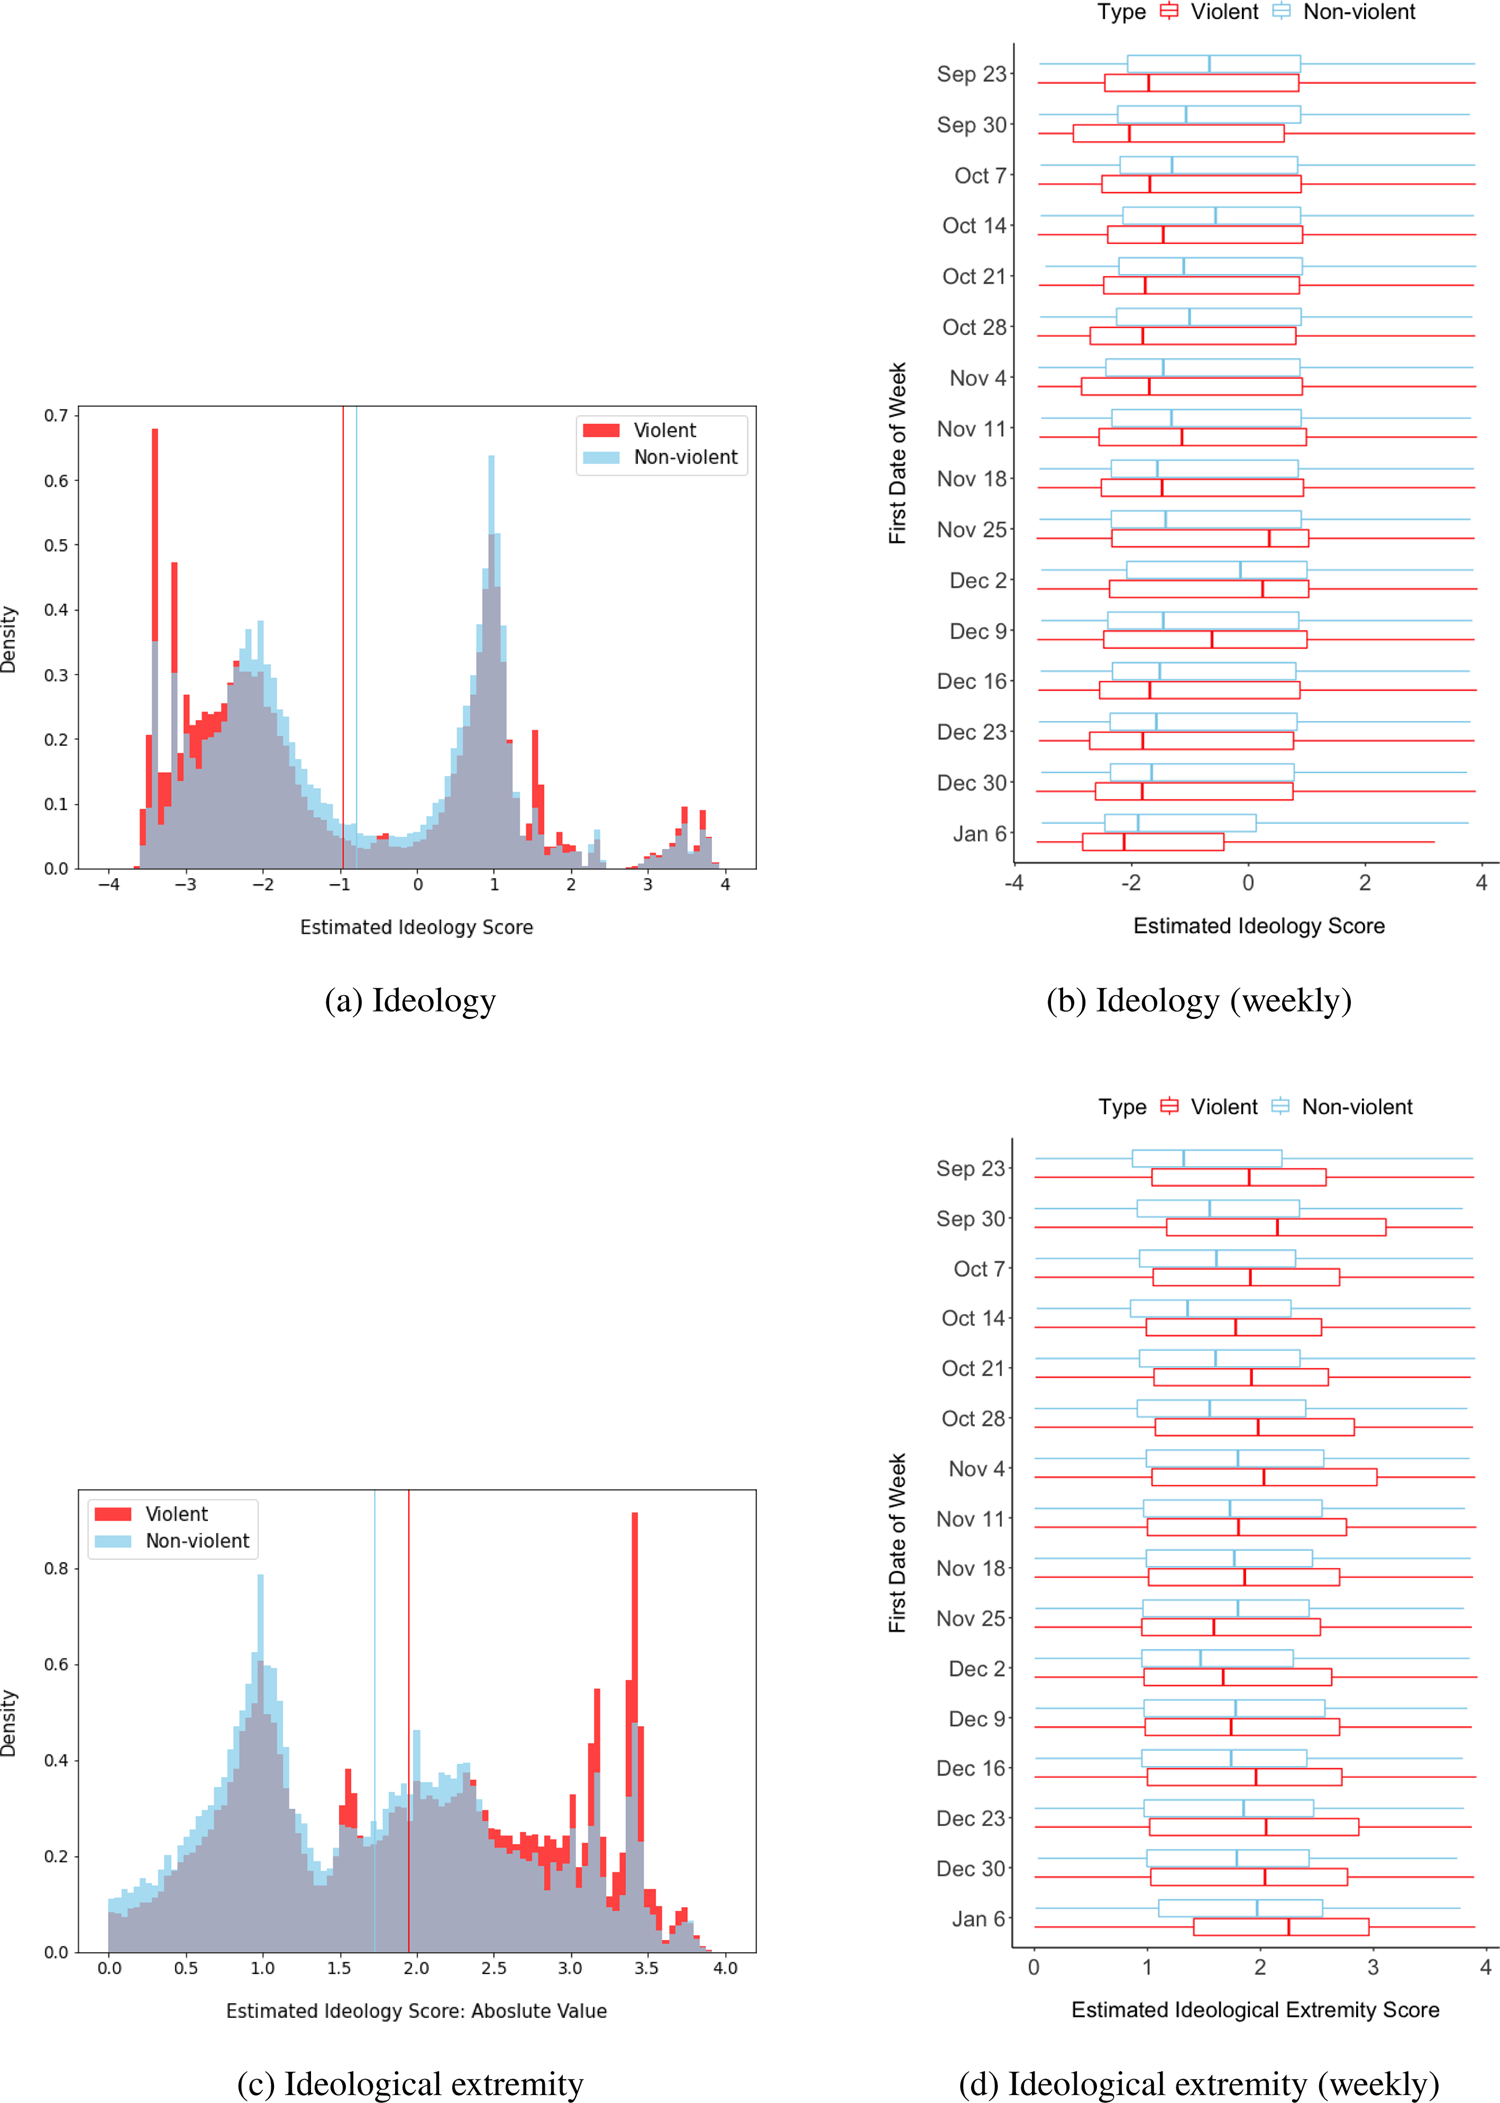
Certainly, the liberal slant might be affected by the fact that the data covers a period that only includes a Republican president. Indeed, a huge number of threatening tweets were targeted at Trump (see Table 3). Considering the level of hostility an incumbent president can provoke from the partisan opposition, liberals might be over-represented in violent tweets in the data. However, the liberal slant still exists after removing all the tweets that mention Trump's account (see Online Appendix H).
Here, it is important to note that there is over-time heterogeneity. Panel (b) in Figure 5 shows that, while violent users tend to be more liberal than non-violent ones for the first seven weeks, the trend flips for the next five weeks, and again flips back for the last four weeks. These findings imply that the use of violent language in online political communication is likely to reflect particular phrases of politics that stimulate violent partisan hostility—as seen in the hashtags in Table 2—rather than the use of violent political rhetoric bears an inherent relationship with ideology.
Finally, to get a sense of how ideologically extreme violent users are compared to non-violent users, I computed an ideological extremity score by taking the absolute value of the ideology score. Panel (c) in Figure 5 demonstrates that violent tweeters are more ideologically extreme than non-violent tweeters. The same pattern is also found for almost all the weekly distributions shown in panel (d). These results make intuitive sense in that those who display such radical online behavior are unlikely to be ideologically moderate just like offline political violence is committed by extremists on the far ends of the ideological spectrum.
4.5 Spread of violent political rhetoric
How do tweets containing violent political rhetoric spread? Existing research on online political communication suggests that, while political information is exchanged primarily among individuals who are ideologically similar (Barberá et al., Reference Barberá, Jost, Nagler, Tucker and Bonneau2015), there is also a significant amount of cross-ideological communication (Barberá, Reference Barberá2014; Bakshy et al., Reference Bakshy, Messing and Adamic2015). Then, in terms of retweeting, do violent tweets spread primarily among ideologically homogeneous users?Footnote 21 The first two panels in Figure 6 present two scatter plots for violent and non-violent tweets where tweeter's ideology score is on the x-axis and retweeters’ is on the y-axis. We can see the retweets are highly concentrated in the areas of similar ideology scores. The Pearson's R scores are around 0.7 (0.696 for the violent, 0.713 for the non-violent).
Spread of tweets containing violent political rhetoric.
Note: For panels (a) and (b), each point in the plots expresses the number of retweets where the ideology scores of the tweeter and the retweeter correspond to the x–y coordinates. Higher values indicate greater conservatism. For panel (c), the height of the bars depicts the proportion of tweets containing violent political rhetoric whose shortest distance on the following network belongs to each category. For non-violent tweets, I use a random sample of 238 tweets due to a heavy limit on retrieving follower IDs in the Twitter API (Twitter, 2021d).
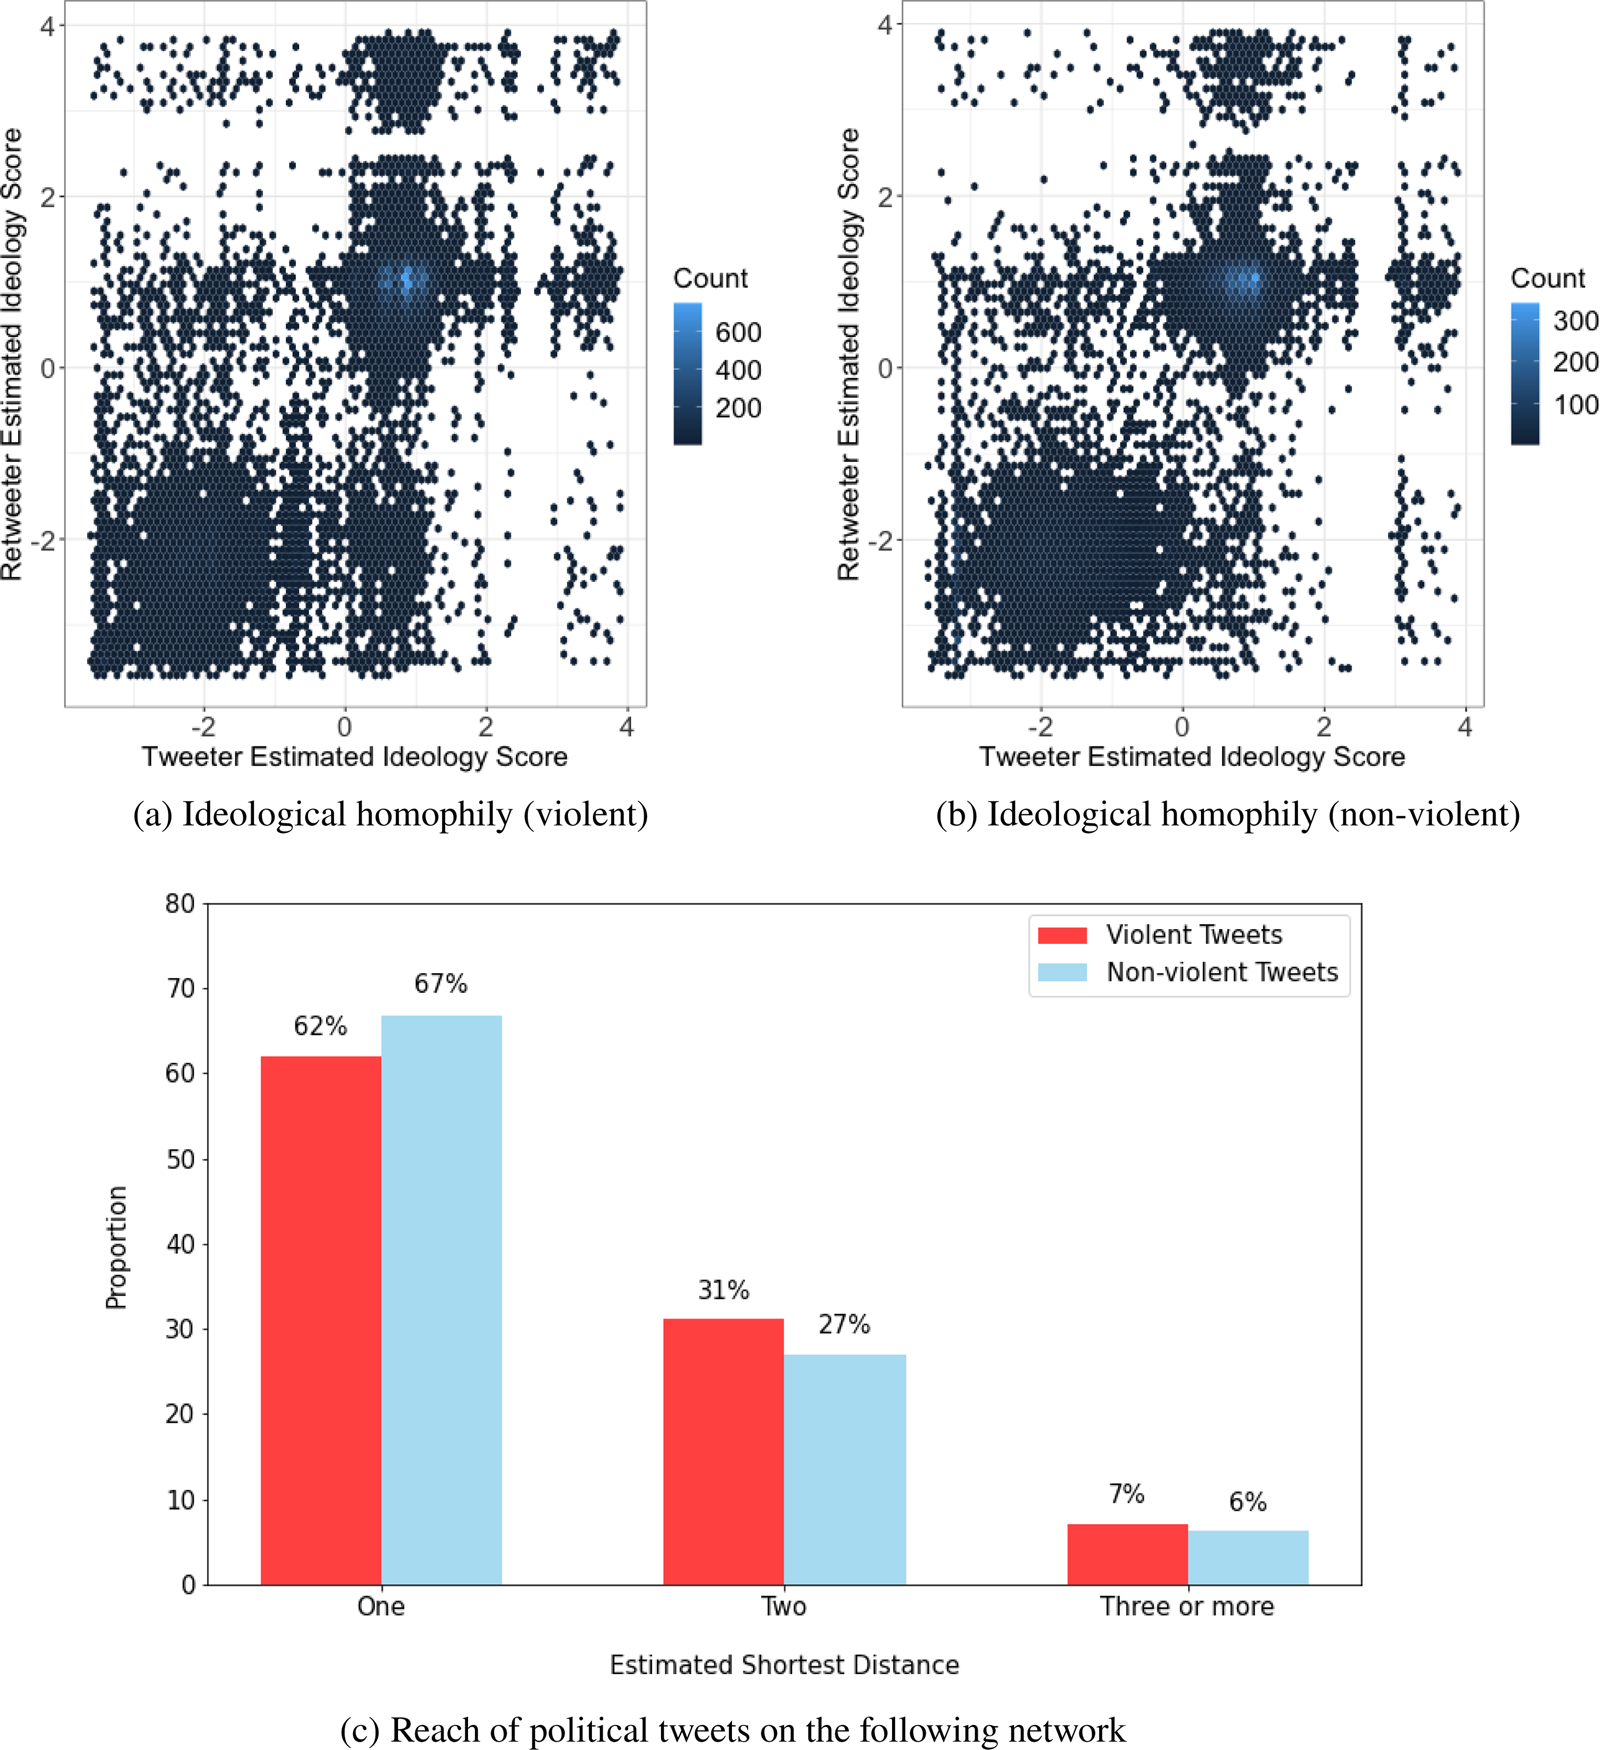
While the findings confirm that retweeting, both violent and non-violent, is affected by ideological homophily, there is a substantial amount of cross-ideological spread in both types of political communication (expressed on the top-left and bottom-right sides of the plots). Although the spread of violent political rhetoric takes place primarily among ideologically similar users, the findings imply that users encounter and spread partisan opponents’ violent behavior, potentially co-radicalizing each other by feeding off political opponents’ violent behavior (Ebner, Reference Ebner2017; Pratt, Reference Pratt2017; Knott et al., Reference Knott, Lee and Copeland2018; Moghaddam, Reference Moghaddam2018).
Then, how far do violent tweets travel on the Twitter communication network?Footnote 22 As previously discussed, violent tweeters tend to lie on the fringe of the communication network. However, their content still can travel to a large audience through indirect ties. Panel (c) in Figure 6 describes the distribution of the shortest path distance on the following network for all the retweets of violent and non-violent tweets in the data set. Here, the shortest path distance is the minimum number of following ties necessary to connect two users. The distance is estimated as one if the retweeter is in the tweeter's followers list (or the tweeter is in the retweeter's friends list). Similarly, the distance is estimated as two if the intersection between the retweeter's friends list and the tweeter's follower list is not an empty set (and if there is no direct follower/following relationship). If neither condition is met, the shortest distance is estimated as three or more.
As shown in panel (c), for both violent and non-violent tweets, around two-thirds of the retweets take place between pairs of users with a direct tie (62 and 67 percent, respectively). However, there is a substantial minority of retweets that travel beyond the tweeter's followers. Around one-third of the retweets take place between users whose estimated shortest path distance is two (31 and 27 percent). For the rest, tweets were retweeted over three or more ties (7 and 6 percent). The figure shows that political tweets in general spread widely and that violent tweets appear to spread just as far as non-violent tweets despite the offensive nature of the content.Footnote 23 Importantly, the findings imply that even if users do not follow a violent tweeter (even a violent tweeter's followers), it is still possible that they get exposed to such discomforting content against one's intent. Also, the impact of violent tweets can be dramatically amplified beyond the personal follower networks of violent tweeters, if highly popular users—themselves not violent—retweet violent tweets thereby exposing a large number of users to them.
5 Conclusion
The recent violent hostility among ordinary American partisans, as dramatically expressed in the Capital Riot, has drawn immense attention both from the media and academia. While the previous literature tends to view partisanship positively as guidance for policy stance and vote choice (Campbell et al., Reference Campbell, Converse, Miller and Stokes1980), such view is increasingly replaced by concerns about its destructive potential. At the same time, despite the clear benefits of social media for democracy such as political learning and participation (Dimitrova et al., Reference Dimitrova, Shehata, Strömbäck and Nord2014; Tucker et al., Reference Tucker, Theocharis, Roberts and Barberá2017), social media platforms are criticized and scrutinized for hateful and violent political communication and their role in stimulating and exacerbating offline violence between confronting partisans.
This paper is among the first to make sense of violent partisan hostility expressed online and thus contribute to the fields of grassroots political violence, online political communication, and violent partisanship. Methodologically, I introduce a new automated method that identifies violent political rhetoric from a massive stream of social media data, adding to the toolkit for measuring violent partisanship. Substantively, I demonstrate that violent political rhetoric on Twitter peaks in the days preceding the Capitol Riot, revealing its close relationship with contentious offline politics. Also, users who threaten violence are ideologically extreme and located on the fringe of the communication network. In terms of targeting, violent tweets are more frequently targeted at women and Republican politicians. While the number of violent tweets is small, such tweets often transcend direct inter-personal connections on the following network, amplifying their negative effects. Finally, such tweets are shared not only among like-minded users but also across the ideological divide, creating the potential for co-radicalization where ideologically extreme users further radicalize each other (Ebner, Reference Ebner2017; Pratt, Reference Pratt2017; Knott et al., Reference Knott, Lee and Copeland2018; Moghaddam, Reference Moghaddam2018).
In addition, the findings in this paper call for further research on the causes and consequences of violent political rhetoric. First, what are the causal relationships between violent political rhetoric online and offline political violence? While this paper presents abundant evidence for close relationships between the two, it is pressing for future research to scrutinize whether/how online and offline violent acts stimulate each other. Second, while recent research in political communication investigates the consequences of exposure to mildly violent political metaphors (Kalmoe, Reference Kalmoe2013, Reference Kalmoe2014, Reference Kalmoe2019; Kalmoe et al., Reference Kalmoe, Gubler and Wood2018), little attention has been paid to an extreme form of violent language such as threats of violence. Therefore, it is crucial to investigate the effects of exposure to speech threatening violence against out-partisans. Does exposure to threatening messages have a contagion effect where exposed individuals come to endorse political violence? Alternatively, does it stimulate any corrective effort where individuals who encounter such norm-violating behavior oppose political violence?
Supplementary material
The supplementary material for this article can be found at https://doi.org/10.1017/psrm.2022.12. To obtain replication material for this article, please visit https://doi.org/10.7910/DVN/NEC17Z.


 Open access