

1. Introduction
Arthritis is a disease involving pain, swelling and damage to joints and has severe consequences. Arthritis is controlled by multiple genetic factors, e.g. quantitative trait loci (QTLs) (Deighton & Criswell, Reference Deighton and Criswell2006; Orozco et al., Reference Orozco, Rueda and Martin2006), and is regulated by many susceptibility genes whose effects on arthritis are in turn modified by interactions with several environmental factors (Joe, Reference Joe2006; Oliver & Silman, Reference Oliver and Silman2006; Phelan & Thompson, Reference Phelan and Thompson2006).
Study of the genetic basis of arthritis has been fruitful. A landmark study of genetic factors of arthritis using animal models was conducted in 1996 when Remmers et al. (Reference Remmers, Longman, Du, O'Hare, Cannon, Griffiths and Wilder1996), using a rat model, first reported that multiple QTLs regulate susceptibility to collagen-induced arthritis (CIA). In their study, by limiting the analysis to animals with arthritis-susceptible major histocompatibility complex (MHC) genotypes and by using genome-wide QTL analytic techniques, they found four non-MHC QTLs – Cia2, Cia3, Cia4 and Cia5 on chromosomes 1, 4, 7 and 10 – that contributed to disease severity. In addition, a QTL on chromosome 8 was suggestive. Additional QTLs on other chromosomes or similar positions have also been identified (Otto et al., Reference Otto, Cs-Szabo, Gallagher, Velins, Mikecz, Buzas, Enders, Li, Olsen and Glant1999, Reference Otto, Chandrasekeran, Vermes, Mikecz, Finnegan, Rickert, Enders and Glant2000; Peters et al., Reference Peters, Jensen, Borrego, Cabrera, Baker, Starobinas, Ribeiro, Ibanez and De Franco2007). By a genome scan of a murine model of rheumatoid arthritis (RA), Otto et al. identified a total of 12 separate QTLs associated with proteoglycan-induced arthritis (Otto et al., Reference Otto, Cs-Szabo, Gallagher, Velins, Mikecz, Buzas, Enders, Li, Olsen and Glant1999) and MHC-independent QTLs (Otto et al., Reference Otto, Chandrasekeran, Vermes, Mikecz, Finnegan, Rickert, Enders and Glant2000). Many QTLs have been finely mapped (Backdahl et al., Reference Backdahl, Ribbhammar and Lorentzen2003; Yu et al., Reference Yu, Bauer, Wernhoff, Koczan, Moller, Thiesen and Ibrahim2006; Ahlqvist et al., Reference Ahlqvist, Bockermann and Holmdahl2007), and their potential molecular mechanisms and interactions have been studied (Bahabri et al., Reference Bahabri, Suwairi, Laxer, Polinkovsky, Dalaan and Warman1998; Adarichev et al., Reference Adarichev, Nesterovitch, Bardos, Biesczat, Chandrasekaran, Vermes, Mikecz, Finnegan and Glant2003; Glant et al., Reference Glant, Adarichev, Nesterovitch, Szanto, Oswald, Jacobs, Firneisz, Zhang, Finnegan and Mikecz2004; Johannesson et al., Reference Johannesson, Karlsson, Wernhoff, Nandakumar, Lindqvist, Olsson, Cook, Andersson and Holmdahl2005; Martin et al., Reference Martin, Zhang, Luo, Jin, Doyle, Rajska, Coffman, Smith, Becker, Mackensen, Khan, Levinson, Schumacher, Wade, Rosenbaum and Reveille2005; Jensen et al., Reference Jensen, Peters, Borrego, Ribeiro, Cabrera, Starobinas, Siqueira, Ibanez and De Franco2006; Laragione et al., Reference Laragione, Yarlett, Brenner, Mello, Sherry, Miller, Metz and Gulko2007). For example, Yu et al. (Reference Yu, Bauer, Wernhoff, Koczan, Moller, Thiesen and Ibrahim2006) used 308 (DBA/1×FVB/N)F11/12 AIL mice to refine QTLs controlling the severity and onset of arthritis, as well as the antibody (Ab) response and T-cell subset in CIA, namely Cia2, Cia27 and Trmq3. These QTLs were originally identified in (DBA/1×FVB/N)F2 progeny. The confidence intervals of the three QTLs were refined from 40, 43 and 48 Mb to 12, 4·1 and 12 Mb, respectively. Potential functions of genes relevant for arthritis, including MHC class I chain related (MIC) A, cytosolic phospholipase A2-alpha, tumour necrosis factor-α (TNF-α) and IL-6, have also been reported (Martinez et al., Reference Martinez, Fernandez-Arquero, Balsa, Rubio, Alves, Pascual-Salcedo, Martin-Mola and de la Concha2001; Nikitina Zake et al., Reference Nikitina Zake, Cimdina, Rumba, Dabadghao and Sanjeevi2002; Hegen et al., Reference Hegen, Sun, Uozumi, Kume, Goad, Nickerson-Nutter, Shimizu and Clark2003; Hoang et al., Reference Hoang, Hammermuller, Mix, Kreutzer, Goerlich, Kohler, Nizze, Thiesen and Ibrahim2004). Genes that regulate QTL including neutrophil cytosolic factor-1 and Forkhead box O3A were also studied (Olofsson et al., Reference Olofsson, Holmberg, Tordsson, Lu, Akerstrom and Holmdahl2003; Jonsson et al., Reference Jonsson, Allen and Peng2005). Many QTLs have also been identified from mice, mainly from CIA models (Otto et al., Reference Otto, Cs-Szabo, Gallagher, Velins, Mikecz, Buzas, Enders, Li, Olsen and Glant1999; Martinez et al., Reference Martinez, Fernandez-Arquero, Balsa, Rubio, Alves, Pascual-Salcedo, Martin-Mola and de la Concha2001; Hegen et al., Reference Hegen, Sun, Uozumi, Kume, Goad, Nickerson-Nutter, Shimizu and Clark2003; Yu et al., Reference Yu, Bauer, Wernhoff, Koczan, Moller, Thiesen and Ibrahim2006; Ahlqvist et al., Reference Ahlqvist, Bockermann and Holmdahl2007).
Arthritis has been studied using different mouse models (Johannesson et al., Reference Johannesson, Hultqvist and Holmdahl2006). An interesting model is that of spontaneous arthritis in mice deficient for the production of interleukin-1 receptor antagonist (IL-1ra) (Horai et al., Reference Horai, Saijo, Tanioka, Nakae, Sudo, Okahara, Ikuse, Asano and Iwakura2000). Mice homozygous for IL-1ra deficiency developed inflammation of the hind limbs beginning at about 8 weeks of age. Histopathologic examination of the joints of these mice shows infiltration with inflammatory cells and synovial proliferation. Not all strains of mice are susceptible. Balb/c mice are highly susceptible with an incidence approaching 100% by 12 weeks of age, whereas both C57BL and DBA/1 mice are resistant. Although C57BL and DBA/1 IL-1ra-deficient mice are resistant to spontaneous arthritis, they have increased susceptibility to CIA compared to wild-type (WT) mice.
The basis for susceptibility to inflammatory arthritis under an IL-1ra deficiency is unknown. Joint tissue isolated from susceptible and resistant mice showed increased expression of a variety of inflammatory cytokines including IL-1, IL-6 and TNF-α (Johnson & Lapadat, Reference Johnson and Lapadat2002; Nakae et al., Reference Nakae, Saijo, Horai, Sudo, Mori and Iwakura2003; Horai et al., Reference Horai, Nakajima, Habiro, Kotani, Nakae, Matsuki, Nambu, Saijo, Kotaki, Sudo, Okahara, Tanioka, Ikuse, Ishii, Schwartzberg, Abe and Iwakura2004). These cytokines have been shown to be important in the pathogenesis of human RA. Given the well-known role of IL-1 in mediating immunity and inflammation, it is reasonable to hypothesize that immune mechanisms are intimately involved.
To better understand the pathogenesis of spontaneous arthritis in IL-1ra-deficient mice, we performed whole-genome linkage analysis to detect QTLs that regulate disease incidence and severity. We then analysed the candidate genes with bioinformatics tools and genome information.
2. Materials and methods
(i) Animals and breeding
Animals that had an IL-1ra deficiency on the Balb/c background (Balb−/−) were initially provided by Dr Yoichiro Iwakura (Tokyo Medical and Dental University, Tokyo, Japan). Animals that had an IL-1ra deficiency on the DBA/1 background (DBA−/−) were generated at the University of Tennessee Health Science Center (UTHSC) (Zhou et al., Reference Zhou, He, Iwakura, Horai and Stuart2005). F1 mice were produced by crossing Balb−/− with DBA−/−. From F1 mice, 600 F2 mice were produced. Experimental animal procedures and mouse husbandry were performed in accordance with the National Institutes of Health's Guide for the Care and Use of Laboratory Animals and approved by the UTHSC Institutional Animal Care and Use Committee.
(ii) Phenotyping
Mice from the F2 generation were observed for the development of spontaneous arthritis. Individual mice were visually inspected for the presence of arthritis at least three times weekly. Each limb was scored on a scale of 0–4 as previously described (Zhou et al., Reference Zhou, He, Iwakura, Horai and Stuart2005).
(iii) Genomic DNA
Genomic DNAs (gDNA) were extracted from the livers of phenotypically normal +/+, heterozygous −/+ and homozygous mutant −/− mice by using a Qiagen Genomic-tip20/G (Qiagen, Alameda, CA, USA) following the manufacturer's instructions. The quality and quantity of the DNA were determined by an Eppendorf photometer (Eppendorf Scientific, Westbury, NY, USA).
(iv) Genotyping
Two cohorts of F2 population were used in the genetic mapping. The first set, 191 F2 mice, along with five mice from the two parental lines and F1 mice, was genotyped along the whole genome at the Marshfield Clinic Research Foundation (http://marshfieldclinic.org/research/pages/index.aspx). The second set was used for fine mapping using markers on chromosome 1. The genotype of the second set, 561 F2 mice, and two parents was done at UTHSC. Microsatellite markers were first selected according to information provided by The Jackson Laboratory (http://www.informatics.jax.org). Polymorphisms of these markers were tested using gDNA from both parental strains and four F1 mice. Polymorphic markers between two parental strains then were used for genotyping (Supplementary Table 1 available online at http://cambridge.journals.org/GRH). PCR-based genotyping using microsatellite markers was performed as described previously by Beamer and co-workers (Jiao et al., Reference Jiao, Chiu, Fan, Jiao, Eckstein, Beamer and Gu2007). DNA fragments were amplified by PCR. PCR products were analysed on the Mega-Gel Dual High-Throughput Vertical Electrophoresis systems (C. B. S. Scientific, Del Mar, CA, USA).
(v) Linkage analysis
Phenotypes and genotypes of every F2 individual were used in the mapping of susceptibility loci. The program R/qtlbim was used for Bayesian QTL mapping of ordinal traits (Yandell et al., Reference Yandell, Mehta, Banerjee, Shriner, Venkataraman, Moon, Neely, Wu, von Smith and Yi2007). Two analyses were conducted. In each analysis, the Markov chain Monte Carlo sampler was run 4×10⁵ iterations after a burn-in of 2×10³ iterations. The resultant chain was thinned (we saved every 20th iteration) to reduce serial correlation in the stored samples such that the total number of samples kept in the posterior analysis was 2×10⁴. In the first analysis, a one-dimensional whole-genome scan was conducted using data from 191 F2 mice. Significance was assessed using Bayes factors, which are ratios of marginal likelihoods. A Bayes factor of 3 (2 log e (BF)=2·1) is considered positive evidence, whereas a Bayes factor of 20 is considered strong evidence (Kass et al., Reference Kass, Ventura and Brown2005; Hoang et al., Reference Hoang, Hammermuller, Mix, Kreutzer, Goerlich, Kohler, Nizze, Thiesen and Ibrahim2004; Storey et al., Reference Storey, Dai and Leek2007). According to the results of this first analysis, a second analysis was conducted on six chromosomes using 561 F2 mice.
(vi) Identification of transcripts in QTL regions
Mouse genomic sequences from the Ensembl database (http://www.ensembl.org/index.html) were used to identify and retrieve every gene and transcript within a specified QTL region. Two markers or genomic sequences that flanked the QTL were used as bordering sequences for Ensembl searching.
(vii) Bioinformatics evaluation of candidate genes
Evaluation of genes within the genetic region of chromosome 1 was conducted with a searching tool, PGMapper (http://www.genediscovery.org/pgmapper/index.jsp) (Xiong et al., Reference Xiong, Qiu and Gu2008). For every known gene, a potential connection with arthritis was evaluated by searching information from Online Mendelian Inheritance in Man (OMIM) at http://www.ncbi.nlm.nih.gov/entrez/query.fcgi?db=OMIM and PubMed at http://www.ncbi.nlm.nih.gov/entrez/query.fcgi?db=PubMed. Query terms were the combination of the name of the gene with any of these key words: arthritis, inflammation, anti-inflammatory, inflammatory mediator, inflammatory cytokine, autoimmune, immune, joint damage, T-cell, macrophage, neutrophil, angiogenesis, synovial, synovial hyperplasia, synovial fibroblast, lymphocytic infiltrate and cartilage degradation. For any potential candidates, at least the abstract of one reference was read by two authors to determine a link between the gene and arthritis. For a gene with more than one reference that indicated its candidacy, at least two references were read and cited in this study.
(viii) Functional correlation of candidate genes with IL-1ra
Correlations between candidate genes for QTL on chromosome 2 and key genes in the IL-1ra pathway were determined using GeneNetwork at http://www.genenetwork.org/. Data of gene expression from kidney and liver of 46 mouse recombinant inbred lines derived from C57BL/6J and DBA/2 (BXD) were used for the evaluation. The GeneNetwork consists of a set of linked resources for systems genetics. It has been designed for multiscale integration of networks of genes, transcripts and traits such as cancer susceptibility and behaviour. It enables users to readily reconstruct a genetic network based on microarray data without being intimately involved with complicated mathematical computation. A simple graphical user interface also enables rapid, intuitive mapping and analysis of the reconstructed network. These high-level capabilities allow biologists to explore gene relationships at the system level.
(ix) Affymetrix microarray assay
Splenic gene expression patterns in the arthritis susceptible – (Balb/c-based) and resistant – (DBA/1-based) IL-1ra knockout (KO) mice were analysed using Affymetrix microarray platform. Male IL-1ra−/− mice, 4 months old, were used for the present study (three for each group). Wide-type male Balb/c and DBA/1 mice, 4 months old, were purchased from The Jackson Laboratory and housed in the same animal care facility as IL-1rn−/− mice. Spleens were quick frozen in liquid nitrogen and stored at −80°C. Total RNA was extracted using Trizol reagent according to the manufacturer's instructions. The quality of total RNA was determined by Agilent's Bioanalyzer. The ratio of 28S/18S was above 1·8 for all the samples. Oligonucleotide microarray assays were carried out starting with 4 μg of total RNA, including mouse genome 430 2·0 arrays, one-cycle cDNA synthesis kit, sample clean-up module, IVT labelling kit, Fluidics Station 450 and Scanner 3000 (Affymetrix) according to the manufacturer's instructions. Assays were done individually for each sample. Raw data in Microsoft Excel format were generated using GCOS 1.3 software (Affymetrix).
(x) Microarray data analysis
To increase the accuracy for signal and fold change calculations, the probe logarithmic intensity error estimation (PLIER) algorithm method was applied to generate the intensity values of transcripts together with the MAS5 method for generating the detection calls (present, marginal or absent) using Expression Console software (Affymetrix). After abundance (⩾16), detection call (absent) and fold change (⩾2·0) filtering, significance of gene expression changes between WT and KO mice (expressed as a P-value) was determined using EDGE software, which proves to be superior to current methods (Leek et al., Reference Leek, Monsen, Dabney and Storey2006). Significance level was set at P<0·05. Functional clustering of these gene expression changes was carried out using DAVID tools (P<0·01 was considered significant) (http://david.abcc.ncifcrf.gov).
3. Results
(i) Arthritis of F2 mice
Mice from the parental strain DBA−/− did not develop arthritis, whereas mice from the parental strain Balb−/− developed severe disease. Accordingly, we expected that spontaneous arthritis of mice in the F2 population would range from no disease to severe disease. As shown in Figure 1, the disease states of mice in the F2 population fell into all categories of disease severity. We hypothesized that there are multiple genes that influence susceptibility to spontaneous arthritis in IL-1ra-deficient mice and that Babl/c alleles tend to increase susceptibility, whereas DBA/1 alleles tend to decrease susceptibility.
Disease incidence and severity for 588 F2 mice. The x-axis shows the disease severity in ordinal categories from 0 (no disease) to 4 (most severe). The y-axis shows the number of female and male mice in each disease category. The total number of mice in disease categories 0, 1, 2, 3 and 4 are 214, 101, 94, 72 and 107, respectively. M/F ratio represents male and female ratio of disease.

However, two distinguishing features occur in the F2 population. The first is a distorted male–female ratio. In a total of 588 progeny, the numbers of male and female mice were 193 and 395, respectively. The expected ratio of male to female is 1:2. The second is disease incidence. Among 193 male mice, only 50 had no disease. Thus, 25·9% male progeny were free of arthritis at 4 months of age; in females, 164 out of 395 (41·5) were arthritis free at 4 months. Male mice had a high spontaneous arthritis incidence in all disease categories (Table 1).
Disease incidents and severity of F2 mice
(ii) Genotype of two progenitor strains and F2 population
A total of 137 microsatellite markers with an average of 12 cM coverage of the whole genome were used for determining the correlation of arthritis phenotypes with genotype of 191 F2 progenies. Those markers covered every autosomal chromosome (Supplementary Table 1). The sex chromosome was not genotyped, as we did not conduct an experiment to specifically track the X and Y chromosomes in the F2 population. Based on the results from whole-genome scanning of 191 F2 mice, an additional 42 markers on six chromosomes were used to genotype an additional 561 F2 progenies. Those markers were located on a specific region of each chromosome to confirm the QTLs detected from the original 191 progenies.
(iii) Whole-genome scan of QTLs that regulate spontaneous arthritis between Balb/c and DBA/1
Based on the clear difference of the susceptibility to spontaneous arthritis between the two parental strains, we expected to obtain at least one major genetic locus. Within such a locus, there might be multiple genes involved in pathogenic pathways for spontaneous arthritis in IL-1ra-deficient mice.
After we conducted QTL analysis with phenotypes and genotypes of 191 F2 progenies, we obtained evidence for potential QTLs on chromosomes 1, 6, 11, 12 and 14. While strong QTLs on chromosomes 1 and 6 have 2 log BF values over 6, weaker QTLs on chromosomes 11, 12 and 14 (Fig. 2(a)) have 2 log BF values over 2·1. While the QTL on chromosome 11 seems to overlap with what Otto et al. reported, other QTLs have not been reported in the mouse (Otto et al., Reference Otto, Cs-Szabo, Gallagher, Velins, Mikecz, Buzas, Enders, Li, Olsen and Glant1999, Reference Otto, Chandrasekeran, Vermes, Mikecz, Finnegan, Rickert, Enders and Glant2000; Yu et al., Reference Yu, Bauer, Wernhoff, Koczan, Moller, Thiesen and Ibrahim2006). The QTL on chromosome 1 was located between D1Mit303 and D1Mit145. The peak for the QTL on chromosome 1 was located at 67·4 cM, which is between D1Mit217 and D1Mit102. There might be a second peak at 81·6 cM near D1Mit425, which is different from the QTL previously mapped on chromosome 1 by Otto et al. The QTLs reported by Otto et al. (Reference Otto, Cs-Szabo, Gallagher, Velins, Mikecz, Buzas, Enders, Li, Olsen and Glant1999) is located between 9 and 40 cM.
Genetic loci that regulate spontaneous arthritis in IL-1a deficient mice. (a) Whole-genome QTL scan. The dashed grey horizontal line indicates the significance threshold for positive evidence and the dashed black horizontal line indicates the significance threshold for strong evidence. (b). Likelihood ratio (LR) statistics for the QTLs on chromosome 1. The two vertical black lines indicate the critical region of the QTLs flanked by microsatellite markers D1Mit265 and D1Mit110.

(iv) Map of special interest regions of chromosome 1 with a total of 561 F2 mice
To confirm and finely map the QTLs on chromosome 1, an additional 561 F2 mice were genotyped. We selected markers based on known polymorphisms between Balb/c and DBA/2 because of the lack of polymorphic information on markers for DBA/1. Those markers were tested using Balb/c, DBA/1 and F1 mice. Eight markers were finally selected and were used for fine mapping of the QTLs on chromosome 1.
The newly mapped QTLs on chromosome 1 with 561 F2 had a peak at 82·6 cM near D1Mit55 (Fig. 2(b)). This QTL might explain as much as 12% of the variation in the arthritis susceptibility. This region is homologous to human 1q23–25, 1q25–31,1q31 and 1q32. At least two reports have suggested a QTL for arthritis in the homologous region on human chromosome 1 (Martinez et al., Reference Martinez, Fernandez-Arquero, Balsa, Rubio, Alves, Pascual-Salcedo, Martin-Mola and de la Concha2001; Nikitina Zake et al., Reference Nikitina Zake, Cimdina, Rumba, Dabadghao and Sanjeevi2002).
(v) Transcripts within the genetic locus on chromosome 1
To collect all potential candidate genes within the QTLs on chromosome 1, we examined a region from 74·3 to 95·8 cM with two flanking markers, D1Mit265 and D1Mit540, which covered the entire QTL region under 1-LOD. According to Ensembl release 57 (May 2010), D1Mit265 and D1Mit540 are located between 150 686 864 and 150 686 967 bp and 170 686 037 and 170 686 161 bp, respectively (Fig. 3(a)). The QTL region contains 208 known transcripts or pseudogenes as of 20 June 2010 (Fig. 3(b)).
Bioinformatics analysis of candidate genes in QTLs on chromosome 1. (a) Genomic location of QTLs on chromosome 1. Microsatellite markers flanking right and left borders of the QTL region are used to define the genomic region of the QTL. (b) Genomic information of QTLs on chromosome 1. The total number of transcripts within the flanked genomic region was retrieved from the Ensembl genome database. (c) Functional assessment of every transcript was conducted using PGMapper, which searched information in PubMed and OMIM, and microarray analysis, which provided information on the expression level of candidate genes in spleen. (d) Further analysis of candidate genes using GeneNetwork to detect the correlations between candidate genes and IL-1a.

(vi) Initial evaluation of potential candidate genes for QTL on chromosome 1
To identify potential candidate genes, we investigated the function of every one of those 208 known genes through a literature search using key words/phrases (as noted in Materials and methods section) with PGmapper (Fig. 3(c)). We found 83 candidate genes from OMIM and PubMed (Supplementary Tables 1 and 2 available online at http://cambridge.journals.org/GRH). Several genes in the list were particularly interesting candidates. One obvious candidate gene was prostaglandin-endoperoxide synthase 2 (Ptgs2 or Cox2). It is well known that Cox2 is the product of inflammatory conditions such as RA and osteoarthritis (OA). Selective inhibitors for Cox2 have long been drug targets. The MHC, class I-related (Mr1), was one of the most obvious candidates as it has been linked previously to arthritis (Nikitina Zake et al., Reference Nikitina Zake, Cimdina, Rumba, Dabadghao and Sanjeevi2002; Martin et al., Reference Martin, Zhang, Luo, Jin, Doyle, Rajska, Coffman, Smith, Becker, Mackensen, Khan, Levinson, Schumacher, Wade, Rosenbaum and Reveille2005). Cytosolic phospholipase A2-alpha (Pla2g4a) is another gene previously associated with arthritis (Hegen et al., Reference Hegen, Sun, Uozumi, Kume, Goad, Nickerson-Nutter, Shimizu and Clark2003). Fas ligand (Fasl) (TNF superfamily, member 6) is a key ligand for inflammation and neutrophil apoptosis in arthritis (Hoang et al., Reference Hoang, Hammermuller, Mix, Kreutzer, Goerlich, Kohler, Nizze, Thiesen and Ibrahim2004; Jonsson et al., Reference Jonsson, Allen and Peng2005). Proteoglycan 4 (Prg4) is a joint lubrication molecule, lubricin/superficial zone protein, in the subchondral bone in areas of human osteoarthritic knee. Further investigation of these candidate genes is necessary to clarify their roles in regulating spontaneous arthritis.
From the microarray analysis (Fig. 3(c)), 11 genes were found to be differentially expressed in the mapped QTLs on chromosome 1, including upregulation of Cd247, Aldh9a1, Ncf2 and Sell, and downregulation of F5, Npl, Rnasel, Selp, Mgst3, Blzf1 and Slc19a2. However, only the differential expression levels of Sell (Selectin L) and Selp (Selectin P) have been reported in a study of genetic control of leucocyte–endothelial cell interaction in CIA using a mouse model (Tu-Rapp et al., Reference Tu-Rapp, Pu, Marques, Kulisch, Yu, Gierer, Ibrahim and Vollmar2010). Another interesting gene was Ncf2 (neutrophil cytosolic factor-2), which is a component of the NADPH oxidase complex. Polymorphisms of two of the NADPH oxidase complex, Ncf1 and Ncf4, have been linked to arthritis. A single nucleotide polymorphism (SNP) in Ncf1 has been found to increase severity of arthritis in rats (Olofsson et al., Reference Olofsson, Holmberg, Tordsson, Lu, Akerstrom and Holmdahl2003). Association of an SNP with arthritis was found in a human population in a case-control study of RA (Olsson et al., Reference Olsson, Lindqvist, Kallberg, Padyukov, Burkhardt, Alfredsson, Klareskog and Holmdahl2007). Whether Ncf2 plays a role in regulating QTL on chromosome 1 needs further study.
(vii) Establishing potential biological connection between candidate genes and IL-1ra pathway
At the time of this study, gene expression profiles were available from only livers and kidney from 46 BXD RI strains in the GeneNetwork. The majority of candidate genes cited above expressed at a detectable level in both kidney and liver of those mouse strains (Table 2). The correlation of every one of those genes directly with the genes of the IL-1ra (IL-1, IL-1r, IL-1rn, IL-1ra and IL-1rap) pathway were analysed using the GeneNetwork (Fig. 3(d)). Only the expression level of Mr1, Prg4 and Ptgs2 showed a correlation to the IL-1ra pathway (Table 2). Prg4 showed a positive correlation to IL-1rap in kidney and IL-1r1 in liver, while Mr1 showed a negative correlation with IL-1r1 in liver. Ptgs2 showed a positive correlation with IL-1rapl2 (interleukin-1 receptor accessory protein-like 2) which, combining with interleukin-1, initiates a change in cell activity by inhibiting the activity of type I interleukin receptors. This information did not necessarily exclude any other candidate genes; however, it provided us the evidence for prioritizing our candidate gene list for future candidate selection.
Potential interactions between candidate genes and IL-1r1
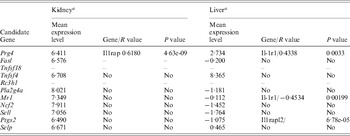
a Designated by log 2 of the mean of relative expression level from 46 RI strains.
4. Discussion
Using an F2 mouse population created by intercrossing a resistant strain and a strain susceptible to spontaneous arthritis under IL-1ra deficiency (Horai et al., Reference Horai, Saijo, Tanioka, Nakae, Sudo, Okahara, Ikuse, Asano and Iwakura2000, Reference Horai, Nakajima, Habiro, Kotani, Nakae, Matsuki, Nambu, Saijo, Kotaki, Sudo, Okahara, Tanioka, Ikuse, Ishii, Schwartzberg, Abe and Iwakura2004; Nakae et al., Reference Nakae, Saijo, Horai, Sudo, Mori and Iwakura2003), we mapped QTLs that regulate spontaneous arthritis in the absence of IL-1ra. Differences between the numbers and locations of QTLs from this study and previous studies suggest that, while spontaneous arthritis is controlled by many genetic factors, the pathways relevant to IL-1ra have a major impact. In particular, the QTLs on chromosome 1 appear to have a major genetic effect on spontaneous arthritis in this F2 population. It is important to narrow this region and identify the causative gene(s) underlying this QTL.
The approach of integrative strategy for identifying candidate genes from QTL has been widely used since it is proposed 10 years ago (Gu et al., Reference Gu, Li, Lau, Edderkaoui, Donahae, Rosen, Beamer, Shultz, Srivastava, Mohan and Baylink2002; Li et al., Reference Li, Masinde, Gu, Wergedal, Hamilton-Ulland, Xu, Mohan and Baylink2002). We believe that our experience using bioinformatics tools to identify and prioritize candidate genes for the QTLs on chromosome 1 may be useful not only for the study of QTLs of arthritis but also for study of QTLs of other diseases. Despite the success in localizing QTL for many human diseases by using animal models, identifying genes that are responsible for the QTL remains a major challenge. One of the difficulties is that the genomic region of a QTL is generally considered to be too large to search for candidate genes. Thus, the available genome resource, gene expression data and bioinformatics tools may speed the search of candidate genes for many QTL studies. However, we realize that our search is limited by the availability of current information. A gene for which its function has not been reported to be relevant to arthritis or immunity is not necessarily a gene that does not have such a function. Such a function could simply not have been studied or reported yet. Also, the microarray data should also be interpreted with caution. A change in the expression level of a transcript could be a reason a gene leads to a QTL. However, a gene without a change in its expression level does not necessarily mean that it is not a candidate gene for a QTL. Polymorphisms in the coding region of a gene often do not affect transcript abundance; however, the polymorphism may affect gene function.
The effect of IL-1ra deficiency on the birth rate and disease incidence of spontaneous arthritis in mice has not been reported. In our previous observation of Balb/c IL-1ra-deficient mice and DBA/1 IL-1ra-deficient mice, we did not notice those differences (Zhou et al., Reference Zhou, He, Iwakura, Horai and Stuart2005). It is very possible that those phenomena could be missed at a small breeding scale when the purpose is only to maintain mutants or to produce a small number of mice. IL-1ra has been linked to a number of diseases such as anklyosing spondylitis (Agrawal et al., Reference Agrawal, Srivastava, Sharma, Pandya, Misra and Aggarwal2008), multiple sclerosis (Dincic et al., Reference Dincic, Zivkovic, Stankovic, Obradovic, Alavantic, Kostic and Raicevic2006) and metabolic diseases (Perrier et al., Reference Perrier, Darakhshan and Hajduch2006). The mechanism of its effect on the male birth rate and incidence of spontaneous arthritis may provide an important clue to its molecular pathway and function in human development. As such, we feel that it is worthy of future investigation.
We did not obtain as many QTLs for spontaneous arthritis compared to studies using models of CIA (Otto et al., Reference Otto, Cs-Szabo, Gallagher, Velins, Mikecz, Buzas, Enders, Li, Olsen and Glant1999; Yu et al., Reference Yu, Bauer, Wernhoff, Koczan, Moller, Thiesen and Ibrahim2006; Ahlqvist et al., Reference Ahlqvist, Bockermann and Holmdahl2007). One possible explanation is that CIA may be regulated by more QTLs than spontaneous arthritis under IL-1ra deficiency. Consideration of the molecular pathways involved may suggest that CIA involves late steps of the pathways, while IL-1ra involves early steps. The genomic background of the parental strains may also play a role in uncovering QTL (Horai et al., Reference Horai, Saijo, Tanioka, Nakae, Sudo, Okahara, Ikuse, Asano and Iwakura2000). On the other hand, many QTLs in this study are on the same locations as QTL for CIA, suggesting that the same pathways may be involved in both induced diseases.
We obtained a list of candidate genes through bioinformatics, gene expression profiles and molecular pathway analysis. However, the majority of candidate genes from those three approaches appear different from each other. Only Mr1 and Ptgs2 appear in both bioinformatics and pathway analyses. Further analysis of SNP of those genes and gene expression profiles at the site of diseases may improve the candidate gene selection.
In summary, our study produced useful data on the genetic regulation of spontaneous arthritis under the murine Balb/c and DBA/1 genomic backgrounds. The QTLs and information on candidate genes provide a basis for further analysis of molecular mechanisms of spontaneous arthritis.
This work was supported by the Center of Genomics and Bioinformatics and Center of Connective Tissue Research at the University of Tennessee Health Science Center; the Veterans Administration Medical Center in Memphis and the National Institute of Arthritis and Musculoskeletal and Skin Diseases, National Institutes of Health (R01 AR51190 to W. G.; R01 AR50785 to J. S.). We thank Dr Yoichiro Iwakura, Center for Experimental Medicine, Institute of Medical Science, University of Tokyo, Tokyo, Japan, for providing IL-1ra-deficient mice for this study. We thank Dr David Armbruster for editing this manuscript.


