


1. INTRODUCTION
Understanding the internal dynamics of glaciers and ice sheets is important for predicting how they will respond to external forcing factors, such as rising sea level and warming ocean and air temperatures (e.g. Weertman, Reference Weertman1974; Thomas, Reference Thomas1979; Conway and others, Reference Conway2002; Pfeffer, Reference Pfeffer2007; Favier and others, Reference Favier2014; Aschwanden and others, Reference Aschwanden, Fahnestock and Truffer2016). Flow switching, where the trajectory of ice flow significantly alters in time, has been inferred in modern ice sheets (e.g. Retzlaff and Bentley, Reference Retzlaff and Bentley1993; Jacobel and others, Reference Jacobel, Scambos, Raymond and Gades1996; Anandakrishnan and Alley, Reference Anandakrishnan and Alley1997; Conway and others, Reference Conway2002; Hulbe and Fahnestock, Reference Hulbe and Fahnestock2004) and reconstructed in palaeo-ice sheets (e.g. Dowdeswell and others, Reference Dowdeswell, Ottesen and Rise2006; Stokes and others, Reference Stokes, Clark and Storrar2009; Ó Cofaigh and others, Reference Ó Cofaigh, Evans and Smith2010; Stokes and Tarasov, Reference Stokes and Tarasov2010; Winsborrow and others, Reference Winsborrow, Stokes and Andreassen2012; Stokes and others, Reference Stokes, Corner, Winsborrow, Husum and Andreassen2014). Flow switching is associated with changes in ice dynamics (e.g. Payne and Dongelmans, Reference Payne and Dongelmans1997; Conway and others, Reference Conway2002) and could lead to either increases or decreases in velocity. It is therefore of importance to future mass-balance predictions, although few examples of flow switches taking place in modern glaciers have been documented. This letter documents the first observation of a minor flow switch as it happens and provides strong support for a topographic (bathymetric) control.
Winsborrow and others (Reference Winsborrow, Stokes and Andreassen2012) reviewed the literature and proposed five mechanisms that may control flow switching: (1) accumulation of sediment causing accommodation space to be filled (Dowdeswell and others, Reference Dowdeswell, Ottesen and Rise2006); (2) variations in bathymetry causing asynchronous response of ice flow (Stokes and others, Reference Stokes, Clark and Storrar2009); (3) variations in basal thermal regime (Ó Cofaigh and others, Reference Ó Cofaigh, Evans and Smith2010); (4) variations in subglacial meltwater routing and sticky spot location (Anandakrishnan and Alley, Reference Anandakrishnan and Alley1997); and (5) large-scale changes in mass balance (Payne and Dongelmans, Reference Payne and Dongelmans1997). All research into flow switching to date has been carried out on flow switches that have occurred in the past, from scales ranging from the last 150 years (Retzlaff and Bentley, Reference Retzlaff and Bentley1993) to several glacial cycles (Dowdeswell and others, Reference Dowdeswell, Ottesen and Rise2006). Here we document observations of an active small-scale flow switch that is under way at Breiðamerkurjökull, SE Iceland.
2. BREIÐAMERKURJÖKULL
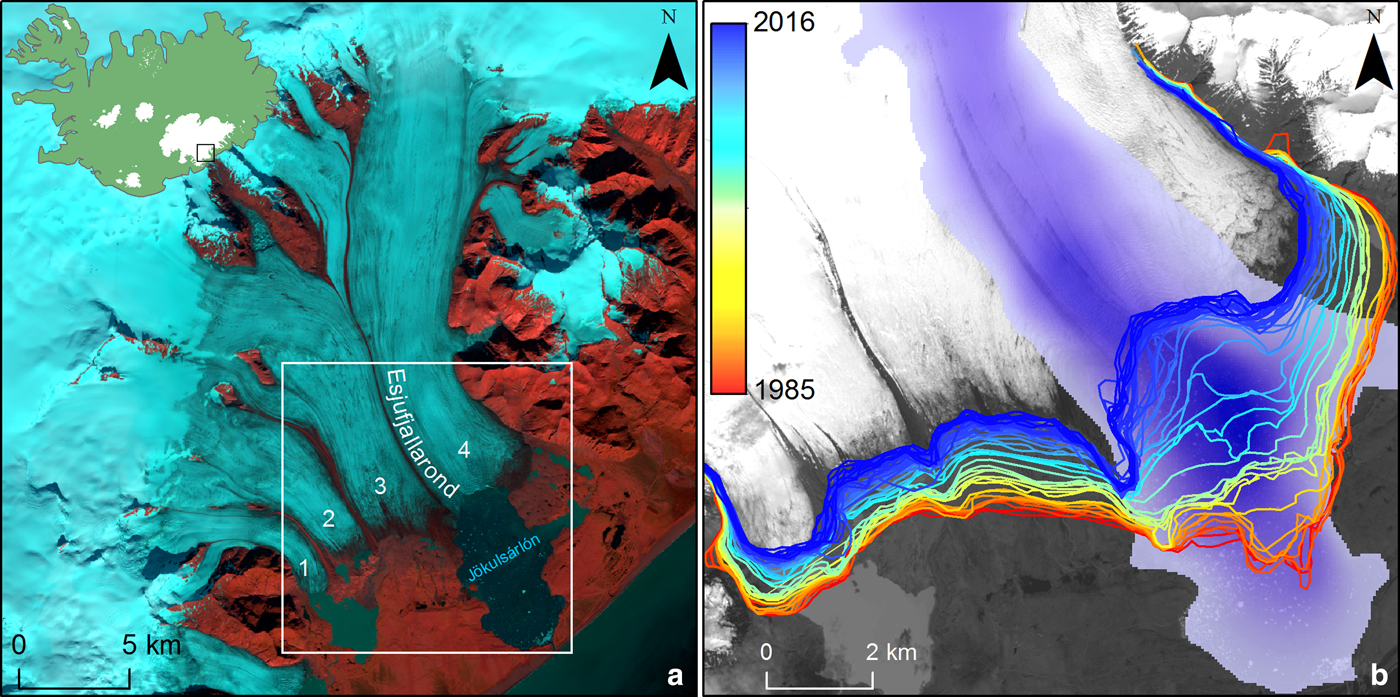
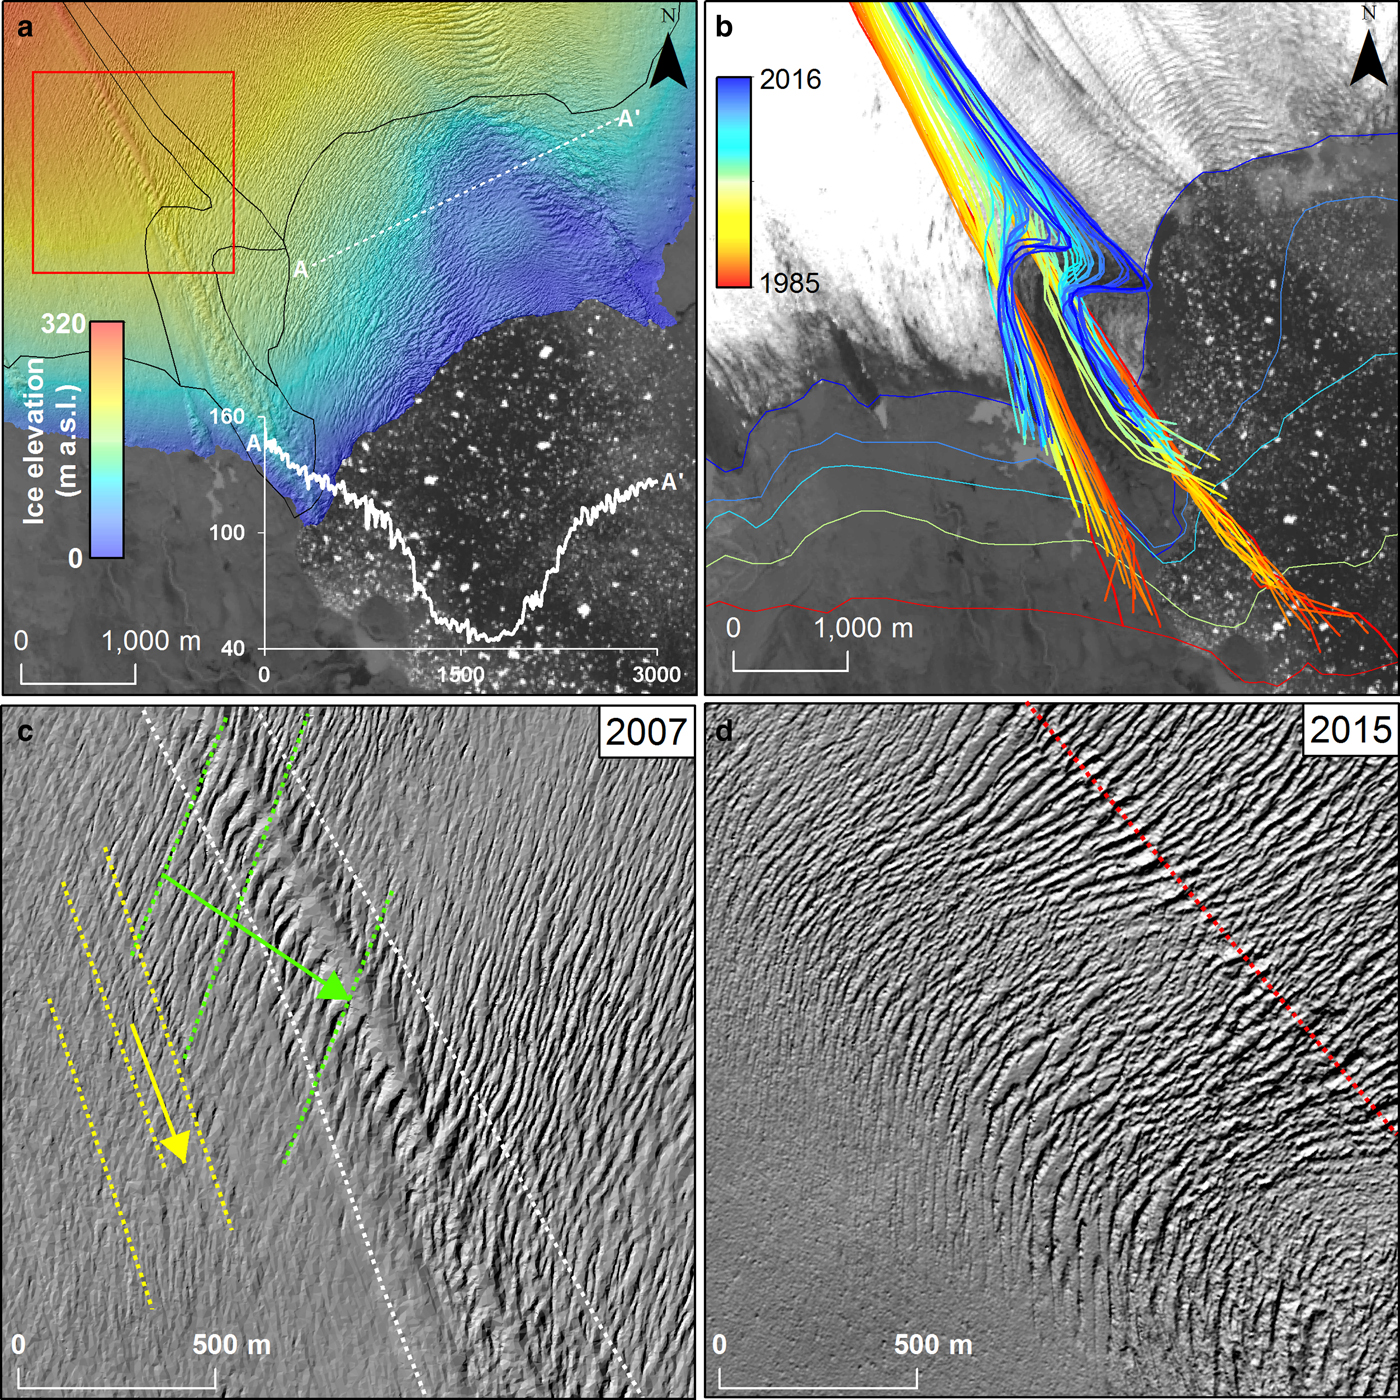
Breiðamerkurjökull is a large (~16 km wide) outlet glacier draining part of the Vatnajökull ice cap in south-east Iceland (Fig. 1). The glacier is composite, comprising four flow units (1–4 from west to east: see Fig. 1a), which are separated by large medial moraines emanating from prominent nunataks. In this paper we focus on the interaction between flow units 3 and 4. The western portion of flow unit 4 terminates in a large proglacial lake named Jökulsárlón and is bounded to the west by a medial moraine named Esjufjallarond. The foreland in this area rises to no more than 50 m above sea level, the most prominent topographic feature of the area being a large trench up to 300 m deep beneath Jökulsárlón, which extends up-glacier for 20 km (Björnsson, Reference Björnsson1996; Björnsson and others, Reference Björnsson, Pálsson and Guðmundsson2001; Fig. 1b). Breiðamerkurjökull has retreated ~6 km since its Little Ice Age maximum position in 1890 and the ice margin is currently retreating over the deepest part of the Jökulsárlón trench (Fig. 1b). Mapping of the glacier and its foreland in 1998 by Evans and Twigg (Reference Evans and Twigg2002) revealed a depression in the ice surface in the vicinity of the deepest part of the Jökulsárlón trench, which is clearly visible in Figure 2a as an area of low ice-surface topography and dense arcuate crevassing.
(a) 2016 Landsat 8 ETM+ image (7, 3, 2 RGB) showing the location of Breiðamerkurjökull and places referred to in the text. Numbers refer to the flow units. The white box indicates the extent of b. (b) Retreat of Breiðamerkurjökull from 1985 to 2016 superimposed on the elevation of the Jökulsárlón trench, which extends down to deeper shades of blue at ~300 m below sea level (interpolated from contours provided in Björnsson, Reference Björnsson1996).
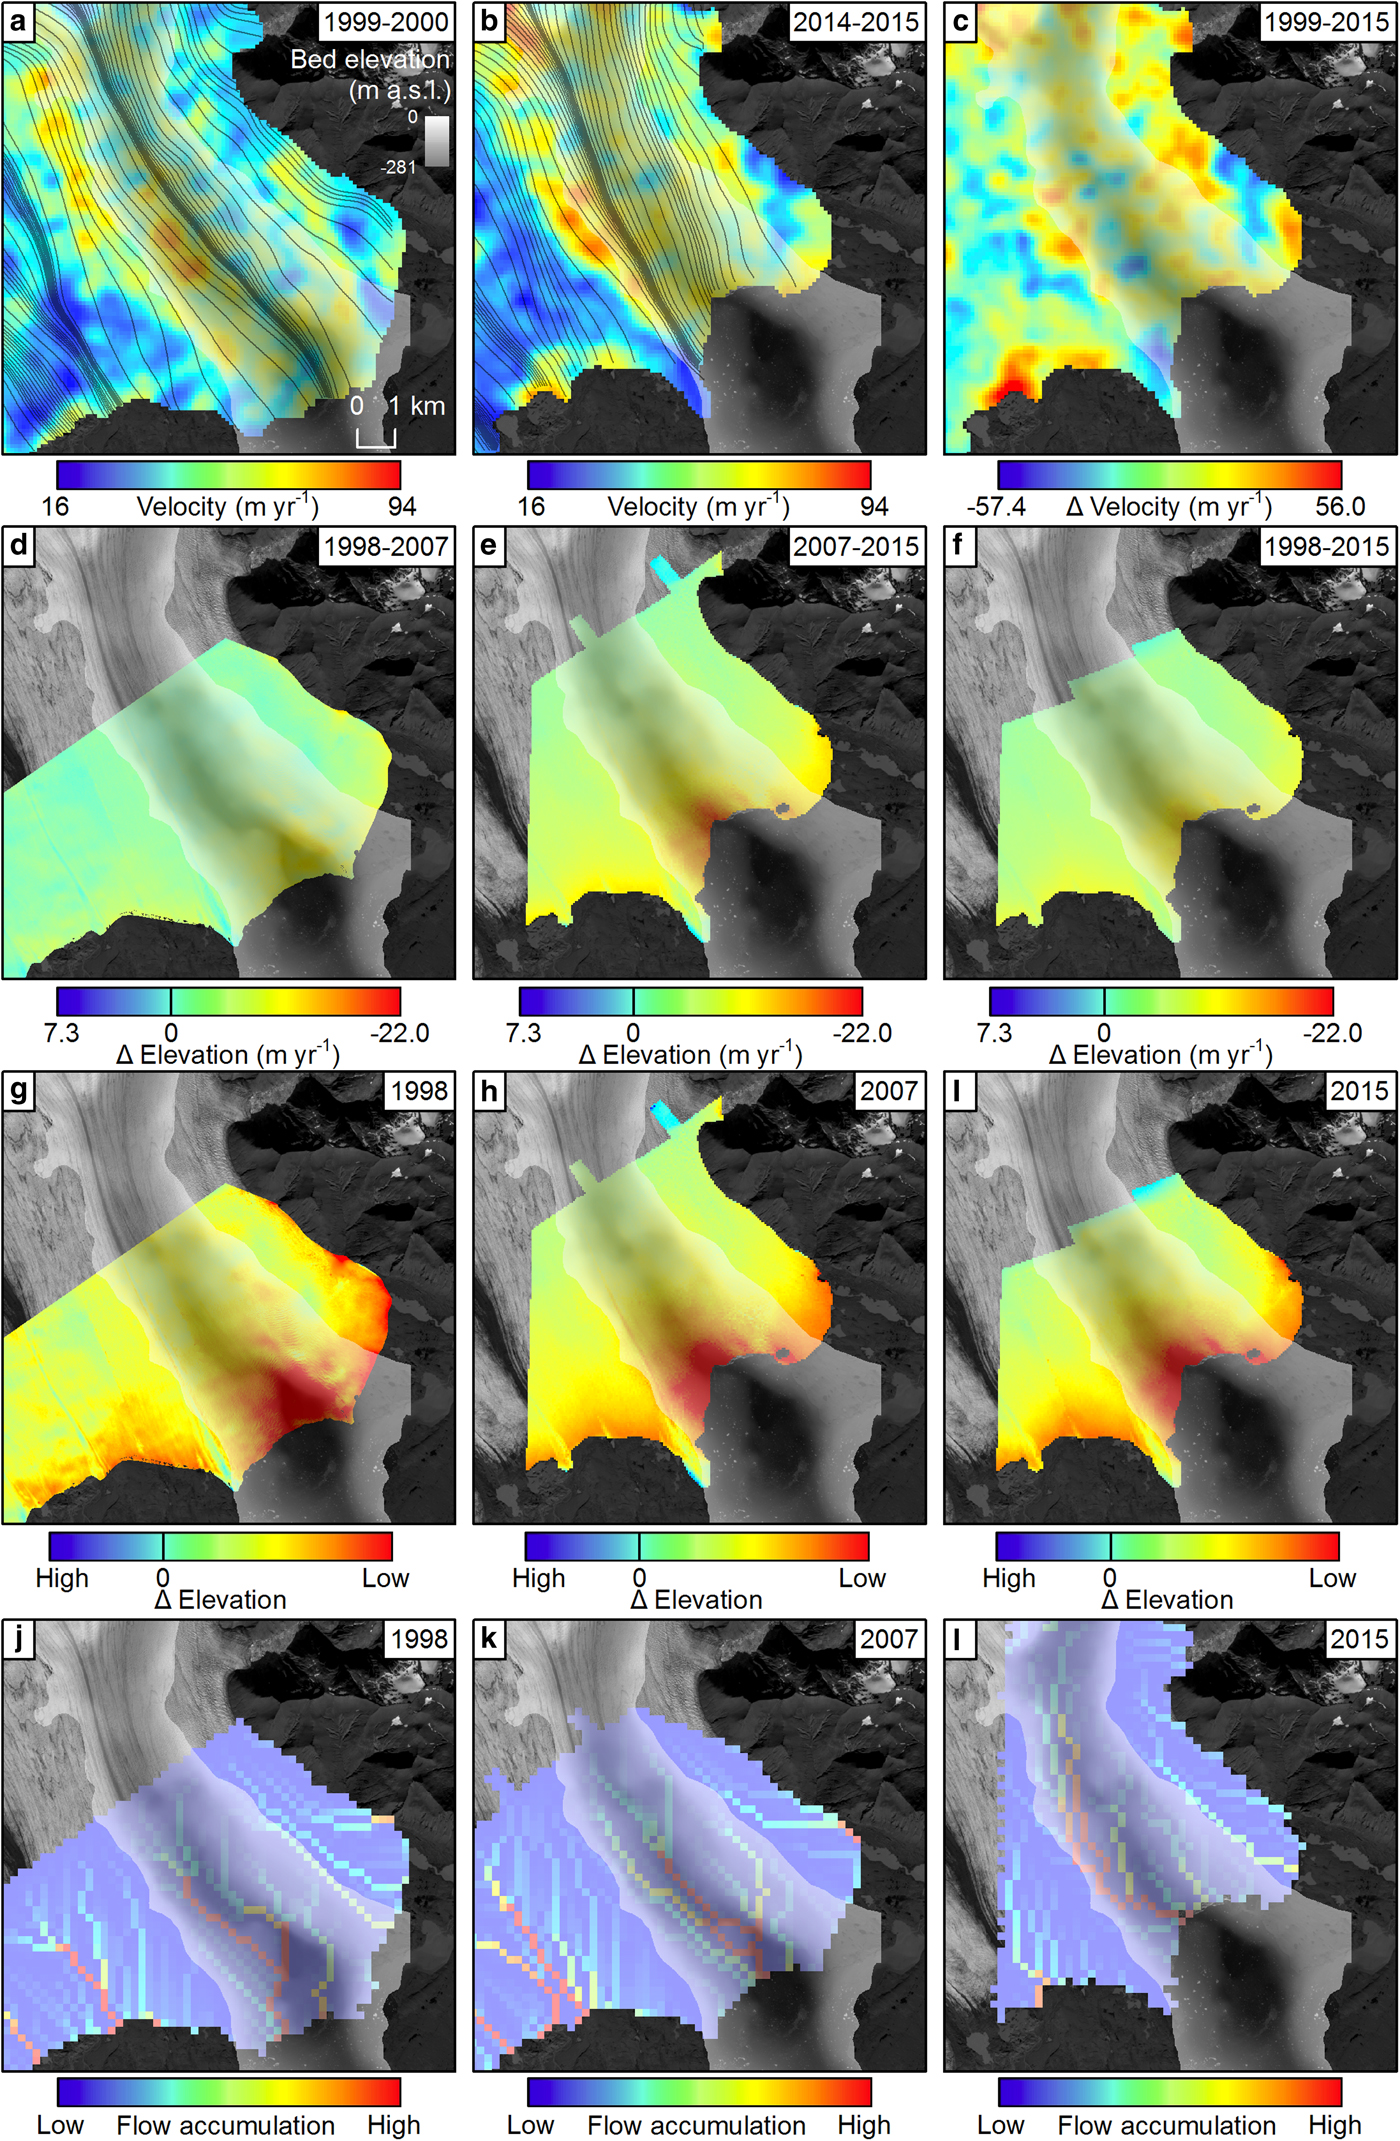
Mean surface velocity, elevation and subglacial hydraulic potential changes between 1998 and 2015. Bed DEM below sea-level interpolated from digitised contours from Björnsson and others (Reference Björnsson, Pálsson and Guðmundsson2001). The background image is a 2015 Landsat 8 band 8 image. (a) Landsat-derived mean surface velocity for 1999–2000. Black lines are velocity-derived flowlines. (b) Landsat-derived mean surface velocity for 2014–2015. Black lines are velocity-derived flowlines. (c) Velocity change between a and b. (d) Mean annual surface elevation change between 1998 and 2007. (e) Mean annual surface elevation change between 2007 and 2015. (f) Mean annual surface elevation change between 1998 and 2015. (g) Standard deviation stretch (n = 2.5) of d. (h) Standard deviation stretch (n = 2.5) of e. (i) Standard deviation stretch (n = 2.5) of f. (j) Subglacial flow accumulation in 1998. (k) Subglacial flow accumulation in 2007. (l) Subglacial flow accumulation in 2015.
3. METHODS
Mean annual surface velocity and flow vectors were calculated using an automated normalised cross-correlation feature tracking algorithm (Kääb and Vollmer, Reference Kääb and Vollmer2000). Values were derived from the panchromatic band (15 m resolution) of a pair of Landsat 7 ETM+ scenes (7 October 1999 and 23 September 2000) and a pair of Landsat 8 OLI scenes (8 October 2014 and 25 September 2015).
Individual vertical aerial photographs were used to derive orthophotos and DEMs for 1998 and 2007 using Structure from Motion photogrammetry. The 1998 DEM is 5 m horizontal resolution and is based on the aerial photographs and control points from the (22 August) 1998 glacial geomorphological map of Breiðamerkurjökull (Evans and Twigg, Reference Evans and Twigg2000). The 2007 DEM is 1 m resolution and is based on high resolution (30 cm) NERC ARSF aerial photographs from 3 July 2007 and control points measured in the field (see Storrar and others, Reference Storrar, Evans, Stokes and Ewertowski2015 for details). A 2 m DEM from 10 November 2015, produced by photogrammetry from high-resolution (~0.5 m) optical imagery, was acquired from the ArcticDEM (http://pgc.umn.edu/arcticdem).
Analysis of the terrestrial component of the 2015 DEM reveals that it is horizontally offset from the 1998 and 2007 DEMs by 7 m. It is systematically vertically offset by ~68 m, varying by a range of ~2 m either side of this value. Thus, to measure surface changes, all DEMs were resampled to 50 m horizontal resolution, to conservatively remove any artefact of error in georeferencing. The elevation values of the 2015 DEM were reduced by 68 m to correct for the systematic error. We estimate that the vertical accuracy of the DEMs is ±5 m. Given that the temporal difference between DEMs is 8–17 years, the vertical uncertainty becomes less significant (<1 m a−1) when calculating surface elevation change between years, which was carried out for 1998–2007, 2007–15 and 1998–2015.
A combination of Landsat 4TM, 5TM, 7ETM+ and 8OLI satellite images of the study area from 1985 to 2016 were downloaded from the USGS (http://earthexplorer.usgs.gov/). The temporal resolution is approximately annual from 1985 to 2011, and then monthly (excluding winter) from 2011 to 2016 (details of individual images are provided in the supplementary information). The glacier margin and lateral boundaries of the Esjufjallarond medial moraine were digitised from false colour composite images in the band combination 7, 3, 2 (RGB).
Maps of subglacial hydraulic potential were derived using a GIS approach similar to that of Livingstone and others (Reference Livingstone, Clark, Woodward and Kingslake2013), which is based on Shreve (Reference Shreve1972). Subglacial hydraulic potential (Φ) is derived from elevation and water pressure:
 $$\Phi = \rho _{\rm w} gh + P_{\rm w} $$
where ρ w is the density of water (1000 kg m−3), g is the acceleration due to gravity (9.81 m s−2), h is the elevation of the bed and P w is the water pressure. Effective pressure N is the difference between ice pressure P i (917 kg m−3) and subglacial water pressure P w.
 $$N = P_{\rm i} - P_{\rm w} $$
P i is controlled by the weight of overlying ice:
 $$P_{\rm i} = \rho _{\rm i} gH$$
where H is the ice thickness (m). For simplicity N is assumed to be 0, although this is often not the case, particularly close to the ice margin (cf. Hooke, Reference Hooke1984). However, this simplification is frequently adopted to approximate the generalised pattern of subglacial water flow (e.g. Shreve, Reference Shreve1972; Syverson and others, Reference Syverson, Gaffield and Mickelson1994; Livingstone and others, Reference Livingstone, Clark, Woodward and Kingslake2013), which is the aim in this study. Assuming N to be 0, Eqn (1) can be re-written as:
 $$\Phi = \rho _{\rm w} gh + \rho _{\rm i} gH$$
We use the 1998, 2007 and 2015 DEMs for the ice surface, and a DEM interpolated from the subglacial contours published in Björnsson and others (Reference Björnsson, Pálsson and Guðmundsson2001) to derive H and, in turn, Φ. The DEMs were resampled to 200 m resolution to remove the (short-term) effect of ice thickness fluctuations due to crevasses.
4. RESULTS
Mean ice-surface velocity and flow-line patterns (Figs 2a, b) show that areas of higher velocity are generally associated with the deeper parts of the bed. Between 1999–2000 and 2014/15 the fastest flowing parts of the glacier migrated to the west, and a small net increase in velocity was observed in flow unit 4 (Fig. 2c). The direction of flow changed from broadly NW to SE to NNW to SSE, the changes being most notable near to the terminus.
Ice-surface lowering is concentrated around the deepest parts of the Jökulsárlón trench that are coincident with the ice margin (Figs 2d–i). Between 1998 and 2007 this was further to the east than between 2007 and 2015, where the locus of maximum surface lowering was further west. Rates of ice-surface lowering increased after 2007.
Since 1985, Breiðamerkurjökull has undergone asynchronous retreat, with the fastest retreat occurring over the deepest parts of the Jökulsárlón trench (Fig. 1b; Supplementary animation), coincident with the loci of ice-surface lowering. In 1985 the medial moraine Esjufjallarond followed a straight trajectory and terminated on land to the west of Jökulsárlón (Fig. 3b; Supplementary animation). In 2006, a portion of Esjufjallarond close to the terminus began to deflect towards the north-east, indicating flow capture (Fig. 3b). The 2007 DEM shows the early stages of the flow capture: the ice surface in the NE, in the location of the deepest section of the Jökulsárlón trench (Fig. 1b), was ~100 m lower than surrounding areas (Fig. 3a). Esjufjallarond and longitudinal debris folia to the south-west of it, indicate the previous ice flow direction towards the SSE (Fig. 3c). In 2007, Esjufjallarond had not undergone significant displacement, but transverse crevasses oriented SSW to NNE had opened up, indicating a ~45° change in flow towards the east-south-east (Fig. 3c), which is confirmed in the 2015 DEM, which shows only a remnant of Esjufjallarond and extensive crevassing indicating SE to ESE flow. The flow eventually resulted in a large recumbent fold in Esjufjallarond, which was displaced ~300 m by 2016 (Fig. 3). The hinge line of the fold in 2016 was located where ice terminates in Jökulsárlón, while the former terminal section of Esjufjallarond is still on land to the SW (Fig. 3b).
(a) 2007 SfM DEM of the glacier surface. Black lines demarcate the 2016 margin and medial moraine outlines. The inset graph shows the cross profile indicated by line A-A′ (in metres). The red box indicates the location of c and d. (b) Band 8 Landsat 8 ETM+ image from 13 May 2016 overlain with mapped medial moraine edge positions from 1985 to 2016. Ice margin positions in 1985, 2000, 2007, 2010 and 2016 are shown on the same colour scale. (c) 315° hillshaded 2007 DEM showing the medial moraine (outline in white), longitudinal debris folia (yellow) indicating that the initial flow direction was to the SSE, and transverse crevasses (green) which have opened up indicating the switching of flow to the ESE. (d) 315° hillshaded DEM showing the same area as c in 2015. Note the significant changes compared with the 2007 DEM. The remnant medial moraine is indicated with a red dashed line.
5. DISCUSSION AND IMPLICATIONS
As explained above, it has been suggested that flow switches can be caused by a variety of mechanisms (Winsborrow and others, Reference Winsborrow, Stokes and Andreassen2012). We now assess whether these mechanisms may be responsible for the flow switch observed at Breiðamerkurjökull.
5.1. Accommodation space
Dowdeswell and others (Reference Dowdeswell, Ottesen and Rise2006) suggested that flow switches may occur if accommodation space is filled with sediment. Outwash from the western part of flow unit 4 is deposited in Jökulsárlón (Björnsson and others, Reference Björnsson, Pálsson and Guðmundsson2001), however Jökulsárlón is too large for sediment deposition to be close to filling the available space.
5.2. Changes in basal thermal regime
Breiðamerkurjökull has not undergone significant changes in basal thermal regime over the study period, so we rule out this mechanism.
5.3. Large-scale changes in mass balance
Breiðamerkurjökull has been in a state of negative mass balance since the mid-1990s (Björnsson and Pálsson, Reference Björnsson and Pálsson2008; Pálsson and others, Reference Pálsson, Gunnarsson, Jónsson, Steinþórsson and Pálsson2014). The glacier front has been continuously retreating and the ice surface has been lowering (Figs 1, 2). We suggest that it is likely that this trend of negative mass balance is partly responsible for the observed flow switch, in combination with the subglacial topography and subglacial hydrology.
5.4. Variations in subglacial topography
The capture of part of flow unit 3 by flow unit 4 is likely controlled by bed topography. A large trench up to 300 m below sea level exists along the central axis of Jökulsárlón (Björnsson, Reference Björnsson1996; Björnsson and others, Reference Björnsson, Pálsson and Guðmundsson2001; Fig. 2), the glaciological impacts of which were identified by Evans and Twigg's (Reference Evans and Twigg2002) map of the glacier surface depression (see also Fig. 3a). Retreat and surface lowering have been most marked along this trench (Figs 1b, 2d–i), consistent with the water depth model of iceberg calving, which was modelled at Breiðamerkurjökull by Nick and others (Reference Nick, Van der Kwast and Oerlemans2007). As ice retreats over the Jökulsárlón trench it drives faster ice flow and draws down the ice surface. This is supported by observations of higher ice velocity and surface lowering at the calving front, where the trench is deepest (Fig. 2; Voytenko and others, Reference Voytenko2015). However, it should be noted that calving flux need not necessarily be related to velocity if the glacier is retreating (Benn and others, Reference Benn, Hulton and Mottram2007), which is the case at Breiðamerkurjökull.
It has been demonstrated empirically that water depth exerts a strong control on ice flux, and thereby calving rates (Schoof, Reference Schoof2007) and water depth has been invoked as the mechanism for flow switches in fjord systems (Briner and others, Reference Briner, Bini and Anderson2009), marine-terminating outlet glaciers (Stokes and others, Reference Stokes, Corner, Winsborrow, Husum and Andreassen2014) and palaeo-ice streams (Winsborrow and others, Reference Winsborrow, Stokes and Andreassen2012). We suggest that as Breiðamerkurjökull retreats over the deepest part of the Jökulsárlón trench, flow velocity increases locally where the trench is deepest. This is likely related to calving, which in the water depth model occurs at a greater rate in deeper water (e.g. Nick and others, Reference Nick, Van der Kwast and Oerlemans2007). It is also possible that melting from incursion of warm marine water enhances calving, particularly where cold subglacial meltwater emerges from beneath the glacier (also in the deepest part of the trough: see Figs 2j–l), acting to ‘draw in’ warmer water (Voytenko and others, 2016). Increased flow velocity in turn lowers the ice surface at this location (Fig. 2). The influence of basal topography is highest at the thinnest part of the glacier, where the ratio between water depth and ice thickness is highest, which is why the most significant changes are seen as the terminus retreats over the overdeepening. Ice-surface lowering promotes drawdown of the surrounding ice, which is sufficient to deflect flow from flow unit 3 to the east, into flow unit 4, propagating the switch up-ice. This can be seen by the deviation of flowlines in Figures 2a, b, and in more detail in the deflection of Esjufjallarond (Fig. 3b) and the cross-cutting surface features in the DEM from 2007 (Fig. 3c), which shows the configuration of the glacier during the flow switch. The 2015 DEM of the same area (Fig. 3d) shows the subsequent configuration of the ice-surface post-switch, with extensive crevassing clearly portraying the new flow direction.
5.5. Subglacial hydrology
In addition to calving, subglacial meltwater flow is likely to be heavily influenced by the Jökulsárlón trench. Subglacial meltwater flow is controlled primarily by the bed slope and, to a lesser extent, the ice-surface slope (Shreve, Reference Shreve1972). It has been demonstrated using data from Greenland that subglacial meltwater routing can exhibit temporal variations between catchments and stimulate changes in ice dynamics (Chu and others, 2016). Subglacial hydraulic potential modelling suggests that meltwater beneath Breiðamerkurjökull will drain preferentially into the Jökulsárlón trench (Figs 2j–l). Indeed, strong meltwater currents and suspended sediment plumes indicative of subglacial runoff have been observed near the calving front (Hodgkins and others, Reference Hodgkins, Bryant, Darlington and Brandon2016). Subglacial water pressure in the trench is likely to be high, since the deep water of Jökulsárlón provides a high base-level (Benn and Evans, Reference Benn and Evans2010). High water pressures and preferential routing of water in the Jökulsárlón trench promote increased sliding and may provide an additional explanation for the high velocity of this part of the glacier. Modelled flow accumulation follows the thalweg of the Jökulsárlón trench in all time steps (Figs 2j–l) and so is unlikely to be responsible for the flow switch by itself. Rather, it would have acted to maintain high velocity, the focus of which is ‘steered’ by the basal topography (water depth).The data presented in this paper provide observations from a modern glacier to support the notion that basal topography exerts an important control over ice dynamics (cf. Aschwanden and others, Reference Aschwanden, Fahnestock and Truffer2016). This has implications for understanding the response of ice masses to climatic warming. Basal overdeepenings, which are present beneath many parts of the Greenland (Bamber and others, Reference Bamber2013) and Antarctic (Fretwell and others, Reference Fretwell2013) ice sheets, may alter ice flow vectors and promote flow switching, which may either increase or decrease retreat, depending on the intricacies of the topographic setting. As parts of these ice sheets retreat they will encounter different subglacial topography, making flow switching and concomitant changes in velocity and retreat rates likely. Thus, detailed knowledge of bed topography, and its influence on ice dynamics, is an essential source of information for predicting the fate of water-terminating ice in any setting.
SUPPLEMENTARY MATERIAL
The supplementary material for this article can be found at https://doi.org/10.1017/jog.2017.22.
ACKNOWLEDGEMENTS
We are grateful to Chief Editor Graham Cogley and Scientific Editor Ted Scambos, as well as two anonymous reviewers, whose comments increased the clarity of the work.


 Open access