

14.1 Introduction: The Disconnect between Earth and the Lab
Earth is a powerful organic chemist, transforming vast quantities of carbon through complex processes leading to diverse suites of products that include the fossil fuels upon which modern societies depend. When exploring how Earth operates as an organic chemist, it is tempting to turn to how organic reactions are traditionally studied in chemistry labs. While highly informative, especially for insights gained into reaction mechanisms, doing so can also be a source of frustration, as many of the reactants and conditions employed in chemistry labs have few or no parallels to geologic processes. It is difficult, for example, to find natural conditions where laboratory reagents such as concentrated sulfuric acid are available, or where extreme oxidants such as chromate and permanganate or reductants such as lithium aluminum hydride are in abundance. Likewise, organic solvents other than the complex mixtures in petroleum and high-pressure natural gases are impossible to find. Instead, the most Earth-abundant fluid that could serve as a reaction medium is water, which is often excluded from organic chemistry procedures and labs. Nevertheless, Earth uses water at high temperatures and pressures as a reactant, catalyst, and solvent for organic transformations on a massive scale.
A common approach to understanding traditional organic reactions is to analyze them in terms of the strengths of the bonds that are broken versus the bonds that are made. When weaker bonds in the reactants are transformed into stronger bonds in the products, the energy of the electrons decreases and the reaction is considered likely to proceed. This is a common approach because it usually works. Those reactions that form stronger bonds are the reactions that are observed to occur, and they are those that are included in traditional organic chemistry textbooks. This is a purely enthalpic view of chemical reactions; the role of entropy is not included. With the exception of some fragmentation reactions that form more product molecules than there were reactant molecules, enthalpic effects tend to dominate the majority of traditional organic chemistry at ambient laboratory conditions. Organic reactions under hydrothermal conditions occur at higher temperatures and pressures than ambient, by definition, and the entropic contribution to the reaction free energy is thus larger than at ambient, to the extent that reactions can start to be controlled by entropic rather than enthalpic effects. Several examples of this contrast in thermodynamic influence are employed in this chapter as starting points for exploring reaction mechanisms through experiments.
A strength of traditional organic chemistry is a rich attention to mechanistic detail and descriptions of reactive intermediates and transition states. Another common concept for understanding organic reactions at ambient laboratory conditions is that the favorable reaction will be the one that proceeds via the lowest-energy (most stable) intermediate or transition state (i.e. the fastest reaction wins). That this approach usually works is consistent with the majority of traditional organic chemical reactions occurring under kinetic control. In contrast, reactions at higher temperatures are more likely to be reversible, and indeed, reversibility is a common feature of hydrothermal organic reactions. Under these conditions, reactions are more likely to occur under thermodynamic rather than kinetic control. Therefore, much of the difference between organic reactivity at hydrothermal and ambient conditions can be understood if reactions at ambient are controlled mainly by enthalpy and kinetics and hydrothermal reactions are controlled more by entropy and thermodynamics. The primary goals of this chapter are to provide examples of predicting thermodynamic influences and to use the predictions to design experiments that reveal the mechanisms of how reactions occur at the elevated temperatures and pressures encountered in Earth. This work is ongoing, and we hope this chapter can inspire numerous and diverse experimental and theoretical advances in hydrothermal organic geochemistry.
14.2 The Setting for Organic Transformations in the Deep Carbon Cycle
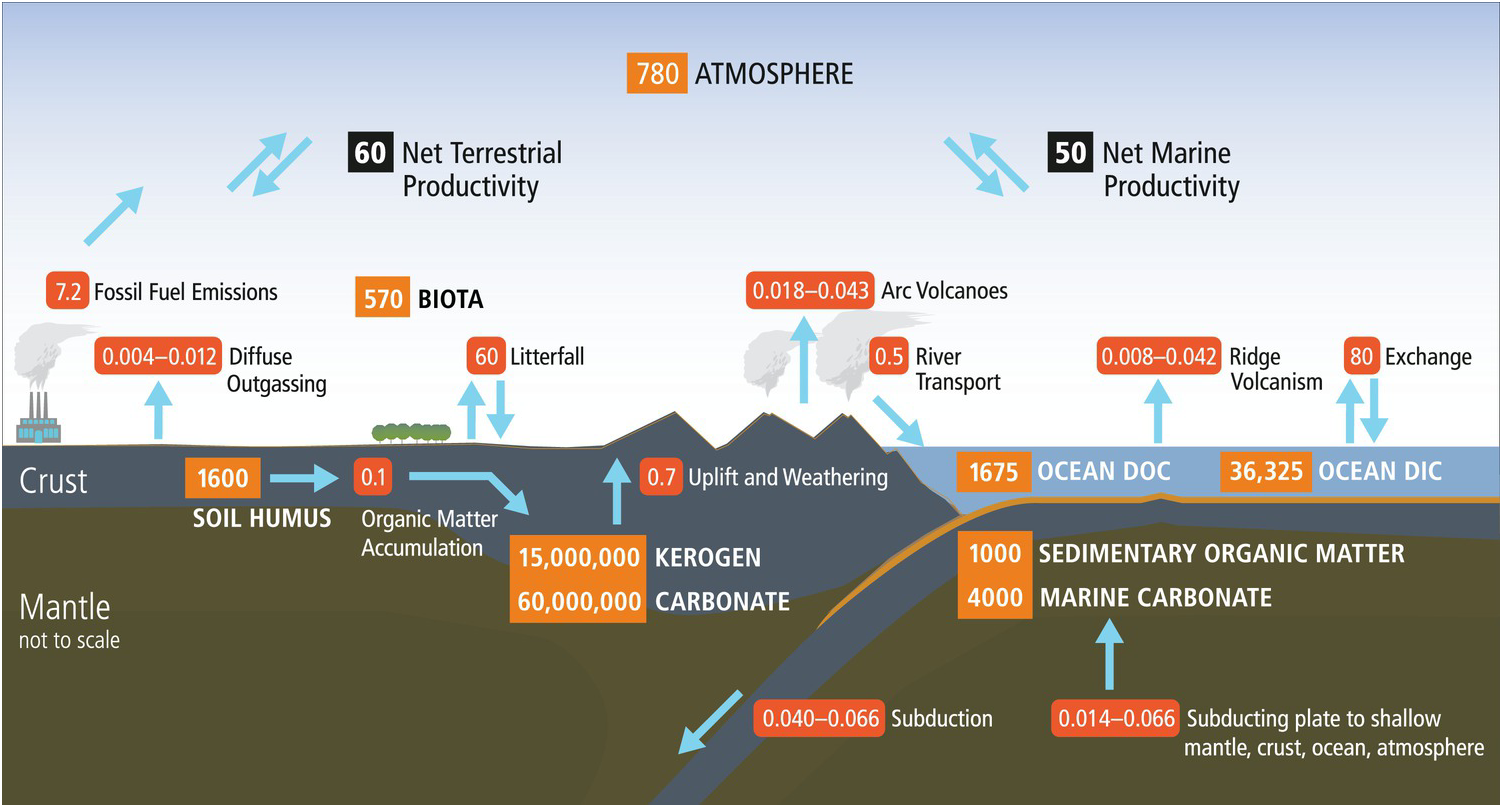
Earth’s organic carbon cycle has a small surface component with short residence times (years to centuries) coupled to an enormous deeper component with extraordinarily long residence times (hundreds of millions of years). As shown in Figure 14.1, the vast majority (>99.5%) of organic carbon on Earth exists in the deep pool as dispersed organic matter in shales and sediments (15,000,000 petagrams (Pg) C; Hedges, Reference Hedges1992). The global fossil fuel reserves (4500 Pg C) are a tiny fraction of the organic carbon in rocks. The current anthropogenic fossil fuel use (~7.2 Pg y–1), however, dwarfs the physical weathering of dispersed organic matter in continental rocks (~0.7 Pg y–1), which illustrates the profound effects of human activities on the short-term cycle and potentially the long-term deep carbon cycle. The massive deep organic reservoir is supplied by a very small trickle of organic matter (0.1 Pg C y–1) derived from continental and marine primary production (Hedges, Reference Hedges1992; Bianchi, Reference Bianchi2011) and consisting largely of lipids, lignin, and complex carbohydrate derivatives such as cellulose. Using these starting materials, Earth generates suites of new organic products.
Surface and deep carbon cycles, which are linked at subduction zones. Numbers in orange boxes represent reservoirs of carbon in Pg (petagrams, 1015 g) and arrows with red boxes show fluxes in Pg y–1.
Temperature and pressure changes with depth enable the transformation of organic compounds within Earth, which are driven by mismatches among oxidation states set by dominant mineral reactions and those of carbon in organic and inorganic compounds. Iron and sulfur are the most abundant elements that have multiple oxidation states in major rock-forming minerals. As a consequence, assemblages of iron- and sulfur-bearing minerals commonly control the oxidation states in the subsurface. Occasionally, as in petroleum reservoirs, black shales, and coal seams, organic compounds are abundant enough to control subsurface oxidation states (Helgeson et al., Reference Helgeson, Knox, Owens and Shock1993; Reference Helgeson, Richard, McKenzie, Norton and Schmitt2009; Shock, Reference Shock, Pittman and Lewan1994; Lammers et al., Reference Lammers, Brown, Bird, Thomas, Johnson, Rosenbauer and Maher2015). But in most geologic environments, the rocks call the shots.
Reactions among minerals that can be balanced by H2, or H2 together with H2O, serve as reference points for estimating relative oxidation states during geochemical processes and can be compared with reactions among organic compounds to uncover how mineral–water–organic reactions may re-equilibrate. An example used widely as a reference frame for the oxidation state of the upper-mantle source regions of basaltic melts is the mineral assemblage fayalite–magnetite–quartz (FMQ; Mattioli & Wood, Reference Mattioli and Wood1986; O’Neill & Wall, Reference O’Neill and Wall1987; Cottrell & Kelley, Reference Cottrell and Kelley2011), where fayalite represents the ferrous-iron end member of olivine solid-solution phases and for which a reaction can be written that includes H2 and H2O as:
Oxidation–reduction equilibrium among the constituents of aqueous fluids and basalts can be approximated by FMQ, which will set a specific value of the activity of H2(aq), aH2(aq), at each combination of temperature and pressure. Calculated values of log aH2(aq) set by reaction of the FMQ assemblage and water at 100 MPa and 0–500°C are shown as one of the curves falling roughly in the middle of Figure 14.2. Higher values of log aH2(aq), corresponding to more reduced conditions, are set by the iron–wüstite (IW) and iron–ferrosilite–fayalite (IFF) assemblages given by:
 (14.2)
and
where ferrosilite corresponds to the ferrous-iron end member of orthopyroxene solid-solution phases. These assemblages may reflect oxidation states that prevail during the alteration of ultramafic rocks. At more oxidized conditions, lower values of log aH2(aq) are reflected by the pyrrhotite–pyrite–magnetite (PPM) and magnetite–hematite (MH) assemblages consistent with
and
Values of log aH2(aq) set by the annite–magnetite–K-feldspar (AMK) and annite–hematite–K-feldspar (AHK) assemblages form curves with steeper trajectories across Figure 14.2, and they correspond to:
and
Only the stable portions of the AMK and AHK curves are shown in Figure 14.2. Annite is the ferrous-iron end member of biotite solid-solution phases, which can be found with K-feldspar and iron oxides in granites and rhyolites. Analogous diagrams at other pressures look nearly identical (Shock, Reference Shock1992; Manning et al., Reference Manning, Shock and Sverjensky2013).
Oxidation states of rocks and carbon depicted as the activity of H2(aq) versus temperature at 100 MPa. Solid curves represent values of log aH2(aq) set by equilibrium among mineral assemblages and H2O; reactions given in the text. Dashed curve shows values of log aH2(aq) corresponding to equal activities of aqueous carbon dioxide and aqueous methane. Note that IFF and IW fall on the methane-dominated side of the diagram, MH, AMK, and AHK fall on the carbon dioxide side of the diagram and that the curves for FMQ and PPM cross from CO2(aq) to CH4(aq) dominance regions with decreasing temperature. The arrow depicts schematically the kinetic inhibition that drives departures from stable equilibrium in the C–O–H chemical system with decreasing temperature. IFF = iron–ferrosilite–fayalite; IW = iron–wüstite; FMQ = fayalite–magnetite–quartz; PPM = pyrrhotite–pyrite–magnetite; MH = magnetite–hematite; AMK = annite–magnetite–K-feldspar; AHK = annite–hematite–K-feldspar.
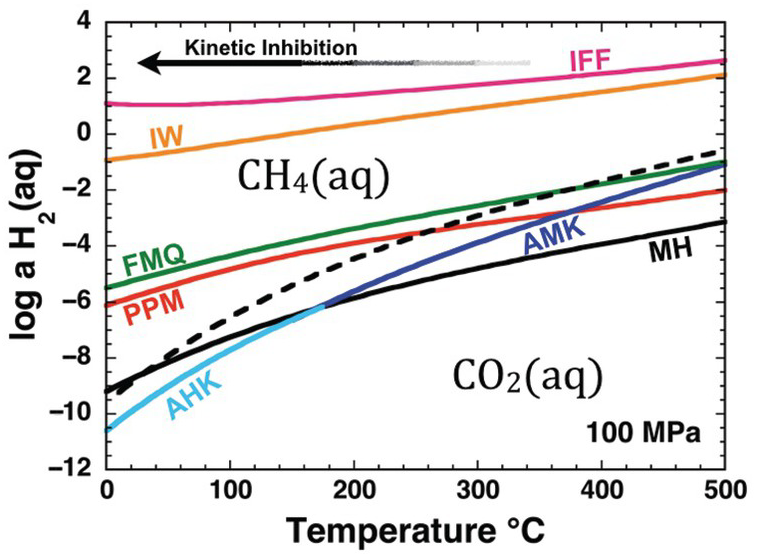
Also shown in Figure 14.2 is a dashed curve that represents equal activities of the aqueous forms of CO2 and CH4 at stable equilibrium with respect to the reaction
Note that the AMK and AHK curves, and most of the MH curve, fall on the CO2(aq) side of the dashed curve. This means that carbon in fluids at stable equilibrium with these mineral assemblages will be predominantly in the form of CO2(aq) and CH4(aq) will be far less abundant. In contrast, the IFF and IW curves fall well on the side of the dashed curve where CH4(aq) is dominant. The other two mineral assemblage curves, PPM and FMQ, show the remarkable behavior of being crossed by the dashed curve. This means that the stable equilibrium speciation of carbon consistent with these mineral assemblages shifts from CO2(aq) predominance at high temperatures to CH4(aq) predominance as temperature decreases. Oxidation states at or near FMQ are commonly encountered for basalts, and those set by the PPM assemblage are common in hydrothermal systems hosted in basalt, such as those that are commonly found at mid-ocean ridges. The PPM assemblage also closely approximates conditions in many sulfide deposits found in sedimentary rocks. The interplay between carbon chemistry and rock-buffered oxidation states helps explain why natural gas and other organic-rich accumulations are found in lower-temperature sedimentary basins and why high-temperature volcanic gases are dominated by CO2.
As indicated by Figure 14.2, there are thermodynamic drives to convert CO2(aq) to CH4(aq) as temperature decreases at the oxidation states set by common rock compositions. This conversion may happen at high temperatures (Shock, Reference Shock1990; Reference Shock1992; McDermott et al., Reference McDermott, Seewald, German and Sylva2015; Reference McDermott, Sylva, Ono, German and Seewald2018; Wang et al., Reference Wang, Reeves, McDermott, Seewald and Ono2018), but becomes less and less likely as temperature decreases, as indicated by the arrow labeled “Kinetic Inhibition.” As a result, CO2(aq) and, by extension, carbonate minerals are metastable at FMQ and PPM oxidation states as temperatures decrease. Likewise, it is on the lower-temperature side of the dashed curve in Figure 14.2 that organic compounds are metastably preserved against conversion to the stable CH4(aq). As temperatures decrease, reaction mechanisms among metastable compounds determine how Earth operates as an organic chemist.
The diversity and complexity of organic molecules found in Earth systems, from hydrocarbons, to functionalized compounds containing O, N, S, and other elements, to large geopolymeric materials, hint at the wide range of organic reactions conducted within Earth. Wide-ranging oxidation states of carbon, from –4 to +4, are found among methane, hydrocarbons, organic matter, and carbonate, implying diverse organic oxidation–reduction, hydration–dehydration, addition–elimination, substitution, and disproportionation reactions. How such reactions happen is the focus of this chapter.
Modern organic chemistry, both in the classroom and in industry, focuses on rates and specificities of reaction. While Earth organic chemistry is not always fast or specific, it is continuous and effective. In an era when chemistry questions ranging from the emergence of life to habitable planets, biofuel production, and green chemistry are at the forefront of scientific inquiry, it is time to grasp how Earth promotes its broad range of complex organic reactions. One path forward is to follow organic compounds into hydrothermal conditions, predict what can happen based on thermodynamic drives, and conduct experiments to determine which of those possibilities are granted mechanistic permission.
14.3 Hydration/Dehydration as Examples of Elimination Reactions
A striking example of how conventional organic chemistry fails to translate well to geologic conditions is provided by reactions in which organic compounds dehydrate in water. Predictions made from enthalpies of reaction and considerations of bond energies, coupled with misapplication of simple concepts like Le Chatelier’s principle and uncertainty about changes with temperature, could lead to the misconception that dehydration is unlikely in aqueous solution. In contrast, geologists are comfortable with the idea of hydrous minerals dehydrating as temperature and pressure increase, and, given that H2O is the inescapable product, they raise no concerns about mineral dehydration occurring in the presence of an aqueous fluid (Shock, Reference Shock1993). Do minerals behave differently from organic compounds? Or is dehydration an inevitable consequence of increases in temperature and pressure, even in aqueous solution?
An approach to answering these questions is provided by combining thermodynamic analysis with hydrothermal experiments that yield kinetic data. As shown in Figure 14.3, the equilibrium constant for dehydration of an alcohol – 1-butanol in this case – favors the persistence of the alcohol in solution at ambient conditions. There is only the faintest hint of a thermodynamic drive for the alkene to form at low temperatures, which is consistent with geologists’ blissful lack of concern for the dehydration of ethanol while drinking a cold beer. The explanation for this is that, at ambient conditions, equilibrium favors the alcohol, referred to as the alkene/water addition product in organic chemistry textbooks. Earth, which is not limited to ambient conditions in chemistry labs, did not learn organic chemistry from textbooks and conducts organic reactions over wide ranges of temperature and pressure. As examination of Figure 14.3 shows, with an increase in temperature at Psat (the saturation pressures corresponding to vapor–liquid equilibrium for H2O at these temperatures), the sign of the logarithm of the equilibrium constant (log K) for the reaction
changes, and the thermodynamic drive above 200°C is in the direction of generating considerable 1-butene from 1-butanol by dehydration in aqueous solution. The same reaction now exhibits properties exactly the reverse of how it is portrayed in organic chemistry textbooks.
Thermodynamics and mechanisms of aqueous alcohol dehydration reactions. The equilibrium constant for reaction (14.9) as a function of temperature at Psat, calculated with equations and parameters from Shock and Helgeson (Reference Shock and Helgeson1990) and Shock et al. (Reference Shock, Oelkers, Johnson, Sverjensky and Helgeson1992), is shown in the upper-left plot. Note that the sign of log K changes at about 200°C. This change in sign of log K corresponds to a change in sign of ΔrG° for reaction (14.9) shown in the upper-right plot, which is caused by the increasingly negative contribution of the –TΔrS° term surpassing the decreasingly positive contribution of the ΔrH° term as temperature increases. As a consequence, 1-butanol can dehydrate to 1-butene in aqueous solutions at elevated temperature and pressure. When reaction (14.9) occurs in hydrothermal solution, it most likely follows a bimolecular elimination (E2) mechanism involving the alcohol and a molecule of H2O as shown in the lower panel, which is common for primary alcohols. In contrast, secondary and tertiary alcohols are likely to dehydrate in aqueous solution by unimolecular elimination (E1) mechanisms triggered by protonation of the hydroxyl group in the alcohol
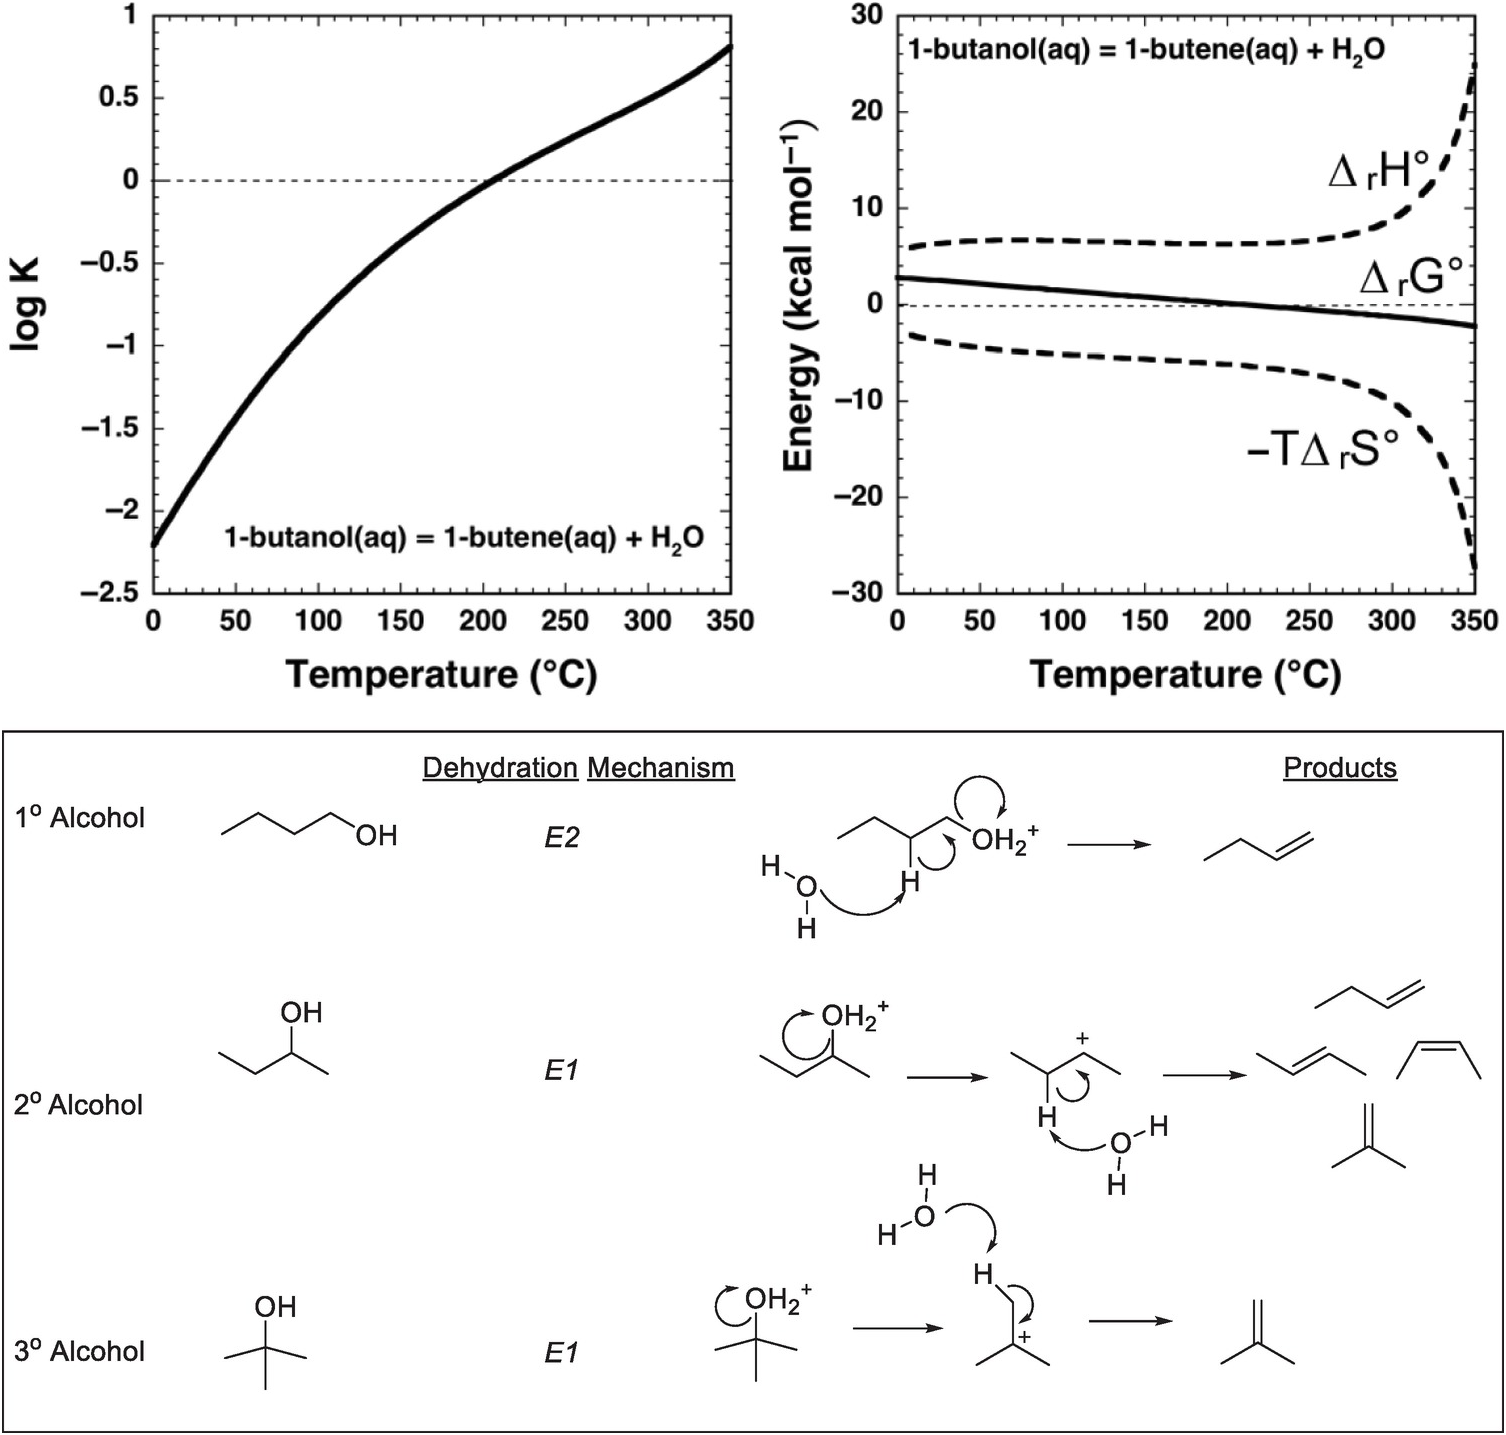
The origins of this reversal in the sign of log K for reaction (14.9) are revealed by comparing the contributions of standard enthalpy (ΔrH°) and entropy (ΔrS°) changes to the standard Gibbs energy (ΔrG°) change of the reaction in Figure 14.3, together with the relations ΔrG° = ΔrH° – TΔrS° and ΔrG° = –2.303RT log K, where the subscript “r” stands for reaction. At low temperatures, both the standard enthalpy and standard Gibbs energy changes are positive for reaction (14.9). With increasing temperature, the growing magnitude of the –TΔrS° term overwhelms the increasingly positive contribution from ΔrH°, leading to a decrease in the magnitude of ΔrG° and ultimately a change in sign. At higher temperatures, the thermodynamic drive for the reaction favors dehydration in aqueous solution.
Having a thermodynamic drive for a reaction is one thing; determining whether a mechanism exists so that the reaction can occur at hydrothermal conditions typically requires experiments. Dehydration of an alcohol to form an alkene is possible at ambient laboratory conditions by using concentrated acids accompanied by physical separation of reactants and products through distillation (Friesen and Schretzman, Reference Friesen and Schretzman2011). Even the conversion of an alkene and water to an alcohol at ambient requires Brønsted or Lewis acid catalysis, even though the reaction is understood as being favorable in textbook fashion owing to formation of a stronger σ-bond at the expense of a weaker π-bond (Anslyn and Dougherty, Reference Anslyn and Dougherty2005). Therefore, it can come as a surprise that alcohol dehydration is rapid and effective in hydrothermal experiments (Kuhlman et al., Reference Kuhlmann, Arnett and Siskin1994; Antal et al., Reference Antal, Carlsson, Xu and Anderson1998; Katritzky et al., Reference Katritzky, Nichols, Siskin, Murugan and Balasubramanian2001; Hietala and Savage, Reference Hietala and Savage2015; Bockisch et al., Reference Bockisch, Lorance, Hartnett, Shock and Gould2018).
Mechanistically, hydrothermal dehydration of primary (1°) alcohols, in which there is one carbon bonded to the carbon that is bonded to the hydroxyl (–OH) group, likely involves protonation of the –OH followed by simultaneous loss of H2O and deprotonation to form the alkene, as shown in the lower panel of Figure 14.3. This makes it a bimolecular elimination, termed an E2 reaction (Xu et al., Reference Xu, De Almeida and Antal1991). At high temperatures and pressures, an E2 mechanism is possible because protonation is an option owing to the enhanced dissociation of H2O, which raises the proton concentration in neutral hydrothermal solution. In contrast, tertiary (3°) alcohols, in which the carbon bonded to the hydroxyl group is also bonded to three other carbon atoms, are likely to react by a unimolecular elimination (E1) mechanism involving protonation of the hydroxyl followed by elimination of H2O to form a tertiary carbocation that subsequently deprotonates to form the alkene (Xu et al., Reference Xu, Antal and Anderson1997). Recent experimental results (Bockisch et al., Reference Bockisch, Lorance, Hartnett, Shock and Gould2018) show that for many secondary (2°) alcohols, in which the carbon bonded to the hydroxyl group is bonded to two other carbons, the E1 mechanism dominates over the E2 mechanism except in cases where the molecular structure of the alcohol is selected to only allow the E2 mechanism to occur. A specific example is a cyclohexane ring in which the bonds to the hydrogen and the hydroxyl group that are simultaneously eliminated are constrained to be anti- and co-planar. Bockisch et al. (Reference Bockisch, Lorance, Hartnett, Shock and Gould2018) conclude that the E1 mechanism is associated with a positive entropy of activation, whereas the E2 mechanism is associated with a negative entropy of activation, suggesting that E2 elimination becomes less favorable compared to other possible competing reactions, including E1 at higher temperatures. Because the E1 mechanism leads to faster reaction rates than the E2 mechanism at higher temperatures, a prediction from the existing experimental data is that 1° alcohols should persist in hydrothermal fluids longer than other types of alcohols.
14.4 Dehydrogenation/Hydrogenation Reactions
Removal of one or more moles of H2, which is required to convert an alkane to an alkene, a linear alkane to a cyclic one, or a cyclic hydrocarbon to a fully aromatic product, is generally considered to be unfavorable under ambient conditions. Even the common name for alkanes as a class, paraffins (from the Latin, parum affinis, meaning “insufficient affinity”), emphasizes the apparently low reactivity of these molecules. Indeed, a review of organic chemistry textbooks reveals that reactions of alkanes require heat, catalysis, or very strong acids. In particular, accomplishing the dehydrogenation of an alkane at ambient laboratory conditions is difficult – industrial processes typically require temperatures over 500°C (Panizza et al., Reference Panizza, Resini, Busca, Fernández López and Sánchez Escribano2003). One recent and promising method lowers the reaction temperature to 200°C using molecular oxygen as the oxidant, but it requires palladium and titanium dioxide as the catalysts (Dummer et al., Reference Dummer, Bawaked, Hayward, Jenkins and Hutchings2010). The reverse reaction – hydrogenation of an alkene to form an alkane – is easier to do at ambient laboratory conditions, but still requires over-pressures of H2 and noble metal catalysts (Rylander, Reference Rylander1973).
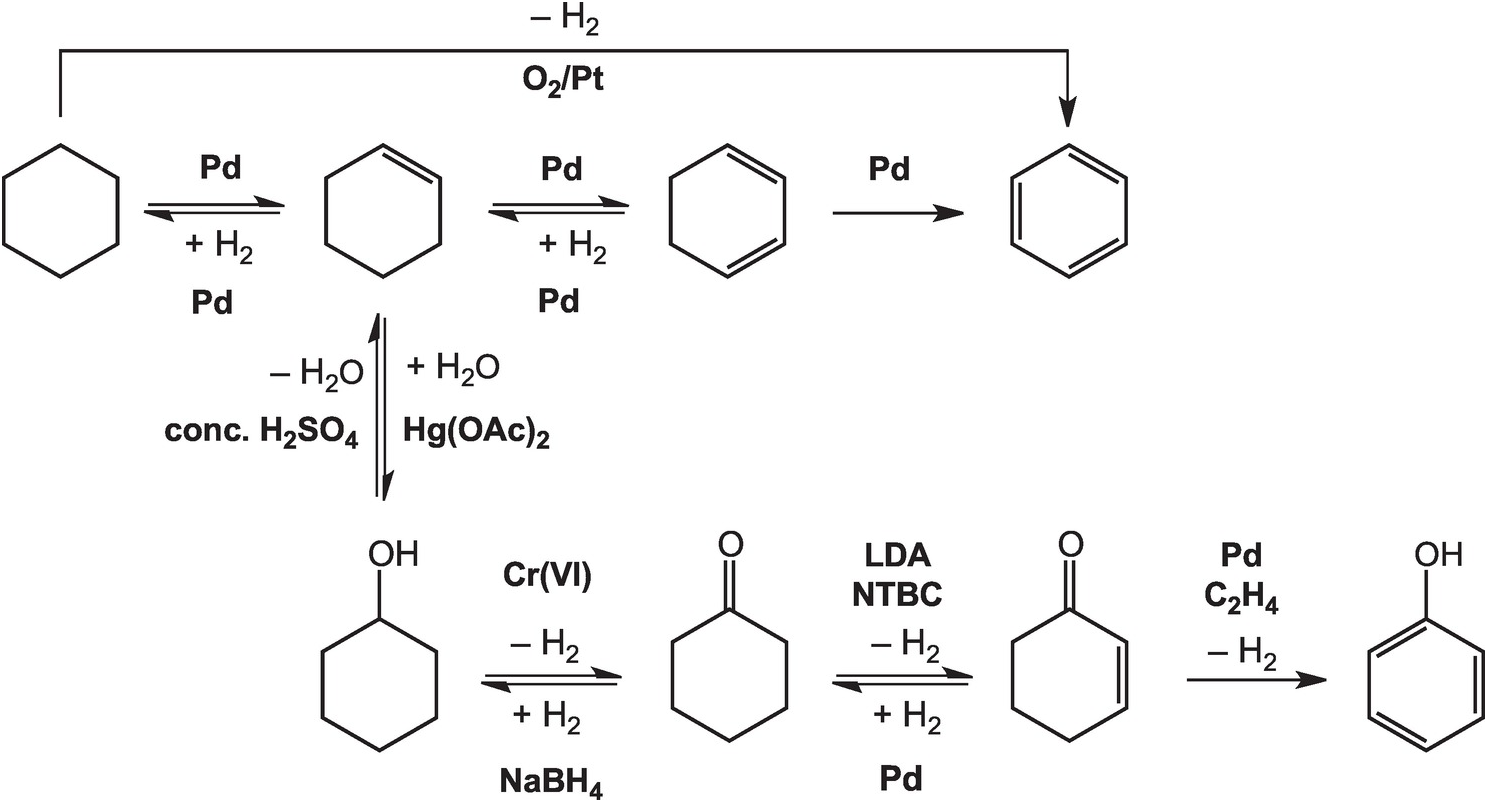
As illustrated in Figure 14.4, the oxidation of cyclohexane to benzene in the lab can be accomplished at high temperatures – above 300°C in the gas phase – with a platinum catalyst (House, Reference House1972). Intermediate reductions and dehydrogenations involving cyclohexene and cyclohexadiene can proceed at somewhat lower temperatures and hydrogen pressures, but still require noble metal catalysts (Rylander, Reference Rylander1973). Meanwhile, the hydration of cyclohexene to cyclohexanol can be accomplished in water with a strong Brønsted acid catalyst, but a Lewis acid catalyst such as mercuric acetate (Hg(OAc)2) is normally used (Zweifel and Nantz, Reference Zweifel and Nantz2006), while the dehydration of cyclohexanol requires concentrated sulfuric acid and elevated temperatures (Streitwieser et al., Reference Streitwieser, Heathcock and Kosower1995). Oxidation of cyclohexanol to cyclohexanone is usually performed using chromium (VI) reagents (Wiberg, Reference Wilberg and Wilberg1965) and the reverse reduction reaction with sodium borohydride (Brown and Ramachandran, Reference Brown, Ramachandran and Abdel-Magid1996). Further oxidation of cyclohexanone to cyclohexenone has been reported using the rather specialized oxidant N-tert-butylbenzenesulfinimidoyl chloride (NTBC) with lithium diisopropylamide (LDA) in tetrahydrofuran at –78°C (Matsuo and Aizawa, Reference Matsuo and Aizawa2005), and the reverse reduction requires hydrogen and a palladium catalyst (Rylander, Reference Rylander1973). The final dehydrogenation step to form phenol can be accomplished by coupling it to the reduction of hydrogen acceptors such as ethene with a Pd catalyst (El-Deeb et al., Reference El-Deeb, Tian, Funakoshi, Matsubara and Hayashi2017). None of these steps has a plausible geochemical version.
Pathways for converting cyclohexane to other organic compounds, including benzene and phenol, as implemented in organic chemistry laboratories. The use of noble metal catalysts, concentrated acids, and brutal oxidants and reductants such as chromate and borohydride, together with other compounds without natural sources, differentiates how organic chemistry is conducted in laboratories and industry from how it occurs in Earth.

Nevertheless, the presence of alkanes and corresponding alkenes and aromatics in fumarolic systems (Tassi et al., Reference Tassi, Venturi, Cabassi, Capecchiacci, Nisi and Vaselli2015; Venturi et al., Reference Venturi, Tassi, Gould, Shock, Hartnett, Lorance, Bockisch, Fecteau, Capecchiacci and Vaselli2017) indicates that such transformation reactions do in fact occur in high-temperature geologic systems, suggesting that alkane–alkene reactions are reversible. As summarized in Figure 14.5, a thermodynamic assessment of the transformation of aqueous cyclohexane (C6H12) to aqueous benzene (C6H6) via
reveals that log K for reaction (14.10) becomes less negative with increasing temperature, suggesting a shift toward the production of benzene from cyclohexane. However, unlike the hydration/dehydration reactions discussed above, analysis of the fate of this reaction from standard-state thermodynamic properties is complicated by its stoichiometry. The shift in ΔrG° to less positive values, which is explained by the powerful influence of the entropy contribution compared to the enthalpy contribution (Figure 14.5), is also consistent with an increasing thermodynamic drive to produce benzene, but the magnitude of that shift is difficult to resolve from values of ΔrG° owing to the involvement of 3 moles of H2 in the production of each mole of benzene. This is where the third plot in Figure 14.5 becomes particularly useful. Each equilibrium constant combined with a value of the activity of H2(aq) sets the equilibrium ratio of benzene to cyclohexane. The temperature-dependent contours of those equilibrium ratios are shown as functions of log aH2(aq), revealing that, at lower values of aH2(aq), benzene can be considerably more abundant than cyclohexane. This aligns with the notion that low values of aH2(aq) imply more oxidized conditions, and the average oxidation state of carbon in benzene (–1) is considerably more oxidized than the corresponding value for cyclohexane (–2). Similar conclusions were reached by Venturi et al. (Reference Venturi, Tassi, Gould, Shock, Hartnett, Lorance, Bockisch, Fecteau, Capecchiacci and Vaselli2017), who made comparisons of equilibrium ratios with oxidation states set by mineral equilibria.
Thermodynamics of hydrothermal conversion of cyclohexane to benzene, which requires none of the extreme measures outlined in Figure 14.4, together with reaction paths from hydrothermal experiments. Note that log K for reaction (14.10) in the upper-left plot becomes increasingly positive with increasing temperature, as calculated with equations and parameters from Shock et al. (Reference Shock, Helgeson and Sverjensky1989; Reference Shock, Oelkers, Johnson, Sverjensky and Helgeson1992) and Plyasunov and Shock (Reference Amend and Shock2001). The positive increase in log K is reflected in the increasingly less positive values of ΔrG° shown in the upper-middle plot, which also shows how the increasing negative contribution of the –TΔrS° term surpasses the decreasingly positive contribution of the ΔrH° term as temperature increases. Contours of the equilibrium ratio of benzene to cyclohexane as functions of log aH2(aq) and temperature from 0°C to 350°C (every 50°C) are shown in the upper-right plot. Following an isotherm, the ratio of benzene to cyclohexane increases with decreasing log aH2(aq), and at constant log aH2(aq) the ratio increases with increasing temperature. The bottom panel shows reaction paths determined by Venturi et al. (Reference Venturi, Tassi, Gould, Shock, Hartnett, Lorance, Bockisch, Fecteau, Capecchiacci and Vaselli2017) in hydrothermal experiments at 300°C and 8.5 MPa. Arrows indicate the type of reaction leading to the suite of products from cyclohexane. The lack of arrows to phenol, which was a product in the experiments, indicates that the reaction pathways were not resolved in the experiments.
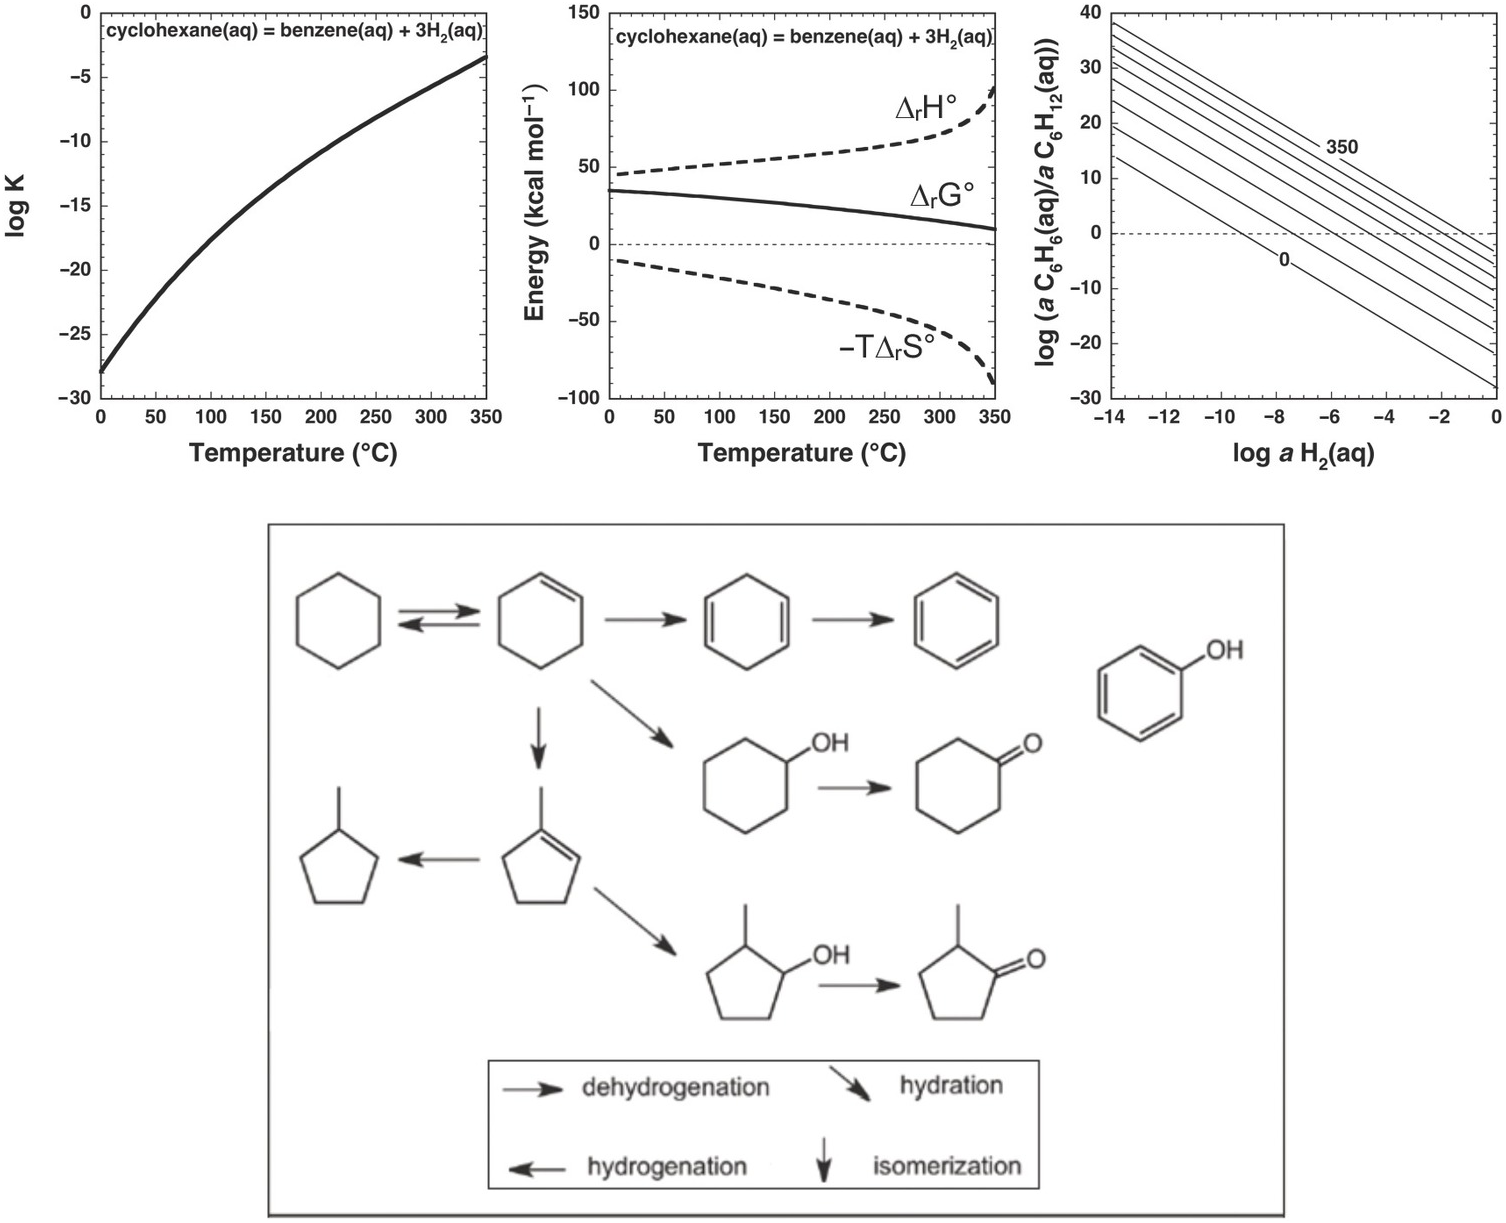
In this case, thermodynamic analysis helps to explain the observations of natural systems via a drive toward a metastable equilibrium state involving benzene, cyclohexane, and hydrogen in aqueous solution, but can, of course, provide no evidence of how the reaction happens. Hydrothermal experiments with cyclohexane and common sulfide and oxide minerals (Venturi et al., Reference Venturi, Tassi, Gould, Shock, Hartnett, Lorance, Bockisch, Fecteau, Capecchiacci and Vaselli2017) demonstrate that conversion of cyclohexane to cyclohexene (C6H10) and benzene is possible at 300°C and Psat. A summary of these results is provided in the lower panel of Figure 14.5. The oxidation–reduction reaction between cyclohexane and cyclohexene was shown to be reversible. Additional oxidation reactions from cyclohexene leading to cyclohexadiene and benzene occurred, as did isomerization reactions yielding methylcyclopentene isomers. Hydration of both cycloalkenes led to alcohols and ketones. Phenol production may have come from benzene or cyclohexanol; the reaction pathway awaits further experimental investigation.
Conversion of cycloalkanes into their aromatic equivalents is of commercial interest as a component of petroleum reformation. Dehydrogenation of cyclohexane to benzene and cyclohexanol to phenol requires heterogeneous catalysis and high-temperature gas-phase reactions. Cyclohexane dehydrogenation generally requires metallic palladium as a catalyst and temperatures from 350°C to 550°C (e.g. see Heinemann et al., Reference Heinemann, Mills, Hattman and Kirsch1953). Cyclohexanol can be dehydrogenated under somewhat milder conditions (i.e. 200–300°C), but still requires metallic catalysts such as copper or zinc oxide (Romero et al., Reference Romero, Santos, Escrig and Simon2011). The major conclusions from the experiments of Venturi et al. (Reference Venturi, Tassi, Gould, Shock, Hartnett, Lorance, Bockisch, Fecteau, Capecchiacci and Vaselli2017) are that the presence of minerals yields products that are unexpected based on the reactions of the organic compounds in water alone, and that reactions that are traditionally thought to require metal catalysts can be catalyzed by simple minerals under these conditions.
The influence of minerals on the reactions of alkanes may be far more widespread than is currently appreciated. As an example, Shipp et al. (Reference Shipp, Gould, Shock, Williams and Hartnett2014) used sphalerite (ZnS) at 300°C and 100 MPa to enhance alkane reaction rates and improve reaction specificity. This work revealed that the influence of the sphalerite surface on the reaction of 1,2-dimethylcyclohexane, which was complex and reversible in water alone, was to generate only the corresponding cis- or trans-stereoisomer. Experiments with sphalerite and 1,2-dimethylcyclohexane in D2O further demonstrated a single deuterium incorporation into the product. This indicated that the C–H bonds were activated individually rather than in a concerted mechanism. Mechanistic clues were also gathered by Shipp et al. (Reference Shipp, Gould, Herckes, Shock, Williams and Hartnett2013), who showed that both monomethyl and dimethyl cyclohexane oxidation reactions to produce the corresponding alkenes are reversible (albeit often slowly) at 300°C and 100 MPa and that a complex suite of products, including both hydrogenation/dehydrogenation and hydration/dehydration reactions, are possible.
Reversibility of hydrogenation/dehydrogenation reactions was also demonstrated at 300°C and 100 MPa for ketones and alcohols by Shipp et al. (Reference Shipp, Gould, Herckes, Shock, Williams and Hartnett2013) for 2-methylcyclohexanone and 2-methylcyclohexanol, as well as several dimethylcyclohexanone and dimethylcyclohexanol isomers, and by Yang et al. (Reference Yang, Gould, Williams, Hartnett and Shock2012) for dibenzylketone and the corresponding alcohol at 300°C and 70 MPa. As mentioned above, production of cyclohexanol and cyclohexanone in experiments starting with cyclohexene by Venturi et al. (Reference Venturi, Tassi, Gould, Shock, Hartnett, Lorance, Bockisch, Fecteau, Capecchiacci and Vaselli2017) also suggests that hydrogenation/dehydrogenation reactions of ketones and alcohols are reversible. Taken together, reversible hydrogenation/dehydrogenation reactions among pairs of alkanes and alkenes, as well as alcohols and ketones, may be driven by changes in the activity of H2(aq), which is itself often controlled by mineral–fluid equilibria in reactions involving Fe-bearing oxides, sulfides, and silicates, as discussed above. Experimental evidence for the influence of mineral assemblages on the fate of organic compounds is summarized by Seewald (Reference Seewald2001; Reference Seewald2003; Reference Seewald and White2017), McCollom and Seewald (Reference McCollom and Seewald2007), and Yang et al. (Reference Yang, Williams, Hartnett, Gould and Shock2018). There may also be conditions in organic-rich sedimentary rocks, petroleum reservoirs, and coal beds where organic reactions determine the oxidation state of Fe in sedimentary rocks (Helgeson et al., Reference Helgeson, Knox, Owens and Shock1993; Reference Helgeson, Richard, McKenzie, Norton and Schmitt2009; Shock, Reference Shock, Pittman and Lewan1994).
14.5 Organic Oxidations
The hydrogenation/dehydrogenation reactions summarized above represent manifestations of oxidation–reduction reactions involving organic compounds in geochemical processes. Studies of ore deposits have repeatedly reached the conclusion that such reactions involving organic compounds and metals in minerals or in solution are essential for certain types of ore deposition (see below). Exploring these organic–inorganic connections in hydrothermal experiments provides insights into novel reaction coupling that may be unexpected based on organic oxidation experiments at ambient conditions.
An example of the unexpected is the series of organic oxidation reactions involving dissolved CuCl2 at 250°C and 4.0 MPa studied by Yang et al. (Reference Yang, Hartnett, Shock and Gould2015). Based on laboratory experience in organic chemistry at ambient conditions, divalent copper is thought to be an ineffective oxidant for organic reactions. This stems from the relatively low oxidation potential of the Cu(II)–Cu(I) pair at ambient, which is not nearly as attractive as oxidation by Cr(VI) or Mn(VII). Of course, the notion of the strength of an inorganic oxidant depends on how its oxidation potential relates to the oxidation potential of the organic compound being oxidized. As oxidation potentials are strongly and diversely temperature dependent (Amend and Shock, Reference Amend and Shock2001), conditions can change dramatically at elevated temperatures and pressures.
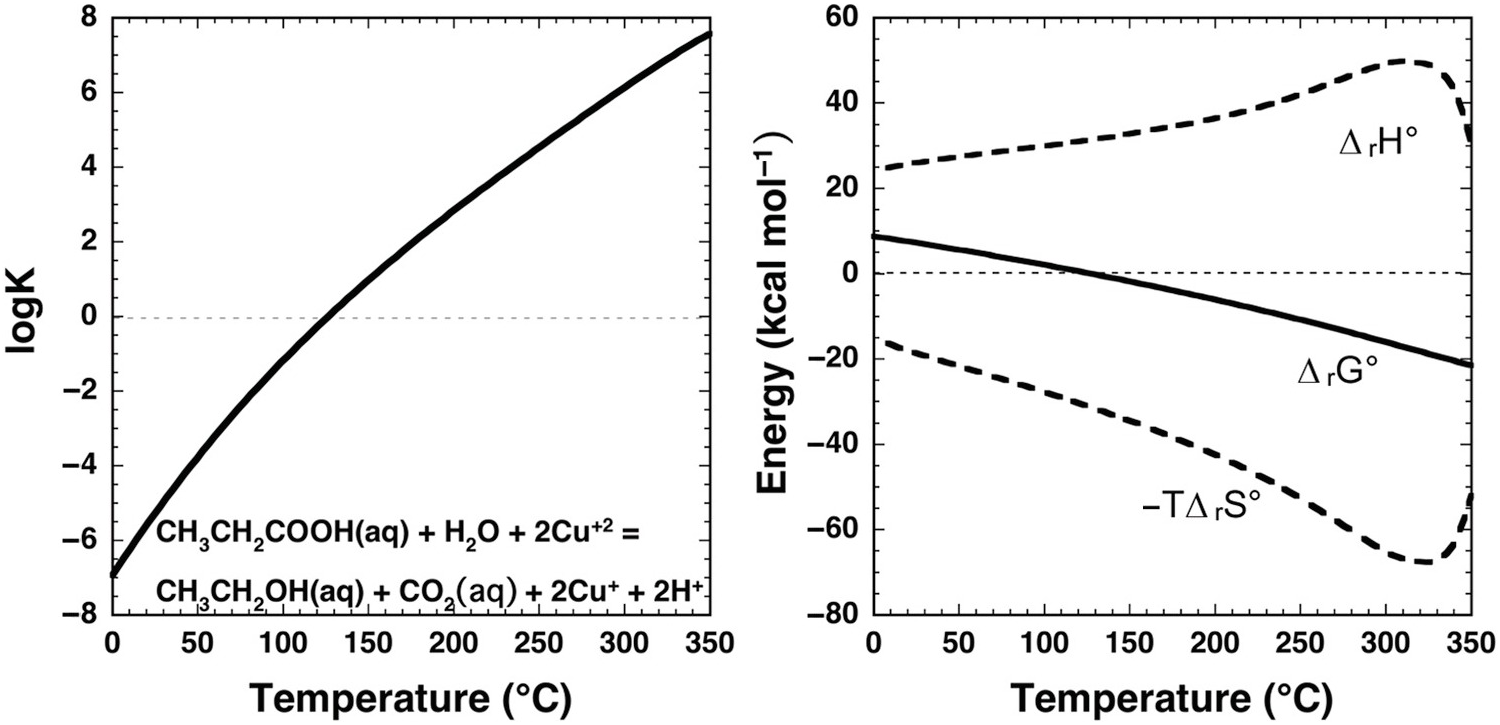
Dramatic change with temperature characterizes the standard-state thermodynamic properties of organic compound oxidation coupled to Cu(II) reduction in aqueous solution as shown in Figure 14.6. In this example, propanoic acid (CH3CH2COOH) is oxidized to ethanol (CH3CH2OH) and CO2 by reduction of Cu+2 to Cu+, as in
The equilibrium constant for reaction (14.11) at and near ambient conditions indicates that it is highly unfavorable for the reaction to proceed, consistent with organic laboratory experience. At ambient conditions, where log K is strongly negative, Cu+2 would not be chosen as an oxidant for this organic oxidation. But, as temperature increases, log K and ΔrG° change sign at about 125°C. Note that at all temperatures ΔrH° has a large positive contribution to ΔrG°, and that –TΔrS° has a large negative contribution. The effect of temperature is to drive a milder positive shift in ΔrH° and a more robust negative shift in –TΔrS°, such that the influence of the latter term causes ΔrG° to become negative. At the higher temperatures encountered in hydrothermal fluids, Cu(II) apparently can become an effective oxidant for organic reactions.
Thermodynamics of the aqueous oxidation of propanoic acid to ethanol and CO2 coupled to the reduction of Cu+2 to Cu+ given by reaction (14.11). Equilibrium constants are shown in the left panel and standard-state thermodynamic properties in the right panel. Calculations were conducted with equations and parameters from Shock et al. (Reference Shock, Helgeson and Sverjensky1989; Reference Shock, Oelkers, Johnson, Sverjensky and Helgeson1992; Reference Shock, Sassani, Willis and Sverjensky1997), Shock and Helgeson (Reference Shock and Helgeson1990), and Shock (Reference Shock1995). At ambient laboratory conditions, log K for this reaction is negative, consistent with organic chemistry experience that reduction of Cu+2 cannot be coupled to the oxidation of organic compounds. However, as temperature increases, log K for reaction (14.11) becomes positive and ΔrG° becomes negative owing to the dominant influence of the –TΔrS° term as temperature increases. At these conditions, Cu+2 can be used to oxidize organic solutes as demonstrated in experiments on phenylacetic acid by Yang et al. (Reference Yang, Hartnett, Shock and Gould2015) (see text).
The potential for Cu(II) to become an effective organic oxidant in water at elevated temperatures and pressures was documented by Yang et al. (Reference Yang, Hartnett, Shock and Gould2015) for a suite of reactions leading from phenylacetic acid (C6H5CH2COOH) all the way to benzoic acid (C6H5COOH) using CuCl2. In summary, the stepwise oxidation reactions can be written as
followed by hydration to form benzyl alcohol (C6H5CH2OH)
and
keeping in mind that chloride complexes will dominate the speciation of Cu+2 and Cu+ at the experimental conditions. Note that reduction of 6 moles of Cu(II) is required to oxidize 1 mole of phenylacetic acid to benzoic acid.
Mechanistic details deduced for these reactions include the likely involvement of aqueous complexes between Cu+2 and phenylacetate that trigger reaction (14.12), leading quickly (via reactions (14.13) and (14.14)) to benzyl alcohol, which is considerably more stable in aqueous solution than its radical (C6H5CH2•) and carbocation (C6H5CH2+) precursors. As documented by Yang et al. (Reference Yang, Hartnett, Shock and Gould2015), the lack of rate effects by adding electron-withdrawing or electron-donating functional groups to the aromatic ring supports the argument that the mechanism is likely to involve the formation of a Cu(II)-phenylacetate complex in solution. In contrast, use of ring substituents in a series of benzyl alcohol experiments strongly supports the formation of a positive charge on the aromatic ring in the rate-determining step to form benzaldehyde (C6H5CHO), and the mechanisms for reactions (14.15) and (14.16) are proposed to involve one-electron oxidations via benzylic radicals. The final step in the chain of oxidations produces benzoic acid from benzaldehyde (reactions (14.17) and (14.18)), which requires the contribution of an oxygen atom from H2O. The prevalence of organic dehydration reactions in hydrothermal solutions discussed above implies that conventional oxidation driven by initial formation of a hydrate from the aldehyde, followed by its oxidation, is unlikely in these experiments. Yang et al. (Reference Yang, Hartnett, Shock and Gould2015) concluded that radical cation formation followed by H2O addition is a more likely mechanism, supported by mild ring-substituent effects indicating development of a positive charge on the benzene ring. These results show how coupling of metal reductions and organic oxidations that are unexpected based on ambient laboratory conditions may be common when Earth acts as an organic chemist.
14.6 Amination/Deamination as Examples of Substitution Reactions
Organic nitrogen compounds are essential for all life on Earth; nucleobases and amino acids serve as building blocks for DNA and proteins, respectively. The availability of different forms of nitrogen throughout Earth’s history has therefore strongly influenced the emergence and evolution of the biosphere (Mancinelli and McKay, Reference Mancinelli and McKay1988). At the surface of Earth, biology is predominantly responsible for the relatively rapid cycling of nitrogen between its organic and inorganic forms (Galloway et al., Reference Galloway, Dentener, Capone, Boyer, Howarth, Seitzinger, Asner, Cleveland, Green, Holland, Karl, Michaels, Porter, Townsend and Vörösmarty2004). Over longer timescales, however, the fluxes of nitrogen to and from the biosphere must be dependent on global geologic processes, such as burial of sediments, plate tectonics, and volcanism (Berner, Reference Berner2006; Boudou et al., Reference Boudou, Schimmelmann, Ader, Mastalerz, Sebilo and Gengembre2008). Such geochemical settings may be outside the conditions that permit biochemistry, and also where the reactions of organic nitrogen compounds are less understood owing to wide ranges of temperature, pressure, and compositional variables that have yet to be explored.
In aqueous environments, the main class of abiotic reactions that biologically relevant organic nitrogen compounds undergo is deamination, the loss of an amino group (–NH2 or –NH3+). Certain nucleobases are known to readily deaminate via hydrolysis (reaction initiated by H2O) under near-ambient conditions (Garrett and Tsau, Reference Garrett and Tsau1972; Wang and Hu, Reference Wang and Hu2016), while amino acids are more recalcitrant, requiring higher temperatures before deamination is observable on laboratory timescales (Cox and Seward, Reference Cox and Seward2007). These experimental observations seem to account for the fact that, compared to nucleobases, amino acids are better preserved in the geologic record (Bada et al., Reference Bada, Wang and Hamilton1999) and much more abundant in meteorites (Pizzarello and Shock, Reference Pizzarello, Shock, Deamer and Shostak2010). Indeed, the metastability of aliphatic amines, including amino acids and alkyl amines, is further supported by synthetic organic chemistry techniques aimed at room-temperature deamination, which requires harsh conditions such as the addition of nitrous acid (Monera et al., Reference Monera, Chang and Means1989), nitrosyl chloride (White and Scherrer, Reference White and Scherrer1961), or high-energy radiation (Dale and Davies, Reference Dale and Davies1950; Shadyro et al., Reference Shadyro, Sosnovskaya and Vrublevskaya2003).
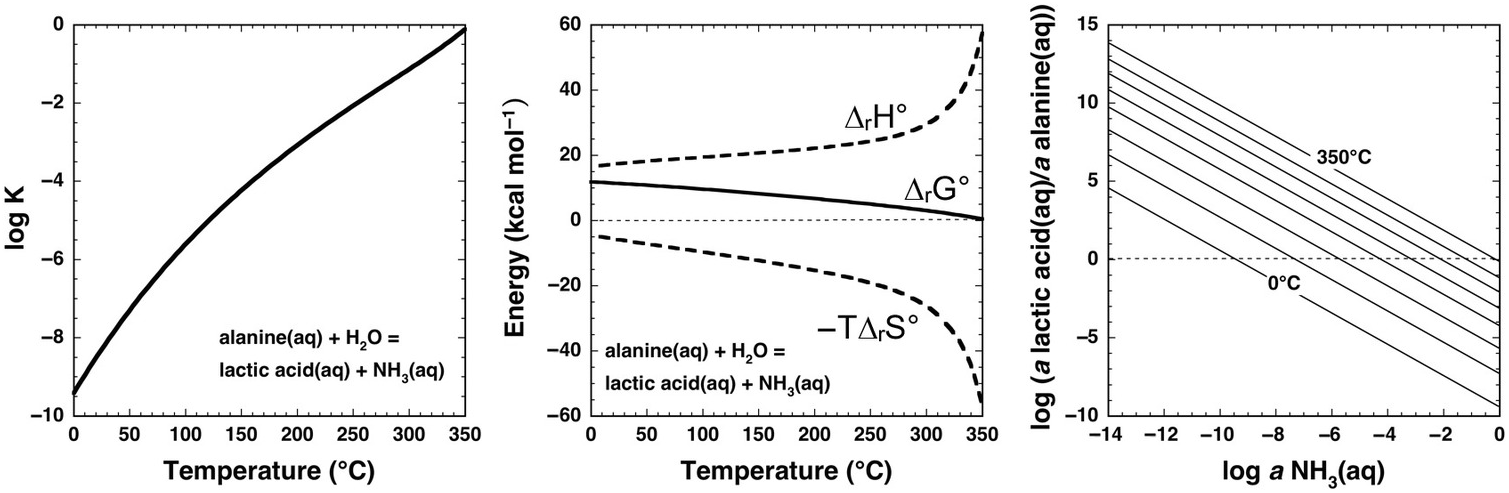
Underlying thermodynamic reasons for such extreme laboratory requirements at ambient conditions are revealed by the calculations shown in Figure 14.7 for the aqueous deamination of alanine (C2H5NH2COOH) to lactic acid (C2H5OHCOOH) via the organic substitution reaction
Note that log K is negative for this reaction at all temperatures at Psat, and only approaches 0 at the highest temperatures. Once again, the contribution of –TΔrS° causes ΔrG° to become less positive with increasing temperature, but cannot overcome the positive contribution of ΔrH° except at the highest temperatures (>350°C). As in the case of cyclohexane oxidation to benzene shown in Figure 14.5, the stoichiometry of this reaction can inhibit an intuitive understanding of the influence of ammonia abundance. The right-hand panel of Figure 14.7 shows how the equilibrium activity ratio of lactic acid to alanine depends on the activity of aqueous ammonia, revealing that deamination in the presence of micromolal concentrations of NH3(aq) favors lactic acid above about 75°C, while at millimolal concentrations of NH3(aq), temperatures above about 200°C will favor deamination of alanine to lactic acid (assuming molality equals activity, which is a reasonable approximation for a neutral solute in a dilute solution). Although laboratory deamination conditions are generally irrelevant to natural settings, various experimental tools developed by physical organic chemists show promise for making predictions about amino-group reactivity across a diversity of geochemical environments.
Thermodynamics of the deamination of alanine to lactic acid consistent with reaction (14.19) calculated with equations and parameters from Shock et al. (Reference Shock, Helgeson and Sverjensky1989; Reference Shock, Oelkers, Johnson, Sverjensky and Helgeson1992), Shock (Reference Shock1995), and Dick et al. (Reference Dick, LaRowe and Helgeson2006). Note that the values of log K at Psat (left) are negative at low temperatures, but become less negative as temperature increases. Likewise, positive values of ΔrG° (middle) become increasingly less positive with increasing temperature. These changes suggest an increase in the thermodynamic drive for deamination as temperature increases, which can be assessed with the plot on the right. Contours of the equilibrium ratio of lactic acid to alanine every 50°C from 0°C to 350°C are shown as functions of log aNH3(aq), indicating that the ratio increases with increasing temperature at constant log aNH3(aq). Alternately, the plot can reveal temperatures at which equilibrium requires significant deamination of alanine; at log aNH3(aq) = –6, the ratio exceeds unity at just below 100°C, and at log aNH3(aq) = –3, the ratio exceeds unity above 200°C.
Using some of these tools, Robinson et al. (Reference Robinson, Gould, Fecteau, Hartnett, Williams and Shock2019) investigated deamination rates and mechanisms for model amines under acidic, hydrothermal conditions (250°C, 4.0 MPa, pH 3.3), relevant to amino acid deamination in granitic or rhyolitic hydrothermal systems. Distinguishing reaction mechanisms enables improved prediction of reactivity in diverse natural systems because individual mechanisms depend differently on geochemical conditions. Using a variety of benzylamine derivatives, Robinson et al. (Reference Robinson, Gould, Fecteau, Hartnett, Williams and Shock2019) elucidated two separate deamination substitution mechanisms, with unimolecular (SN1) and bimolecular (SN2) rate-limiting steps, as shown at the top of Figure 14.8. Both mechanisms result in the same hydration product, benzyl alcohol, and were resolved by taking advantage of a traditional organic chemistry technique using Hammett relationships (Hammett, Reference Hammett1935). These are linear free energy kinetic relationships that provide insight into the sign and the extent of charge buildup in the transition states of various mechanisms. The kinetics of deamination were compared for different ring-substituted benzylamines, which were assigned empirically derived Hammett σ+ values according to the electron-withdrawing or electron-donating character of their substituents (Gordon and Ford, Reference Gordon and Ford1972), as shown in the lower left of Figure 14.8. The nonlinear Hammett plot revealed the presence of both SN1 and SN2 mechanisms. By comparison, a secondary amine (α-methylbenzylamine) exhibited only an SN1 mechanism.
Reaction scheme (top) showing unimolecular substitution (SN1) and bimolecular substitution (SN2) deamination mechanisms for benzylamine (after Robinson et al., Reference Robinson, Gould, Fecteau, Hartnett, Williams and Shock2019). A Hammett plot (bottom left) shows deamination rate constants for benzylamine derivatives that possess different ring substituents (X) versus their associated σ+ values. The data set is fit with a curved dotted line, which was produced with two additive linear functions that indicate the presence of both an SN1 (orange) and an SN2 (purple) mechanism. A conceptual Arrhenius plot (bottom right) illustrates the expected temperature dependence for unimolecular and bimolecular reaction rates relative to one another.
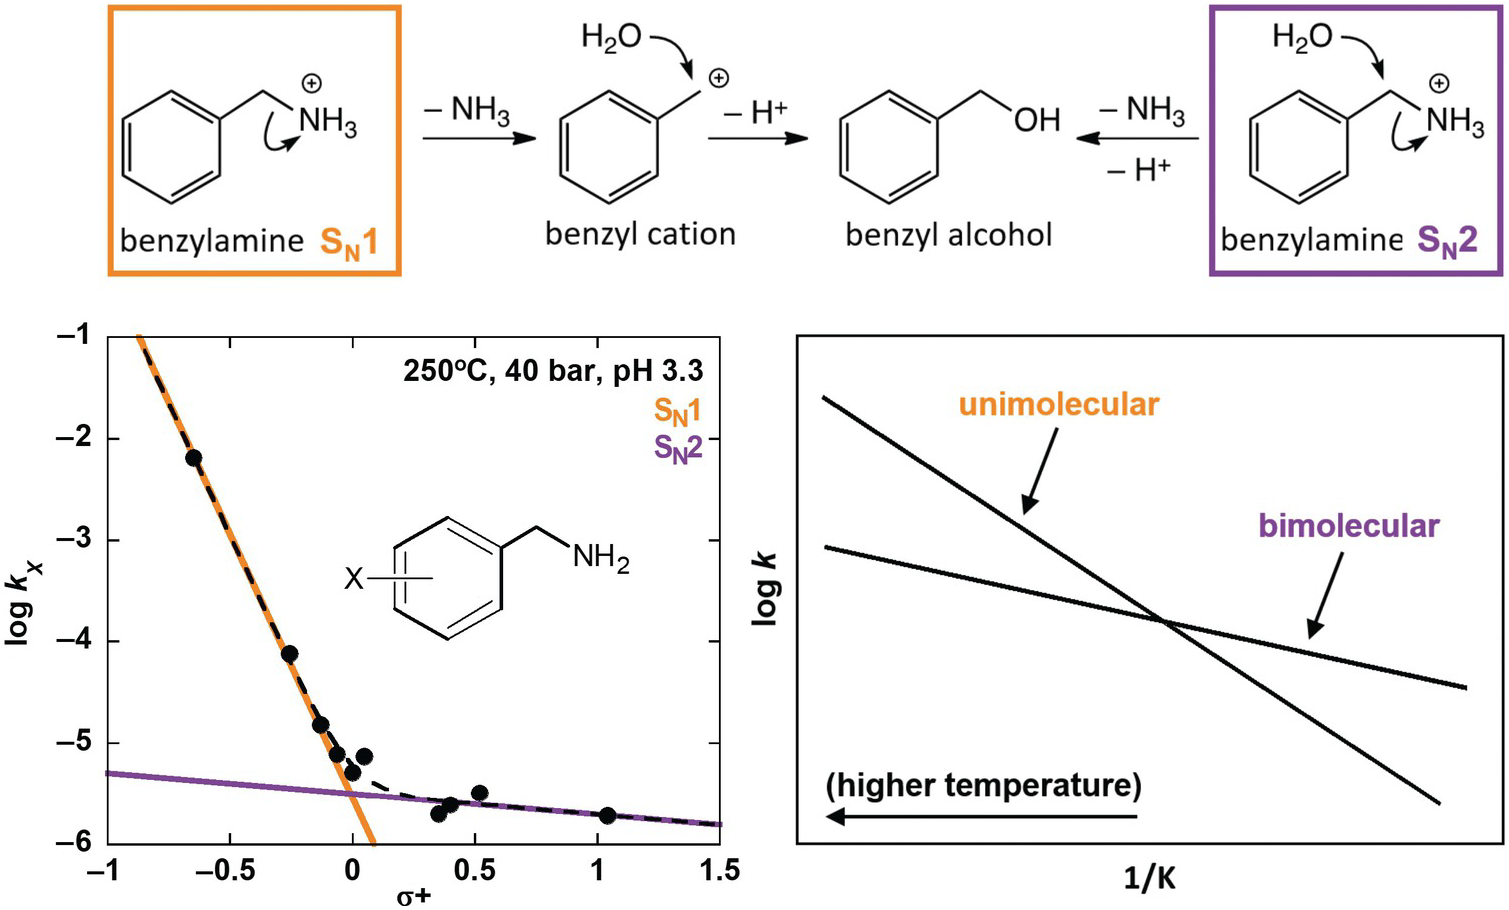
The strength of predictive reaction rate models is greatly enhanced by this type of effort to distinguish mechanisms. In this case, the reaction rates for the SN1 and SN2 mechanisms would be expected to have different temperature dependencies owing to the entropic favorability of a unimolecular rate-limiting step over a bimolecular one. This expectation is illustrated in the lower-right plot in Figure 14.8, which shows a conceptual Arrhenius plot of competing linear relationships between the log of the rate constant (k) for single-reaction mechanisms versus the inverse temperature in Kelvin (1/K). The results from Robinson et al. (Reference Robinson, Gould, Fecteau, Hartnett, Williams and Shock2019) demonstrate that hydrothermal deamination of benzylamine has two mechanisms and will not follow a single linear Arrhenius trend. Therefore, extrapolation of observed deamination rates across temperature with a single trend would be unreliable. However, the identification of SN1 and SN2 mechanisms allows the rate for each to be characterized across temperature independently, which will permit much more accurate extrapolation and prediction.
14.7 When Organic Molecules Combine: Disproportionation Reactions and Electrophilic Aromatic Substitutions
The preceding examples illustrate the hydrothermal transformation of one organic compound into another through elimination and substitution reactions. Organic compounds can also react with one another to form new products at hydrothermal conditions. In disproportionation reactions two molecules react to generate two new molecules, and in electrophilic aromatic substitution (EAS) reactions two or more molecules can combine to generate greater molecular complexity. Examples of both of these processes are found in the reactions of aldehydes and ketones.
Disproportionation is the primary reaction pathway available to aldehydes that lack α-hydrogens (i.e. hydrogens bonded to a carbon that is bonded to the carbonyl carbon), such as benzaldehyde (C6H5COH). In the process, two molecules of the aldehyde react to yield equal amounts of the corresponding alcohol and carboxylic acid, as in
Thermodynamic data equivalent to those presented above for other reactions are lacking in this case; however, insight into this reaction and its mechanism was obtained from detailed kinetic studies (Fecteau et al., Reference Fecteau, Gould, Glein, Williams, Hartnett and Shock2019). The mechanism of this reaction involves bimolecular reaction of the aldehydes since the reaction is characterized by clean second-order kinetics, and the reaction rate increases with increasing benzaldehyde concentration as expected for a second-order process. Eyring analysis of temperature-dependent kinetic data yields an entropy of activation of –161 J mol–1 K–1, which is also consistent with a bimolecular transition state at the rate-limiting step.
In the laboratory, aldehyde disproportionation is catalyzed by strongly basic conditions such as those obtained by adding sodium hydroxide, the classic example being the Cannizzaro reaction of benzaldehyde (Cannizzaro, Reference Cannizzaro1853; Swain et al., Reference Swain, Powell, Sheppard and Morgan1979). Typically, an aqueous sodium hydroxide solution is mixed with a protic organic solvent such as methanol to enhance the solubility of the aldehyde (Swain et al., Reference Swain, Powell, Sheppard and Morgan1979). Under hydrothermal conditions, solubility is dramatically enhanced, and the reaction occurs without the addition of base (Katritzky et al., Reference Katritzky, Balasubramanian and Siskin1990a; Tsao et al., Reference Tsao, Zhou, Liu and Houser1992; Ikushima et al., Reference Ikushima, Hatakeda, Sato, Yokoyama and Arai2001; Nagai et al., Reference Nagai, Matubayasi and Nakahara2004; Fecteau et al., Reference Fecteau, Gould, Glein, Williams, Hartnett and Shock2019). Experiments as a function of pH show that the hydrothermal reaction can also be catalyzed by hydroxide at higher pH, and at lower pH water serves as the nucleophile for hydrate formation, which then donates hydride to another benzaldehyde molecule in the rate-limiting step.
Another disproportionation found by Fecteau et al. (Reference Fecteau, Gould, Glein, Williams, Hartnett and Shock2019) involves benzaldehyde and benzyl alcohol given by
Kinetic studies suggest a similar mechanism to the hydrothermal benzaldehyde disproportionation. The products of this disproportionation reaction – a hydrocarbon and a carboxylic acid – represent members of the most abundant organic compounds found in sedimentary basin fluids (petroleum and aqueous), suggesting that reaction (14.21) may represent a class of common geochemical reactions.
Aldehydes are common reactants in the synthesis of larger organic compounds through reactions that create carbon–carbon bonds, such as the aldol condensation and a closely related reaction, the Claisen–Schmidt condensation. These reactions require aldehydes with α-hydrogens, and at ambient they are promoted by both acidic and basic conditions, leading to enol or enolate ion intermediates, respectively. Aldol reactions have been observed under hydrothermal conditions (Katritzky et al., Reference Katritzky, Luxem and Siskin1990b) and compete with the disproportionation of the aldehyde.
EAS is a reaction where a hydrogen atom of an aromatic ring is substituted by an organic electrophile acting as a Lewis acid toward the π-electrons of the aromatic ring. The Lewis acid site is centered on a carbon atom, which allows new carbon–carbon bonds to form larger, more complex organic structures. In ambient laboratory applications, the Friedel–Crafts reaction, which relies upon a Lewis acid catalyst such as aluminum trichloride to generate the organic electrophile, is perhaps the most prevalent example of EAS. A common industrial example is the production of ethylbenzene, an intermediate in the production of styrene and the plastics produced from it. Under hydrothermal conditions (250°C, Psat), EAS has been observed to readily occur with certain organic compounds that form stable carbocations that can act as electrophiles, such as benzyl alcohol (Fecteau et al., Reference Fecteau, Gould, Glein, Williams, Hartnett and Shock2019; Robinson et al., Reference Robinson, Gould, Fecteau, Hartnett, Williams and Shock2019). Benzyl alcohol forms such a carbocation upon loss of water (i.e. dehydration), a step that is promoted by the increased concentrations of hydronium ions afforded by the enhanced dissociation of water at hydrothermal conditions compared to ambient. The benzyl cation is a powerful carbon-centered Lewis acid, and formation of the cation from benzyl alcohol is promoted by simple Brønsted acids – even hydronium ions derived from H2O – and does not require the addition of catalytic Lewis acids. A striking example of EAS at these conditions is the production of the polycyclic aromatic hydrocarbon anthracene from two benzyl alcohol molecules via two consecutive EAS reactions, the second of which is intramolecular. Assignment of the mechanism of each step to EAS is supported by detailed kinetic studies of the reaction. These EAS reactions yield 9,10-dihydroanthracene, which can dehydrogenate to form the more thermodynamically stable anthracene (Fecteau et al., Reference Fecteau, Gould, Glein, Williams, Hartnett and Shock2019).
14.8 Summary of Hydrothermal Organic Transformations
As described above, numerous organic transformations happen readily in water at elevated temperatures and pressures, and the same transformations require concentrated acids, extreme oxidants or reductants, or other unnatural conditions in the laboratory at ambient conditions. The dramatic shift in the dielectric constant of H2O with increasing temperature makes its solvent properties for organic compounds similar to those of organic solvents at ambient conditions (Shock, Reference Shock1992). Additionally, the pH and oxidation state of hydrothermal environments are buffered by reactions among fluids and rock-forming minerals and can control the organic reactions taking place.
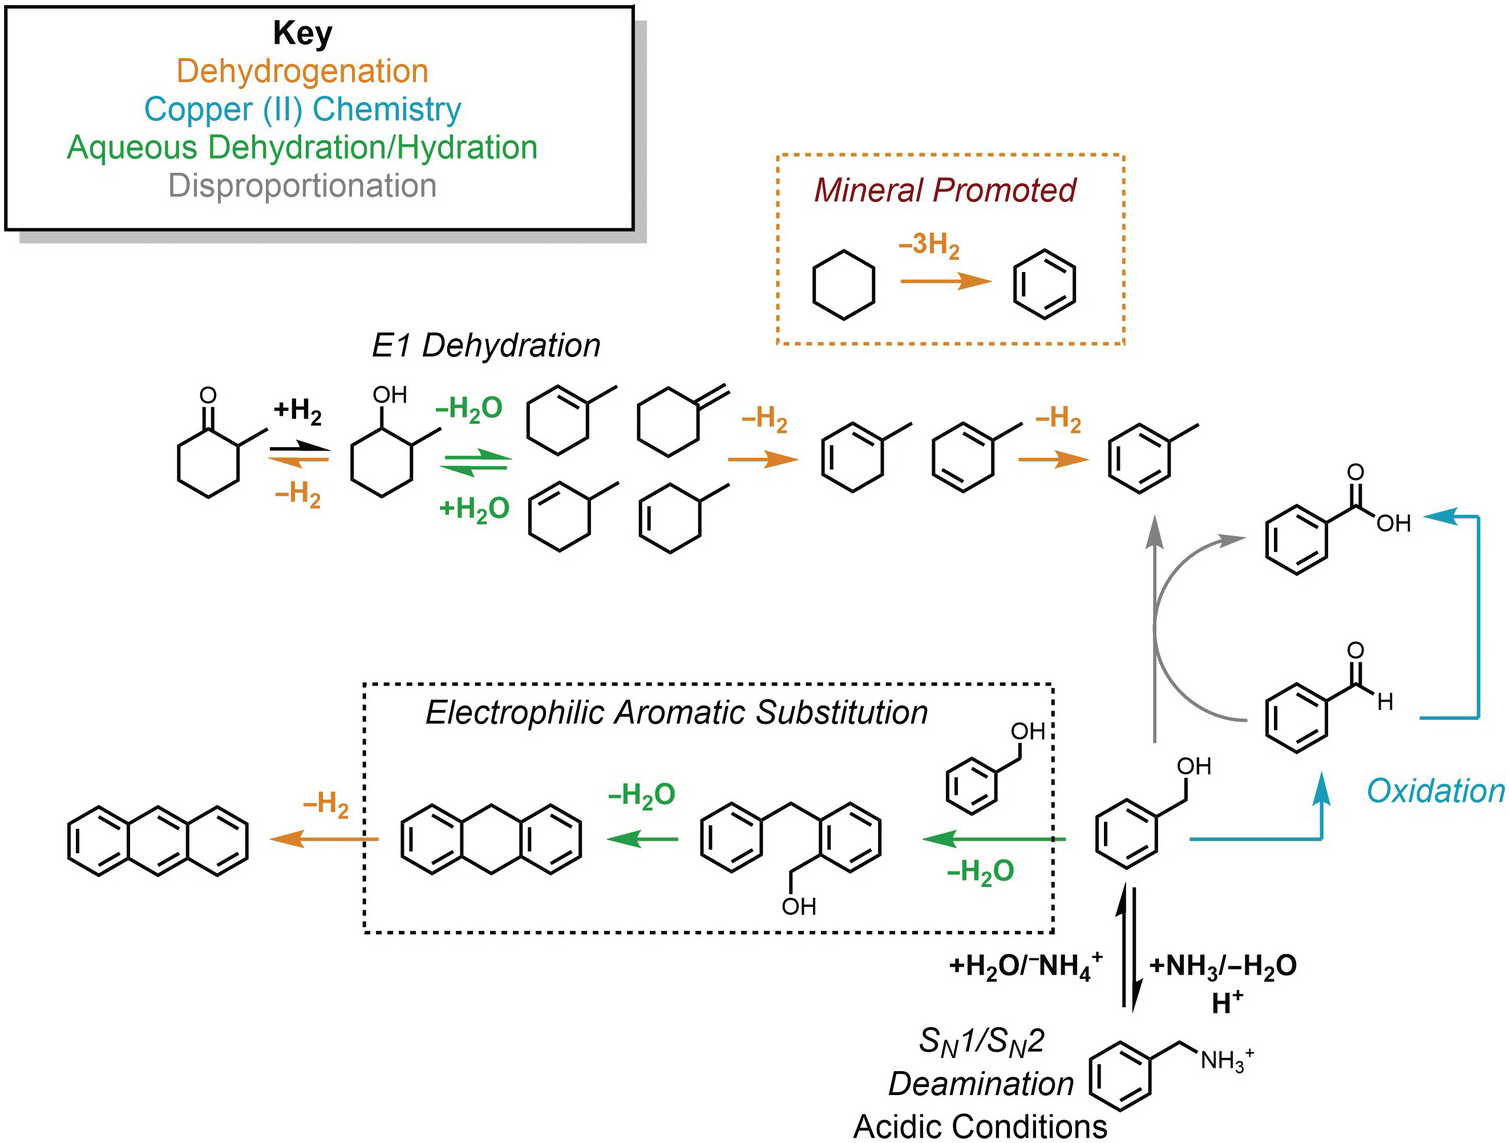
The potential connections among several hydrothermal organic reactions are summarized in Figure 14.9. An alcohol, represented by the methylcyclohexanol in the upper part of the figure, can dehydrogenate reversibly to form the corresponding ketone via an elimination mechanism, or dehydrate reversibly to form alkenes. Further hydrogenation/dehydrogenation reactions link various hydrocarbons. In Figure 14.9, this is represented by methylcycloalkenes dehydrogenating to form methylcyclodienes and ultimately toluene, as well as the mineral-assisted dehydrogenation of cyclohexane to benzene. Another hydrothermal path toward toluene starts from benzyl alcohol in the lower-right corner, which can react with benzaldehyde to produce benzoic acid and toluene as an example of a disproportionation reaction. Hydrothermal oxidation of benzyl alcohol to benzaldehyde, as well as benzaldehyde oxidation to benzoic acid, can each be coupled to reduction of Cu(II), which is utterly unfamiliar at ambient laboratory conditions. This is an example of how an oxidation state imposed by minerals can influence or determine organic reaction paths and products. In low-pH environments, which can occur in high-temperature, organic-rich sediments and in hydrothermal systems hosted in silicic igneous rocks, benzylamine can reversibly deaminate to produce benzyl alcohol through simultaneous unimolecular and bimolecular substitution mechanisms. Benzyl alcohol can also react via an EAS mechanism with itself, undergoing two steps of hydrothermal dehydration to generate 9,10-dihydroanthracene and a dehydrogenation to produce anthracene.
Examples of the hydrothermal organic reactions summarized in this chapter. Color coding groups reactions by type; mechanisms are in italics.
By generating results along time series, the same experiments that reveal mechanisms of hydrothermal reactions can also supply kinetic rate data as summarized in Figure 14.10. Experimental results are summarized as the first half-lives of the indicated reactions at either 250°C (top) or 300°C (bottom). Dehydration of tertiary alcohols is by far the most rapid reaction, and decarbonylation of aldehydes is the slowest in the hydrothermal experiments summarized here. Currently available information reveals that certain types of reactions exhibit wide ranges in rates that are likely tied to variations in mechanism. As an example, tertiary alcohols dehydrate faster than secondary alcohols because the primary intermediate is a carbon-centered cation, and tertiary cations are more stable than secondary cations and are therefore formed more quickly (see Bockisch et al., Reference Bockisch, Lorance, Hartnett, Shock and Gould2018). In addition, deamination of a secondary amine can be faster than deamination of a primary amine owing to a change in mechanism that is somewhat more subtle. In the case of the secondary amine, only the unimolecular substitution (SN1) reaction is involved, whereas the primary amine reacts through unimolecular (SN1) and more sluggish bimolecular (SN2) mechanisms simultaneously (see Robinson et al., Reference Robinson, Gould, Fecteau, Hartnett, Williams and Shock2019).
Approximate relative rates of hydrothermal reactions given as the logarithm of the reactions half-life (t1/2, the time to reach half of the starting reactant concentration). The reactions above the half-life timeline were performed at 250°C, while those below were performed at 300°C. a = reaction proceeds via the protonated oxygen; b = Xu and Antal (Reference Xu and Antal1994); c = Robinson et al. (Reference Robinson, Gould, Fecteau, Hartnett, Williams and Shock2019); d = for reaction with 0.05 m copper(II) chloride; e = Yang et al. (Reference Yang, Hartnett, Shock and Gould2015); f = Bockisch et al. (Reference Bockisch, Lorance, Hartnett, Shock and Gould2018); g = Fecteau et al. (Reference Fecteau, Gould, Glein, Williams, Hartnett and Shock2019); h = for reaction at 0.1 m; i = Glein et al. (Reference Glein, Gould, Lorance, Hartnett and Shock2019); j = Yang et al. (Reference Yang, Gould, Williams, Hartnett and Shock2012); k = Palmer and Drummond (Reference Palmer and Drummond1986).
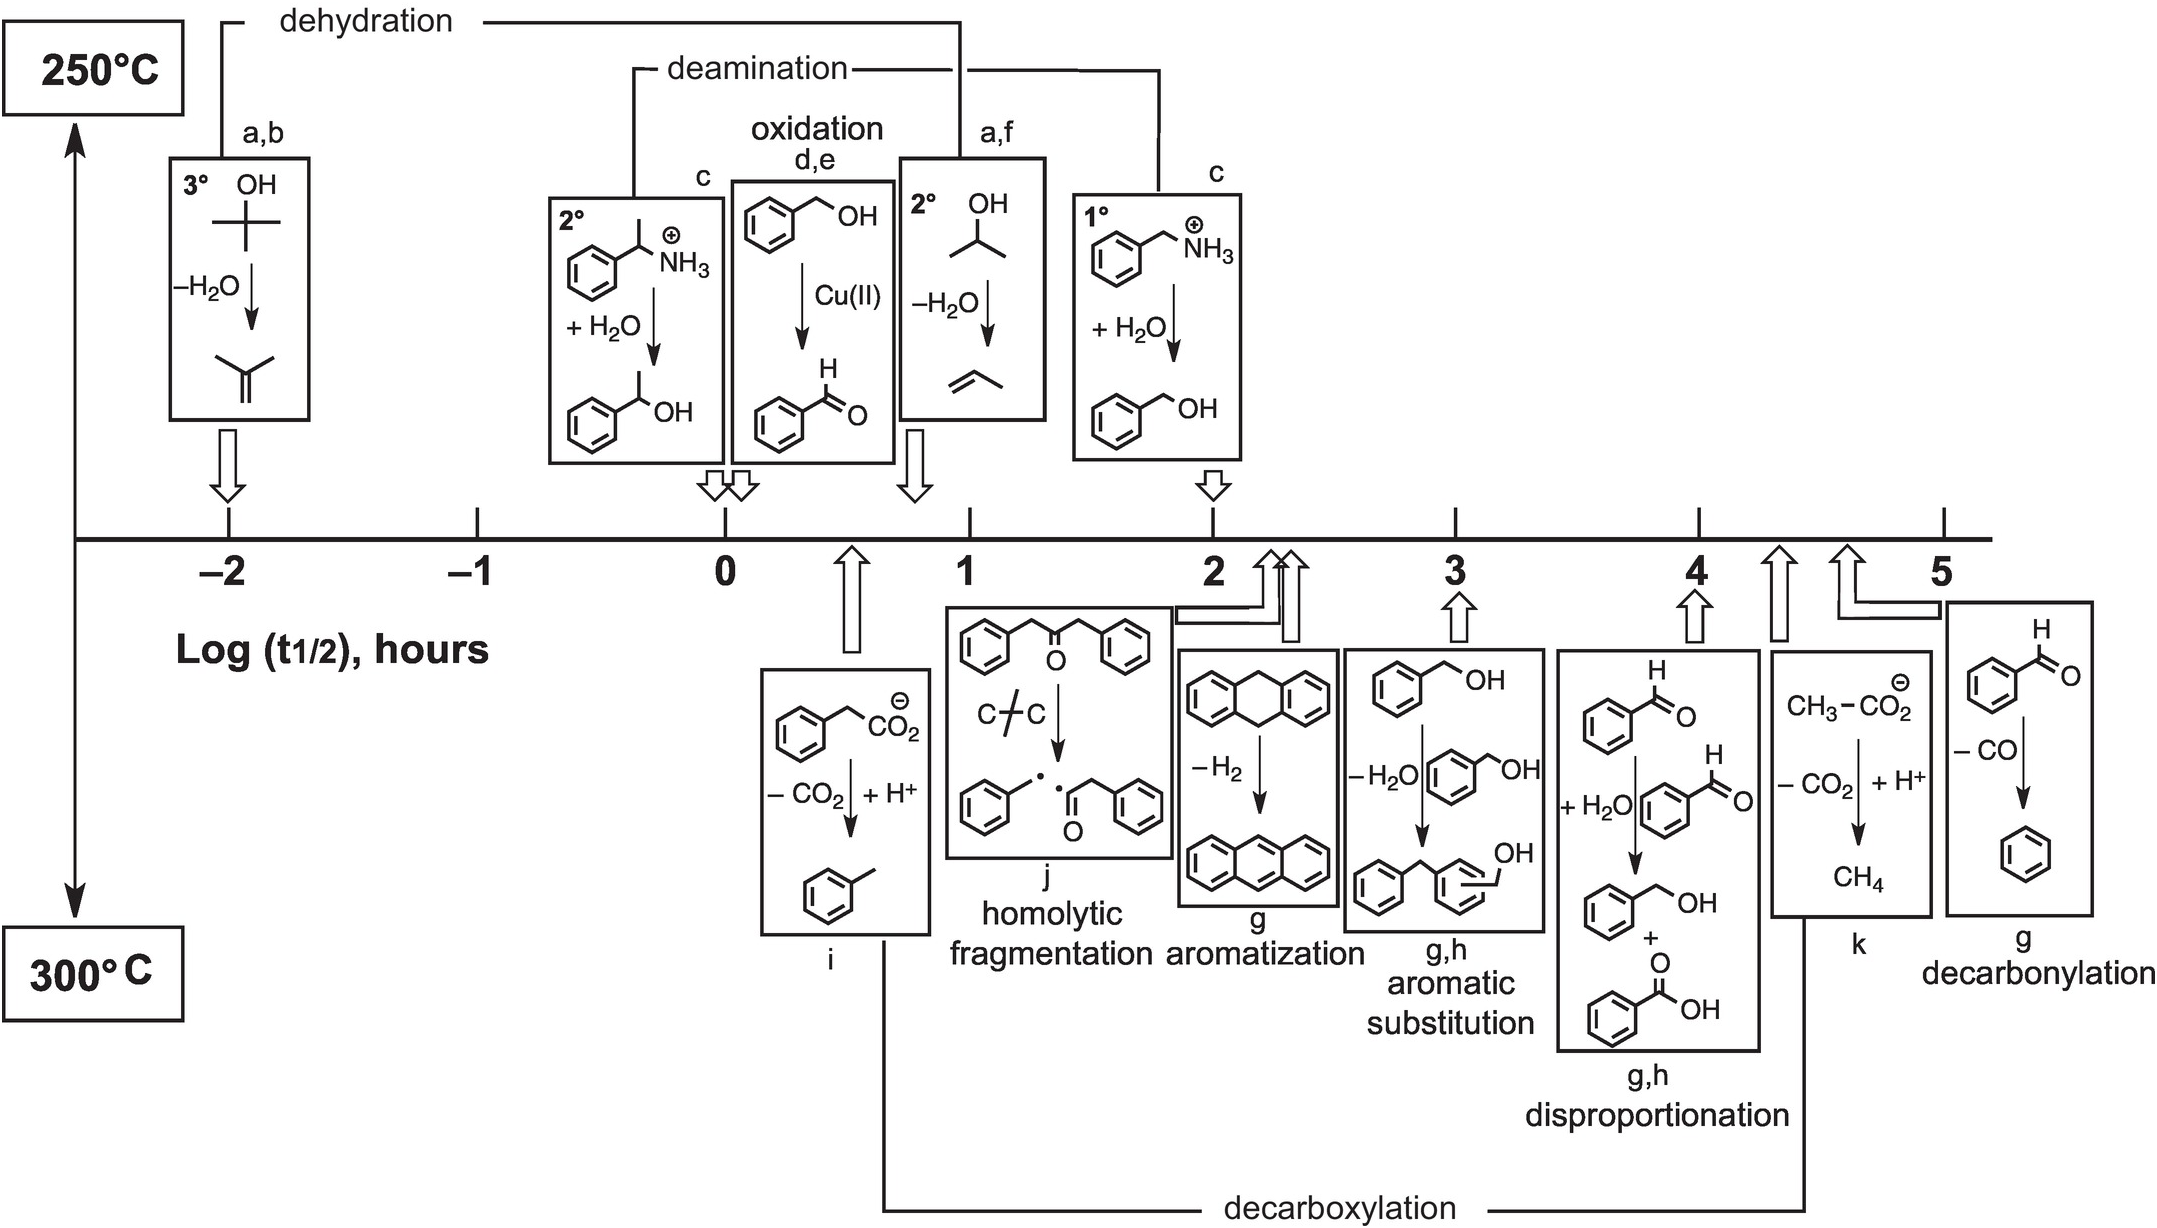
While Figure 14.10 serves to summarize our current state of knowledge about hydrothermal organic transformation rates, which have underlying mechanistic explanations, it also serves as a starting point for mapping what we do not yet know. In cases where we have sufficient data, we can tell that some reactions (e.g. dehydration, de-carboxylation, deamination) can exhibit variable rates, and mechanistic explanations for those variations are possible. In other cases, data are insufficient to conclude that wide-ranging comprehension is possible. We know what rates of oxidation with Cu(II) are like, but that does not mean that we can predict what oxidation rates will be like with Au(I), Hg(II), Fe(III), Mn(III), V(V), or U(VI). Each of these elements is found to be enriched in organic-rich geologic materials, suggesting that coupled metal–organic oxidation–reduction reactions could be common geochemical processes (Gize, Reference Gize1999; Greenwood et al., Reference Greenwood, Brocks, Grice, Schwark, Jaraula, Dick and Evans2013; Shock et al., Reference Shock, Canovas, Yang, Boyer, Johnson, Robinson, Fecteau, Windman and Cox2013; Hu et al., Reference Hu, Evans, Craw, Rempel, Bourdet, Dick and Grice2015; Reference Hu, Evans, Craw, Rempel and Grice2017; Cumberland et al., Reference Cumberland, Douglas, Grice and Moreau2016), but mechanistic revelations about reactions that prevail under a given set of conditions are just beginning to be reached. Likewise, known rates of hydrothermal EASs are unlikely to be sufficient for predicting rates of transitions from lignin to coal to anthracite that are accompanied by increasing temperatures and pressures in sedimentary basins. Nevertheless, the results currently available and the experimental techniques that allow mechanistic insight set the stage for a rapid expansion of knowledge about how Earth operates as an organic chemist.
14.9 Organic Reactions in the Deep Carbon Cycle
We may ask: How relevant are the results summarized above, and the chemistry of organic compounds in general, to the large-scale deep carbon cycle? The experiments described here were performed at pressures that are typical of shallow crustal pressures, yet conditions at higher pressures, such as those encountered in subduction zones, may drive similar reaction pathways. In support of this suggestion, Huang et al. (Reference Huang, Daniel, Cardon, Montagnac and Sverjensky2017) report the results of experiments at 300°C and much higher pressures (from 2.4 to 3.5 GPa) using a diamond anvil cell in which the organic compound isobutane was formed from aqueous sodium acetate. Solid Na2CO3 was another product of this reaction, suggesting an overall disproportionation reaction occurs, related to those described in Section 14.8, in which the carbon that is initially present in acetate is both reduced to isobutane and oxidized to carbonate. Huang et al. (Reference Huang, Daniel, Cardon, Montagnac and Sverjensky2017) also found that the newly generated isobutane formed an immiscible hydrocarbon liquid phase that coexisted with minerals at their experimental conditions, and they go on to suggest that hydrocarbon fluids may be part of subduction-zone assemblages.
Evidence that organic compounds, including hydrocarbons, exist and survive at temperatures and pressures that are much more extreme than those of the experiments above is documented by the extraction of organic compounds from metamorphic and intrusive rocks (Salvi and Williams-Jones, Reference Salvi and Williams-Jones1997; Reference Salvi and Williams-Jones2006; Price and DeWitt, Reference Price and DeWitt2001; Taran and Giggenbach, Reference Taran, Giggenbach, Simmons and Graham2003; Krumrei et al., Reference Krumrei, Pernicka, Kaliwoda and Markl2007; Sawada et al., Reference Sawada, Sampei, Hada and Taguchi2008; Nivin, Reference Nivin2011; Potter et al., Reference Potter, Salvi and Longstaffe2013) and by indications of organic contributions to carbon budgets in rocks associated with subduction (Alt et al., Reference Alt, Garrido, Shanks, Turchyn, Padrón-Navarta, Sánchez-Vizcaíno, Goméz Pugnaire and Marchesi2012a; Reference Alt, Shanks, Crispini, Gaggero, Schwarzenbach, Früh-Green and Bernasconi2012b; Reference Alt, Schwarzenbach, Früh-Green, Shanks, Bernasconi, Garrido, Crispini, Gaggero, Padrón-Navarta and Marchesi2013; Clift, Reference Clift2017). Nevertheless, characterization of the types of organic compounds, specifically which functional groups dominate, is extremely limited at present. This kind of information will first be required in order to take advantage of the mechanistic information more easily obtained at lower temperatures and pressures. Mechanistic information will be essential to understanding, for example, which compositions of functional groups and which reactions are sluggish enough to preserve organic compounds under these conditions.
Existing high-pressure/temperature techniques, including but not limited to diamond anvil cell experiments, make it possible to test mechanistic hypotheses and will permit quantitative extrapolations of reaction rates to extreme conditions. Specifically, focusing on reactions through which biomarker compounds can be transformed would lead to an enriched interpretation of the geologic history of geochemical transformations following the incorporation of biomolecules into geologic materials. It is possible to imagine a time in the future when knowing which functional groups dominate compositional mixtures of organic material in geologic samples and what their dominant reactions, mechanisms, and kinetics are could be used to deduce the physical conditions and durations of geologic processes in ways that are complementary to better developed methods involving radiogenic isotopes. We hope that this review points the way to further experiments that will enable such possibilities.
14.10 Geomimicry as a New Paradigm for Green Chemistry
A major goal of chemistry has always been the controlled transformation of materials. Attaining that goal is a primary focus of organic chemistry, which has both blessed and cursed the world with new products that can save lives or cause pollution and disease. Meanwhile, Earth functions as a consummate organic chemist conducting an enormous range of chemical reactions involving organic compounds in aqueous solution without using toxic reagents, expensive noble metal catalysts, or extreme oxidants, reductants, or concentrated acids. Benchtop organic chemists have spent decades developing the techniques and tools to make these reactions faster or more specific, but ultimately, nearly every reaction imaginable in the lab also occurs at natural geochemical conditions.
As summarized above, hydrothermal organic transformations occur at moderately elevated temperatures and pressures. The properties of hydrothermal water enable organic chemistry. Its dielectric constant is substantially lower, mimicking organic solvents, and its extent of dissociation into hydronium and hydroxide is greater, promoting both acid- and base-catalyzed reactions. Thus, hydrothermal water can act as a solvent, a reagent, and a catalyst. In addition, virtually all hydrothermal chemistry takes place in the presence of solid-phase minerals, whose surfaces can also act as reagents and heterogeneous catalysts.
The emerging topic of geomimicry seeks answers to the practical questions: How does Earth perform chemistry? And how can we learn from it? By capitalizing on reaction chemistries and mechanisms informed by geologic processes and enabled under hydrothermal conditions, reactions can be promoted that use less toxic and more abundant natural materials. Hydrothermal chemistry offers new reaction pathways toward sustainable fuel production to reduce our dependence on fossil carbon. As we learn to control hydrothermal reactions, new capabilities in reaction selectivity could revitalize fine chemical production. Most importantly, geomimicry offers a paradigm shift for green chemistry toward altogether new processes that will not pollute because they are already Earth’s ways of doing organic chemistry.
Questions for the Classroom
1 Discuss the preservation potential of biomarker molecules in geologic materials if they are surrounded by silica versus if they are surrounded by hematite. Propose a set of relevant reactions using your choice of biomarkers.
2 Rank hydrothermal organic reactions in terms of their potential to be affected by a stainless steel reaction vessel used in experiments.
3 What would be the effect of conducting the same reactions at the same temperature and pressure in the presence of a PPM assemblage?
4 The maturation of buried organic matter such as kerogen over geologic timescales involves decreases in the abundances of hydrogen, nitrogen, and oxygen relative to carbon in the kerogen structure. Write some mechanistically plausible reactions that could lead to kerogen maturation.
5 Use Figure 14.9 to argue how organic reactions may differ during burial of pelagic sediment, continental-derived sediment, altered mid-ocean ridge basalt, and altered peridotite.
6 Rate data in Figure 14.10 are for either 250°C or 300°C, but not both. Propose additional experiments that would expand our understanding of the temperature dependence of these rates, making the case for your choice of reactions using geologic conditions and processes on Earth and other ocean worlds of the solar system.
7 Using the results summarized in Figures 14.9 and 14.10, predict the fate of compounds in organic-rich sedimentary rocks during episodes of tectonic uplift.
8 Use the SUPCRT or CHNOSZ codes to evaluate equilibrium constants for the dehydration of an alcohol to the corresponding alkene and show how the dehydration reaction is affected by changes in temperature and pressure. Now couple the dehydration of the alcohol to a mineral hydration reaction of your choice and assess the combined fate of organic and mineral transformations.
9 Changes in pH can have dramatic effects on the mechanisms of organic reactions in Earth. How and why would changes in pH influence the transformation of a long-chain alcohol, an amino acid, and a membrane lipid?
10 What model organic compounds would you predict to be present under CO2 ice on Mars and what products would you expect during heating from a meteorite impact?


 Open access