





Introduction
Bark beetles (Coleoptera: Curculionidae: Scolytinae) comprise a diverse group of insects that primarily feed upon the nutrient-rich phloem (i.e., phloeophagy) of trees. To date, more than 6000 scolytine species have been described in association with numerous tree species (Bright Reference Bright1976; Wood Reference Wood1982; Kirkendall et al. Reference Kirkendall, Biedermann, Jordal, Vega and Hofstetter2015). Within this diverse group, fewer than 1% of species, notably of the genera Dendroctonus Erichson and Ips De Geer, are known to routinely kill trees and occasionally undergo population irruptions that may impact many thousands of hectares of forest (Christiansen and Bakke Reference Christiansen, Bakke and Berryman1988; Kirkendall et al. Reference Kirkendall, Biedermann, Jordal, Vega and Hofstetter2015; Raffa et al. Reference Raffa, Aukema, Bentz, Carroll, Hicke, Kolb, Björkman and Niemelä2015; Kautz et al. Reference Kautz, Meddens, Hall and Arneth2017). Curiously, widespread landscape-scale outbreaks are primarily associated with species of conifer-infesting bark beetles when, in fact, most bark beetle species are associated with angiosperm hosts (Kirkendall et al. Reference Kirkendall, Biedermann, Jordal, Vega and Hofstetter2015). Likely due to their comparatively low irruptive potential, angiosperm-infesting bark beetles remain less studied than their conifer-infesting counterparts.
The mechanisms of conifer defence against bark beetle attack have been thoroughly investigated due to the considerable economic and ecological impacts associated with outbreaks. Conifer trees generally rely upon both constitutive and induced resinosis to resist bark beetle attacks. This is a critical process whereby terpenoid-containing oleoresin that comprises a blend of isoprenoid-derived compounds is exuded at the site of attack (Trapp and Croteau Reference Trapp and Croteau2001; Raffa et al. Reference Raffa, Aukema, Erbilgin, Klepzig and Wallin2005). Oleoresin is composed of mono-, sesqui-, and di-terpenes that act synergistically, first to physically repel and intoxicate invading bark beetles, and as the volatile mono- and sesqui-terpenoids dissipate, a hardened, protective pitch plug is formed at the attack site (Trapp and Croteau Reference Trapp and Croteau2001). Conversely, little is known of angiosperm secondary metabolites involved in defence against bark beetles. Angiosperm and conifer trees share many of the same families of defence compounds, including terpenoids, tannins, and phenolics (Wink Reference Wink2008). Most angiosperms, however, lack resin ducts (Cabrita Reference Cabrita, Ramawat, Ekiert and Goyal2019) and therefore may not rely as heavily on terpenoid-containing oleoresin for resistance against subcortical insects. The angiosperms have highly diversified secondary metabolites, such as cardenolides, alkaloids, and certain specialised phenolics (including diarylheptanoids and salicinoids) that are rarely or have yet to be observed in gymnosperms (Wink Reference Wink2008; Lv and She Reference Lv and She2010; Mithöfer and Boland Reference Mithöfer and Boland2012; Kaufman et al. Reference Kaufman, You, Fox and Mansfield2025). In poplar, Populus spp. (Salicaceae), the major class of secondary metabolites active against folivores is the phenolics, which range from specialised compounds such as the salicinoids to more ubiquitous compounds such as condensed tannins and lignin (Philippe and Bohlmann Reference Philippe and Bohlmann2007; Boeckler et al. Reference Boeckler, Gershenzon and Unsicker2011; Kaufman et al. Reference Kaufman, You, Fox and Mansfield2025). Phenolics, although less well characterised as bark beetle anti-feedants than terpenoids are, have been demonstrated to inhibit tunnelling of bark beetles and to slow growth of their fungal symbionts in conifers (Hammerbacher et al. Reference Hammerbacher, Kandasamy, Ullah, Schmidt, Wright and Gershenzon2019). There is a great need to close the knowledge gap of hardwood chemical defences against subcortical insects, particularly in the context of intensifying climate change–induced tree stress and ongoing spread of nonnative scolytines (Ploetz et al. Reference Ploetz, Hulcr, Wingfield and de Beer2013; Raffa et al. Reference Raffa, Aukema, Bentz, Carroll, Hicke, Kolb, Björkman and Niemelä2015).
In the Pacific Northwest of North America, red alder, Alnus rubra Bongard (Betulaceae), is a common hardwood tree species (Harrington et al. Reference Harrington, Deal and Harrington2006). The alder bark beetle, Alniphagus aspericollis (LeConte), infests and often kills red alder throughout its geographical range (Chamberlin Reference Chamberlin1958; Borden Reference Borden1969; Wertman et al. Reference Wertman, Hamelin and Carroll2025). The alder bark beetle is distinct from other bark beetle species in that it lives in symbiosis with a non-ophiostomatoid (Ascomycota: Ophiostomatales and Microascales) fungus, Neonectria bordenii Tanney (Ascomycota: Hypocreales) (Lee et al. Reference Lee, Wertman, Carroll and Hamelin2023; Wertman et al. Reference Wertman, Tanney, Hamelin and Carroll2024; Wertman et al. Reference Wertman, Hamelin and Carroll2025). High-density alder bark beetle populations have been implicated as a major cause of recent red alder mortality in southwestern British Columbia, Canada (Wertman Reference Wertman2024; Wertman et al. Reference Wertman, Hamelin and Carroll2025). Understanding the biochemical defences of red alder may help to elucidate mitigating factors for its apparent decline in the region and provide important insight into the mechanisms of angiosperm resistance to bark beetles.
Previous studies investigating red alder defence against insect herbivory have focused mainly on foliar chemical content, specifically on the most prevalent phenolic compound in red alder, oregonin. Oregonin is a diarylheptanoid xyloside, a polyphenolic product that occurs in red alder leaves and bark at concentrations of 4–9% (Karchesy Reference Karchesy1975; Lea et al. Reference Lea, Bradbury and Constabel2021). The exact biochemical pathway of oregonin biosynthesis is unknown, but another diarylheptanoid, curcumin, is known to be produced via the phenylpropanoid pathway (Kita et al. Reference Kita, Imai, Sawada, Kumagai and Seto2008). The function of oregonin in red alder is thought to be anti-herbivory (Jackrel and Morton Reference Jackrel and Morton2018; Boateng et al. Reference Boateng, Hawkins, Constabel, Yanchuk and Fellenberg2020), although its role in defence against subcortical insects such as bark beetles has never been investigated. Boateng et al. (Reference Boateng, Hawkins, Constabel, Yanchuk and Fellenberg2020) found a negative correlation between western tent caterpillar, Malacosoma californicum Packard (Lepidoptera: Lassiocampidae), leaf consumption and elevated oregonin content. Oregonin has also been explored for its antimicrobial (Choi Reference Choi, Lee, Choi, Kim, Kang and Lee2012; Abedini et al. Reference Abedini, Chollet, Angelis, Borie, Nuzillard and Skaltsounis2016) properties. Collectively, these studies suggest that oregonin may have anti-feedant and antimicrobial defence functions against nonfolivorous invading organisms in red alder, such as the alder bark beetle and its microbial symbiont, N. bordenii. Considering the anti-herbivory and antimicrobial activities of oregonin, we hypothesised that oregonin is an anti-phloeophagy compound in red alder and evaluated the prediction that red alders that are successfully colonised by alder bark beetles (i.e., yielding beetle offspring) have lower oregonin concentrations than those of unattacked trees and of trees that resist colonisation.
Methods
Study sites and sample collection
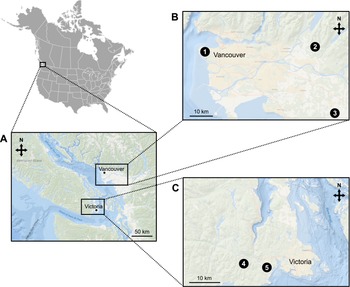
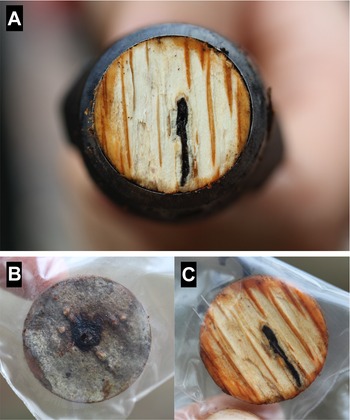
Phloem was sampled from trees at five sites across the Lower Mainland and southern Vancouver Island, British Columbia, Canada (Fig. 1) in June 2021, using the methods of Wertman et al. (Reference Wertman, Hamelin and Carroll2025). All sites were dominated by mature red alders and hosted ongoing alder bark beetle infestations. Red alders that had been recently attacked by alder bark beetles (i.e., in spring 2021) were selected from within each site for phloem sampling. Three arch punch samples were taken from each attacked tree: two punches each centred around a beetle entrance hole (sample) and one from an unattacked region of phloem (control; Fig. 2). Sample trees were later (in 2022) classified as resistant to beetle colonisation or as brood (= beetle offspring) production trees, based on the total number of emergence holes combined across two predetermined 15 × 15-cm bark regions on the north and south sides of each tree (≤ 3 emergence holes = resistant tree, > 3 emergence holes = brood production tree; threshold from Wertman et al. Reference Wertman, Hamelin and Carroll2025). The mean ± standard error number of emergence holes per resistant tree was 0.5 ± 0.2 compared to 34.8 ± 8.0 per brood production tree. One phloem punch was also taken from each of five apparently healthy (i.e., with full, green crowns and no evidence of beetle attack) control trees per site. Bark surfaces and arch punches were cleaned with 70% ethanol before each collection. Three trees of each colonisation status (resistant, brood production, and control) were randomly selected from each site, and two arch punches, one sample, and one control from each resistant and brood production tree were randomly selected for processing; one punch was randomly selected from each control tree. For sites for which three trees of each colonisation status were not identified for sampling, punches from two trees were processed (Table 1). A very small proportion (4%, 3/71) of phloem punches had evidence of larval mining (one attacked and two unattacked control punches, each from a different brood production tree). The diameter at breast height of all trees evaluated for oregonin content across sites was 25.0 ± 1.3 cm.
A, Location of study sites in B, the Lower Mainland and C, southern Vancouver Island, British Columbia, Canada: 1, Pacific Spirit Regional Park; 2, Malcolm Knapp Research Forest; 3, Aldergrove Regional Park; 4, Greater Victoria Water Supply Area; and 5, Royal Roads University campus. Figure is adapted from Wertman et al. (Reference Wertman, Hamelin and Carroll2025).

Figure 1. Long description
The map displays the geographic locations of study sites in the Lower Mainland and southern Vancouver Island, British Columbia, Canada. The map includes five specific study sites: Pacific Spirit Regional Park, Malcolm Knapp Research Forest, Aldergrove Regional Park, Greater Victoria Water Supply Area, and Royal Roads University campus. Each site is marked with a numbered label. The map also shows the broader context of these locations within British Columbia, highlighting major cities such as Vancouver and Victoria. The map is adapted from Wertman et al. (2025).
A, Example of a phloem punch, centred around an alder bark beetle, Alniphagus aspericollis, entrance hole, upon removal from a beetle-attacked red alder, Alnus rubra, tree; B, frontside and C, backside of the sample punch shown inside a collection bag.

Figure 2. Long description
The image consists of three parts: a close-up view of a phloem punch centered around an alder bark beetle entrance hole in a red alder tree, and the front and back sides of the sample punch shown inside a collection bag. The phloem punch reveals the inner bark of the tree, with visible markings and a central hole made by the beetle. The front side of the sample punch appears dark and textured, while the back side shows a lighter, more detailed pattern with distinct lines and a central dark mark.
Number of red alder, Alnus rubra, trees from which phloem was sampled for assessment of oregonin content. Trees of different alder bark beetle, Alniphagus aspericollis, colonisation status (brood production (i.e., successfully colonised) trees, resistant (i.e., no colonisation) trees, and unattacked (control) trees) were sampled at each of five sites across southwestern British Columbia, Canada. Two samples, each from an attacked region of phloem (sample punch) or from an unattacked region (control punch), were randomly selected from three brood production and three resistant trees per site for analysis, with the exception of Aldergrove Regional Park and the Greater Victoria Water Supply Area, where only two brood production trees and two resistant trees were sampled, respectively. One punch was randomly selected from each of three control trees per site. All samples were obtained from west- or east-facing bark.

Sample processing
Phloem samples were transported on ice to the laboratory at the University of British Columbia, Vancouver, British Columbia, where they were initially held at approximately 4 °C for up to 10 days before being transferred to –80 °C, where they were stored until processing. From a total of 190 samples collected from 76 trees, 73 trees were assigned a colonisation status; we were unable to assign colonisation status to three trees due to their deterioration (Table 1). After sample selection as described above, 71 phloem samples collected from 43 trees were processed for an assessment of oregonin content. Each frozen sample was ground with a Black and Decker CBG100SC stainless steel coffee grinder (Black and Decker, New Britain, Connecticut, United States of America), placed in aluminium foil, and freeze-dried overnight in a Freezone 2.5 Freeze Dryer (LabConco, Kansas City, Missouri, United States of America) at –50 °C. The freeze-dried phloem samples were homogenised using a HG-600 Geno/Grinder® 2010 Homogenizer and Cell Lyser (Cole Palmer, Vernon Hills, Illinois, United States of America) until a fine powder resulted. Fifty milligrams of each homogenised sample was then extracted with 1 mL high-performance liquid chromatography–grade methanol, vortexed, and incubated at 40 °C for 4 hours. The samples were centrifuged at 5000 rpm for two minutes, and for each sample, the supernatant was transferred into a fresh 1.7-mL microcentrifuge tube. The supernatant of each sample was further diluted by a factor of 30 and filtered using a 0.45-μm filter into a high-performance liquid chromatography vial. A standard curve was prepared using serial dilutions of 1 mg (≥ 95% purity) oregonin obtained from Sigma-Aldrich (SMB00088; Sigma-Aldrich, St. Louis, Missouri, United States of America).
Ultra high-performance liquid chromatography analysis
Ultra high-performance liquid chromatography–diode array detection analyses were conducted using an Agilent 1290 Infinity II system (Agilent, Santa Clara, California, United States of America) equipped with a ZORBAX EclipsePlusC18 RRHD column (Agilent). Data acquisition, instrument control, and peak analysis were performed using Agilent OpenLab CDS, version 3.2. Samples were eluted with a 20-minute two-stage mobile phase gradient, using 0.1% trifluoroacetic acid (TFA) in water (Solvent A) and 0.1% TFA in acetonitrile (Solvent B), with a flow rate of 0.250 mL/minute and an injection volume of 8 µL at 30 °C. Solvent B started at 2% and increased to 5% in the first two minutes, then increased to 25% at eight minutes, and finally gradually increased to 75% until minute 17. Solvent B was decreased to 10% at 17.5 minutes and then to 0% until the end of the run (20 minutes). Absorbance was read at 280 nm.
Statistical analyses
The oregonin content of each sample was calculated based on the oregonin standard curve. Oregonin content data analyses were performed in RStudio, version 2023.12.1, using R, version 4.3.3 (Posit Team 2024; R Core Team 2024). Two linear mixed-effects models were generated to test whether oregonin content varied among phloem samples from trees of different colonisation status (brood production, resistant, and control). The first model tested the effects of tree status (brood production and resistant only), punch type (sample and control), and the interaction of tree status and punch type on oregonin content. Site was included as a random factor in this model to account for site-to-site variability, and tree was included as a nested factor within site to accommodate repeated measures from the same trees. The second model evaluated the effect of tree status (brood production, resistant, and control) on oregonin content of control punches only, while also incorporating site as a random factor. A Tukey post-hoc comparison was conducted for this model using the multcomp package, version 1.4.25 (Hothorn et al. Reference Hothorn, Bretz and Westfall2008), to test for significant differences in oregonin content among the three tree statuses. The mixed models were developed via the lme4 package, version 1.1.35.1 (Bates et al. Reference Bates, Mächler, Bolker and Walker2015), and associated analysis of variance tables were produced using the lmerTest package, version 3.1.3 (Kuznetsova et al. Reference Kuznetsova, Brockhoff and Christensen2017). Data were visualised using the ggplot2 package, version 3.5.0 (Wickham Reference Wickham2016).
Results
Phloem oregonin content ranged from 0.014% to 6.1% w/w (Fig. 3), with oregonin being present in all samples. The average oregonin content across all samples was 2.9 ± 0.17% w/w (mean ± standard error). Our first model revealed that phloem from resistant trees contained significantly more oregonin than did phloem from brood production trees (tree status F 1,21.91 = 4.63, P < 0.05; Fig. 4). Resistant trees, on average, had 38% higher oregonin content (3.2 ± 0.23% w/w) compared to that found in brood production trees (2.3 ± 0.28% w/w). Although neither punch type nor the interaction between tree colonisation status and punch type was significant in this model (Table 2), the interaction term approached significance (F 1,26.00 = 3.71, P = 0.06), such that the effect of tree status on phloem oregonin content was nearly dependent on punch type. Resistant trees showed marginally higher phloem oregonin levels in control (unattacked) than sample (attacked) punches, whereas the oregonin content of brood production trees was more consistent between punch types (Fig. 5). The amount of variation explained by the random effect of site in this model was 9%, as determined by the intraclass correlation constant (ICC = 0.090), and the nested effect of tree within site affected the model to a greater extent, as expected (ICC = 0.268). The total ICC (35.8%) validates the addition of site and tree nested within site to maintain the assumption of sample independence. Our second model, which included all three tree colonisation statuses but only one punch type (control), also showed a significant effect of tree status (brood production, resistant, and unattacked control) on phloem oregonin content (F 2,40 = 4.66, P < 0.05). Control (3.7 ± 0.37% w/w) and resistant (3.7 ± 0.32% w/w) trees had approximately 65% higher mean control punch phloem oregonin content compared to that found in brood production trees (2.2% ± 0.46% w/w; Fig. 6). There was no influence of the random effect of site in this model (ICC = 0).
Bar chart illustrating the phloem oregonin concentration (%) of all examined phloem samples (n = 71) isolated from red alder, Alnus rubra, trees attacked (brood production and resistant trees) and not attacked (control trees) by alder bark beetles, Alniphagus aspericollis (n = 43 trees total). Each bar represents a single sample, with samples ranked from lowest to highest oregonin concentration along the x-axis. The horizontal red dashed line shows the mean concentration across samples (2.9% w/w). Phloem samples were obtained from five field sites across southwestern British Columbia, Canada.

Figure 3. Long description
A histogram showing the percentage of oregonin in phloem samples from red alder trees. The x-axis represents individual samples ranked from lowest to highest oregonin concentration, with a total of 71 samples. The y-axis indicates the percentage of oregonin, ranging from 0 to 6 percent. Each bar represents a single sample, and the bars are vertical. A red dashed horizontal line marks the mean oregonin concentration across all samples, which is 2.9 percent. The distribution of oregonin concentrations increases progressively from left to right, with no significant gaps or outliers. The data are continuous.
Box and whisker plot (in the style of Tukey) showing phloem oregonin concentration (%) of samples (n = 56) from red alder, Alnus rubra, trees (n = 28) of two alder bark beetle, Alniphagus aspericollis, colonisation status (brood production (n = 14) and resistant (n = 14)). One alder bark beetle–attacked sample punch and one control (i.e., unattacked region of phloem) punch were analysed per tree. Phloem was obtained from trees at five locations throughout southwestern British Columbia, Canada. Lines show median values, boxes represent the interquartile ranges, and whiskers extend to maximum and minimum values that are within 1.5× the interquartile range. Letters “a” and “b” reveal where, according to type III analysis of variance of a linear mixed-effects model, oregonin content differed significantly (P < 0.05) between trees of the two colonisation statuses.
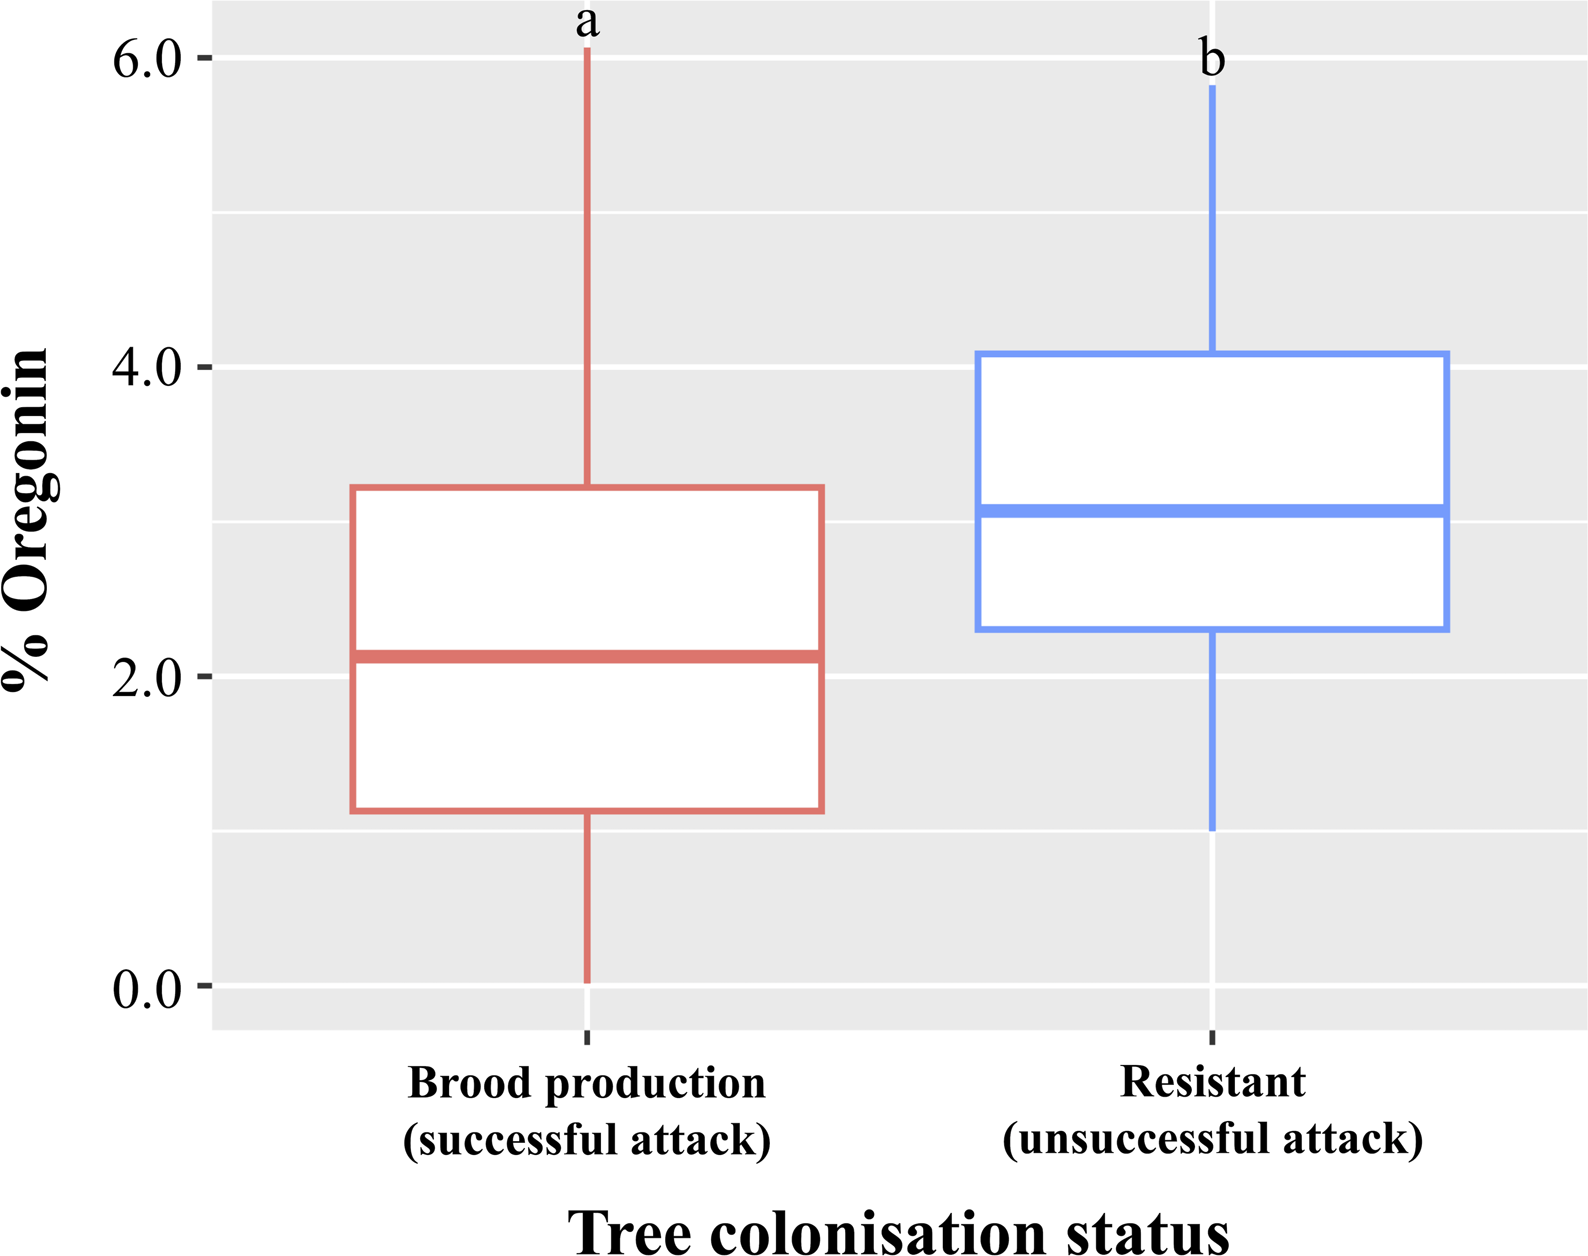
Figure 4. Long description
A vertical box-and-whisker plot compares the phloem oregonin concentration percentage in red alder trees with two different colonization statuses: brood production and resistant. The x-axis represents the tree colonization status, with two categories: brood production indicating successful attack and resistant indicating unsuccessful attack. The y-axis represents the percentage of oregonin, ranging from 0.0 to 6.0 percent. The plot includes two box plots, one for each colonization status. The box plot for brood production shows a median value around 2.0 percent, with the interquartile range extending from approximately 1.0 to 3.0 percent. The whiskers extend to the maximum and minimum values within 1.5 times the interquartile range. The box plot for resistant trees shows a median value around 3.0 percent, with the interquartile range extending from approximately 2.0 to 4.0 percent. The whiskers also extend to the maximum and minimum values within 1.5 times the interquartile range. The letters ‘a’ and ‘b’ above the box plots indicate significant differences in oregonin content between the two colonization statuses, with P < 0.05 according to type III analysis of variance of a linear mixed-effects model.
Box and whisker plot (in the style of Tukey) showing phloem oregonin concentration (%) of samples (n = 56) from red alder, Alnus rubra, trees (n = 28). Phloem samples were obtained from trees of two alder bark beetle, Alniphagus aspericollis, colonisation status (brood production (n = 14) and resistant (n = 14)). Concentrations are shown for phloem removed from bark regions that were attacked (sample punches) and not attacked (control punches) by alder bark beetles, with one of each punch type analysed per tree. Sampling occurred at five locations throughout southwestern British Columbia, Canada. Lines indicate median values, boxes show the interquartile ranges, and whiskers extend to maximum and minimum values that are within 1.5× the interquartile range.
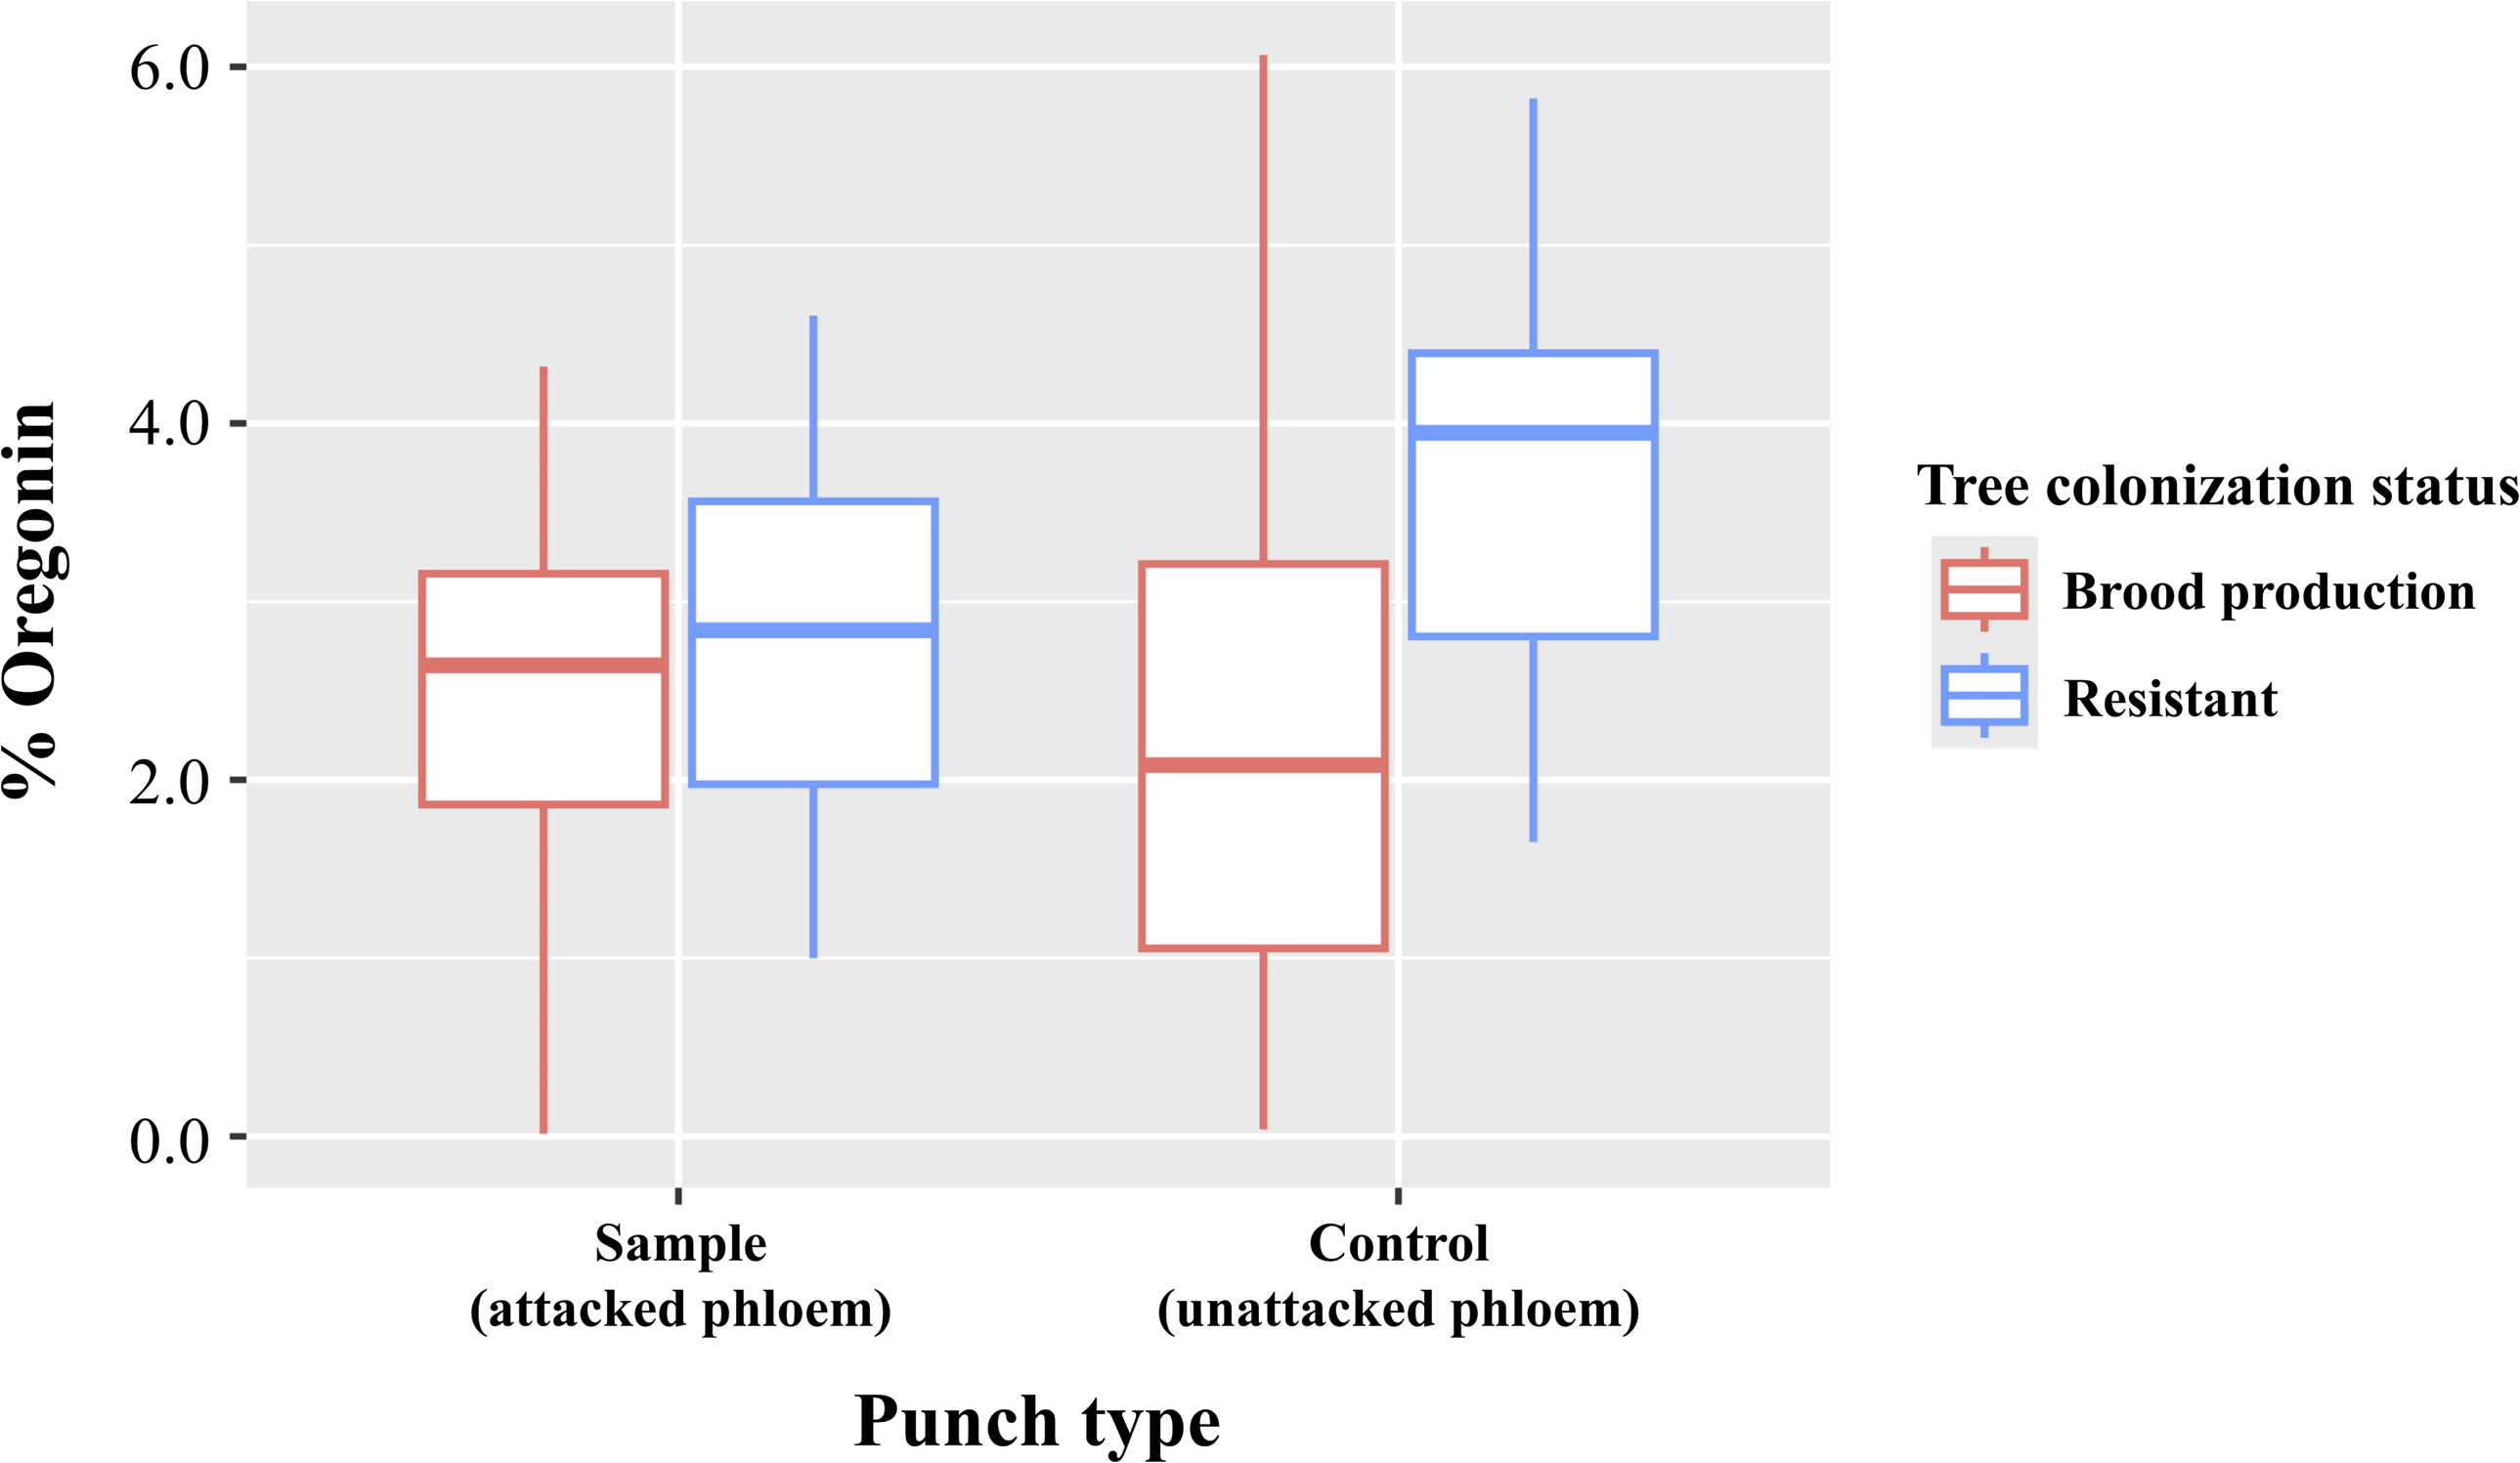
Figure 5. Long description
A box-and-whisker plot in the style of Tukey showing phloem oregonin concentration percentage of samples from red alder trees. The plot compares phloem samples from trees of two alder bark beetle colonization statuses: brood production and resistant. Concentrations are shown for phloem removed from bark regions that were attacked (sample punches) and not attacked (control punches) by alder bark beetles, with one of each punch type analyzed per tree. The x-axis represents the punch type, divided into sample (attacked phloem) and control (unattacked phloem). The y-axis represents the percentage of oregonin. The plot includes two box plots for each punch type, one for brood production (in red) and one for resistant (in blue). Each box plot shows the median value, interquartile range, and whiskers extending to maximum and minimum values within 1.5 times the interquartile range. The brood production box plots show median values around 2.5 per cent for both sample and control punches, with interquartile ranges approximately from 1.5 to 3.5 per cent. The resistant box plots show median values around 3 percent for sample punches and 4 percent for control punches, with interquartile ranges approximately from 2 to 4 per cent for sample punches and 3 to 5 percent for control punches. The whiskers extend to maximum values around 4.5 per cent for brood production sample punches, 5 percent for brood production control punches, 5 per cent for resistant sample punches, and 6 per cent for resistant control punches. The minimum values are around 1 percent for brood production sample punches, 0.5 per cent for brood production control punches, 1 percent for resistant sample punches, and 2 per cent for resistant control punches.
Box and whisker plot (in the style of Tukey) showing oregonin concentration (%) of control phloem (i.e., unattacked region of phloem; n = 43, one punch per tree) from red alder, Alnus rubra, trees of all three colonisation statuses (brood production (n = 14), resistant (n = 14), and control (n = 15)). Both resistant and brood production trees were attacked by alder bark beetles, Alniphagus aspericollis, whereas control trees were apparently healthy (i.e., with full crowns and no evidence of beetle attack). Phloem sampling occurred at five sites across southwestern British Columbia, Canada. Lines indicate median values, boxes represent interquartile ranges, and upper and bottom whiskers extend to maximum and minimum values that are within 1.5× the interquartile range. Letters “a” and “b” reveal where, according to Tukey’s honestly significant difference post-hoc comparison of means (based on a linear mixed-effects model), oregonin content did and did not differ significantly (P < 0.05) between trees of different status.

Figure 6. Long description
A vertical box-and-whisker plot compares the percentage of oregonin in the phloem of red alder trees with three different colonization statuses: brood production, resistant, and control. The x-axis represents the tree colonization status, categorized into brood production, resistant, and control. The y-axis represents the percentage of oregonin, ranging from 0.0 to 6.0 percent. The plot includes three box plots, each representing a different colonization status. The brood production box plot, colored red, shows a median value around 2.0 percent, with an interquartile range extending from approximately 1.0 to 3.0 percent. The whiskers extend from 0.0 to 6.0 percent. The resistant box plot, colored blue, has a median value around 4.0 percent, with an interquartile range from approximately 3.0 to 4.5 percent. The whiskers extend from 2.0 to 6.0 percent. The control box plot, colored green, shows a median value around 4.0 percent, with an interquartile range from approximately 3.0 to 5.0 percent. The whiskers extend from 1.0 to 6.0 percent. Letters ‘a’ and ‘b’ indicate significant differences in oregonin content between the groups, with ‘a’ indicating a significant difference from ‘b’.
Type III analysis of variance table, using Satterthwaite’s method, showing results for a linear mixed-effects model testing the effect of tree colonisation status (brood production and resistant), phloem punch type (sample and control, from attacked and unattacked regions of phloem, respectively), and the interaction of tree status and punch type on phloem oregonin content in red alder, Alnus rubra, trees attacked by alder bark beetles, Alniphagus aspericollis. Phloem was collected across five locations in southwestern British Columbia, Canada. Sampling site and tree nested within site were included as random factors in the model. 1

Table 2. Long description
The table presents a Type III analysis of variance using Satterthwaite’s method. It includes results for a linear mixed-effects model that tests the effect of tree colonisation status (brood production and resistant), phloem punch type (sample and control), and the interaction of tree status and punch type on phloem oregonin content in red alder trees attacked by alder bark beetles. The table has four rows and five columns. The columns are labeled Variable, Numerator degrees of freedom, Denominator degrees of freedom, F-value, and P-value. The variables include Tree status, Punch type, and Tree status multiplied by punch type. Tree status has a numerator degrees of freedom of 1, a denominator degrees of freedom of 21.91, an F-value of 4.63, and a P-value of less than 0.05. Punch type has a numerator degrees of freedom of 1, a denominator degrees of freedom of 26.00, an F-value of 1.92, and a P-value of 0.18. The interaction of Tree status and punch type has a numerator degrees of freedom of 1, a denominator degrees of freedom of 26.00, an F-value of 3.71, and a P-value of 0.06. The table indicates that tree status significantly affects phloem oregonin content, while punch type and the interaction term do not have significant effects, although the interaction term approaches significance.
1 Variation explained by the random effect of site = 9.0% (intraclass correlation constant, ICC = 0.090); variation explained by the random effect of tree nested within site = 26.8% (ICC = 0.268).
Discussion
We have identified a relationship between increased red alder phloem oregonin content and resistance to alder bark beetle colonisation. Phloem oregonin content of resistant trees was comparable to that of unattacked control trees. Furthermore, the phloem oregonin content of red alders with successful alder bark beetle colonisation (i.e., reproduction; brood production trees) that were attacked and sampled alongside resistant trees was significantly lower than that of resistant and unattacked trees. Consistent with previous research that suggests red alder foliar oregonin has anti-herbivory properties, being both a deterrent and potentially toxic to insect and ungulate herbivores (González-Hernández et al. Reference González-Hernández, Starkey and Karchesy2000; Boateng et al. Reference Boateng, Hawkins, Constabel, Yanchuk and Fellenberg2020; Lea et al. Reference Lea, Bradbury and Constabel2021), our results indicate that oregonin may also act against phloeophagy by alder bark beetles. It follows that the lower phloem oregonin content of successfully colonised trees relative to that of unsuccessfully colonised and unattacked trees could lead to selection by reproductive alder bark beetles for host trees with reduced defences. Oregonin has been shown to affect palatability in other insect systems (Boateng et al. Reference Boateng, Hawkins, Constabel, Yanchuk and Fellenberg2020; Lea et al. Reference Lea, Bradbury and Constabel2021), and therefore the alder bark beetle, using gustatory cues (e.g., Hynum and Berryman Reference Hynum and Berryman1980; Raffa and Berryman Reference Raffa and Berryman1982; Byers Reference Byers, Lieutier, Day, Battisti, Grégoire and Evans2004), likely can discriminate between trees with inherently different phloem oregonin concentrations. If, as suspected, oregonin has anti-phloeophagy properties, beetles could then avoid attacking or reproducing in trees with antagonistically high levels of the compound.
An alternate, but not mutually exclusive, explanation for the lower phloem oregonin content of successfully colonised trees is degradation of oregonin by N. bordenii in the interval of time (< 3 months) between initial attack and the introduction of N. bordenii into the phloem (Wertman et al. Reference Wertman, Hamelin and Carroll2025), and sampling. Some bark beetle–vectored fungal symbionts have been shown to detoxify phenolic plant metabolites, including stilbenoids, flavonoids, and lignans within cambial tissue, which are then preferentially chosen as tunnelling media (Hammerbacher et al. Reference Hammerbacher, Schmidt, Wadke, Wright, Schneider and Bohlmann2013; Zhao et al. Reference Zhao, Kandasamy, Krokene, Chen, Gershenzon and Hammerbacher2019). Certain isolates of Neocosmospora haematococca (Berkeley and Broome) Samuels et al. (Ascomycota: Hypocreales), a confamilial to N. bordenii, have been found to possess specific cytochrome P450s that detoxify defensive isoflavonoids and isoflavonoid derivatives used in plant defence (Lucy et al. Reference Lucy, Matthews and VanEtten1988; George and VanEtten Reference George and VanEtten2001). The lower oregonin content of the successfully colonised trees could therefore be attributed to the enzymatic activity of the fungal symbiont N. bordenii upon introduction to the phloem by colonising alder bark beetles (Wertman et al. Reference Wertman, Hamelin and Carroll2025).
The average oregonin content of all phloem samples in this study (0.014–6.1%) was lower than values detected by Lea et al. (Reference Lea, Bradbury and Constabel2021) for red alder, which amounted to approximately 14–20% of mature bark tissue. The deviation between our results and those of Lea et al. (Reference Lea, Bradbury and Constabel2021), although generally less than an order of magnitude, could be attributed to several factors, including seasonal variation in oregonin content of red alder bark (Lea et al. Reference Lea, Bradbury and Constabel2021), variability related to tree genotype or sampling site, or differing extraction methods. González-Hernández et al. (Reference González-Hernández, Starkey and Karchesy2000) found decreases in oregonin content of red alder leaves throughout the growing season that corresponded to increased mammalian herbivory, illustrating seasonal fluctuations in the concentration of this potential anti-browsing compound. Ontogeny, related to tree developmental stage, could also have influenced these observed differences, as the trees sampled by Lea et al. (Reference Lea, Bradbury and Constabel2021) were 7 years old, whereas the trees sampled in our study were mature, growing within red alder stands ranging in age from 27.5 ± 2.5 years to 77.0 ± 2.0 years (Wertman et al. Reference Wertman, Tanney, Hamelin and Carroll2024). In Populus tremuloides (Salicaceae) (Donaldson et al. Reference Donaldson, Stevens, Barnhill and Lindroth2006; Cope et al. Reference Cope, Kruger, Rubert-Nason and Lindroth2019) and Betula pubescens (Betulaceae) (Wam et al. Reference Wam, Stolter and Nybakken2017), low-molecular-weight phenolic glycosides similar to oregonin were found to decrease with tree age, possibly due to reduced selective pressure from mammalian herbivores with increasing tree height.
Oregonin is a potential constitutive defence of red alder phloem that may also undergo systemic induction upon alder bark beetle attack. Our results indicate no difference in the phloem oregonin content of resistant and unattacked control trees, suggesting that oregonin was present as a potential constitutive defence but was not systemically induced upon beetle attack. These results reflect those of Jackrel and Morton (Reference Jackrel and Morton2018), who found that, although other diarylheptanoids such as oregonoyl A (which differs from oregonin by an additional p-coumaroyl moiety) were induced by simulated herbivory in red alder foliage, oregonin was not. Evaluation of the marginal interaction effect of tree colonisation status (brood production versus resistant) and punch type on phloem oregonin content, however, suggests that oregonin induction may occur systemically (i.e., in unattacked phloem regions) in trees that resist beetle colonisation. If this is true, then the effect size was likely small, and its detection may have been limited by sample size and overall high tree-to-tree variability in oregonin content, necessitating additional research on oregonin induction. The little difference in oregonin content observed between sample punches (from alder bark beetle–attacked phloem regions) and control punches (from unattacked phloem regions) removed from brood production trees further suggests that, although systemic induction may occur in resistant trees, localised oregonin induction may not occur. An alternative, but not mutually exclusive, explanation for lower oregonin content in attacked phloem compared to that in the unattacked phloem of resistant trees is increased localised oregonin oxidation in phloem immediately surrounding the area of beetle attacks.
If oregonin is a constitutive defence compound against alder bark beetle colonisation in red alder, as our findings suggest, the beetle and its N. bordenii symbiont likely exert strong selective pressures on red alder for increased phloem oregonin content. A similar process has been observed in trembling aspen ecosystems, where high tree mortality caused by ungulate herbivory led to selection against aspen genotypes low in the phenolic salicinoids, salicortin and tremulacin (Bailey et al. Reference Bailey, Schweitzer, Rehill, Irschick, Whitham and Lindroth2007). Significant differences have been found when comparing the constitutive terpenoid content of pines from populations that coevolved with the mountain pine beetle, Dendroctonus ponderosae (Coleoptera: Curculionidae: Scolytinae), with those that did not (Cudmore et al. Reference Cudmore, Björklund, Carroll and Lindgren2010; Burke et al. Reference Burke, Bohlmann and Carroll2017). Selection is thought to be relatively slow in lodgepole pine, the main host species of the mountain pine beetle, because the tree reaches sexual maturity at a young age and cones are viable long after they are shed (Cudmore et al. Reference Cudmore, Björklund, Carroll and Lindgren2010). Although red alder also reaches sexual maturity at a young age, ranging from 3 to 8 years, depending on stand characteristics, its seeds are less persistent (Harrington et al. Reference Harrington, Deal and Harrington2006), which could expedite selection for constitutive defences relative to lodgepole pine. Such selection may also occur for representatives of other classes of secondary metabolites, such as condensed tannins, that may be involved in constitutive and induced defence against invading organisms in red alder phloem.
There is a real ecological need to understand red alder chemical resistance to biotic disturbance because this early-seral nitrogen-fixing tree species (Torrey Reference Torrey1978; Harrington et al. Reference Harrington, Deal and Harrington2006) has many important functions in riparian and mixed forest ecosystems (e.g., Miller and Murray Reference Miller and Murray1978; Rothe et al. Reference Rothe, Cromack, Resh, Makineci and Son2002; Wipfli and Musslewhite Reference Wipfli and Musslewhite2004; Selmants et al. Reference Selmants, Hart, Boyle and Stark2005; Edmonds and Tuttle Reference Edmonds and Tuttle2010; Fang et al. Reference Fang, Comeau and Harper2019). Further research investigating red alder secondary metabolites and their interactions with biotic agents could prove beneficial in preserving this keystone tree species, especially if red alder mortality rates due to alder bark beetle activity are increasing, as recent observations suggest (Wertman et al. Reference Wertman, Tanney, Hamelin and Carroll2024, Reference Wertman, Hamelin and Carroll2025). Future studies should include alder bark beetle feeding trials to ascertain whether host selection is explicitly driven by phloem oregonin content, such as paired larval feeding assays with unmodified and oregonin-spiked phloem followed by assessment of beetle fitness metrics, and adult gustation tunnelling trials like those implemented by Zhao et al. (Reference Zhao, Kandasamy, Krokene, Chen, Gershenzon and Hammerbacher2019). Fungal enzyme assays could also be performed to determine if N. bordenii degrades oregonin within the phloem and thereby potentially facilitates alder bark beetle colonisation. Furthermore, a more comprehensive study evaluating multiple secondary metabolites in red alder phloem, similar to the study of Jackrel and Morton (Reference Jackrel and Morton2018), who examined red alder foliage, may reveal if red alder individuals that resist alder bark beetle colonisation have a metabolic phenotype and may allow characterisation of the metabolic timeline of red alders succumbing to colonisation by the alder bark beetle and its symbiont.
Acknowledgements
The authors thank Noah Kaufman, for interesting discussions about plant metabolites, and Kate Mitchell, for statistical support. Sampling occurred within the territories of the xʷməθkʷəy̓əm (Musqueam), q̓ic̓əy̓ (Katzie), Stó:lō, MÁLEXEȽ (Malahat), Sc’ianew, T’Sou-ke, Cowichan, and Lək̓ʷəŋən [Songhees and xʷsepsəm (Esquimalt)] peoples, with permitting provided by Metro Vancouver Regional Parks, Malcom Knapp Research Forest, the Capital Regional District, and Royal Roads University. This work was funded by Natural Sciences and Engineering Research Council of Canada (NSERC) Discovery Grants to Allan Carroll (RGPIN-2015-04376) and Shawn Mansfield (RGPIN-2017-04566).
Competing interests
The authors declare no competing interests.


 Open access

