

1. Introduction
Continent-scale orogenic belts encapsulate the history of supercontinent accretion. Subsequent exhumation, weathering and erosion of these orogens result in the deposition of sedimentary successions which preserve their geological history. The late Neoproterozoic Pan-African orogen formed during the accretion of the supercontinent Gondwana and is one of the largest orogens (Kröner and Stern Reference Kröner, Stern, Selley, Cocks and Plimer2004). This orogenic belt spans a vast expanse across many continental plates. The timespan of the Pan-African orogeny has been a subject of long debate (cf. Rino et al. Reference Rino, Kon, Sato, Maruyama, Santosh and Zhao2008; Tiwari and Biswal Reference Tiwari and Biswal2019). While some authors attribute this to 800/900–500 Ma (Biswal et al. Reference Biswal, Pradhan, Sharma, Tiwari, Beniest, Behera, Singh, Saraswati, Bhardwaj, Umasankar and Singh2022; Collins and Windley Reference Collins and Windley2002; Rino et al. Reference Rino, Kon, Sato, Maruyama, Santosh and Zhao2008; Singh et al. Reference Singh, De Waele, Karmakar, Sarkar and Biswal2010; Sommer et al. Reference Sommer, Kröner, Hauzenberger, Muhongo and Wingate2003; Tiwari and Biswal Reference Tiwari and Biswal2019), some restrict it to the major collisional events between 650 and 500 Ma (cf. Fitzsimons Reference Fitzsimons2000; Oriolo et al. Reference Oriolo, Oyhantçabal, Wemmer and Siegesmund2017). Some authors also compare the Pan-African orogeny with the Kuunga/Brasiliano and Malagasy orogeny (Rino et al. Reference Rino, Kon, Sato, Maruyama, Santosh and Zhao2008; Sen et al. Reference Sen, Pande, Sheth, Sharma, Sarkar, Dayal and Mistry2013). Although reported in Madagascar, Seychelles, Africa, South America and Australia, the Pan-African orogeny remains largely unreported from the Indian subcontinent, except for South India. In western and north-western India, Sen et al. (Reference Sen, Pande, Sheth, Sharma, Sarkar, Dayal and Mistry2013) suggest a 550–490 Ma thermal imprint based on feldspar Ar-Ar ages from the Malani volcanics, and Sharma et al. (Reference Sharma, Biswal and Chinnasamy2023) report 644–515 Ma monazite U-Pb ages in Ambaji-Deri in western India. In addition, de Wall et al. (Reference de Wall, Pandit, Sharma, Schöbel and Just2014) suggest a Cryogenian (∼760–770 Ma) tectonothermal event in NW India, proposing a continuation of late Neoproterozoic orogenic belts. Following the Pan-African Orogeny, the Cambro–Ordovician Bhimphedian (or Kurgiakh) orogeny affected the northern margin of the Indian plate at 500–400 Ma (Cawood et al. Reference Cawood, Johnson and Nemchin2007; Myrow et al. Reference Myrow, Hughes, McKenzie, Pelgay, Thomson, Haddad and Fanning2016).
While the western and north-western parts of the Indian subcontinent mainly expose Precambrian crystalline rocks and Cretaceous Deccan volcanics, locally preserved sedimentary successions of the Indian subcontinent record information on the Phanerozoic evolution of former eastern Gondwana. Among the Phanerozoic basins, the Mesozoic rift basins (namely, Kutch, Saurashtra, Narmada, Cambay, Rajasthan and Indus) are largely constricted to the western part of the subcontinent formed during the break-up of the Gondwana supercontinent (Figure 1; Biswas Reference Biswas, Tandon, Pant and Casshyap1991; Chaudhuri et al. Reference Chaudhuri, Banerjee and Le Pera2018; Chakraborty et al. Reference Chakraborty, Tandon and Saha2019; Rajak et al. Reference Rajak, Chaudhuri, Prabhakar and Banerjee2022). The Kutch Basin in western India preserves a largely complete sequence of Mesozoic sedimentary rocks, from the Middle Jurassic to the Early Cretaceous (Biswas Reference Biswas2016a). Based on both detrital zircon U-Pb and monazite U-Th-total Pb ages, Chaudhuri et al. (Reference Chaudhuri, Das, Banerjee and Fitzsimons2020) found dominant contributions from source rocks belonging to 650–500 Ma and 500–400 Ma, pointing to Pan-African and Bhimphedian sources. The absence of known outcrops of these orogens in the vicinity of the Kutch Basin and the large age gap observed between the youngest detrital zircon ages in the source rocks and the age of sediment deposition (Chaudhuri et al. Reference Chaudhuri, Das, Banerjee and Fitzsimons2020) raised new questions on the sedimentary history of this basin and the extent of the Pan-African and Bhimphedian orogens. Recently, Chaudhuri et al. (Reference Chaudhuri, Schönig, Le Pera, von Eynatten, Chauhan and Lünsdorf2023) revealed differences in source regions between sub-basins of the Kutch Basin as well as evolutionary trends within sub-basins based on heavy-mineral analysis and detrital garnet chemistry. The authors related these variations to the rise of a subsurface basement high in the basin during the Callovian (Chaudhuri et al. Reference Chaudhuri, Schönig, Le Pera, von Eynatten, Chauhan and Lünsdorf2023).
Geological map of the Kutch Basin (adapted from Biswas Reference Biswas1999, Reference Biswas2005, Reference Biswas2016a, Reference Biswas2016b). The sampling locations for the Mesozoic sandstone units in this study are marked with red squares. Abbreviations: BF – Banni Fault, BHG – Banni Half-Graben, BU – Bela Uplift, CU – Chorar Uplift, GF – Gedi Fault, GOKHG – Gulf of Kutch Half-Graben, GRG – Great Rann Graben, IBF – Island Belt Fault, KHF – Katrol Hill Fault, KMF – Kutch Mainland Fault, KMU – Kutch Mainland Uplift, KU – Khadir Uplift, NKF – North Kathiawar Fault, NPF – Nagar Parkar Fault, PU – Pachchham Uplift, RHG – Rapar Half-Graben, SWF – South Wagad Fault, WU – Wagad Uplift.

In this study, we aim at (i) refining the understanding of the provenance of the Mesozoic Kutch Basin and (ii) discussing the age constraints of the sediment-supplying units reflected in the basin fill and their tectono-thermal evolution.
2. Geological background
2.a. The Kutch Basin
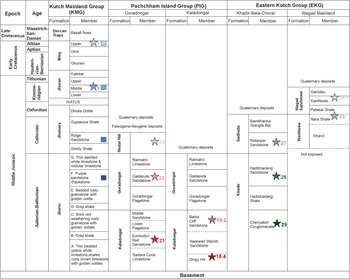
The Kutch Basin is situated at the western continental margin of the Indian subcontinent. The formation of this basin began in the Late Triassic during the breakup of the Gondwana supercontinent. With progressive rifting along E-W-trending faults, half-grabens were formed, serving as depocentres for the evolving sub-basins within the Kutch Basin (Figure 1). A dominantly siliciclastic Mesozoic sedimentary succession between the Late Triassic and Early Cretaceous was deposited in these sub-basins (Figure 2, Biswas Reference Biswas, Tandon, Pant and Casshyap1991). Most of the Mesozoic sedimentation in this basin took place in shallow-marine to fluvio-deltaic environments (Biswas Reference Biswas2016a). From the available paleocurrent indicators, a south-westerly-directed paleoslope is suggested for the sedimentation (Biswas Reference Biswas1987, Reference Biswas2005; Mandal et al. Reference Mandal, Koner, Sarkar, Tawfik, Chakraborty, Bhakta and Bose2016; Arora Reference Arora2017).
Mesozoic lithostratigraphy of the Kutch Basin is classified as the Kutch Mainland Group (KMG), Pachchham Island Group (PIG) and Eastern Kutch Group (EKG) (after Biswas Reference Biswas2016a). Sandstone units sampled in this study are marked with stars labelled with their respective sample numbers. For comparison, data from Chaudhuri et al. (Reference Chaudhuri, Das, Banerjee and Fitzsimons2020) belonging to the KMG has been used in this study, whose stratigraphic positions are represented with squares. Each group is assigned a distinct colour. Within each group, individual samples are differentiated by assigning the darkest shade to the oldest sample and progressively lighter shades to the younger samples.
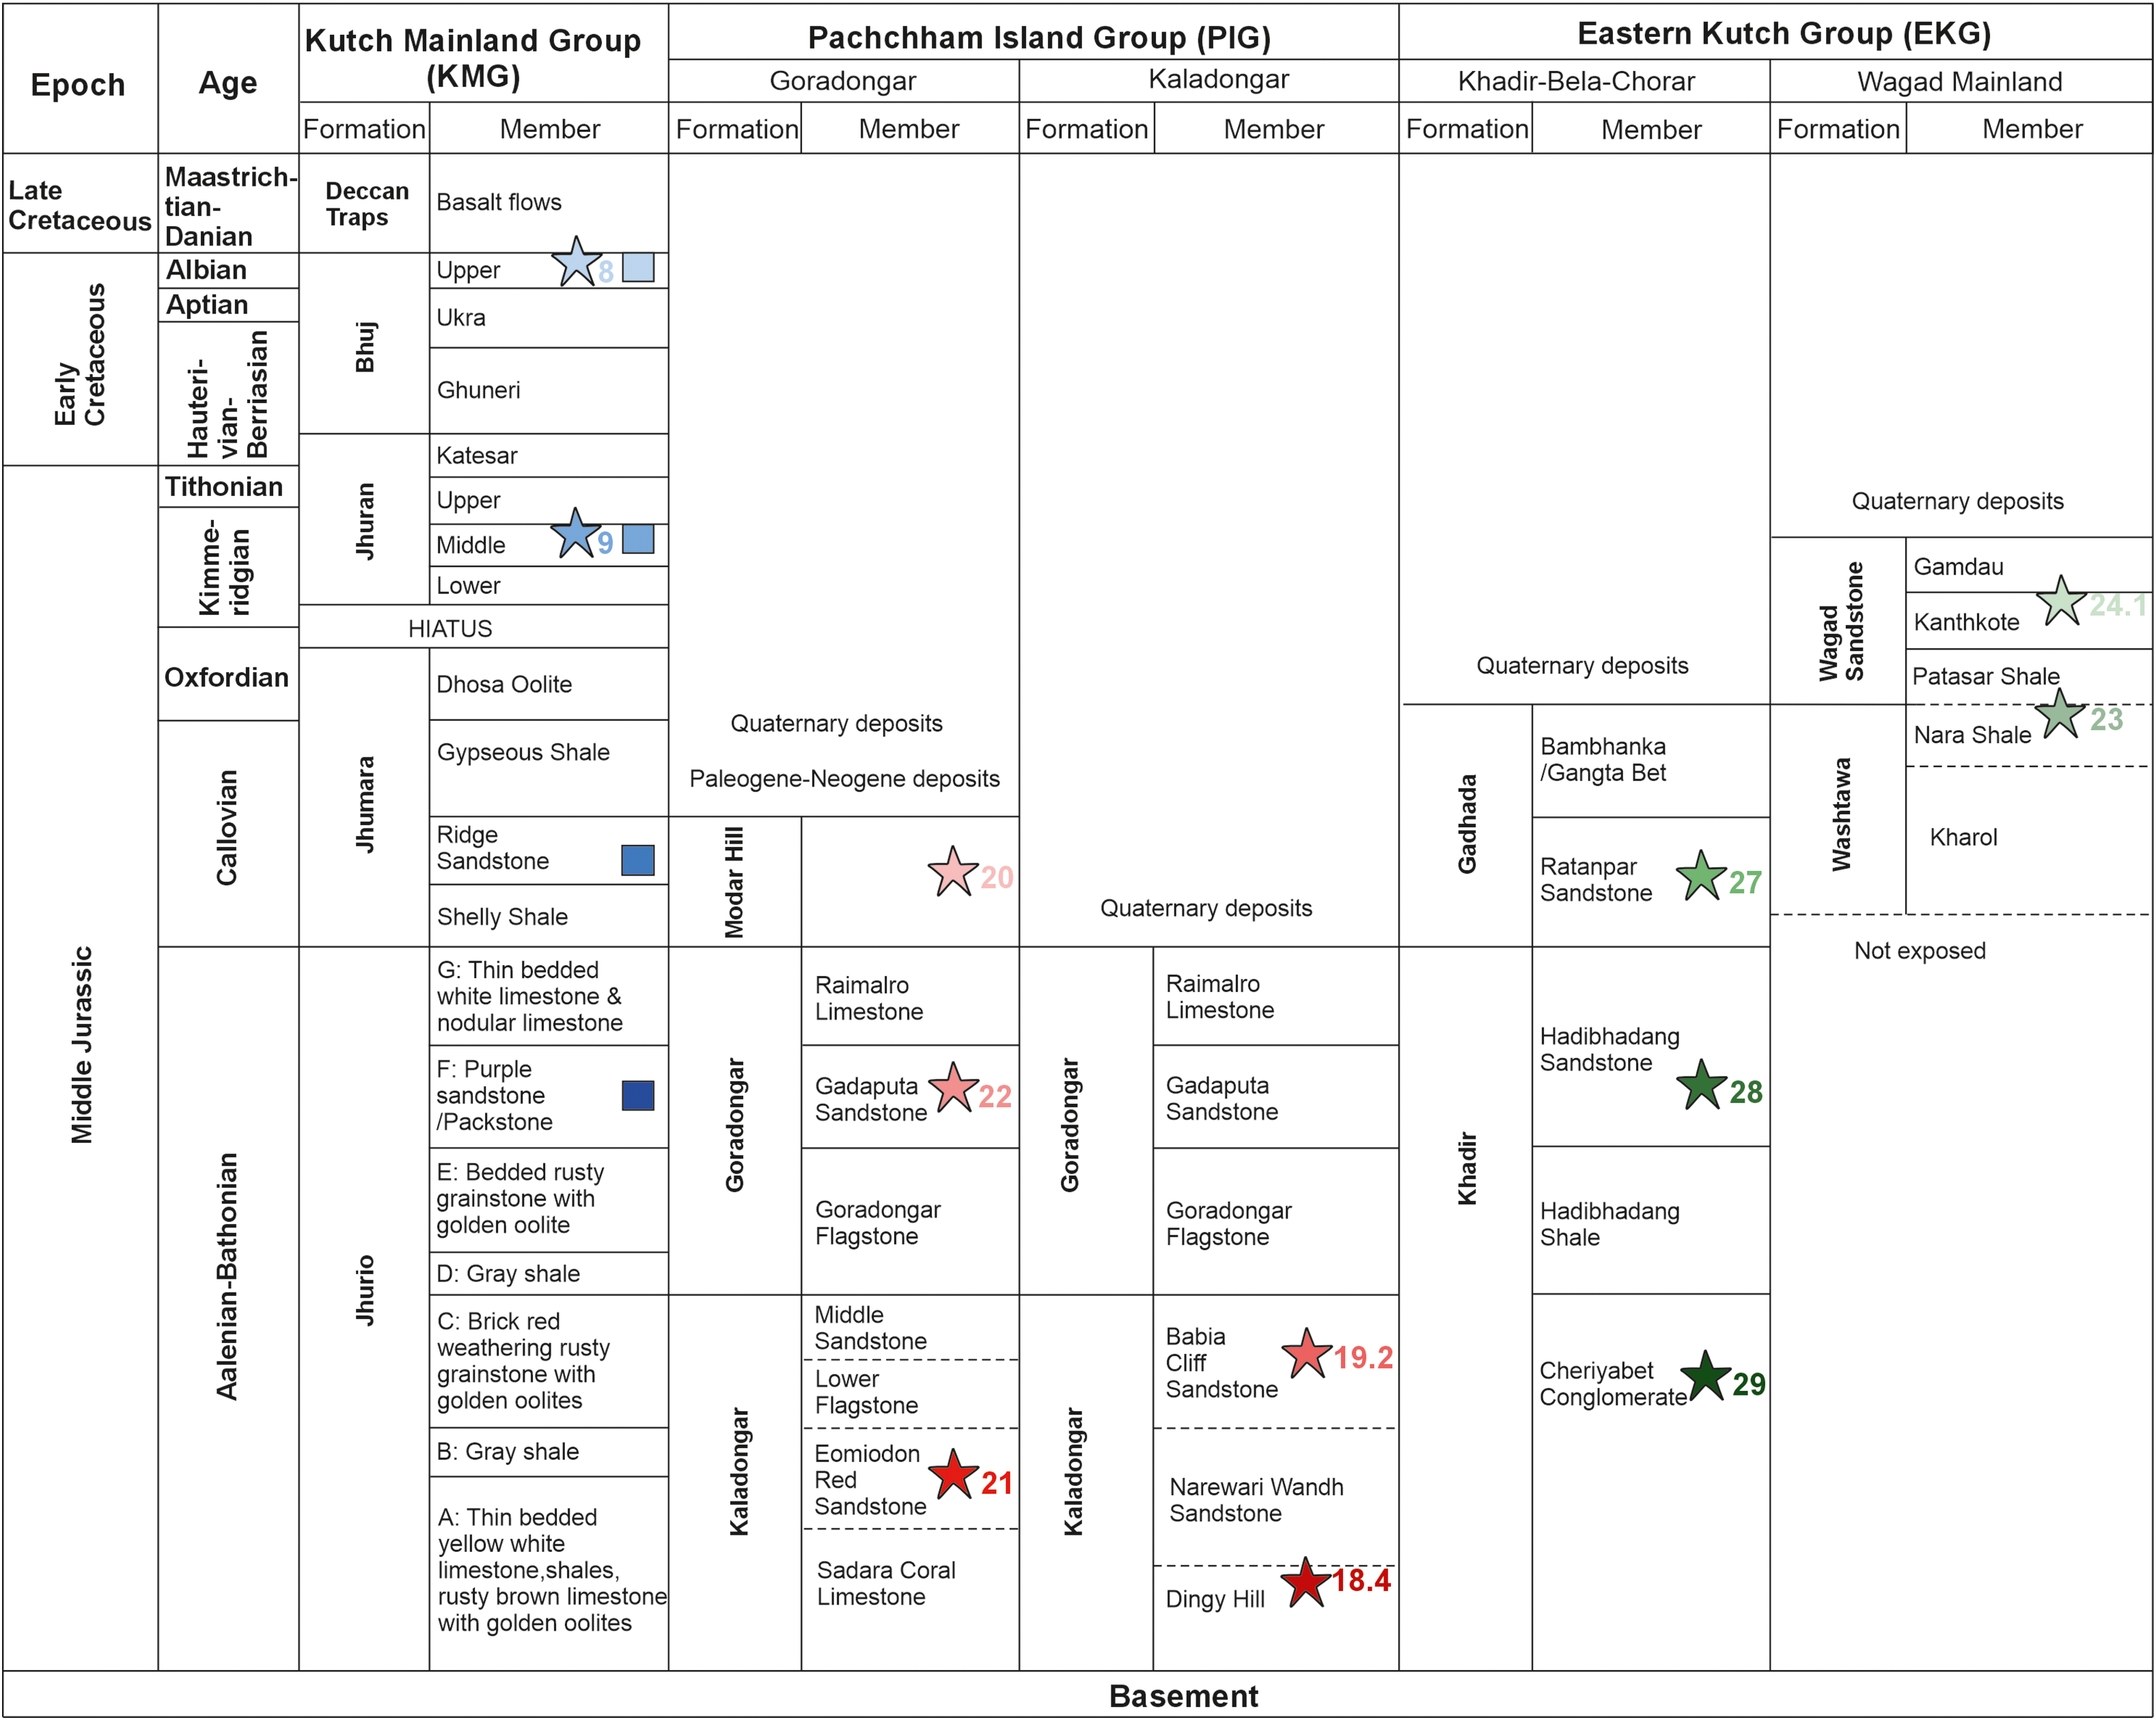
In the Late Cretaceous, during the incipient collision of the Indian plate with the Eurasian plate, the sedimentary rocks in the half-grabens were uplifted and exposed (Biswas Reference Biswas2016b). The exposures in the Kutch Mainland Uplift, classified as the Kutch Mainland Group (KMG), preserve the most complete Mesozoic succession in the basin, ranging from Aalenian (Middle Jurassic) to Albian (Lower Cretaceous) (Figures 1 and 2; Biswas Reference Biswas2016a). Rocks ranging in age from Aalenian to Callovian, exposed in the Pachchham Uplift, are classified as the Pachchham Island Group (PIG). The Khadir, Bela, Chorar and Wagad uplifts expose sedimentary rocks from Aalenian until Kimmeridgian, classified as the Eastern Kutch Group (EKG).
2.b. Rocks in the vicinity of the Kutch Basin
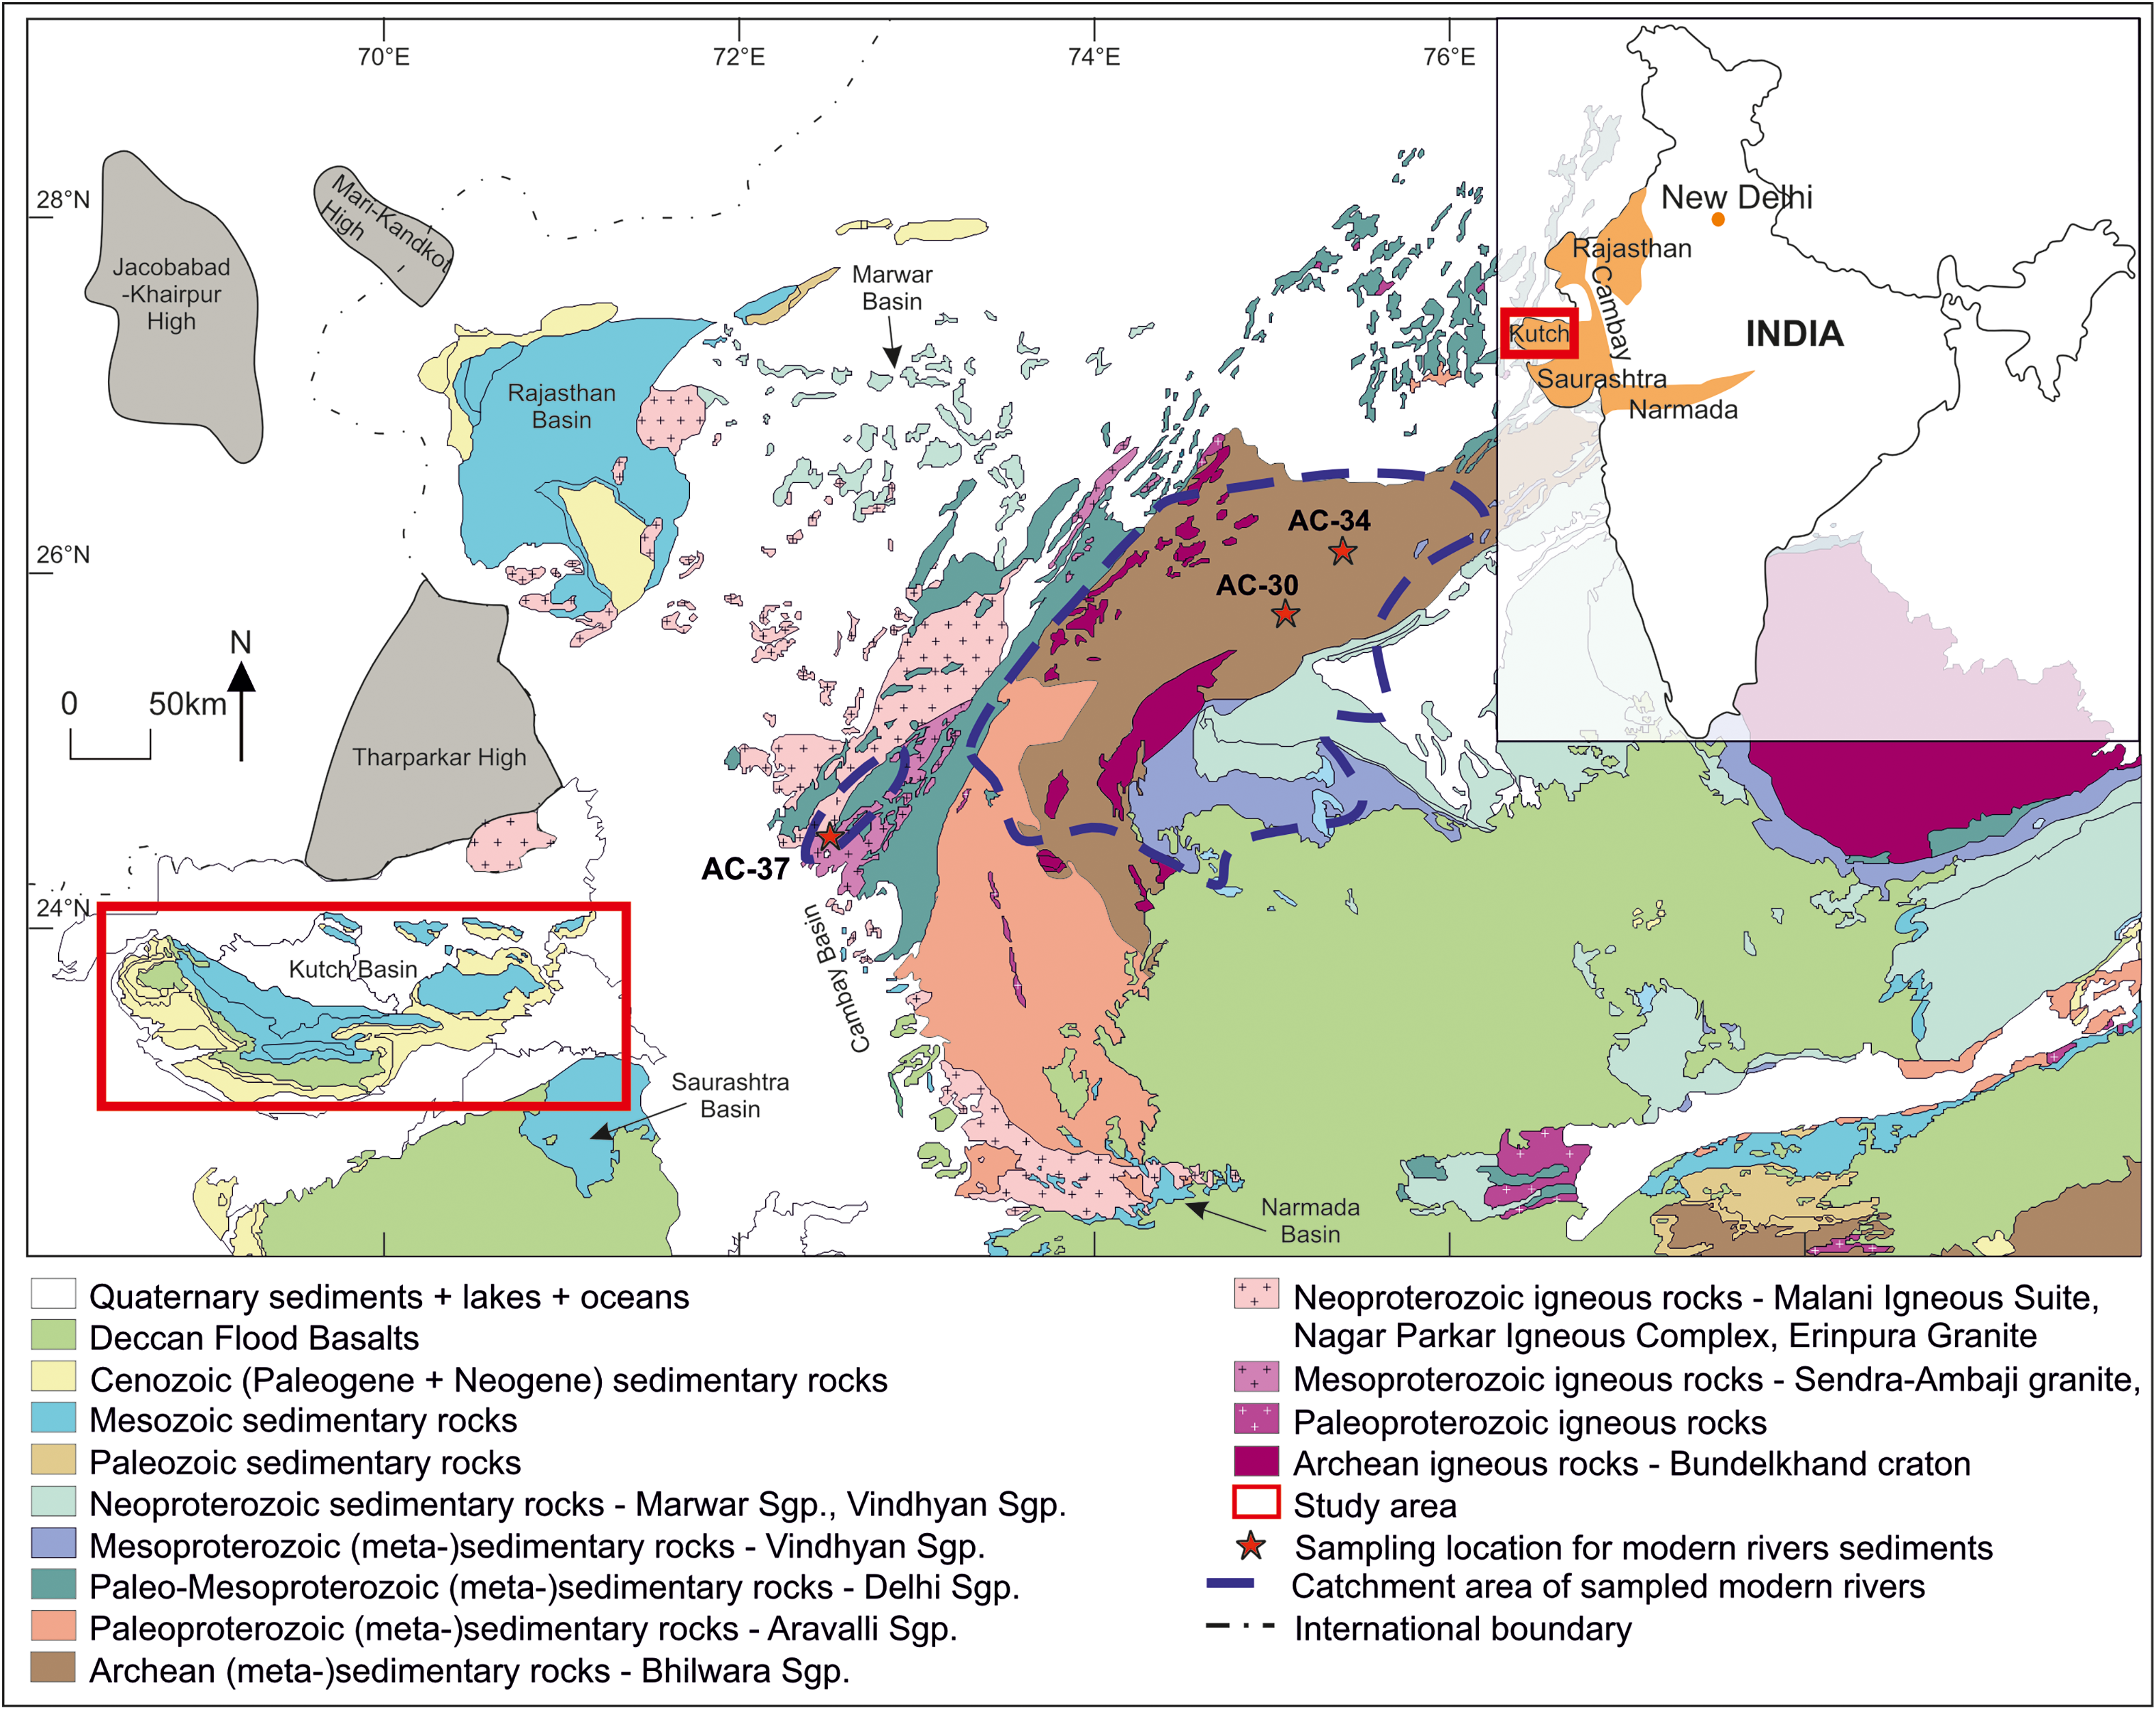
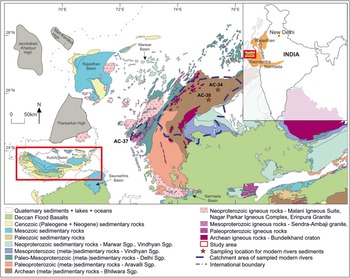
This section highlights the major lithostratigraphic units near the Kutch Basin (Figure 3). In line with the southwesterly paleoslope reported by previous workers, we discuss the rocks around the Kutch Basin in a clockwise manner. The north of the basin exhibits a large area of Quaternary sediment cover belonging to the Indus Basin. The major crystalline complex in this region is the Neoproterozoic Nagar Parkar Igneous Complex, which records U-Pb zircon ages between 794 and 640 Ma (Rehman et al. Reference Rehman, Khan, Jan, Lee, Chung and Murata2018; Shakoor et al. Reference Shakoor, Yang, Deng and Hakro2019; de Wall et al. Reference de Wall, Regelous, Tomaschek, Bestmann, Hahn and Sharma2022) and U-Th-total Pb monazite ages of 900–730 Ma (Khan et al. Reference Khan, Murata, Rehman, Zafar and Ozawa2012). Further north and north-west of Nagar Parkar lie the Jacobabad-Khairpur, Mari-Kandkot and Tharparkar highs. Although the basement under these highs is not well explored, the exposed Meso-Cenozoic sedimentary rocks are a part of the Lower Indus Basin, which was uplifted as horst blocks during rifting episodes starting in the Jurassic (Azeem et al. Reference Azeem, Yanchun, Khalid, Xueqing, Yuan and Lifang2016; Beaumont et al. Reference Beaumont, Burley, Breitfeld, Gould and Clarke2022; Shah et al. Reference Shah, Miraj, Ali, Ahsan, Mehmood, Sajid, Salaam and Fazal2023). To the east of the Lower Indus Basin, sedimentary rocks of the Neoproterozoic-early Paleozoic Marwar Basin are located. Although limited, Neoproterozoic detrital zircon ages have been reported from this succession (Marwar Supergroup) – e.g., McKenzie et al. (Reference McKenzie, Hughes, Myrow, Xiao and Sharma2011) report a few grains belonging to ∼540 Ma; Lan et al. (Reference Lan, Zhang, Li, Pandey, Sharma, Shukla, Ahmad, Sarkar and Zhai2020) report ∼615 Ma from a sandstone in this succession but only from two zircons; and Xu et al. (Reference Xu, Meert and Pandit2022) report 651 Ma from one zircon grain in felsic volcanics (Chhoti Khatu). From the same felsic ash, George and Ray (Reference George and Ray2017) report 70 Ma Rb-Sr whole-rock ages. Further east are the Meso-Cenozoic rocks of the Rajasthan Basin, beyond which are the Neoproterozoic igneous rocks of Erinpura Granite, with U-Pb zircon ages ranging from 873 to 800 Ma (van Lente et al. Reference van Lente, Ashwal, Pandit, Bowring and Torsvik2009) and chemical Th-U-total Pb isochron method (CHIME) monazite ages of 863–779 Ma (Just et al. Reference Just, Schulz, de Wall, Jourdan and Pandit2011). Close to the Erinpura Granite lies the Neoproterozoic Malani Igneous Suite, considered equivalent to the Nagar Parkar Igneous Complex and exhibiting U-Pb zircon ages around 750 Ma (van Lente et al. Reference van Lente, Ashwal, Pandit, Bowring and Torsvik2009; de Wall et al. Reference de Wall, Pandit, Donhauser, Schöbel, Wang and Sharma2018; Reference de Wall, Regelous, Tomaschek, Bestmann, Hahn and Sharma2022; Rehman et al. Reference Rehman, Khan, Jan, Lee, Chung and Murata2018; Shakoor et al. Reference Shakoor, Yang, Deng and Hakro2019). Further east are the Aravalli highlands comprising Archean cratonic gneisses (cf. Biswal et al. Reference Biswal, Pradhan, Sharma, Tiwari, Beniest, Behera, Singh, Saraswati, Bhardwaj, Umasankar and Singh2022), Paleo-Mesoproterozoic (meta-)sedimentary rocks of the Aravalli Supergroup (U-Pb zircon ages – Wiedenbeck and Goswami Reference Wiedenbeck and Goswami1994; Roy and Kroner Reference Roy and Kröner1996; McKenzie et al. Reference McKenzie, Hughes, Myrow, Banerjee, Deb and Planavsky2013; Wang et al. Reference Wang, Cawood, Pandit, Zhou and Zhao2019) and Meso-Neoproterozoic (meta-)sedimentary rocks of the Delhi Supergroup (U-Pb zircon ages – e.g., Pandit et al. Reference Pandit, Carter, Ashwal, Tucker, Torsvik, Jamtveit and Bhushan2003; Kaur et al. Reference Kaur, Zeh, Chaudhri, Gerdes and Okrusch2011). Further east are the rocks of the Mesoproterozoic and Neoproterozoic Vindhyan sedimentary basin and the Archean igneous rocks of the Bundelkhand craton (Mondal et al. Reference Mondal, Goswami, Deomurari and Sharma2002; Kaur et al. Reference Kaur, Zeh and Chaudhri2014; Verma et al. Reference Verma, Verma, Oliveira, Singh and Moreno2016; Saha et al. Reference Saha, Frei, Gerdes, Pati, Sarkar, Patole, Bhandari and Nasipuri2016). These rocks are juxtaposed with the vast expanse of the Cretaceous-Paleogene Deccan Flood Basalts, which cover much of the area south and southeast of the Kutch Basin. The middle-upper Cretaceous rocks of the Cambay Basin lie to the east/north-east of the Kutch Basin. To the south of the Kutch Basin lies the Saurashtra Basin with the Upper Jurassic–Lower Cretaceous Dhrangdhara Formation, with thick layers of Deccan basalts covered by rocks of Quaternary age.
Geological map of major lithostratigraphic units in the potential source area near the Kutch Basin (modified after Geological Survey of India, 1998; Ali et al. Reference Ali, Farid, Awan, Amin, Zafar, Bangash and Ullah2023 ). The catchment areas of modern rivers in the potential source area and their sampling locations are indicated with stippled blue outlines and red stars, respectively. The inset map of India highlights the location of its Mesozoic rift basins (from Chakraborty et al. Reference Chakraborty, Tandon and Saha2019).
3. Sampling
Sandstone samples (mainly arkoses and a few sub-arkoses; see Chaudhuri et al. Reference Chaudhuri, Schönig, Le Pera, von Eynatten, Chauhan and Lünsdorf2023) were selected from the Eastern Kutch Group (EKG; five samples: AC-29, −28, −27, −24.1 and −23), the Pachchham Island Group (PIG; five samples: AC-22, −21, −20, −19.2 and −18.4) and the Kutch Mainland Group (KMG; two samples: AC-9 and −8) (Figures 1 and 2). The sampling locations are provided in Supplementary table S1.
Additionally, to compare observations from the Mesozoic strata with potential source areas (as indicated by paleocurrent directions; see Mandal et al. Reference Mandal, Koner, Sarkar, Tawfik, Chakraborty, Bhakta and Bose2016; Arora Reference Arora2017), we sampled modern sediment from two rivers exclusively draining basement rocks located north-east of the Kutch Basin (Figure 3). The two rivers were selected based on their catchment area, as they drain the different lithologies and structural units in the potential source area. AC-30 and 34 represent a large catchment area, while AC-37 is from a smaller catchment area, closer to the Kutch Basin. In the case of the double sampling from the same catchment area, there was an intervening dam; therefore, one sample was collected from the upstream side (AC-30) of the dam and the other from the downstream side (AC-34). The contribution of Deccan volcanic rocks and recycling of Paleozoic to Cenozoic sedimentary rocks to the modern sediments is considered negligible for the respective catchment areas (marked in the map, Figure 3).
4. Analytical methods
For the 12 sandstone samples chosen from the Kutch Basin and the 3 modern river sediment samples, all steps of sample preparation were carried out at the University of Göttingen, Germany. The sandstone samples were either crushed and milled using a jaw crusher and disc mill, respectively, or disintegrated by hammering (for friable samples). All samples were dry sieved to separate the <250 µm grain size fraction. This fraction was pre-concentrated for heavy minerals using a wet shaking table, treated with 5% acetic acid to remove carbonates and gravity-separated using sodium polytungstate (2.86–2.89 g/cm3). From the heavy-mineral fraction, ferromagnetic mineral grains were separated using a hand magnet, and the rest of the fraction was processed using a Franz Isodynamic® magnetic separator. The diamagnetic fraction was split by coning and quartering, and the final aliquot was mounted using Araldite DBF resin. The mounts were ground and polished using silicon carbide papers and diamond suspensions (9, 3 and 1 µm). The polished and carbon-coated mounts were cathodoluminescence and backscattered electron imaged using a JEOL-JXA iHP200F electron microprobe to select homogeneous areas for laser ablation, preferably in the core zones of the zircon and rutile crystals, respectively.
Around 100 detrital zircon and 60–100 detrital rutile grains were analysed from each sample using a magnetic sector field inductively coupled plasma mass spectrometer (SF-ICP-MS) attached to a Resonetics excimer laser ablation (LA) system following the technique described in Frei and Gerdes (Reference Frei and Gerdes2009). The LA-SF-ICP-MS analyses were performed at the University of Göttingen and the Karlsruhe Institute of Technology (both in Germany), using a ThermoFisher Scientific Element 2 at each laboratory. Details of the operating conditions are provided in Supplementary table S2. All age data were obtained by single-spot analyses with a laser beam diameter of 33 µm and a crater depth of approximately 10 µm, measured after ablation by using a Keyence laser scanning microscope with a 408 nm wavelength (at the University of Göttingen). The laser was fired at a repetition rate of 5 Hz and at 2.5 J/cm2 energy. Two laser pulses were used for pre-ablation. The carrier gases were He and Ar. Analytes of 238U, 235U, 232Th, 208Pb, 207Pb, 206Pb, 204Pb + 204Hg and 202Hg were measured by the ICP-MS. Data were obtained following a standard-sample bracketing with 12 s. blank, 17 s ablation and 12 s washout times. If the ablation hit zones or inclusions had highly variable actinide concentrations or isotope ratios, then the integration interval was slightly resized or the analysis was discarded (∼1% of the spots). The GJ-1 zircon was used as the primary reference material (Jackson et al. Reference Jackson, Pearson, Griffin and Belousova2004). To monitor precision and accuracy over the course of the analyses, the Plešovice zircon (337.1 ± 0.4 Ma; Sláma et al. Reference Sláma, Košler, Condon, Crowley, Gerdes, Hanchar, Horstwood, Morris, Nasdala, Norberg and Schaltegger2008), the 91500 zircon (1065.4 ± 0.3 Ma; Wiedenbeck et al. Reference Wiedenbeck, Alle, Corfu, Griffin, Meier, Oberli, Quadt, Roddick and Spiegel1995) and the FC-1 zircon (1099 ± 0.6 Ma; Paces and Miller Reference Paces and Miller1993) were used as secondary reference materials. The age results of the secondary reference materials are listed in Supplementary table S2, and the zircon U-Pb data from the Mesozoic sandstones are given in Supplementary table S3. Data processing was performed using our in-house software (UranOS; Dunkl et al. Reference Dunkl, Mikes, Simon, von Eynatten and Sylvester2008). Zircon data showing more than 10% of discordance were not considered for evaluation. For ages younger than 1500 Ma, the 206Pb/238U age was considered, while for older ones, the 207Pb/206Pb age was considered (Spencer et al. Reference Spencer, Kirkland and Taylor2016). IsoplotR (Vermeesch Reference Vermeesch2018) was used to generate Wetherill concordia plots.
For rutile grains, the R10 reference material (1091.6 ± 3.5 Ma; Luvizotto et al. Reference Luvizotto, Zack, Meyer, Ludwig, Triebold, Kronz, Muenker, Stockli, Prowatke, Klemme and Jacob2009) was used to correct the effect generated by the ablation of the non-silicate matrix of the dated phases. For further control, the Sugluk-4 (1719 ± 14 Ma), PCA-S207 (1865 ± 8 Ma), R13 (505 ± 6 Ma) and R19 (489.4 ± 3.3 Ma) rutiles were used as secondary reference materials (Zack et al. Reference Zack, Stockli, Luvizotto, Barth, Belousova, Wolfe and Hinton2011; Schmitt and Zack Reference Schmitt and Zack2012; Bracciali et al. Reference Bracciali, Parrish, Horstwood, Condon and Najman2013). Rutile U-Pb ages were calculated as lower intercept ages iteratively, assuming model Pb composition (Stacey and Kramers Reference Stacey and Kramers1975) using the Age7corr and AgeEr7Corr functions of Isoplot/Ex 4.15 (Ludwig Reference Ludwig2012). Age data showing uncertainty of more than 20% were not considered for evaluation (Supplementary table S4).
5. Results
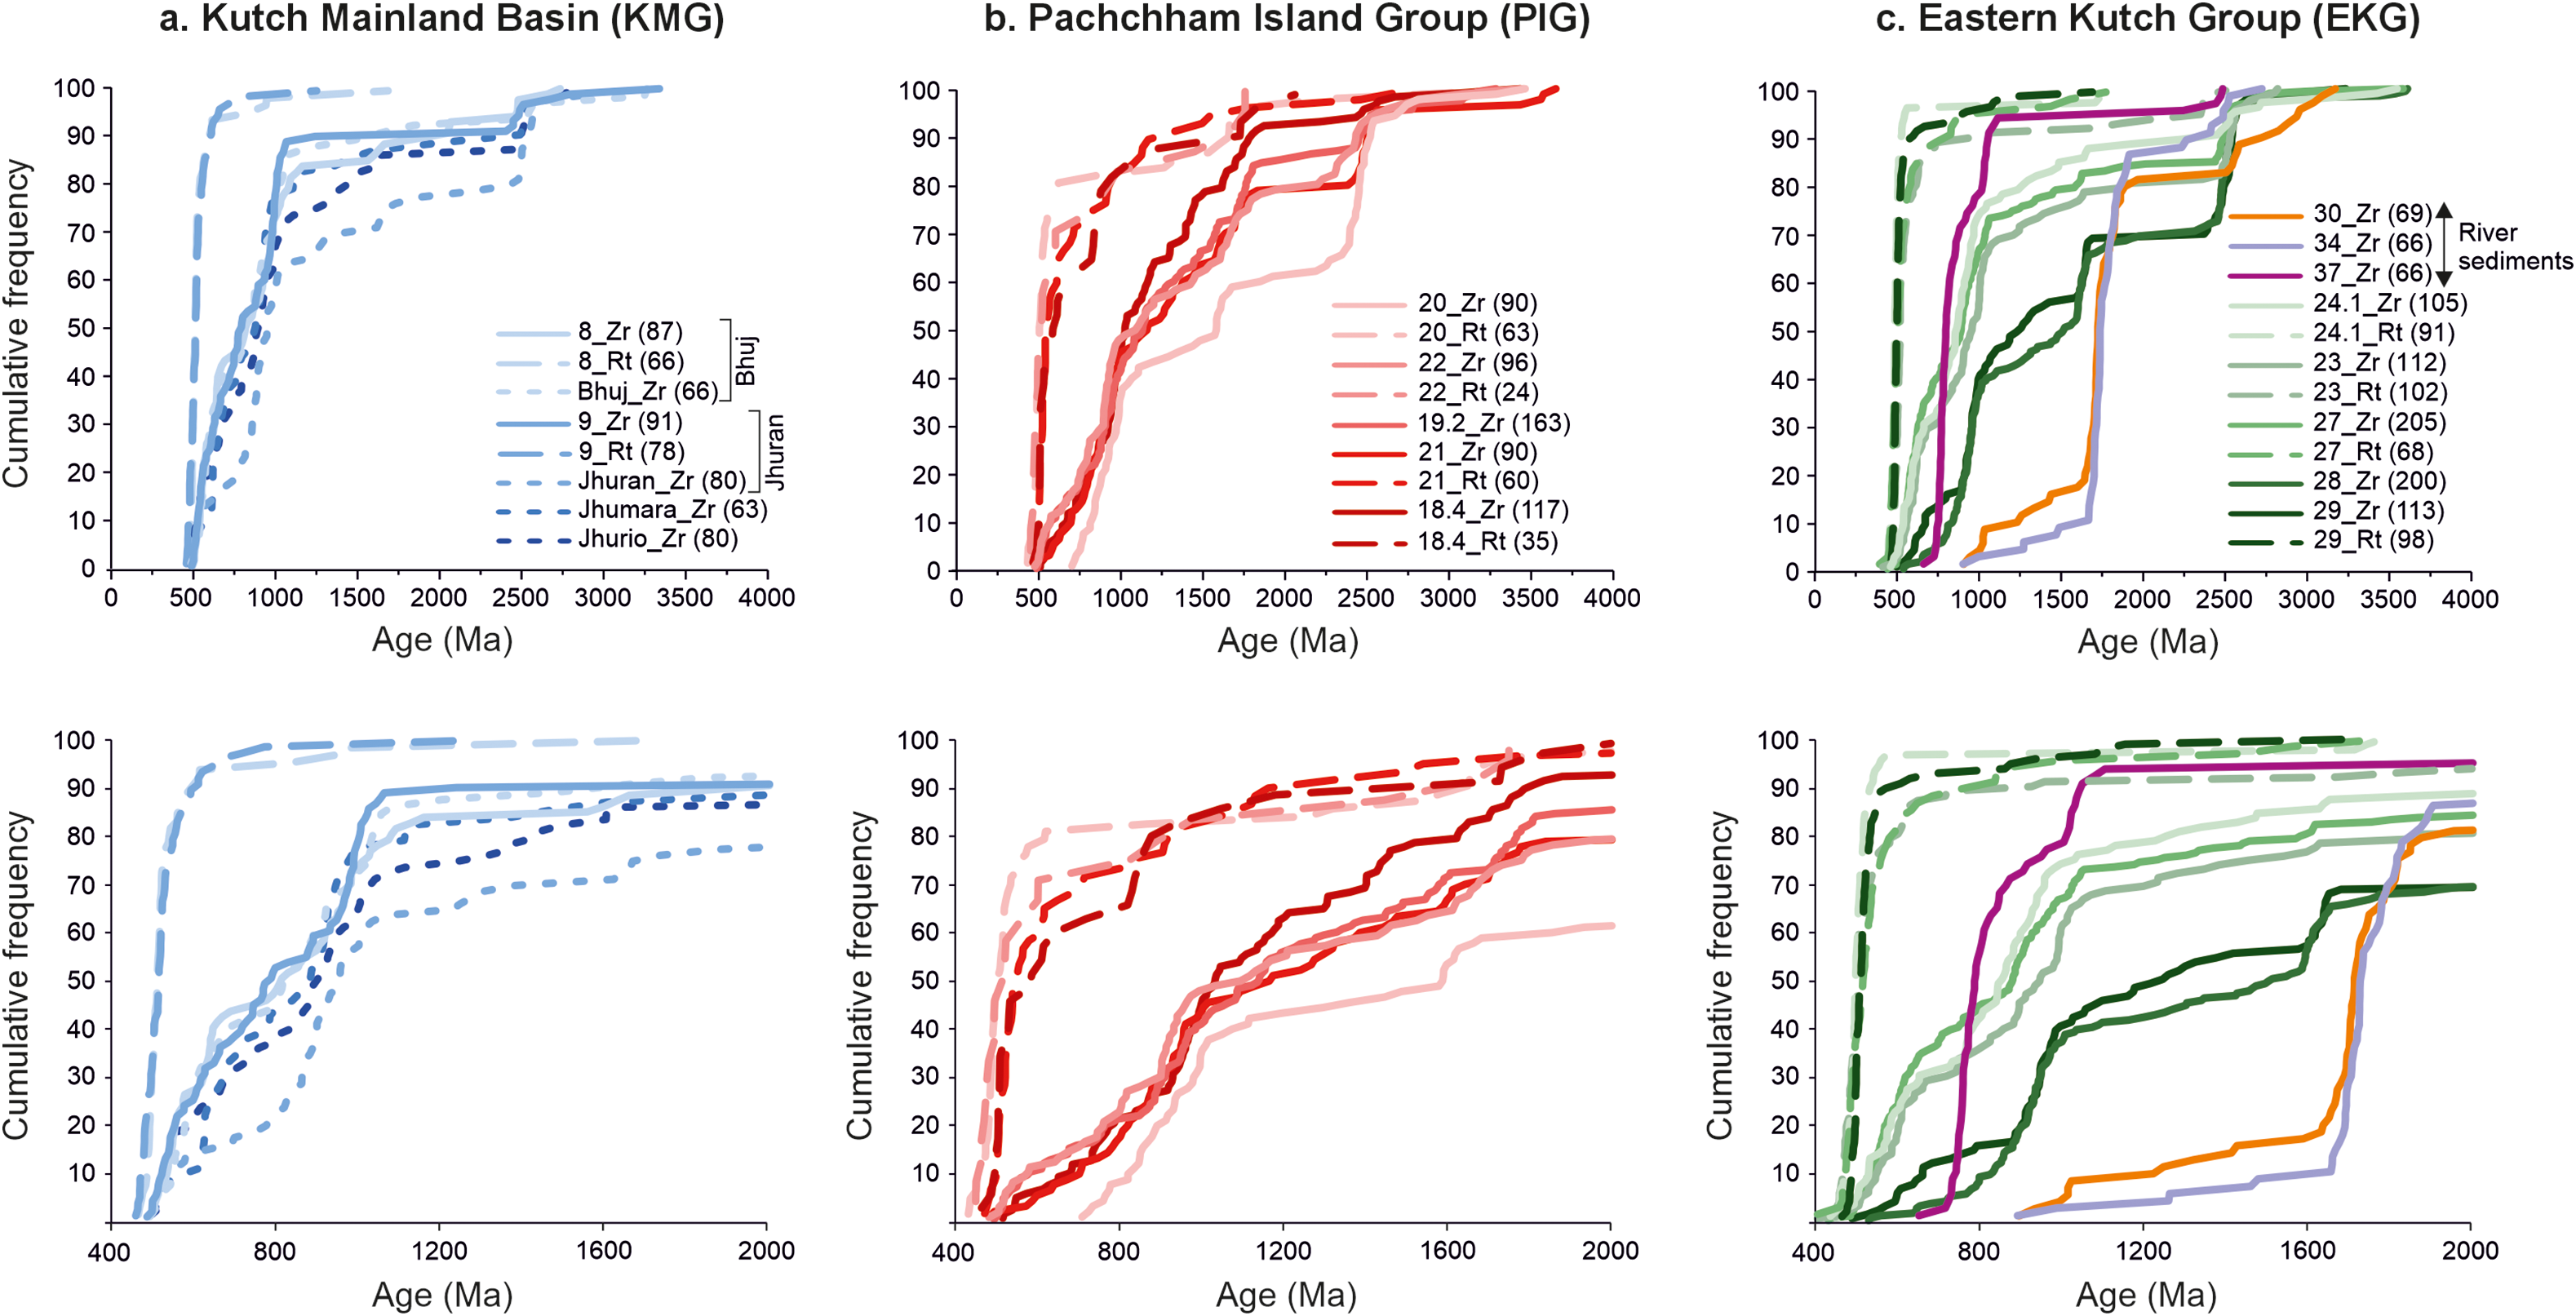
From the twelve Mesozoic sandstone samples of the Kutch Basin and the three modern sediment samples, 1,892 single-spot zircon U-Pb ages were obtained (Supplementary table S3). Additionally, 720 single-spot rutile U-Pb ages were obtained from the Mesozoic sandstone samples (Supplementary table S4). The zircon U-Pb data from the current study are compared with those of the sandstone samples from Jhurio, Jhumara, Jhuran and Bhuj formations belonging to the KMG, as reported by Chaudhuri et al. (Reference Chaudhuri, Das, Banerjee and Fitzsimons2020) (Figure 2). The concordant detrital zircon and the low-error rutile U-Pb ages are shown as cumulative frequency plots (Figure 4), kernel density estimates (Figures 5a, 6a and 7a) and age-interval bar charts (Figures 5b, 6b and 7b). The boundaries of the age intervals were determined based on the minima observed in the kernel density estimate of all analysed samples (Supplementary figures S5 and S6).
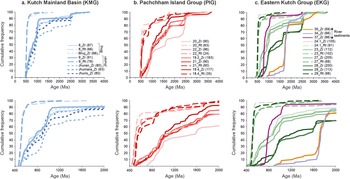
Cumulative frequency patterns of zircon (solid lines) and rutile (dashed lines) U-Pb ages. The zircon data from the four samples in Chaudhuri et al. (Reference Chaudhuri, Das, Banerjee and Fitzsimons2020) is included in 4a (stippled lines). The zircon U-Pb age data from the river sediment are presented in 4c. The lower panel comprises enlargements of the cumulative frequency patterns in the upper panel.
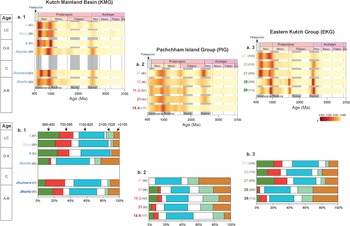
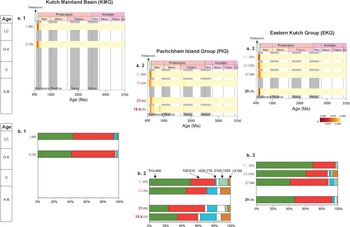
(a) Kernel density estimates and (b) age-interval bar charts of detrital zircon U-Pb ages from Mesozoic sandstone samples of the study area, along with four samples of Chaudhuri et al. (Reference Chaudhuri, Das, Banerjee and Fitzsimons2020). The boundaries of the colour-coded age intervals were determined by the minima between the major age components (Supplementary figure S5). The vertical bar on the left indicates the stratigraphic age of the samples: A-B – Aalenian-Bathonian of the Middle Jurassic, C – Callovian of the Middle Jurassic, O-K – Oxfordian to Kimmeridgian of the Middle to Late Jurassic and LC – Late Cretaceous.

(a) Kernel density estimates and (b) age-interval bar charts of detrital rutile U-Pb ages from Mesozoic sandstone samples of the study area. The boundaries of the colour-coded age intervals were determined by the minima between the major age components (Supplementary figure S6). The vertical bar on the left indicates the stratigraphic age of the samples: A-B – Aalenian-Bathonian of Middle Jurassic, C – Callovian of Middle Jurassic, O-K – Oxfordian to Kimmeridgian of Middle to Late Jurassic and LC- Late Cretaceous.

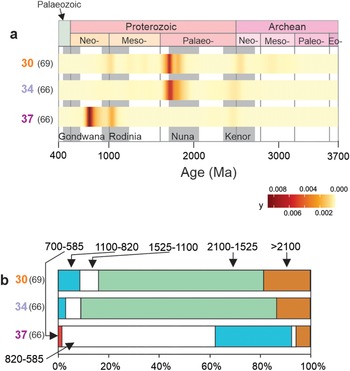
(a) Kernel density estimates and (b) age-interval bar charts of detrital zircon U-Pb ages from modern river sediment representing the exposed basement east of the Kutch Basin – as a potential sediment source area.

5.a. Detrital zircon U-Pb ages of Mesozoic sandstones
The detrital zircons analysed from the Mesozoic sandstones in the KMG, PIG and EKG yield a wide range of source rocks from ca. 3600 Ma to 400 Ma and exhibit a few single-grain age clusters (Supplementary table S3, Figures 4 and 5a). The main age clusters are around late Neoarchean–early Paleoproterozoic (∼2480 Ga), late Paleoproterozoic–early Mesoproterozoic (∼1615 Ma), late Mesoproterozoic–early Neoproterozoic (∼950 Ma) and late Neoproterozoic–early Paleozoic (∼540 Ma). All the analysed samples show the ∼2480 Ma and ∼950 Ma age populations (except AC-18.4 of PIG, which shows a minor band ∼2480 Ma). In the PIG samples, the ∼1615 Ma age cluster forms broad bands (Figure 5a.2), while in the oldest samples of EKG (AC – 29 and 28), this age cluster forms prominent, narrow bands. In the KMG samples and the younger samples of EKG (AC-27, 23 and 24.1), this age cluster is largely absent (Figure 5a.1 and 5a.3). By contrast, these samples exhibit a pronounced ∼540 Ma population. The older EKG samples and all PIG samples show weak representation or absence of the ∼540 Ma age population (Figure 5a.2 and 5a.3). An exception is sample AC-19.2 of PIG, which shows the age population at ∼540 Ma and ∼1615 Ma but is shifted to slightly older ages (Figure 5a.2).
The contrast in the ∼1615 Ma and ∼540 Ma populations observed in the kernel density estimates (as described above) is enhanced in the age interval bar charts, i.e., proportions of 585–400 and 2100–1525 Ma ages (Figure 5b). All samples except AC-20 (PIG) exhibit the youngest age intervals 585–400 Ma and 700–585 Ma, albeit with varying proportions (Figure 5b). For the samples of the PIG (except AC-20) and AC-29, 28 of the EKG, the proportion of the <700 Ma age interval is roughly similar, ranging from 4 to 16%. For the younger samples of the KMG (AC-8, 9 and ‘Bhuj’ from Chaudhuri et al. Reference Chaudhuri, Das, Banerjee and Fitzsimons2020) and the EKG (AC-27, 23 and 24.1), the proportion of the <700 Ma age interval is significantly higher between 16 and 44%. These younger samples of KMG and EKG also show an increased proportion of the youngest age interval at 585–400 Ma (max. 26%).
5.b. Detrital rutile U-Pb ages of Mesozoic sandstones
In all the sandstone samples, the analysed detrital rutile grains indicate a predominance of ages <700 Ma (Supplementary table S4) exhibited by a prominent maximum in the late Neoproterozoic–early Paleozoic (∼505 Ma) in the kernel density estimates (Figure 6a). The samples of the PIG exhibit an up-sequence increase in late Neoproterozoic-early Paleozoic ages for detrital rutile and, less pronounced, zircon (Figure 4b). For all sandstone samples, the relative proportion of <700 Ma rutile is higher in comparison to <700 Ma zircon (Supplementary tables S3 and S4, Figures 4 and 6). The youngest rutile population is younger than the youngest zircon population, as reflected in their peak ages at ∼505 Ma and ∼540 Ma, respectively. This is highlighted in the bar charts: the proportion of the youngest age interval is much lower for zircon compared to rutile (Figures 5b and 6b). In all samples of PIG and one sample of EKG (AC-23), the older rutile grains (>2100 Ma) are present (Figure 6b.2). The PIG samples exhibit a relatively higher proportion of rutile ages >700 Ma when compared to the KMG and EKG. Additionally, samples of PIG exhibit rutile >2500 Ma (Figures 4 and 6).
5.c. Detrital zircon U-Pb ages of modern river sediments
The zircons in the modern river sediments yield ages ranging between 652 Ma (AC-37) and 3164 Ma (AC-30) (Supplementary table S3). Samples AC-30 and 34 have the most prominent age clusters at late Paleoproterozoic (2100–1525 Ma), followed by >2100 Ma along with minor 1100–820 Ma ages (Figure 7). Sample AC-37 shows predominant middle-Neoproterozoic ages, while the 2100–1525 Ma remains absent. Among the two younger age intervals observed in the Mesozoic sandstone samples of this study, the 700–585 Ma is present in negligible proportions in the modern river sediment sample, AC-37 (Figures 4c and 7b).
6. Discussion
6.a. Implications for the Kutch Basin
6.a.1. Variation within the Kutch Basin
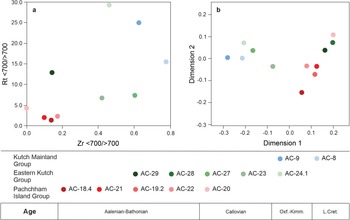
Quantitative heavy-mineral analysis and single-grain garnet chemistry revealed a variation in provenance for the PIG when compared to the KMG and EKG (Chaudhuri et al. Reference Chaudhuri, Schönig, Le Pera, von Eynatten, Chauhan and Lünsdorf2023). The detrital zircon and rutile U-Pb ages from this study corroborate this observation. The PIG records a higher zircon contribution from late Paleoproterozoic–early Mesoproterozoic (∼1615 Ma) source rocks when compared to KMG and EKG (Figure 5a.2 and 5b.2). The rutile U-Pb ages indicate a higher input from >700 Ma (especially >2100 Ma) source rocks in the PIG samples (Figure 6b). The ratio of zircon grains younger than 700 Ma to those older than 700 Ma when plotted against the same ratio for rutile clearly separates the PIG samples from the rest due to relatively lower proportions of the younger U-Pb age group for both minerals (Figure 8a).
(a) Cross plots of ratios of the proportions of relatively young (<700 Ma) over older (>700 Ma) zircon and rutile U-Pb ages and (b) a multi-dimensional scaling (MDS) plot of zircon U-Pb ages using the Kolmogorov–Smirnov effect as a dissimilarity measure according to Vermeesch (Reference Vermeesch2013). The horizontal bar at the bottom indicates the stratigraphic age of the samples.

In addition to the heterogeneity among the three sub-basins (as discussed above), individual sedimentary successions within each sub-basin also exhibit internal variations. The varying contributions from late Paleoproterozoic–early Mesoproterozoic (∼1615 Ma) and late Neoproterozoic–early Paleozoic (∼540 Ma) zircon source rocks reflect heterogeneity. The late Paleoproterozoic–early Mesoproterozoic are significant contributors to PIG samples and the oldest samples of EKG (Figure 5) exhibiting similar proportions in the 2100–1525 Ma age intervals (Figure 5b.2 and 5b.3). By contrast, contributions from the late Neoproterozoic–early Paleozoic sources are pronounced in all samples of the KMG and younger samples of the EKG (Figure 5b.1 and 5b.3). In these samples, the proportion of younger zircon grains (585–400 Ma and 700–585 Ma) appears to increase as the proportion of 2100–1525 Ma zircon grains decreases (Figure 5b.2 and 5b.3). These variations are highlighted in Figure 8. The PIG samples cluster away from the KMG and EKG, highlighting the increase in younger zircon and rutile in the KMG and younger samples of EKG (Figure 8a). The PIG samples and the oldest samples of EKG show an evolutionary trend, whereby the youngest PIG sample (AC-20) is most similar to the oldest EKG samples (AC-28 and 29) (Dimension 2 in Figure 8b). The samples AC-20 and 28 are similar in HM composition (Figures 6 and 7 in Chaudhuri et al. Reference Chaudhuri, Schönig, Le Pera, von Eynatten, Chauhan and Lünsdorf2023). This calls for a common source region of the sediment fill until the transition from late Bathonian to Callovian, with slightly increasing or decreasing drainage area and clear indications for sediment recycling (polymodal rutile age populations). By contrast, the younger samples of KMG and EKG show a high dissimilarity to the samples of PIG and the oldest samples of EKG (Figure 5, Dimension 1 in Figure 8b). These variations suggest a change in provenance in KMG and EKG in the late Bathonian-Callovian.
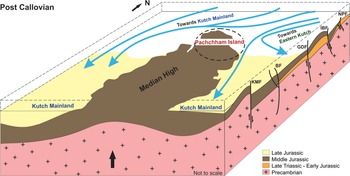
A subsurface basement high (Median High) stretching for ∼40 km from the Kutch Mainland Uplift to the Pachchham Uplift is reported by several authors (cf. Chauhan et al., Reference Chauhan, Jani, Kothyari, Prizomwala, Vedpathak, Lakhote, Kandregula, Solanki, Parmar, Bhandari and Thakkar2024). Chaudhuri et al. (Reference Chaudhuri, Schönig, Le Pera, von Eynatten, Chauhan and Lünsdorf2023) suggested a Callovian age of the rise of the Median High based on variations in heavy-mineral assemblages and garnet chemistry. The zircon U-Pb data in this study supports the observations of Chaudhuri et al. (Reference Chaudhuri, Schönig, Le Pera, von Eynatten, Chauhan and Lünsdorf2023). The youngest zircon age population (late Neoproterozoic–early Paleozoic) is absent in the Callovian sample of PIG (AC-20), and the same age population increases in the younger samples of KMG and EKG (Figure 5). These observations suggest a gradual rise of Median High may have caused a drainage divide cutting off sediment transport from the late Neoproterozoic–early Paleozoic source rocks to the PIG (Figure 9). Subsequent diversions in sediment transport paths may have led to higher contributions of these younger source rocks in the Callovian and younger samples of the KMG and EKG. In the PIG, due to the rise of the Median High, sedimentation either ceased or was reduced and eventually eroded.
Conceptual model of the sediment dispersal pathways (blue arrows) influenced by the Late Bathonian–Callovian rise of the Median High (indicated by the black arrow at the bottom of the figure). The right edge of the 3D diagram exhibits the cross-section of the Kutch Basin along the Median High (Biswas Reference Biswas2005). For abbreviations of fault names, see the caption to Figure 1.

6.a.2. Comparison with potential source rocks
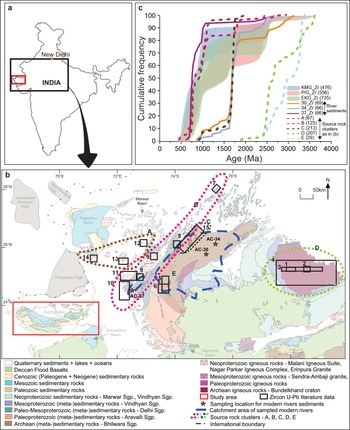
Among the three modern river samples from the potential source areas, two of them exhibit a predominance of zircons of late Paleoproterozoic age, while one of them shows a predominance of middle-Neoproterozoic age. The other (minor) ages in these samples belong to the late Neoarchean-early Paleoproterozoic and late Mesoproterozoic-early Neoproterozoic (Figure 7). These zircon age populations are observed in the sandstone samples of the KMG, PIG and EKG. However, the youngest age population, from late Neoproterozoic to early Paleozoic, observed in sandstone samples of all three groups (except AC-20 of PIG), is absent in the modern river sediment samples. To further improve our understanding of potential sources, we compiled zircon U-Pb literature data on the exposed crystalline rocks (n = 729). Figure 10 shows the sampling locations of the compiled literature data (black quadrangles) as an overlay on the relevant lithostratigraphic units of Figure 3. Based on the age affinity, source rocks are clustered into five groups (A, B, C, D and E). The cumulative frequency patterns of these five groups are presented with those of the analysed sandstone samples of KMG, PIG and EKG and the three modern river sediment samples (Figure 10c). The patterns of the compiled literature data exhibit the presence of the three main age populations as observed in the Mesozoic sandstone samples – late Neoarchean–early Paleoproterozoic, late Paleoproterozoic–early Mesoproterozoic and late Mesoproterozoic–early Neoproterozoic. The cumulative frequency patterns A and B are similar to those of the Mesozoic samples, while C shows similarities with the modern river sediment samples. The cumulative frequency patterns of D and E do not show the younger age groups which are dominant in the analysed Mesozoic sandstone and modern river sediment. Only a few ages from B represent the youngest late Neoproterozoic–early Paleozoic age component (Figure 10c). This indicates the present-day paucity of outcrops of the youngest source rocks in the potential source area.
(a) Map of India, marked with the position of the Kutch Basin and the extent of the geological map in (b); (b) Geological map of major lithostratigraphic units in the potential source area near the Kutch Basin (as in Figure 3). The catchment areas of modern rivers in the potential source area and their sampling locations are indicated with stippled blue outlines and red stars, respectively. The small black rectangles indicate sampling points of the available zircon U-Pb literature data from crystalline rocks in the potential source area. Source rock clusters, having similar ages, are enclosed with stippled lines of different colours. Literature data – 1. Verma et al. Reference Verma, Verma, Oliveira, Singh and Moreno2016; 2. Kaur et al. Reference Kaur, Zeh and Chaudhri2014; 3. Saha et al. Reference Saha, Frei, Gerdes, Pati, Sarkar, Patole, Bhandari and Nasipuri2016; 4. Mondal et al. Reference Mondal, Goswami, Deomurari and Sharma2002; 5. Wiedenbeck and Goswami, Reference Wiedenbeck and Goswami1994; 6. Roy and Kröner, Reference Roy and Kröner1996; 7. Kaur et al. Reference Kaur, Zeh, Chaudhri, Gerdes and Okrusch2011; 8. Pandit et al. Reference Pandit, Carter, Ashwal, Tucker, Torsvik, Jamtveit and Bhushan2003; 9. van Lente et al. Reference van Lente, Ashwal, Pandit, Bowring and Torsvik2009; 10. Ashwal et al. Reference Ashwal, Solanki, Pandit, Corfu, Hendriks, Burke and Torsvik2013; 11. de Wall et al. Reference de Wall, Pandit, Donhauser, Schöbel, Wang and Sharma2018; 12. Meert et al. Reference Meert, Pandit and Kamenov2013; 13. Gregory et al. Reference Gregory, Meert, Bingen, Pandit and Torsvik2009; 14. Pradhan et al. Reference Pradhan, Meert, Pandit, Kamenov, Gregory and Malone2010; 15. Buick et al. Reference Buick, Allen, Pandit, Rubatto and Hermann2006; (c) Cumulative frequency patterns of the source rock clusters in (b), modern river sediment samples AC-30, 34 and 37 and the zircon U-Pb data of KMG, PIG and EKG (solid-coloured envelopes).

6.b. Search for the youngest late Neoproterozoic-early Paleozoic source rocks
The late Neoproterozoic–early Paleozoic time includes the age ranges of the Pan-African (650–500 Ma) and Bhimphedian (/Kurgiakh) orogenies (500–400 Ma). The 500–400 Ma zircon U-Pb ages are largely absent in the source rock compilation (section 6.a.2) except for a few zircon grains in de Wall et al. (Reference de Wall, Pandit, Donhauser, Schöbel, Wang and Sharma2018). Rocks of this age are reported from farther north of the Kutch Basin in the Himalayan fold thrust belt (Gehrels et al. Reference Gehrels, DeCelles, Ojha and Upreti2006; Cawood et al. Reference Cawood, Johnson and Nemchin2007; Myrow et al. Reference Myrow, Hughes, Derry, McKenzie, Jiang, Webb, Banerjee, Paulsen and Singh2015, Reference Myrow, Hughes, McKenzie, Pelgay, Thomson, Haddad and Fanning2016; Palin et al. Reference Palin, Treloar, Searle, Wald, White and Mertz-Kraus2018). A few authors report 650–500 Ma ages from the potential source area in western India: Rathore et al. (Reference Rathore, Venkatesan and Srivastava1996) and Sen et al. (Reference Sen, Pande, Sheth, Sharma, Sarkar, Dayal and Mistry2013) by Ar-Ar dating of early Neoproterozoic Malani volcanics; Rathore et al. (Reference Rathore, Venkatesh and Srivastava1999) by Ar-Ar dating of Jalor Granite; and Sharma et al. (Reference Sharma, Chinnasamy and Biswal2022, Reference Sharma, Biswal and Chinnasamy2023) by Ar-Ar dating of hydrothermal muscovite and U-Th-total Pb dating of monazite, respectively, in Ambaji, western India (Figure 10b). Rathore et al. (Reference Rathore, Venkatesan and Srivastava1996, Reference Rathore, Venkatesh and Srivastava1999) suggest a 550–500 Ma thermo-tectonic event related to the Pan-African orogeny affecting the pre-existing Malani volcanics. Sen et al. (Reference Sen, Pande, Sheth, Sharma, Sarkar, Dayal and Mistry2013) also suggest an Ediacaran-Cambrian age thermal imprint in the Malani volcanics and attribute this to the Malagasy orogeny. De Wall et al. (Reference de Wall, Pandit, Sharma, Schöbel and Just2014) suggest Cryogenian sutures continued from Madagascar to NW India, providing pathways for hydrothermal fluids, causing locally restricted Pan-African thermally reset ages in this region. Tiwari and Biswal (Reference Tiwari and Biswal2019) compare the <650 Ma phase in north-west India to the Kuunga or the Malagasy orogeny and propose it to be either a part of the early Pan-African orogeny or a late pulse of a preceding orogeny.
The sandstones in the Neoproterozoic-early Paleozoic Marwar Supergroup (Nagaur and Jodhpur groups), north-east of the Kutch Basin, record Neoproterozoic-early Paleozoic detrital zircon ages (McKenzie et al. Reference McKenzie, Hughes, Myrow, Xiao and Sharma2011; Lan et al. Reference Lan, Zhang, Li, Pandey, Sharma, Shukla, Ahmad, Sarkar and Zhai2020; Xu et al. Reference Xu, Meert and Pandit2022). However, the number of detrital zircon grains belonging to the Pan-African age range (6 out of 520 grains) is not significant. For the basins of western India, some authors suggest recycled sediment input from the Marwar Supergroup. For the Lower Cretaceous rocks of the Barmer Basin (Rajasthan, India), northeast of the current study area, Beaumont et al. (Reference Beaumont, Burley, Breitfeld, Gould and Clarke2022) suggest recycling from rocks of the Marwar Supergroup. Similarly, Rajak et al. (Reference Rajak, Prabhakar and Banerjee2024a) suggest recycling from the Marwar Supergroup for the Cretaceous Himmatnagar Sandstone of the Cambay Basin (east of the Kutch Basin). Rajak et al. (Reference Rajak, Prabhakar, Banerjee, Dev, George and Tomson2024b) suggest recycled input from the Marwar Supergroup for the <650 Ma detrital zircon ages in the Upper Jurassic–Lower Cretaceous Dhrangdhara Group of the Saurashtra Basin (south of the Kutch Basin). Following the south-westerly directed paleoslope, the late Neoproterozoic-early Paleozoic contribution to the sandstones of the Kutch Basin may have been recycled from the Marwar Supergroup. However, the late Neoproterozoic-early Paleozoic zircon age interval is among the dominant components in the sandstones of the Kutch Basin. But, as discussed above, the Marwar Supergroup carries very limited evidence of detrital zircon grains of this age (1.15% zircon <650 Ma), while <650 Ma detrital zircons constitute ∼40% of total zircon grains in the sandstones of the Kutch Basin. Even considering depletion of old zircons due to metamictization during recycling, this contrast seems too high to attribute the high proportion of late Neoproterozoic-early Paleozoic zircons in the Kutch Basin entirely to recycling from the Marwar Supergroup, thus making it an unlikely source.
Although representing a dominant source in all the analysed samples of the Kutch Basin, the late Neoproterozoic-early Paleozoic source rocks remain to be explored. Potentially, processes that led to the rise of the Median High (see Section 6.a.1) also led to the exposure of Pan-African crystalline rocks and thus fresh input to the basin. These exposures might be either reburied or lost to erosion (cf. Chaudhuri et al. Reference Chaudhuri, Das, Banerjee and Fitzsimons2020). However, the overall maturity of the sandstone samples in terms of quartz versus feldspar and lithic fragments, as well as the stable heavy-mineral assemblages (Chaudhuri et al. Reference Chaudhuri, Schönig, Le Pera, von Eynatten, Chauhan and Lünsdorf2023), implies a significant contribution of recycled material from a basin dominated by Pan-African input. Under this assumption, the sediments may have been transported over long distances, and the south-westerly-directed paleoslope might not be representative of the location of the original source area of the Pan-African input.
The rutile U-Pb ages exhibit dominance of late Neoproterozoic-early Paleozoic source rocks in all three sub-basins (Figure 6). The younger rutile ages are relatively higher in proportion when compared to those of zircon (Figure 4). These may represent cooling ages following the Pan-African zircon-crystallization event or an additional late Pan-African thermal event. The reports of Ar-Ar ages by Rathore et al. (Reference Rathore, Venkatesan and Srivastava1996, Reference Rathore, Venkatesh and Srivastava1999) and Sen et al. (Reference Sen, Pande, Sheth, Sharma, Sarkar, Dayal and Mistry2013), as discussed earlier in this section, support the former. However, de Wall et al. (Reference de Wall, Pandit, Sharma, Schöbel and Just2014) suggest a Cryogenian tectonothermal event in north-west India. The rutile ages >700 Ma are observed in all three sub-basins, with the PIG samples exhibiting a higher proportion compared to KMG and EKG. Further, all PIG samples and AC-23 of EKG exhibit the presence of ages >2100 Ma. Although rare, such old rutile source rocks may have escaped >400°C events related to the Pan-African orogeny and experienced only low-temperature thermal overprints. Therefore, these >700 Ma detrital rutiles in the sandstone samples may have been derived from long-distance transport from source areas unaffected by the Pan-African orogeny or recycled from a pre-existing sedimentary basin.
The age gap between the youngest dated detrital minerals in this study (404 Ma for zircon, 406 Ma for rutile) and the sedimentation age (∼170 Ma) raises curiosity about tectono-thermal events in the source area. The lack of both rutile and zircon U-Pb ages younger than early Devonian indicates the absence of any later tectono-thermal event in the source area reaching metamorphic conditions in the stability field of rutile or producing igneous rocks containing zircon.
7. Conclusions
-
1. The three sub-basins of the Kutch Basin exhibit internal differences in provenance. The contributions of late Paleoproterozoic–early Mesoproterozoic zircon and pre-Neoproterozoic (>700 Ma) rutile distinguish the Pachchham Island Group from the Kutch Mainland and Eastern Kutch Groups.
-
2. A clear provenance change is observed in the late Bathonian to Callovian, most likely caused by a drainage divide related to the rise of the Median High. This cut off the sediment supply from the late Neoproterozoic–early Paleozoic source rocks to the Pachchham Island Group while rerouting these sediments to the Kutch Mainland and Eastern Kutch Groups.
-
3. One of the dominant zircon source rocks to the Kutch Basin, belonging to the late Neoproterozoic–early Paleozoic, could not be traced to the potential source area through analysis of modern river sediment and compilation of literature data. These source rocks must have been entirely eroded or, more likely, recycled from a pre-existing sedimentary basin. In the latter case, the transport direction indicated by the south-westerly-directed paleoslope might not reflect the location of the original sources.
-
4. The absence of either detrital zircon or rutile younger than Early Devonian (∼405 Ma) throughout all samples indicates the absence of younger medium- to high-temperature tectono-thermal events in the entire source region for at least 240 million years until sedimentation in the Kutch Basin in the Middle to Late Jurassic time.
Supplementary material
The supplementary material for this article can be found at https://doi.org/10.1017/S001675682610079X.
Acknowledgements
AC is thankful to the Alexander von Humboldt Foundation, Germany, for supporting this research through the Humboldt Research Fellowship for Postdoctoral Researchers. The authors are grateful to Gaurav Chauhan, Suraj Bhosale, Andreas Kronz and Irina Ottenbacher. The use of equipment in the Goettingen laboratory for correlative light and electron microscopy (GoeLEM–www.mineralogie.uni-goettingen.de) is gratefully acknowledged. Thoughtful and constructive comments from Inês Pereira and an anonymous reviewer, as well as careful editorial handling by Peter Clift, greatly improved the manuscript.
Competing interests
The authors declare none.



 Open access

