

INTRODUCTION
Cholera is a disease of global importance, accounting for an estimated 3–5 million cases and 100 000–120 000 deaths each year [1]. Cholera is endemic in many countries in sub-Saharan Africa and south Asia, and causes explosive epidemics in populations with poor water quality and sanitation [Reference Gaffga, Tauxe and Mintz2, Reference Siddique3]. In 1991, the emergence of cholera in Latin America led to over 1 million cases and 9170 deaths in the first 3 years, after which it slowly disappeared [Reference Gaffga, Tauxe and Mintz2, 4]. An outbreak of cholera in a Rwandan refugee camp in 1994 was responsible for 58 000–80 000 cases and 23 800 deaths in the first month alone [5].
Haiti, the least developed and poorest nation in the Western hemisphere [6], was devastated by a massive earthquake in January 2010 that killed at least 200 000 people, left some 1·3 million homeless, and badly damaged the nation's health and sanitation infrastructure [Reference Walton and Ivers7]. The first reported occurrence of cholera in Haiti was confirmed on 22 October 2010 [8]. The combination of poor sanitary conditions, weak health infrastructure, and lack of immunity presaged an extensive epidemic.
During the Haiti cholera epidemic, we collaborated with officials at Haitian and international health organizations to respond to the burgeoning epidemic. To inform response planning, we developed a series of models with which to project the future course of the outbreak. Rapid projections of the extent of epidemics are needed to plan for adequate resources for patient treatment and disease prevention. Previous studies have assessed cholera outbreak dynamics either in a theoretical context [Reference Codeço9–Reference Bertuzzo13] or in the wake of an actual outbreak [Reference Capasso and Paveri-Fontana14–Reference Bertuzzo16]. Retrospective outbreak models have the benefit of more complete data and may yield important insights into cholera dynamics, but do not contribute to real-time mitigation efforts. We used four successive models as more data became available to make six iterative case projections that were used by public health agencies to project response needs during the Haitian cholera outbreak. Projections were made for hospitalized and total cholera cases seen by healthcare personnel over the first year of the epidemic.
METHODS
Cholera surveillance in Haiti
Publicly available daily cholera reports from the website of the Haitian Ministère de la Santé Publique et de la Population (MSPP) were used for all surveillance data [17]. Starting on 30 October 2010, MSPP began reporting the daily and cumulative number of hospitalizations (cases requiring overnight stays in a healthcare facility) and deaths caused by profuse acute watery diarrhoea; from 16 November, MSPP also listed total cases (all profuse acute watery diarrhoea cases seen by healthcare personnel). Data were reported for each of ten departments and for the Port-au-Prince metropolitan area. On 1 December 2010, MSPP began to provide updated retrospective data on hospitalizations, total cases, and deaths by department dating back to the beginning of the epidemic on 20 October. Reporting lag was often observed in the data, resulting in adjustments to case and hospitalization totals as previously unreported cases were added to prior dates. To correct for the lag, adjusted numbers were culled from MSPP-posted updated epidemic curves.
Model 1: Historical analogies
This projection was prepared on 25 October 2010, 5 days after the first reported cholera case in Haiti, before any surveillance data from Haiti were available. Given the large internally displaced population in Haiti following the 12 January 2010 earthquake, this approach separately projected cholera cases in displaced and non-displaced populations. We used an estimated population for Haiti of 10 million persons, 8·63 million of which were thought to be non-displaced [18]. To estimate an attack rate for the displaced population, we used population and cholera case counts in African displaced persons camps that experienced cholera outbreaks [Reference Tauxe19–Reference Swerdlow24]. We assumed that all the estimated cases for displaced populations would occur in the first year.
To estimate an attack rate for the non-displaced population, we used surveillance data reported to the Pan American Health Organization from Latin American countries from 1991 to 1995. We thought the Latin American epidemic was most suitable, as it occurred in countries without population immunity, like Haiti, and unlike outbreaks in many African and Asian countries. In a previous study, among several indices examined, infant mortality was found to correlate best with the cumulative incidence of cholera in Latin America [Reference Ackers25]. We fitted a quadratic regression curve between infant mortality rates and the natural log of the 5-year cholera attack rates for Latin American countries reported in that study after excluding an outlier (Paraguay) because there had only been three reported cases in that country [Reference Ackers25]. We then used the infant mortality rate in Haiti in 2009 [26] to project the 5-year cumulative case incidence rate for Haiti. Based on experience with previous outbreaks we made the assumption that 75% of the projected 5-year case-load would occur in the first year. This projection did not include the expected number of hospitalizations.
Model 2: Peruvian extrapolation
This projection was released to international aid organizations on 29 November 2010. Peru was the first country affected in the Latin American cholera epidemic and had the highest number of cases and deaths [Reference Ackers25]. Data from the first 4 full weeks of the cholera epidemic in Haiti were compared with parallel data from Peru in 1991 [Reference Ries27, 28]. To estimate the expected number of hospitalized and total cases of cholera in Haiti during the first year, we used the proportion of hospitalized cases in Peru during the first year which were reported during the first 4 full weeks, and the proportion of total cases in Peru which were hospitalized. By assuming that these proportions would be similar in Haiti, we were able to project total cases and hospitalized cases in Haiti over the first year of the epidemic, based on the first 4 weeks of surveillance data.
Model 3: Artibonite extrapolation
This projection was also released to international aid organizations on 29 November 2010. Artibonite was the first department in Haiti to be affected by cholera and up to 19 November had reported the majority of the country's cases (59·5%), hospitalizations (54·8%) and deaths (52·2%). Based on observed surveillance data and previous cholera epidemic curves, a doubling of cases and hospitalizations in Artibonite over 1 year seemed appropriate [Reference Bradley15, Reference Bartels29, Reference Legros30]. For this approach, we assumed that the outbreak in Artibonite would result in twice as many cases and hospitalizations by the end of 1 year as had already occurred in the first 31 days, and that other departments would be similarly affected. The observed attack rate and hospitalization rate in Artibonite as of 19 November were multiplied by two and applied to the entire population of Haiti in order to produce hospitalization and total case projections for the first year of the outbreak.
Model 4: Spatial-temporal epidemic model
The projections from this model were first prepared on 15 December 2010, and have subsequently been updated using new surveillance data. Updated projections were released to international aid organizations on 28 January 2011 and 4 March 2011. A modified SIR (susceptible-infected-removed) model with an environmental (water) component was built to predict the future extent of the outbreak. Separate epidemic curves were constructed for each of the 10 departments and Port-au-Prince. Population data were obtained from the 2009 population estimates of l'Institut Haïtien de Statistique et d'Informatique [31], and birth and death rates were obtained from the 2009 CIA World Factbook [26]. As there is no recent experience with cholera in the Caribbean, we did not attempt to model seasonal changes.
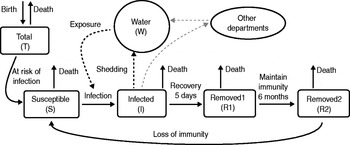
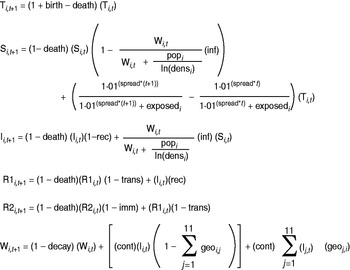
The spatial-temporal epidemic model can be represented by a series of difference equations with a daily time step. These equations define total population (T), susceptible population (S), infected population (I), two categories of removed population (R1, R2), and level of water contamination (W), and vary by department i at time t (see Figs 1 and 2). All parameter values can be found in Supplementary Table S1.
Model of cholera transmission for a single department. Infected individuals shed Vibrio into the water component which leads to further infection of susceptibles. A small amount of inter-departmental cross-contamination can occur. The two removed groups (R1, R2) represent the maintenance of protective immunity for at least 6 months following infection, after which removed individuals begin to slowly lose immunity and return to the susceptible population.
Difference equations used for the spatial-temporal model with daily time step, describing the conditions in department i at time t+1. The compartments are as follows: total population (T), susceptible population (S), infected population (I), recently recovered population (R1), other recovered population (R2), water contamination (W). For further explanation and values of parameters, see Supplementary Table S1.
The number of susceptible persons that were infected per day depended on the total number of susceptible persons, the estimated level of contamination of the water, and an infectivity term. Infected people were assumed to remain infectious for an average of 5 days before being moved to the removed population [Reference Hartley, Morris and Smith10, Reference Bertuzzo16]. The removed population remained fully immune for 6 months before slowly losing immunity at the same rate as measured in a large-scale vaccine study [Reference Clemens32–Reference Van Loon34]. All populations were assumed to have the same birth and death rates, and all newborns were added to the susceptible population.
The susceptible population is a temporally dependent proportion of the total population which is not infected or removed. Hospitalizations (H) were estimated as a constant proportion of the infected population, based on the proportion of infected individuals who seek care (care) and the proportion of those individuals seeking care who are hospitalized (hosp).
The estimated quantity of Vibrio in the water supply each day was dependent on the size of the infected population and a contamination term. A very small amount of interdepartmental water mixing was allowed through infected populations in neighbouring departments and a neighbour strength term. Vibrio was assumed to survive in the aquatic environment for an average of 30 days [Reference Hartley, Morris and Smith10, Reference Neilan12].
The proportion of infected people who were symptomatic and sought medical care was first estimated as 20% [Reference Wallace and Kohatsu35], then was adjusted to 40% using data from the 1991 Peru cholera epidemic [Reference Swerdlow36]. Surveillance data from the first 4 weeks of the outbreak in Haiti indicated that about 40% of all reported cases were hospitalized.
The department-specific models were initiated by a parameter which set initial infected population as a fraction of the number infected during the first week cases were reported. Initial water contamination in a department was set as a fraction of the amount of Vibrio shed on the first day a case was reported. Early model testing revealed that departments affected later in the epidemic exhibited a slower increase in the epidemic curve, and model fit was improved by estimating a separate water initiation parameter for these departments.
Not all people are expected to be uniformly exposed to the cholera epidemic; people who have access to clean water and safe sanitation, or are geographically isolated from the outbreak may be effectively protected from infection. This necessitated the inclusion of parameters that represent the proportion of a department's population effectively at risk of infection (exposed) and how that proportion changes over the course of the epidemic (spread). Early model testing showed that rates of disease spread within departments were positively associated with population density, and scaling water infectivity by log population density [ln(densi)] was shown to improve model fit.
The model parameters were fitted to the reported number of weekly hospitalizations from the most recent surveillance by minimizing error between the observed and modelled data. Model fitting was performed through a repetitive optimization algorithm that simultaneously tested multiple parameters, starting with a wide range of possible parameter values and gradually shrinking these ranges to reach the best-fit model. Concurrent fitting of all model parameters proved to be both computationally burdensome and unnecessary. Certain parameters were highly collinear: changing two or more parameters often produced similar model results based on antagonistic effects on model dynamics. The model was therefore not highly sensitive to changes in certain parameters; consequently, to ease computational burden, certain parameters (geographical connectedness, level of water contamination at the start of each department's outbreak) were fixed at values fitted from early model iterations (see Supplementary Table S1).
Several methodological changes were made between the three iterations of the model. The first iteration, performed on 15 December 2010 sufficiently modelled short-term projections, but its long-term projections seemed unrealistically low. The second iteration on 28 January 2011 fixed environmental Vibrio decay at a previously determined rate, allowed for loss of immunity, and added a term which increased population exposure over time to account for the gradual environmental spread of cholera. By the third iteration on 4 March there was ample surveillance data to show that dynamics were quite different among the 11 departments. Since the initial population exposure parameter made a large difference on early outbreak growth, the third iteration allowed for individual fitting of this parameter by department, and all projections were corrected to account for observed surveillance data.
Confidence intervals were obtained through multivariate sensitivity analysis. All model parameters (except demographic variables) were varied randomly across a uniform distribution ranging from 50% to 150% of the estimated value. For each of the three model iterations, 1000 samples of sets of parameter values were taken and used to project hospitalizations and total cases. The 95% confidence intervals of these 1000 projections demonstrate possible projection error caused by incorrectly estimated parameter values. These confidence intervals were calculated well after initial projections and were not part of the estimates shared with partner health agencies. The models were run using R version 2.8.1 (R Foundation for Statistical Computing, Austria).
RESULTS
Surveillance data within Haitian departments after one full year of the epidemic is shown in Table 1. After 4 weeks of the cholera outbreak, 20 487 hospitalized cases had been reported in Haiti. That figure grew to 124 068 after 16 weeks and 256 130 after 1 year. The number of total cases reported was 50 795 after 4 weeks; 230 416 after 16 weeks; and 474 561 after 1 year. The six projections described estimated that 162 664-247 230 hospitalizations and 105 047-651 780 total cases would occur within the first year (Table 2).
Extent of Haiti cholera epidemic by department after one full year, MSPP surveillance data
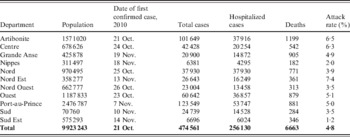
MSPP, Haitian Ministère de la Santé Publique et de la Population.
Projected numbers of hospitalized and total cholera cases in Haiti for 1 year after the start of the epidemic
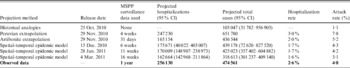
MSPP, Haitian Ministère de la Santé Publique et de la Population.
Model 1: Historical analogies
In six separate cholera outbreaks in African displaced persons camps of limited duration, 9743 cases occurred among a combined population of 230 193 yielding an attack rate of 4·23%. Applied to Haiti's estimated displaced population, this projected to 57 992 cases in the first year. Haiti's infant mortality rate was 60 deaths/1000 live births; this translated to an estimated 5-year attack rate among non-displaced persons of 0·73% or 62 740 cases, with 47 055 of those cases occurring in the first year. Taken together, this approach projected 105 047 total cholera cases over the first year of the epidemic and a population-based attack rate of 1·1%.
Model 2: Peruvian extrapolation
In the Peruvian cholera epidemic, 8·9% of cholera hospitalizations reported during the first year occurred in the first 4 weeks. The ratio of total cases to hospitalizations after 1 year was 2·64. Applying those ratios to the 20487 hospitalizations reported in Haiti during the first 4 weeks yielded an estimated 247230 hospitalized and 651 780 total cases of cholera during the first year of the epidemic.
Model 3: Artibonite extrapolation
As of 19 November 2010 there had been 12 808 hospitalizations and 33855 total cholera cases reported from the Artibonite department, representing a hospitalization rate of 1·0% and an attack rate of 2·6% for the Artibonite department. Doubling these rates (2·0% hospitalization rate, 5·2% attack rate) and applying them to the total Haitian population yielded projections of 165 154 hospitalizations and 436 544 total cases for the first year of the epidemic.
Model 4: Spatial-temporal epidemic model
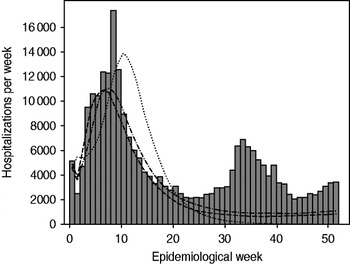
The 15 December 2010 projection used surveillance data for the first 6 weeks (20 October 2010 through 30 November 2010) and projected 175 671 [95% confidence interval (CI) 40 022-403 007] hospitalizations and 439 178 (95% CI 72 620-827 520) total cases to occur during the first year of the epidemic. It predicted that the epidemic was still increasing and would peak in week 11 of the epidemic (29 December 2010 to 4 January 2011) (Fig. 3). The 28 January 2011 projection used the first 11 weeks of surveillance data (up to 4 January 2011) and projected 170 009 (95% CI 133 678-294 401) hospitalizations and 425 023 (95% CI 322 176-764 157) total cases. It suggested that the epidemic peaked in week 8 and the number of cases would steadily decline. The 4 March 2011 projection used the first 16 weeks of surveillance data (up to 8 February 2011) and projected 162 664 (95% CI 142 968-211 864) hospitalizations and 318 613 (95% CI 301 237-409 140) total cases. Department-specific projections are shown in Figure 4.
Observed cholera hospitalizations per week in Haiti compared to three projections of the spatial-temporal model. ▪, Observed; · · · · · · ·, 6-week model; · – · – ·, 11-week model; – – –, 16-week model.
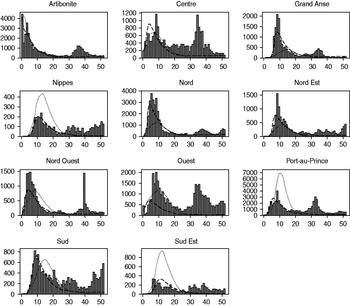
Weekly projections of hospitalizations by department for the first spatial-temporal model iteration (6-week model) and the third spatial-temporal model iteration (16-week model) compared to observed hospitalization data for 1 year. Weekly number of hospitalizations are on the y axis, and epidemiological week is on the x axis. ▪, Observed; · · · · · · ·, 6-week model; – – –, 16-week model.
DISCUSSION
During the course of a massive cholera epidemic in Haiti, several different types of projections were made with limited but increasing data. From the very early days of the epidemic, these projections were shared with international aid organizations for planning epidemic control response efforts. Needing projections despite the paucity of in-country data at the outset, the early models were simplistic, but still provided useful if rough approximations. The reported number of hospitalizations (n=256 130 as of 18 October 2011) and total cases (n=474 561) within the first year of the outbreak fell near the ranges of estimated number of hospitalizations (range 162 664-247 230) and total cases (range 105 047-651 780) provided in the six projections. These six projections helped guide epidemic response efforts. Model 1 provided MSPP with a basis on which to plan efforts, highlighting the large size of the predicted epidemic and the need to procure and ship more medical supplies. Models 2 and 3 provided increased case estimates, reinforcing the need to distribute water disinfection tables and to strengthen public education and other preventive measures. The more detailed projections by department of model 4 were used to estimate treatment needs and supplies on a more targeted geographical basis, to analyse the gap between estimated and existing facilities and supplies, and to fund contracts to temporarily expand facilities in the departments where this gap was greatest.
Each model had limitations. The first three models were constructed early in the epidemic and used no or little Haiti surveillance data, relying heavily on experiences from previous cholera epidemics elsewhere. This assumed that the epidemic strain in Haiti was similar to other strains with respect to virulence and transmissibility and that sanitary conditions in Haiti were also similar to those in settings of previous epidemics. Model 1, which used infant mortality rate as a proxy for sanitary conditions, noticeably underestimated the number of cholera cases that would occur in the first year of the outbreak. The infant mortality rate used for Haiti predated the 2010 earthquake, and thus did not capture the damage to Haiti's health and sanitation infrastructure. As Haiti's infant mortality is higher than that of all Latin American countries included in the original analysis, this model depended on extrapolation, rather than interpolation, which may have diminished its accuracy. Models 2 and 3 had the benefit of 4 weeks of Haiti surveillance data, but still had to make the considerable assumption that the course of the epidemic in Haiti, and in the Artibonite department (model 3), would be comparable to that of previous epidemics.
While the spatial-temporal model did simulate temporally and spatially unique epidemics in each department, it did not incorporate geographical differences in sanitary conditions, displaced populations, or healthcare settings which would have better explained cholera spread by department. Figure 4 shows how the 6-week model overestimated hospitalizations in some departments (Nippes, Port-au-Prince, Sud Est) while underestimating hospitalizations in others (Grande Anse, Nord, Nord Est). The 16-week model, which added a unique department exposure parameter, was better able to capture outbreak dynamics. The lack of a seasonal component in this model proved to be an important limitation. The epidemic peaked in December 2010, and all departments reported markedly declining cholera incidence for the first several months of 2011. It is not clear whether this waning of cases was due to extensive intervention efforts, the exhaustion of the number of susceptible persons, or to seasonal fluctuations in transmission; however, this rapid decline did lead to reduced projections in the 11-week and 16-week models. A secondary peak occurred during June 2011 in association with heavy rainfall. Some areas also exhibited a third, smaller peak around September–October 2011, coinciding with the autumn rainy season. The lack of prior knowledge on seasonality of cholera in Haiti led to an underestimate of the extent of the epidemic. Cholera incidence in other nations has also been documented to increase following periods of heavy rainfall and flooding [Reference Emch37]; the Haiti data similarly supports the inclusion of a projected precipitation parameter for future models of cholera in Haiti and elsewhere. Despite these limitations, the spatial-temporal model did adequately assess which departments would be more severely affected by the epidemic: Spearman's correlation coefficient comparing predicted to observed hospitalizations was 0·61 for the 6-week model, 0·80 for the 11-week model, and 0·62 for the 16-week model.
All projections which relied upon surveillance data were limited by several issues affecting cholera reporting. Reporting was not performed in a consistent fashion in different departments or healthcare facilities within departments. Some departments listed little or no difference between reported numbers of cases seen and hospitalizations; much of this anomaly was later determined to be the result of all cases being listed as hospitalized cases in some departments (N. Schaad, personal communication). Acute watery diarrhoea cases caused by a different aetiology would have been misclassified by the surveillance system as cholera; conversely, surveillance would not have captured true cholera cases in patients who never sought medical care. The attributes of the surveillance system may have changed over time, and reporting lag resulted in retroactive changes to previously reported data.
There have been other attempts to predict the course of the Haiti cholera epidemic. On 16 March 2011 Andrews & Basu [Reference Andrews and Basu38] projected a total of 779 000 cases (95% CI 599 000-914 000) to occur between 1 March 2011 and 30 November 2011, but this projection includes a large proportion of cases which are assumed to not be reported in several departments. On 7 March 2011 Tuite et al. [Reference Tuite39]. projected the epidemic peaks in individual departments as first occurring in Artibonite around February and not happening in Sud, Grande Anse, and Nippes until almost a year after the outbreak's start in October 2010. These two models focused on details such as varying Vibrio quantity shed by disease severity and included a component for recently shed ‘hyperinfectious’ Vibrio; our epidemic model was simpler but more closely reflected observed epidemic trends, as the model was fitted to incident (not cumulative) surveillance data.
Despite the differences in methodology, all models described in this study were useful in projecting the overall extent of the Haiti cholera epidemic. The initial absence of data from Haiti was handled by putting the epidemic into the context of previous similar ones, and later by using historical experience to extrapolate from early Haiti surveillance data. As the epidemic progressed, reporting of standardized daily surveillance data at a sub-national level allowed construction and updating of more precise mathematical models that generated department-specific projections. All of these projections were used by Governments and international aid organizations in real-time for critical resource procurement, allocation and planning activities. These approaches could be applied in many emerging disease outbreaks and provide invaluable benefits to real-time disease control efforts.
SUPPLEMENTARY MATERIAL
For supplementary material accompanying this paper visit http://dx.doi.org/10.1017/S0950268812001793.
ACKNOWLEDGEMENTS
We thank David Swerdlow, Michael Washington, and Nathaniel Hupert for their vital roles in organizing and steering modelling efforts. We also thank Jacqueline Burkholder and the CDC Haiti Cholera Situation Awareness Team for their invaluable surveillance and data management work.
DECLARATION OF INTEREST
None.


