


1 INTRODUCTION
El Mirón Cave in Cantabrian Spain is a deeply stratified archaeological site covering periods from the Middle Paleolithic to the Modern Period. After more than two decades of archaeological and chronological research, critical questions regarding inter-area correlations, and the reliability of the published radiocarbon record remained. Building on the 93 radiocarbon dates previously published (Baca et al. Reference Baca, Popović, Baca, Lemanik, Doan, Horáček, López-García, Bañuls-Cardona, Pazonyi and Desclaux2020; Straus and González Morales Reference Straus and González Morales2003, Reference Straus and González Morales2007b, Reference Straus and González Morales2010, Reference Straus and González Morales2016, Reference Straus and González Morales2018a; Straus et al. Reference Straus, González Morales, Higham, Richards and Talamo2015b), the chronostratigraphy was re-evaluated using modern analytical methods, including Bayesian modeling. The aims were (1) to model the most likely radiocarbon age ranges for the many Paleolithic and post-Paleolithic archaeological strata, and (2) to propose chronological correlations among levels excavated in several different areas within the cave between 1996–2013. The findings presented here are the result of an intensive dialogue between Hopkins and Straus in the development and evaluation of Hopkins’ analytical research conducted at Straus’ request.
El Mirón is a very large cave located in the montane interior of the Province of Cantabria near the border of Vizcaya in northern Spain (43°14′44″ N, 3°27′9″ W, 260 m a.s.l., European Datum ETRS89), ca. 20 km from the present shore at the mouth of the Asón River, equidistant between the cities of Santander and Bilbao (Figure 1). The principal excavations were conducted in the spacious (30 m deep × 8–16 m wide × 13–20 m high), sunlit vestibule, with minor ones in the dark inner cave and on the narrow passage sloping upward between the vestibule and inner cave (Figure 2). The vestibule excavations consisted of an outer area (“Cabin”: 9.25 m2) and a rear area (“Corral”: maximally 12.5 m2) connected by a 9-m-long × 0.5-1-m-wide Mid-Vestibule Trench, plus a contiguous 4 m2 area in the SE corner of the vestibule rear where a Magdalenian-age human burial was uncovered. The outer vestibule area (OV) revealed a sequence of layers normatively attributed to the Magdalenian, Azilian, extremely poor and undiagnostic Mesolithic, Neolithic, Chalcolithic and Bronze Age (Figure 3, A). The mid-vestibule trench (MV) yielded Magdalenian, Azilian, and Neolithic levels (the former only in a 2–1 m2 sondage in its center) (Figure 3, B). The vestibule rear (VR) produced Mousterian, virtually sterile Early Upper Paleolithic, Gravettian, Solutrean, Magdalenian, and possible Azilian and Mesolithic layers (Figure 3, C). The first three cultural periods were only uncovered in a 2 m2 sondage dug from the base of a looter pit and is separated from the rest of the VR excavation by a large (ca. 2×1×1 m) block, with the only (partial) connection being a 0.5 m2 unit dug at the southern end of the block. Traces of Magdalenian (and Azilian and post-Paleolithic) occupations were found in the inner cave (IC) and in small remnant deposits above the eroded surface of the colluvial-alluvial sedimentary ramp. The site has been the subject of several publications, notably two monographs that respectively provide comprehensive background information and the post-Paleolithic record (Straus and González Morales Reference Straus and González Morales2012a), and a full description of the Magdalenian burial and its context (Straus et al. Reference Straus, González Morales and Carretero2015a), as well as articles on specific periods (e.g., notably Middle Paleolithic and EUP: Marín-Arroyo et al. 2018; Gravettian: González Morales and Straus Reference González Morales, Straus, Las Heras, Lasheras, Arrizabalaga and Rasilla2013; Solutrean: Straus and González Morales Reference Straus and González Morales2009; Straus et al. Reference Straus, González Morales, Gutiérrez Zugasti and Iriarte2011, Reference Straus, González Morales, Marín Arroyo and Iriarte Chiapusso2012; Magdalenian: Straus et al. Reference Straus, Fontes, Domingo and González Morales2016, Reference Straus, Geiling and González Morales2018; Straus and González Morales Reference Straus and González Morales2012b, Reference Straus, González Morales, Straus and Langlais2020; Straus et al. Reference Straus, González Morales and Steward2008, Reference Straus, González Morales and Fontes2014; Upper Paleolithic in general: Straus and González Morales Reference Straus and González Morales2019; rock art: García-Diez et al. Reference García-Diez, González Morales and Straus2012; Azilian: González Morales and Straus Reference González Morales and Straus2012; Neolithic: Peña-Chocarro et al. Reference Peña-Chocarro, Zapata, Iriarte, González Morales and Straus2005a, Reference Peña-Chocarro, Zapata Peña, García Gazólaz, González Morales, Sesma Sesma and Straus2005b; all with references).
Map showing location of El Mirón Cave in Cantabrian Spain.

Map of El Mirón Cave showing areas excavated and radiocarbon dated, as well as prior looter pit, location of human burial, alluvial-colluvial slope (“Ramp”), and down-slope directions (L. G. Straus & R. L. Stauber, cave topography by E. Torres).

Semi-schematic profile drawings for the Outer Vestibule (A), Middle Vestibule (B), and Vestibule Rear (C) with tentative cultural attributions: B = Bronze Age, C = Chalcolithic, N = Neolithic, Ms = Mesolithic, Az = Azilian, UM = Upper Magdalenian, MM = Middle Magdalenian, LM = Lower Magdalenian, IM = Initial Magdalenian, S = Solutrean, Mx = Mixed, G = Gravettian, St = Culturally (almost) sterile, MP = Middle Paleolithic (L. G. Straus & R. L. Stauber).

The OV area, with essentially flat stratigraphy and no large blocks, poses relatively few problems of dating coherence among its levels, although numerous, large pits in the post-Paleolithic deposits do indicate significant anthropogenic mixture in the uppermost levels. The lowest levels (18-21) were reached only in a ¼ m2 mini-sondage, so their cultural attributions are tenuous. This also holds for the lowest level (313) in a 1×1 m sondage dug in the center of the MV trench, where diagnostic artifacts were absent. There is a slight double slope among the levels uncovered in the VR, as they are banked up atop the underlying, culturally sterile alluvial-colluvial deposit. In addition, this area has many medium- to large-size blocks (plus the huge block that separates this area from the burial area) and there is evidence of intensive pit/hearth construction and possible wall construction during Late Glacial (i.e., Magdalenian) times (Nakazawa et al. Reference Nakazawa, Straus, González Morales, Cuenca and Caro2009; Straus and González Morales Reference Straus, González Morales, Kornfeld, Vasil’ev and Miotti2007a, Reference Straus, González Morales, Valde-Nowak, Sobczyk, Nowak and Źrałka2018b). Originally defined in one square (V8) adjacent to the huge block, the thin Magdalenian levels here were seen to alternate between scree (éboulis)-rich and scree-poorer ones that were hard to follow across the whole area as excavators during successive dig seasons tried to uncover “living surfaces”, especially because of the slopes and intervening blocks and prehistoric features. This could have led to excavation errors in the level designations between different squares in the 9.5 m2 “Corral” area. For all these reasons, a thorough, objective review of the dating methods and critical, statistical analyses of all the dates were deemed necessary.
El Mirón has by far the largest number of radiocarbon dates from any prehistoric site in the rich Cantabrian region. With a cultural sequence similarly long as those of the classic sites of Cueto de la Mina/La Riera in Asturias, El Castillo and El Pendo caves in Cantabria, Santimamiñe in the Spanish Basque Region, and Isturitz in the neighboring French Basque Country — all of which were first excavated in the early 20th century — El Mirón adds to a major regional record of (especially Upper) Paleolithic sites and, for the first time, provides significant evidence of cave habitation in this region (as opposed to funerary use) during the Neolithic, Chalcolithic and Bronze ages. The most significant findings at El Mirón are the presence of the early alternating use of the cave by (presumed) Neanderthals and carnivores (Marín-Arroyo et al. 2018); specialized hunting-camp visits to the site during Solutrean times; repeated, intensive, multipurpose occupations during the Initial, Lower and Middle Magdalenian with abundant works of portable art, rock art and the first human burial of this age ever found on the Iberian Peninsula — the analysis of whose DNA provided key evidence for the reconstruction of the Last Glacial human population of Europe (Fu et al. Reference Fu, Posth, Hajdinjak, Petr, Mallick, Fernandes, Furtwängler, Haak, Meyer and Mittnik2016); and some of the earliest, complete evidence of the origins of food- and ceramic-producing Neolithic adaptations in northern Atlantic Spain.
2 THE RADIOCARBON RECORD
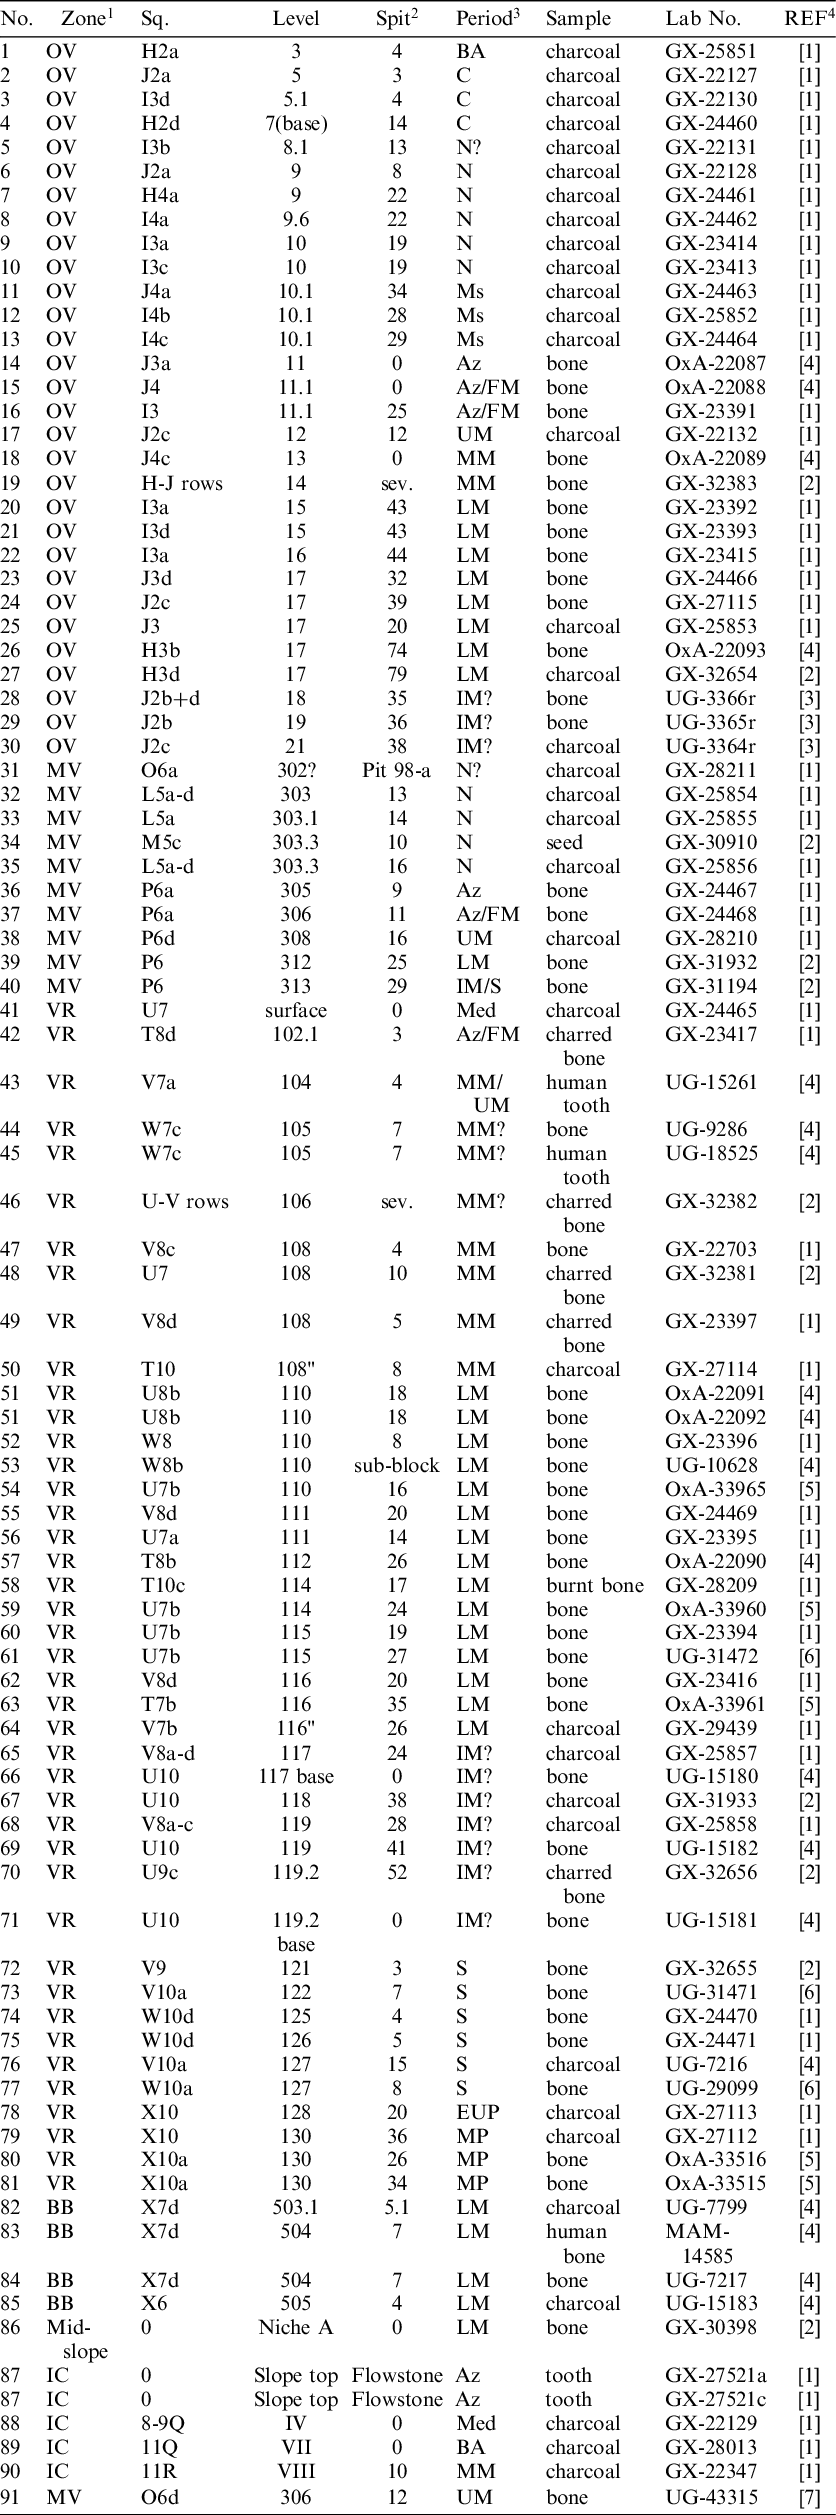
Samples for radiocarbon dating were collected from the beginning of the El Mirón excavations (Table 6), resulting in a total of 93 measurements (Table 7). Over the years, different materials and pretreatment protocols were used. Samples were pretreated and dated at Geochron Laboratories, the Center for Applied Isotope Studies (CAIS) at the University of Georgia, and the Oxford Radiocarbon Accelerator Unit (ORAU) with respective lab-code prefixes “GX”, “UG”, and “OxA”. The “Red Lady” fibula was pretreated at the Max Planck Institute in Leipzig and dated at the Curt Engelhorn Center in Mannheim (MAM).
2.1 Material and Pretreatment
Bone collagen was extracted from 44 faunal fragments and one human fibula (Table 7). Both Geochron and CAIS demineralized the bone powder in hydrochloric acid (HCl) before gelatinizing the sample in lightly acidic water according to Longin (Reference Longin1971). The solution was filtered and dried (evaporation or freeze-drying). Minor variations can be found between individual samples regarding the duration of treatment and whether demineralization occurred in vacuo or not. All bone samples at ORAU were treated following their routine ultrafiltration protocol as described by Brock et al. (Reference Brock, Higham, Ditchfield and Ramsey2010). Similarly, the human fibula was ultrafiltered at the Max Planck Institute in Leipzig following Talamo and Richards (Reference Talamo and Richards2011, Method C).
Three teeth were radiocarbon dated: one human deciduous premolar (no. 43/UG-15261) and one human canine (no. 45/UG-18525) at CAIS, and a faunal tooth (no. 87/GX-27521) at Geochron. All three samples were cleaned in an ultrasonic bath, crushed, demineralized in 1M HCl, and gelatinized following Longin (Reference Longin1971). In addition to dentin (GX-27521a), the faunal tooth also had its bioapatite dated via carbon dioxide (CO2) released and collected during demineralization (GX-27521c).
Geochron laboratories treated a total of five “charred” bone samples: GX-23417 (no. 42), GX-32382 (no. 46), GX-32381 (no. 48), GX-23397 (no. 49), GX-32656 (no. 70). All of these were treated with acid-base-acid (ABA) solutions, using 1M HCl and 0.1M sodium hydroxide (NaOH). The surviving material was combusted for CO2 extraction. It is worth noting that Geochron’s report for GX-32656 (no. 70) describes the treatment of charred bone, but subsequently states that “charcoal” was combusted for dating. By contrast, GX- 28209 (no. 58) was described as “burnt bone”, while all treatment information describes the dated material as “charcoal”, and the sample as cleaned in 1M HCl (hot) before combustion.
All regular charcoal samples were pretreated with ABA, which used 1M HCl and 0.1M NaOH at Geochron, and 5% HCl (≈1.4M HCl) and “diluted” NaOH at CAIS. The same procedure was also applied to the dated seed: GX-30910 (no. 34).
While all laboratories reported IRMS measured δ 13C values with their radiocarbon dates, further pretreatment results were only available for 18 14C measurements (i.e., 17 samples). ORAU provided information on sample size pretreated, pretreatment yield, C/N ratio, and δ 15N for all their bone samples (total: 12 dates). CAIS reported C/N ratios for El Mirón dates since 2014 (4 dates only, no. 91/UG-43315 was too small), and δ 15N since 2017 (3 dates). Both UG-31472 (no. 61) and UG-31471 (no. 73) further contain notes on sample weight. However, the considerable size suggest that this was the amount of bone material submitted rather than pretreated, thus without collagen yield this measurement remains of little value for assessing dating reliability. By contrast, UG-43315 (no. 91) results include both pretreated sample weight and collagen yield. Mannheim measured the C/N ratio of the dated bone collagen in addition to the aforementioned δ 13C. By contrast, Geochron did not measure or record any additional information. Though unfortunate, this was at the time common practice for many laboratories around the world.
2.2 Measurement Technique
The published radiocarbon data set is comprised of 61 AMS (59 samples), and 32 conventional measurements (32 samples). Of the latter, 9 measurements had an extended counting period to account for the lower 14C concentrations resulting from sample size or age. Overall, the shift towards AMS dating is a reflection of radiocarbon dating practice and economic considerations. The last conventionally measured dates for the El Mirón Project were obtained in 2006. Conventional 14C measurements tend to perform less well with decreasing radiocarbon concentrations compared to AMS dating. This is also reflected in the measurement method distribution at El Mirón. Generally, very small samples and very old samples were AMS dated. For example, 64% of radiocarbon dates between 15–20k BP were AMS dates, compared to 100% of those >20k BP.
2.3 Previously Published Radiocarbon Data: Errata
While reanalyzing the previously published radiocarbon data, we came across some publication errors, which need correction. Straus and González Morales (Reference Straus and González Morales2003) had several samples listed with incorrect material identifications: GX-23391 is bone collagen (not charcoal); GX-22132 is charcoal (not bone collagen); GX-23392 is bone collagen (not charcoal); and GX-27521c is tooth collagen (not charcoal). Some more nuanced discrepancies affect GX-23417, GX-23397, and GX-28209. They were originally published as bone collagen, but their pretreatment descriptions suggests, and the date reports state, charred bone for the first two, and charcoal from a burnt bone for the latter (details in Material and Pretreatment). In the same publication, the following samples were listed under the wrong measurement method: GX-23393 was conventionally dated (not AMS); GX-23415 was an AMS date (not conventional); and GX-27115 was conventionally dated without extended counting time.
3 METHOD
3.1 Assessing Dating Reliability
The quality assessment of each radiocarbon measurement was based on three main components: (1) the radiocarbon dating process (pretreatment, measurement, quality control data), (2) the inbuilt age of the sample dated, and (3) the certainty of association. While the first was based on recent innovations in radiocarbon dating, the latter two were taken from Waterbolk (Reference Waterbolk1971). His quality indicators have proven to be invaluable in assessing the suitability of material for archaeological questions (Table 2). The “Risk” factor was subsequently calculated by multiplying the “Inbuilt Age” by the “Certainty” factors (Table 7).
3.1.1 Date Quality
Pretreatment information and results can provide crucial information on whether a measurement is unreliable. Three main factors were considered to rank each date on a scale of 1–5 (Table 1): (1) what material was dated, (2) how well suited is the pretreatment applied, and (3) are there any observations during the radiocarbon dating process that would question the reliability of the result.
Overview of date quality indicators used to rank the reliability of radiocarbon pretreatment and measurement.

First and foremost, we had to assess whether a radiocarbon date was obtained on a single entity (e.g., single bone or charcoal) or a bulk sample (e.g., several, possibly unrelated bone or charcoal fragments). Conventional radiocarbon dating required samples of considerable size (≈10 g), thus combining material for dating was sometimes the only way to obtain a measurement. In such cases, the final 14C age represents the combination of 14C concentrations that each sub-sample contributes, and may not represent any of those sub-samples’ true age. With the advent of AMS measurements, the use of single entity samples has drastically increased as <1 g of material is needed for dating. Unfortunately, the individual radiocarbon reports for El Mirón samples often do not specify whether different fragments were combined for dating, though we know that bulk samples would generally have been collected from a very small area within a single excavation spit (1–5 cm). In a few instances, the reports mention how many fragments of bone or charcoal were sent to the lab. Therefore, all reports were reviewed and it was noted whether singular or plural forms were used to describe the sample material — e.g., “bone” vs. “bones”. These classifications should be treated with caution considering how such distinctions may get dropped in standardized text responses. In Cherkinsky’s reports the singular form can refer to either a collective singular or an individual bone (ambiguities indicated by “?” in Table 7). In short, although several bones per sample were sent to Geochron in the early stages of the project, it is not known whether only one or multiple bones were used for the actual assay. When multiple bones were sent, they usually were from the same spit and ¼ m sub-square. Notable exceptions are GX-32383 (no. 14) from level 14 and GX-32382 (no. 46) from level 106, where bones were scarce.
For charcoals, ABA protocols were deemed ideal for samples younger than 25k BP. Older samples would require oxidation and step-combustion steps (e.g., ABOx: Wood et al. Reference Wood, Douka, Boscato, Haesaerts, Sinitsyn and Higham2012). For bone and teeth samples, dating of collagen/dentin was preferred over bioapatite or mixed material. The reliability of bioapatite dating depends heavily on age and burial environment, and often provides dates that are too young (Hopkins et al. Reference Hopkins, Snoeck and Higham2016; Zazzo et al. Reference Zazzo, Lebon, Saliège, Lepetz and Moreau2012; Zazzo and Saliège Reference Zazzo and Saliège2011). Both exogenous and endogenous carbon are present as carbonates (CO3). It is therefore difficult to discriminate against carbon contaminants. As a precaution, we presently deem all bioapatite or mixed (i.e., non-gelatinized) bone dates as too high-risk to include in modeling. For collagen dates, the Longin method was seen as the least rigorous protocol. Adding a base solution step increases reliability, though ABA before gelatinization is preferred. Especially for older samples, ultrafiltration is recommended (Higham Reference Higham2011; Talamo and Richards Reference Talamo and Richards2011), though some care has to be taken regarding its implementation (e.g., Minami et al. Reference Minami, Yamazaki, Omori and Nakamura2013). We therefore judged ultrafiltration to be the most ideal pretreatment, and accepted ABA treated and gelatinized collagen as competitive for samples younger than 30k BP (e.g., Fülöp Reference Fülöp2013). As none of the samples submitted for radiocarbon dating had been chemically treated or curated, museum contamination was not relevant for the assessment process. This rendered hydroxyproline dating (Devièse et al. Reference Devièse, Comeskey, McCullagh, Bronk Ramsey and Higham2018) of bones unnecessary. We also excluded dates from samples with less than 0.5 wt.% collagen yield to mitigate contamination issues affecting poorly preserved samples (van Klinken Reference van Klinken1999).
Stable isotope measurements show significant inter-sample variability as a result of environmental and dietary variations. Nonetheless, values substantially deviating from the norm have a high risk of contamination. Therefore, δ 13C values outside the range −24‰ to −18‰ (collagen) and −27‰ to −22‰ (charcoal), and collagen δ 15N values outside the range of 2‰ to 12‰ were flagged as problematic. The carbon to nitrogen (C/N) ratio of bone collagen is expected to be 3.2. DeNiro (Reference DeNiro1985) used the range of 2.9–3.6 to pass samples. However, this may include samples with significant added carbon (van Klinken Reference van Klinken1999). The range was therefore narrowed to 3.1–3.4 for samples >20k BP. The relative amount of carbon (%C) released on combustion would also help to identify contamination issues. Results of <60 %C (charcoal) and outside the range of 40–45 %C (collagen) required investigation. However, measurement variability is relatively high, and an error of at least ±1% should realistically be taken into account.
Regrettably, the vast majority of 14C dates from El Mirón are only accompanied by δ 13C results. This poses additional challenges for reliability assessments, and makes the dates unsuitable for high-precision modeling. However, within the scope of this work, we deem a lack of additional pretreatment results as insufficient to classify a date as unreliable. We expect the resulting uncertainty to be offset by incorporating a Bayesian modeling approach with weighted outliers. Dating in duplicates was not able to shed substantial light on dating reliability, as only sample no. 51 has true duplicates (OxA-22091, OxA-22092).
3.1.2 Inbuilt Age
The inbuilt age refers to the time that has elapsed between the original formation of the 14C concentration and the burial of the sample (Table 2). Excluding secondary depositions, it can be assumed that for seeds this time span was very short (<1 year), while for bones it was short (<7 years). As no artifacts were dated, an increased inbuilt age as a result of prolonged use is unlikely. The identifiable, dated El Mirón charcoals belonged to short-lived species. For bulk samples, the inbuilt age is difficult to estimate as the origin of the radiocarbon signal remains uncertain.
Criteria for assessing quality of radiocarbon dates according to Waterbolk (Reference Waterbolk1971).

3.1.3 Certainty of Association
This describes the temporal relationship between the dated material and the event of interest (Table 2). No artifacts from El Mirón were directly radiocarbon dated, leaving only human remains in category 1. Both burnt/charred bones and charcoal from clear hearth structures have a “high probability of association”, while non-anthropogenically modified bones of large herbivores and charcoals from dense occupation levels were classified as having a “probable association”. Sometimes it is unclear whether charcoal samples derived from hearths or from levels showing intense human activity, and were therefore grouped under “2–3” to distinguish them from identified associations. “Reasonable probability” was reserved for samples without secure context. The date on a vole mandible (UG-43315) has no relationship to human activity; this burrowing animal may have crossed several levels in its tunneling.
3.2 Bayesian Modeling
Bayesian modeling has revolutionized radiocarbon dating in archaeology (e.g., Bayliss Reference Bayliss2009). It offers the opportunity to both increase the robustness of the radiocarbon chronostratigraphy and to investigate whether prior information is indeed compatible with obtained radiocarbon measurements. For this purpose, we used the software OxCal 4.4 (Bronk Ramsey Reference Bronk Ramsey2009a) and the calibration curve IntCal20 (Reimer et al. Reference Reimer, Austin, Bard, Bayliss, Blackwell, Bronk Ramsey, Butzin, Cheng, Edwards and Friedrich2020). The stratigraphic model outputs are shown in Figures 4–6, and the boundary model results in Table 4. All OxCal codes and additional model results are included in SI. The radiocarbon data was limited to dates with a quality indicator of <5, a risk factor of ≤12, and a “Certainty of Association” of <4. Separate stratigraphic models were run for each major excavation area: Outer Vestibule (OV), Middle Vestibule (MV), and Vestibule Rear (VR). This approach was deemed more reliable than culturally based priors, as not every horizon contained sufficient diagnostic artifacts for a secure cultural attribution. By contrast, a single stratigraphic model would be problematic on the grounds that level divisions in the three areas do not always correspond well. The sequence in the area of the human burial (BB) was not modeled. Considering the limited radiocarbon data and the fact that slightly older sediments were used for the burial infill, it would only decrease rather than increase the dating precision for the time of burial.
3.2.1 Stratigraphic Models
Each model consists of a Sequence() function, within which the archaeological levels are represented as individual Phase() functions in stratigraphic sequence. Radiocarbon dates pertaining to the same horizon are grouped in the same Phase(), and separated from others using the Boundary() function. The latter calculates the Probability Density Function (PDF) for when a transition from one to another event may have occurred (Bronk Ramsey Reference Bronk Ramsey2009a).
Each model uses the General outlier model with standard parameters (T(5),U(0,4),“t”) to detect and downweigh outlying R_Date and R_Combine ages (Bronk Ramsey Reference Bronk Ramsey2009b). For the dates obtained on the same sample, the standard SSimple outlier model (N(0,2),0,“s”) is applied to the individual R_Date functions within the R_Combine, as the outlier would be a measurement offset, not a temporal offset. In both cases, the initial outlier probability was set to 5%. No charcoal outlier model was implemented. The “old wood effect” is unlikely to sufficiently influence dating accuracy when dealing with short-lived species and measurement errors of 40–240 radiocarbon years (1σ).
A special input was used for the two radiocarbon measurements that produced age ranges beyond the calibration curve to prevent the model results from cutting off beyond 55k cal BP (Table 3). The finite age of OxA-33516 was approximated by using the calibrated lower age boundary (68.3% confidence interval) plus the original standard deviation as the new mean of the uniform distribution, while the original standard deviation was kept as the error. The “greater than” age of OxA-33515 is represented by a uniform distribution with the lower boundary given by its original minimum age BP, and the upper limit arbitrarily set to 70k cal BP to not overstretch the model parameters.
Code adjustments to input radiocarbon dates with age ranges that exceed the dates covered by the IntCal20 calibration curve. Dates marked with † in models.

Outer Vestibule Sequence (OV)
The oldest radiocarbon dated horizon in OV is level 21. However, the corresponding date of UG-3364r is younger than the dates from the overlying levels 19 (UG-3365r) and 18 (UG-3366r). Including UG-3364r with the standard outlier probability of 5% prevents the model from running, because initial conditions cannot be met when sampling from the prior probability distribution. As there is no reason to assume that the dates from level 19 and 18 are both too old, UG-3364r would have to be included with an increased prior outlier probability. However, its position at the bottom of the dated stratigraphic sequence, and as the only representative of level 21, would result in false constraints on the undated level 20, while having no effect on the ages calculated for the rest of the sequence. Until further dates are available for level 21, we therefore had to exclude both levels 21 and 20 from the stratigraphic model. Levels 11 and 11.1 were combined into a single Phase() as a result of limited and contradictory radiocarbon information. The undated levels 8, 6 and 4 were each included as an independent Phase() with an empty Date() function, and constrained by the levels below and above. The same was applied to level 14, whose date was deemed too unreliable for modeling.
Middle Vestibule Sequence (MV)
The radiocarbon record for MV is limited. The undated levels 311–309 were combined into a single Phase() with an empty Date() function, and constrained by levels 312 and 308. Similarly, both levels 307 and 304 were maintained as individual phases, constrained by the dated levels below and above.
Vestibule Rear Sequence (VR)
For the VR, we have radiocarbon dates from level 130 upwards. The undated levels 129, 124–123, 113–112, and 109 were included as an independent Phase() with an empty Date() function. By contrast, level 120 was excluded as it designates a mixed deposit only found at the base of a looters’ pit. The dates from levels 108–104 are seemingly inconsistent. As no further selection criteria on the bases of the dating process was possible, these levels had to be combined into a single Phase() for the model to run to completion. The surface find GX-24465 was excluded from modeling.
3.2.2 Boundary Models
Age ranges reflected within a dated Phase() have successfully been calculated by others using an empty Date() function placed within the Phase() of interest (e.g., Higham et al. Reference Higham, Basell, Jacobi, Wood, Ramsey and Conard2012, Reference Higham, Douka, Wood, Bronk Ramsey, Brock, Basell, Camps, Arrizabalaga, Baena and Barroso-Ruíz2014; Hopkins Reference Hopkins2019). However, as OxCal interprets such a function as a date with no constraints, it can have a negative impact on the modeling reliability of phases with few radiocarbon dates. We therefore calculated age estimates for each horizon by using the modeled boundary PDFs from the stratigraphic models to set up new models in which the dates for each Phase() were unknown and represented by empty Date() functions (SI, Tables 11–13, Figures 8–10, codes 4–6).
4 RESULTS
The El Mirón radiocarbon data set contained 36 dates on single entities, 13 dates on possible single entities, 43 dates on bulk samples, and 1 date on a possible bulk sample. Nonetheless, only 16 measurements had to be a priori excluded on the basis of poor dating quality. Additionally, UG-3364r (no. 30) was excluded as its unfortunate chronostratigraphic position was unsuitable for modeling in the absence of further dates from levels 21 or 20. GX-24465 (no. 41) was deemed unsuitable for modeling because of poor “certainty of association” (surface find). The vole bone collagen date UG-43315 (no. 91) did not have a direct relationship to human activity; all other faunal bones are almost certainly from ibex and red deer. The Inner Cave (IC) trench, Burial Area (BB) and Niche A have insufficient dates and/or stratification for independent modeling, and a direct mapping to the stratigraphy in other areas was not certain. As a result, the remaining dates from these areas were not disqualified by red flags found during the radiocarbon dating process. They likely reflect the archaeological record, though their further use has to be carefully considered, as consilience testing through modeling was not possible.
The stratigraphic model for OV performed well, and identified only two outliers (Figure 4): GX-24460 (55%, level 7), and OxA-22089 (6%, level 13). No outliers were found in the MV stratigraphic model (Figure 5). By contrast, the stratigraphic model for VR identified nine outliers (Figure 6). While OxA-22092 and OxA-22091 (both sample no. 51, level 110) are statistically indistinguishable from each other using a χ2-test, the sample’s age as R_Combine() has a 95% probability of being an outlier in the stratigraphic sequence. The remaining outliers are: UG-10628 (88%, level 110), GX-24469 (20%, level 111), GX-23416 (100%), OxA-33961 (100%), GX-29439 (75%, level 116), GX-31933 (100%, level 118), GX-25858 (15%, level 119), GX-32655 (6%, level 121), and UG-7216 (13%, level 127).
Visual output for the stratigraphic model in the outer vestibule (OV). Radiocarbon dates are colored according to their outlier estimate based on a scale from 0% (green) to 100% (red). * indicates a date with the highest included risk factor (12).

The boundary models run for each excavation area show the varying dating precision attained for each archaeological level (Figure 7). The younger Magdalenian, Azilian, and Mesolithic levels have substantial error ranges for their respective start and end dates, as a result of the limited number of dates and preserved horizons associated with those periods.
5 DISCUSSION
From the archaeological standpoint, this analysis resolves many of the problems arising from stratigraphically incoherent dates especially in the vestibule rear (“Corral”) area, permitting us to hypothesize the most likely ages for individual or grouped levels and for the beginning and end of major traditional cultural periods represented by occupations (major and minor) of the cave. It also adds a degree of certainly to our attempts to correlate among the different, only partially connected excavation areas in the vestibule: front (OV), middle (MV), rear (VR) and Burial area, confirming especially the identity of a major, long-term set of extraordinarily rich, multi-function occupations of the cave during the Cantabrian Lower Magdalenian. These occupations, marked by such temporally and regionally distinctive artifacts as striation engraved red deer hind images on red deer scapulae, abundant square-section antler points and so-called nucleiform scrapers, formed a thick palimpsest horizon throughout the vestibule, with abundant hearths, pits, fire-cracked rocks, ocher and extraordinarily rich assemblages of debris and finished osseous and lithic artifacts and faunal remains dominated by red deer and ibex and characterized by dark “chocolate” brown-blackish brown color: levels 17–15, 312, 505–503.1 and 116–109. This horizon once extended up (banked atop) the present colluvial-alluvial slope (as attested by the date from remnant intact sediments of the same nature in Niche A of the cave wall) before it was removed from that area along with the post-Paleolithic levels at the vestibule rear, presumably by shepherds who stabled their livestock in this area before excavations began. Dating the regionally poorly known Initial Magdalenian occupations of the cave in clear stratigraphic position between the Solutrean and classic Cantabrian Lower Magdalenian is of great importance. These levels differ from the latter in having large, round-section sagaies as opposed to more gracile, square-section ones, no engraved scapulae, fewer backed bladelets, no geometric microliths, and a particularly high number of “archaic” lithic tool types (denticulates, notches, sidescrapers), but no raclettes, transversal truncation burins or flaked (as opposed to groove-and-splinter) antler blanks — hallmarks of the Badegoulian tradition. El Mirón contributes significantly to the debate over the nature and timing of the phasing out of Solutrean weapon technology (i.e., invasively retouched foliate and shouldered points). Fortunately, the radiometric dates are also fully consonant with the diagnostic artifacts (a harpoon and an ocher-stained cobble respectively) from the otherwise artifact-poor Upper Magdalenian and Azilian levels, while the Middle Magdalenian-age levels remain poorly defined as noted above. The present analysis also provides confirmation of the age ranges for the Neolithic, Chalcolithic and Bronze Age occupations of the cave, which are among the most important in the Cantabrian region, particularly as El Mirón was a residential site (not an ossuary) in these post-Paleolithic times, with significant evidence of subsistence activities and ceramic manufacture.
5.1 Unreliable Dates
The results of the radiocarbon dating quality assessment are shown in Table 7. As can be seen, we applied a very conservative threshold for classifying radiocarbon measurements as unreliable (e.g., a suspected bulk or lightly treated sample was not automatically excluded). This approach was necessary to avoid premature exclusion of legacy data and enable the implemented outlier model to have sufficient data to provide meaningful analysis. Consequently, the inclusion of a date in the modeling process should not be seen as a direct endorsement of a date’s reliability (reliability concerns of dates included in the models are discussed under Outliers and Stratigraphy). By contrast, the measurements discussed in the following should not be part of any further chronological work.
GX-32383 (no. 19) is composed of material from several bone fragments. As level 14 was a bone-poor horizon, those fragments were — unlike in other cases — collected from different spits and squares in order to obtain sufficient material for dating. Several other bulk samples showed additional issues that raised their reliability risks to untenable levels: GX-27115 (no. 24) had an elevated δ 13C value (and minimal pretreatment); GX-25853 (no. 25) a high δ 13C value; and GX-23394 (no. 60) an unusually high measurement error (and minimal pretreatment). Another three bulk samples were deemed insufficiently reliable for chronology building, as they came from complex contexts with currently no possibility of consilience testing: GX-22129 (no. 88), GX-28013 (no. 89), GX-22347 (no. 90).
Additionally, several samples were too problematic based on the material dated. GX-23417 (no. 42), GX-32382 (no. 46), GX-32381 (no. 48), and GX-23397 (no. 49) are all dates obtained on mixed bone material (i.e., the collagen was not extracted for dating). This was likely done as collagen preservation in burnt bone tends to be poor. However, non-differentiated samples are prone to contamination. Even if bioapatite was isolated, its molecular composition poses unresolved challenges for discriminating against exogenous carbon. Similarly, GX-27112 (no. 87) represents a radiocarbon measurement on bioapatite. By contrast, for GX-28209 (no. 58) and GX-32656 (no. 70) the laboratory used charcoal from burnt bone for dating. The ambiguity of the material chosen leads to unknown reliability risks. In addition, GX-32656 (no. 70) also had elevated δ 13C.
Finally, two single entity samples failed date quality indicators: OxA-22090 (no. 57) had an elevated C/N ratio as well as a minimally raised %C yield on combustion; and GX-27112 (no. 79) was insufficiently rigorously pretreated for the sample’s age (ABA instead of ABOx).
5.2 Outliers and Stratigraphy
It is important to discuss whether the outliers identified in the stratigraphic models reflect taphonomic processes or poor radiocarbon dating reliability. In the OV area, the stratigraphic model performs well overall. Nonetheless, level 21 requires further dating, as the only date available (UG-3364r) is currently in contradiction to the rest of the stratigraphy. The outlier identified in level 13 (OxA-22089), on the other hand, may be a red herring. Both dates from level 15 have large error ranges, thus showing significant temporal overlap with the more precise date from level 13. Level 14 was not able to provide further constraints/clarifications on the matter, as the only radiocarbon measurement from this horizon was deemed unreliable (the sample GX-32383 was made up of several bone fragments that were collected from different spits and squares). Further up the stratigraphy, published dates were not able to distinguish between levels 11 and 11.1. The radiocarbon dating information for the two dates from Oxford (OxA-22087, OxA-22088) indicate reliable dating, while the pretreatment for GX-23391 could lead to an underestimation of the true sample age. Nonetheless, these differences do not resolve the date inversion between the two levels in question. As a result, the discrepancy is more likely the result of level identification or taphonomic processes. Level 11.1 is a larger, localized lens, which was distinguished from level 11 by its darker, charcoal-stained color. Furthermore, in some areas level 11 merges with level 11.2 (undated), which is otherwise found beneath level 11.1. Overall, levels 12–10.1 span substantially more time than any other levels, which is indicative of slow sedimentation, limited occupation activity, and possible erosion. During excavation, levels 10 and 10.1 were initially not distinguished. Level 10.1 remained poor in artifacts, and contained hardly any evidence of human activity, which is characteristic of Mesolithic times both at El Mirón and in the Cantabrian montane interior in general. The low chronostratigraphic resolution in that period is therefore consistent with a near-occupation/sedimentation hiatus. Human settlement was concentrated mainly along the early Holocene shore at this time.
The second clear outlier identified by the original stratigraphic model was GX-24460 from level 7. While all the samples from the Holocene in the OV area are potential bulk samples, they are otherwise consistent with the stratigraphy. Nonetheless, the limited number of dates and the presence of intensive pitting activity presently allows for the intrusion of sample no. 5, a higher date variability (and mixing) in the levels 7–3, or an unreliable radiocarbon measurement as credible explanations.
For the MV excavation area, the stratigraphic model was not able to identify any dating outliers, though this sequence has fewer dated samples than either OV or VR. Despite the lower resolution, the results seem to show a pattern consistent with decreased sedimentation/activity between ca. 1400–7000 cal BP. Nonetheless, stratification in this period is higher than in the OV (Figure 7). It is also worth noting that the radiocarbon date obtained on a small vole jaw fragment (UG-43315) from level 306 appears older than both GX-24468 (level 306) and GX-28210 (level 308). The vole was collected from a different square, but shows the same pretreatment as the other bone sample from level 306. By contrast, the light pretreatment of the charcoal from level 308 may underestimate the sample’s true age. Therefore, it remains possible that the chronostratigraphic model currently underestimates the ages for levels 308–306, and consequently also for the upper constraint of levels 311–309. However, it is important to remember that UG-43315 had very little material treated, and, unlike other samples, its deposition is certainly not the result of human activity. As a result, it does not provide evidence that UG-43315 has to be unreliable. More intensive dating of levels 312–304 may clarify their relationship, increase dating resolution for this time period, and shed light on activity no longer differentiated in other areas of the cave.
As expected from the more difficult taphonomic situation, the excavation area VR contains more dating outliers than the previous two areas. Level 118 is characterized by a single radiocarbon date (GX-31933), which is younger than most dates found in the levels above. The date was obtained on a bulk charcoal sample, and it appears that it may have contained material from different events, considering the fine stratification found in this area. GX-31933 does therefore not represent a reliable age estimation for level 118. Strikingly, all three dates from level 116 were also identified as chronostratigraphic outliers. While their pretreatments differ (ranging from simple Longin method to ultrafiltration), two dates are significantly too young — including the ultrafiltered date — and one too old. The latter (GX-29439) is explained by its find location, which was a hearth pit feature. It is likely that pitting led to the sample’s intrusion in 116. By contrast, OxA-33961 was found in square T7, and in close proximity of the large rock, which may have disturbed the level’s integrity, and caused samples from higher up levels (e.g., 110) to intrude. Similarly, GX-23416 was found in square V8, where the individual levels were seen as very thinly stratified horizons, and material-level associations were difficult. Overall, the dating discrepancy reflects the taphonomic complexity of level 116 (i.e., intensive, repeated human occupations here as in other Corral area Magdalenian levels, with pit and hearth construction, trampling, surface cleaning, reuse of materials, etc.), and it may be difficult to obtain more consistent dating even with further measurements. Another level with several outliers is 110. The bone sample no. 51 has been dated twice with ultrafiltration. Both radiocarbon dates (OxA-22091, OxA-22092) are in good agreement, and no suspicious pretreatment results were recorded. Therefore, these dates are reliable measurements, despite their age aligning better with GX-27114 from level 108. Whether they truly represent the age of level 110 is more difficult to assess. Considering the quality of the non-outlier dates within 110 does also not help to resolve the dating discrepancy. While OxA-33965 shows a minimally elevated C/N ratio, this normally does not cause the age to be older than expected. GX-23396 is a bulk sample and is thus generally less reliable. However, this seems insufficient reason to assume that both OxA-33965 and GX-23396 should be entirely disregarded in favor of OxA-22091/OxA-22092 for estimating the age of level 110. The situation is further complicated by the fact that the outlier date UG-10628 may even underestimate the sample’s true age. However in this case, its location “sub-block” suggests that the fall of the big block may have affected its location, and that this bone fragment’s primary location was within the level below. This interpretation would also partially explain the outlier identified in level 111 (GX-24469), a sample unaffected by the falling of this very heavy rock. The “age inversion” observed between the two dates appears to be in conflict with their relative chronology. However, if we assume UG-10628 originated in level 111, the dating of this level becomes more coherent. Nonetheless, in such a modeling scenario, GX-24469 would remain the youngest date of level 111, and its placement would increase the outlier probability of GX-23396 from level 110. Evidently, the contact zone between levels 110/111 remains challenging. Level 109 represents a substantial, but localized lens found in VR, and presently does not contain any radiocarbon dated samples. Therefore, its modeled age estimation may impact on the upper and lower boundaries of levels 110 and 108, respectively. It was nonetheless included in the model, because of its possible contemporaneity with the burial of the “Red Lady”. Finally, the stratigraphic package that modeling was not able to resolve was 108–104, which also contained the directly dated, isolated human teeth from levels 105 (UG-18525) and 104 (UG-15261). Both faunal samples GX-22703 (level 108) and UG-9286 (level 105) are younger than any of the other dates in this group. However, all dates were obtained on single entity samples, and pretreatment variation (and a slightly elevated C/N ratio for UG-18525) would not easily explain a dating discrepancy of over 1000 years. As a result, dating contradictions appear to reflect the complexity of the stratigraphy (with many fine, difficult to distinguish lenses), prehistoric disturbances (hearth- and pit-building, trampling, scuffing, cleaning), possible gently flowing water from the inner cave, and rodent activity (especially evident in levels 107.1 and 107.2). Further dating may contribute to partially disentangle the different sources of errors.
5.3 Chronostratigraphy and Inter-Area Comparisons
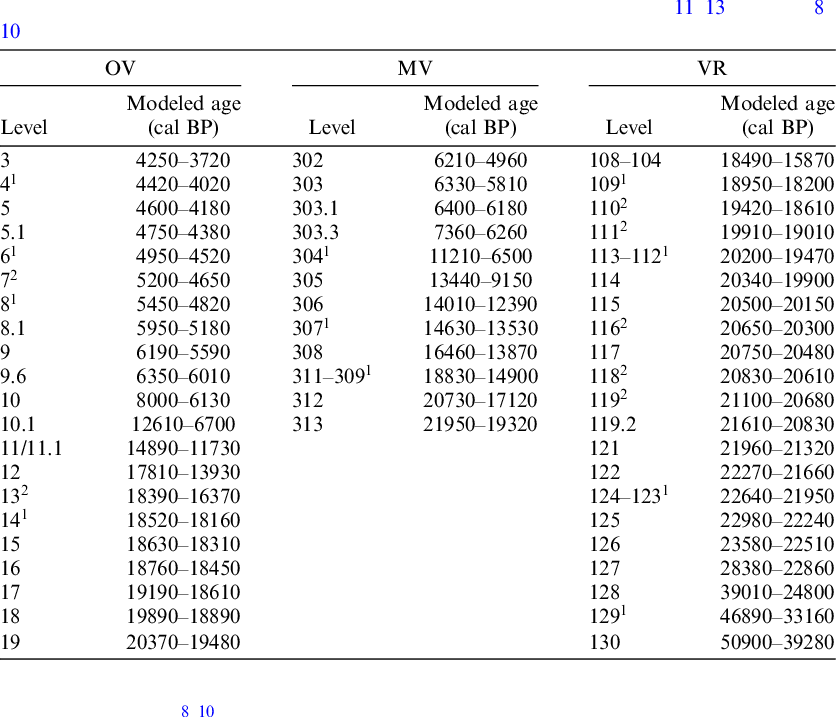
Based on the radiocarbon chronostratigraphy, the levels found in the three excavation areas can be correlated as follows: 8-9.6 ≈ 302; 10 ≈ 303–303.3; 10.1 ≈ 304; 11/11.1 (11.2) ≈305–306; 12 ≈ 307–308 (possibly 309) ≈104; 13–14 ≈ 310–311 (possibly 309) ≈105–108 (possibly 104); 15–17 ≈ 312 ≈ 109-110; possibly 312 ≈ 111–116. The human burial into level 504 took place near the end of the most intensive Lower Magdalenian occupation (and deposition), probably contemporaneously with late levels 110 and 109 in the VR, level 313 in the MV and level 17 in the OV, and relatively shortly after the massive block fall atop the base of level 110 or top of level 111.
This is consistent with the findings of cave geomorphologist/sedimentologist William Farrand (Reference Farrand, Straus and González Morales2012), who correlated the top of levels 10.1, 304 and 102. Connecting the tops of levels 12, 307 and 104 seems more difficult, especially as current dating suggests that 104 is older than 307. However, level 104 is only represented by a single radiocarbon measurement towards the upper boundary of the chronostratigraphic modeling sequence in the VR. Further dating is needed to improve the resolution and our understanding of level correlations in this time period. By contrast, Farrand’s (Reference Farrand, Straus and González Morales2012) hypothesis that the middle of level 15 corresponded to the top of levels 107 and 311.1 appears unlikely (though not impossible) in light of our modeling results.
The stratigraphic complex of levels 3–9 is predominantly the result of human activity, and is rich in hearths, fire evidence and ash. Activity likely extended from the OV into the MV and VR area, though more recent disturbances have left limited evidence in situ. This is contrasted by the moonmilk of levels 10/303–303.3. As noted by Farrand (Reference Farrand, Straus and González Morales2012), there are hiatuses before and after 10.1/304/102, which correspond to two well-known dry spells with low sedimentation during the Late Glacial climate amelioration. The weathering observed between 305 and 304 suggests that slow sedimentation was accompanied by erosion, thus a loss in the sedimentological record. This directly resulted in the low temporal resolution of the chronostratigraphy during this time period (level 10.1 is very thin, Figure 3). The minimally higher resolution observed in the MV compared to the OV is consistent with the cave floor sloping downwards towards the cave entrance. While separation of levels 11, 11.1 and 11.2 was often difficult, the top of level 306 is clearly demarcated from the bottom of 305. For the levels tentatively identified as Middle Magdalenian (Figure 7), stratification is lowest in the OV and highest in the VR. This may be a reflection of both local variations in human activity as well as mobility of material down the slope, resulting in loss of horizons in OV. This is contrasted by the levels currently seen as Initial Magdalenian. While levels 15–17 correspond well to levels 109–110, level 312 (excavated in a 1 m2 test pit, which made dividing this 25–30 cm thick, very dark “chocolate” brown, artifact- fauna- and charcoal-rich horizon impossible in practice) is temporally poorly defined, and encompasses the entire period covered by levels 109–116 in the VR, as well as the similarly thick level 17 in the OV with classic Cantabrian Lower Magdalenian. From this perspective, the relationship to levels 18–19 remains unclear, although since they underlie 17, they and/or 20–21 might be equivalent to 313 and 117–119. It is difficult to interpret whether finer stratigraphic units were missed, lost, mixed or whether the 312 horizon in actuality only reflects one of the levels observed in either the OV or VR. Overall, the OV shows high chronostratigraphic resolution for the younger periods, while the VR contains highly differentiated sedimentation for the Solutrean to the Middle Magdalenian.
5.4 Comparison with Radio-Chronometric Scheme for Cantabria
After having focused on the site-specific radiocarbon analysis of El Mirón, its impact on the archaeological chronology of the Cantabrian regions can be assessed by means of cultural attributions. For this, we first propose a tentative cultural sequence for the site, and then compare it with published data, especially the influential radio-chronometric scheme by González Sainz and Utrilla (Reference González Sainz, Utrilla and Bicho2005).
Based on the inter-area correlation of the three modeled chronostratigraphies (OV, MV, VR) and the archaeological material recovered, we propose the tentative cultural attributions illustrated in Figure 7. Note the excessively early modeled ages for level 127 (Figure 6, Table 4). They are an artifact of the Bayesian modeling process, as the level is poorly constrained by only a single radiocarbon age from level 128. We do not postulate an unprecedentedly early start for the Solutrean at El Mirón. The Upper Magdalenian may be further restricted to level 12, if one only accepts the presence of its harpoon as “true” Upper Magdalenian. The Final Magdalenian/Azilian levels remain hard to distinguish, and the very young ages seen for level 305 are the result of a hiatus currently preventing further age constraints in the model (Figure 5, Table 4). The “Mesolithic” horizon is culturally very poor.
Visual output for the stratigraphic model in the middle vestibule (MV). Radiocarbon dates are colored according to their outlier estimate based on a scale from 0% (green) to 100% (red). * indicates a date with the highest included risk factor (12).

Visual output for the stratigraphic model in the vestibule rear (VR). Radiocarbon dates are colored according to their outlier estimate based on a scale from 0% (green) to 100% (red). * indicates a date with the highest included risk factor (12). †Original Radiocarbon age adjusted and implemented as Date(), see Bayesian Modeling for details.

Date ranges modeled for levels found in OV, MV, and VR (for 24000–3500 cal BP), with tentative cultural associations. The flatter the slope of the lines marking transitions between levels, the higher the precision for start/end dates. In general, the fewer levels a time period contains, the less activity can be associated with it. Note that both levels 309 and 104 may also be Upper Magdalenian, and levels 18 and 19 could be Lower Magdalenian, but the artifact samples are very small.

González Sainz and Utrilla’s (Reference González Sainz, Utrilla and Bicho2005) radio-chronometric scheme for organizing the Solutrean, Magdalenian and Azilian periods in Cantabrian Spain was published 15 years ago. It made use of a total of 203 dates from various sites in Cantabria to estimate the periods’ ages following the radiocarbon histogram method by Gasco (Reference Gasco1985), and calibrated their dates with Calib 4.3 (2000) and CalPal (2004). We have re-calibrated their originally proposed, non-calibrated start dates with IntCal20 in OxCal 4.4 to account for the significant improvements in radiocarbon calibration, and to facilitate comparison with the chronostratigraphy from El Mirón. However, there remain significant methodological differences. González Sainz and Utrilla (Reference González Sainz, Utrilla and Bicho2005) picked the oldest “credible” radiocarbon dates to represent the start of each technocomplex. With Bayesian modeling, it is customary to use the calculated start boundaries to allow for the fact that the beginning of an expression may predate its first attested occurrence, thus resulting in generally older age estimates. We therefore included the results from the boundary models that dated age ranges likely comprised within each archaeological horizon, which is closer to the approach of González Sainz and Utrilla (Reference González Sainz, Utrilla and Bicho2005). The simple comparison shows a shift to earlier dates for the Initial, Lower, Middle and (possibly) Upper Magdalenian (Table 5). One must keep in mind that (1) the Middle Magdalenian in El Mirón is poor and ill-defined in the absence of any diagnostic artifacts, such as proto-harpoons, contours découpés, rondelles, spiral motif wands, and (2) that there were very few credible, radiocarbon-dated Initial Magdalenian levels in the region before the excavation of El Mirón. One of them was Level 5 in El Rascaño, which is situated one valley (20 straight-line km) to the west of El Mirón, and dated to 16.4k ± 0.1 BP (Barandiarán and González Echegaray Reference Barandiarán and González Echegaray1981), which would translate to 20.1–19.5 kcal BP (95.4%) when calibrated with IntCal20 in OxCal 4.4. By contrast, the dates for the Solutrean are fully in line with the now-substantial record from the Cantabrian region (Schmidt Reference Schmidt2015, Table 5.3).
Comparison of the radio-chronometric scheme for Cantabria (a–b) with the chronostratigraphy of El Mirón (c–d) for the Magdalenian and Azilian period. (a) uncalibrated dates (González Sainz and Utrilla Reference González Sainz, Utrilla and Bicho2005, Table 2), (b) same dates calibrated with IntCal20 (Reimer et al. Reference Reimer, Austin, Bard, Bayliss, Blackwell, Bronk Ramsey, Butzin, Cheng, Edwards and Friedrich2020) in Oxcal 4.4 (Bronk Ramsey Reference Bronk Ramsey2009a), (c) name and date of transition boundary from stratigraphic models, (d) name and earliest date of horizons from boundary models. Calibrated dates given at 95.4% confidence interval. For methodological differences see text.

*Reminder that MM, UM, FM, and Az are culturally weakly defined at El Mirón.
6 CONCLUSION
Reassessment of the radiocarbon record at El Mirón demonstrated that the majority of measurements are able to provide robust chronostratigraphic insights through Bayesian modeling, and we recommend to no longer use those dates identified as “unreliable” and highlighted in gray in Table 7. In future, care is needed when working with dates from levels 11/11.1, 116, 110, and 108–104 (their age variation is heavily influenced by the complexity of their geological and anthropogenic formation and archaeological context), as well as dates from the excavation areas inner cave (IC) and the burial (too few radiocarbon dates for modeling). Nonetheless, there is presently no indication that the direct date obtained on the “Red Lady” misrepresents the age of the burial — it is also consistent with dates from the level in which it was deposited (504), as well as those below (505) and above (503.1). As usual, one has to exercise caution when working with (potential) bulk samples and bioapatite dates.
This work has served to partially clarify the most likely sequence of 14C dates and to correlate the Magdalenian levels excavated in separate zones of the large El Mirón Cave vestibule through rigorous scrutiny of date quality and statistical analyses. El Mirón adds very significantly to the radiocarbon chronology for the mid- and late Upper Paleolithic and early Post-Paleolithic of the Cantabrian region. Especially rich in radiometric dates for the Solutrean, Magdalenian, Neolithic and Metal Ages, the record from El Mirón complements the extraordinary radiocarbon record from the late Mousterian, Aurignacian and Gravettian levels in the classic site of El Castillo Cave, located three valleys (40 straight-line km) to the west (Garralda et al. Reference Garralda, Maíllo, Higham, Neira and Bernaldo de Quirós2019, with references). Furthermore, these results highlight the necessity to periodically reassess published radiocarbon data and radio-chronometric analyses to improve the quality of future chronometric work and interpretations as new technologies become available. For this, data and modeling transparency is essential. We hope that our results encourage researcher to conduct similar work at other sites, and that this will lead to an improved regional radio-chronometric scheme that is able to integrate data from a wide range of sites throughout the Cantabrian region.
ACKNOWLEDGMENTS
The radiocarbon analysis was made possible through financial support received from the UNM Foundation Stone Age Research Fund (J. and R. Auel, principal donors). Additionally, we would like to thank Dana Krueger (Geochron), David Chivall (ORAU), and especially Alexander Cherkinsky (CAIS), for providing laboratory internal information for the dated samples from El Mirón. The excavations directed by L. G. Straus and M. R. González Morales between 1996–2013 were authorized and partially funded by the Gobierno de Cantabria. Additional funding was provided by the U.S. National Science Foundation, Fundación M. Botín, L.S.B. Leakey Foundation, Ministerio de Educación y Ciencia, National Geographic Society and University of New Mexico, with material support from the Universidad de Cantabria and Town of Ramales de la Victoria.
SUPPLEMENTARY MATERIAL
To view supplementary material for this article, please visit https://doi.org/10.1017/RDC.2020.121
A Appendix
Archaeological context for the 93 published radiocarbon dates from El Mirón Cave, Spain (total of 91 samples dated).

1Zones: OV, outer vestibule; MV, middle vestibule; VR, vestibule rear; IC, inner cave; BB, behind block (burial area).
2Sev. = several.
3Periods: Med, medieval; BA, Bronze Age; C, Chalcolithic; N, Neolithic; Ms, Mesolithic; Az/FM, Azilian/Final Magdalenian; UM, Upper Magdalenian; MM, Middle Magdalenian; LM, Lower Magdalenian; IM, Initial Magdalenian; S, Solutrean.
4Publications: [1] Straus and González Morales Reference Straus and González Morales2003, [2] Straus and González Morales Reference Straus and González Morales2007b, [3] Straus and González Morales Reference Straus and González Morales2010, [4] Straus et al. Reference Straus, González Morales, Higham, Richards and Talamo2015b, [5] Straus and González Morales Reference Straus and González Morales2016, [6] Straus and González Morales Reference Straus and González Morales2018a, [7] Baca et al. Reference Baca, Popović, Baca, Lemanik, Doan, Horáček, López-García, Bañuls-Cardona, Pazonyi and Desclaux2020.
Radiocarbon treatment information for the 93 measurements from El Mirón. Stable isotope measurements obtained using IRMS. Radiocarbon dates were calibrated in OxCal 4.4 (Bronk Ramsey Reference Bronk Ramsey2009a) using IntCal20 (Reimer et al. Reference Reimer, Austin, Bard, Bayliss, Blackwell, Bronk Ramsey, Butzin, Cheng, Edwards and Friedrich2020). Note that the outlier value given for sample 51 is for the R_Combine date, and dates from levels 108–104 had to be combined into a single Phase. Dates deemed too unreliable highlighted in gray. Dates excluded from modeling on other considerations marked in italics.

1Year in which the sample was dated.
2Sample material followed by material extracted for 14C dating. Ch, charcoal; B, bone; cB, charred bone; bB, burnt bone; H-B, human bone; T, tooth; H-T, human tooth.
3Technique used for measurement. Conv., conventional; Cxnt., conventional with extended count; AMS, accelerator mass spectrometer.
4A, acid; B, base; G, gelatinized; UF, ultrafiltered; (vac.), treatment in vacuo.
5Amount of sample treated.
6Yield after pretreatment in wt. %.
7Publications: [1] Straus and González Morales Reference Straus and González Morales2003, [2] Straus and González Morales Reference Straus and González Morales2007b, [3] Straus and González Morales Reference Straus and González Morales2010, [4] Straus et al. Reference Straus, González Morales, Higham, Richards and Talamo2015b, [5] Straus and González Morales Reference Straus and González Morales2016, [6] Straus and González Morales Reference Straus and González Morales2018a, [7] Baca et al. Reference Baca, Popović, Baca, Lemanik, Doan, Horáček, López-García, Bañuls-Cardona, Pazonyi and Desclaux2020.
8Abbreviations: SE, single entity; DQ, date quality; IA, inbuilt age; Cert., certainty of association.
9Risk = IA * Cert.
10Posterior outlier probability as calculated by the stratigraphic models.


 Open access