


Introduction
Whilst there is a global trend for women to delay bearing children, several studies indicate that advanced maternal age (AMA) leads to reduced ovarian reserve and infertility Reference Crawford and Steiner1 and increased risk of pregnancy complications including gestational diabetes, Reference Biro, Davey, Carolan and Kealy2 preterm birth, hypertension and pre-eclampsia. Reference Delbaere, Verstraelen, Goetgeluk, Martens, De Backer and Temmerman3–Reference Ferré, Callaghan, Olson, Sharma and Barfield5 Moreover, AMA has been shown to adversely affect human offspring cardiometabolic and mental health. Reference Tearne, Robinson and Jacoby6,Reference Cooke and Davidge7
The loss of ovarian reserve with AMA is common in mammals and may coincide with increased aneuploidy due to a range of segregation errors during meiosis affecting spindle dynamics. Reference Nagaoka, Hassold and Hunt8–Reference Nakagawa and FitzHarris10 However, maternal senescence also affects physiological conditions across cell types and organs; for example, uterine decidualisation is diminished by AMA in human and mouse, affecting placental activity and increasing pregnancy loss. Reference Cano, Simón, Remohí and Pellicer11,Reference Woods, Perez-Garcia and Kieckbusch12 Moreover, senescence from AMA may promote a chronic maternal immune response affecting diverse foetal organ function and health. Reference Shirasuna and Iwata13
Given the confounding influence of maternal systemic senescence on AMA pregnancy success, models are required to understand the developmental potential of AMA oocytes and embryos and whether influenced or not by the extent and character of meiotic aneuploidy. Human and mouse embryos show retarded development in AMA. Reference Janny and Menezo14,Reference Velazquez, Smith, Smyth, Osmond and Fleming15 Moreover, where AMA blastocysts are transferred to young dams, offspring growth and cardiometabolic health are adversely affected, Reference Velazquez, Smith, Smyth, Osmond and Fleming15 indicating inherent compromised potential independent of maternal senescence and thereby demonstrating AMA contributes to the concept of the Developmental Origins of Health and Disease (DOHaD) concept. Reference Fleming, Watkins and Velazquez16 This is supported by an altered transcriptome and signalling network expression detected in AMA human blastocysts. Reference McCallie, Parks and Trahan17
In the current study, we assess the effect of AMA on mouse blastocyst development and establish a mouse embryonic stem cell (mESC) model for investigating AMA effects on incidence of aneuploidy and developmental potential. We believe this to be the first characterisation of mESCs directly from unstimulated naturally conceived aged embryos, although pluripotent stem cells have been generated from aged mouse artificially activated oocytes forming parthenogenetic embryos (pES cells). Reference Huang, Okuka and Wang18 Also, mESCs have been generated from an assisted reproductive treatment (ART) model using mothers at different ages subjected to a combination of ART processes (maternal superovulation, in vitro fertilisation [IVF], extended culture to blastocyst). Reference Assadollahi, Fathi, Abdi, Khadem Erfan, Soleimani and Banafshi19 We find that AMA mESCs display a range of aneuploidic states and accompanying perturbation in cellular and expression characteristics that permit their exploitation for underlying mechanisms influencing development within the DOHaD context. To support these primary outcomes from ageing using male mESCs, we also include separate analysis of a secondary question, to assess differences in male versus female lines following ageing.
Methods
Animal procedures
Animal procedures were conducted under UK Home Office project licence in accordance with Animal (Scientific Procedures) Act 1986 and local ethics committee at the University of Southampton (UoS). We used Young (7–8 weeks) and Old (7–8 months) C57BL/6 females (UoS Biomedical Research Facility) to investigate AMA, and these were naturally mated with sexually mature CBA males (10–15 weeks, Charles River Lab, UK). This protocol permitted consistency with our previous mouse AMA study showing AMA-induced postnatal health changes Reference Velazquez, Smith, Smyth, Osmond and Fleming15 and the cross combined the efficiency of C57Bl/6 inbred strain for derivation of ESCs with increased hybrid vigour to generate genetically identical embryos with improved stability, as shown previously. Reference Yagi, Tokunaga and Furuta20 Animals were housed on a controlled 07:00–19:00 h light cycle at 21°C and fed standard laboratory chow (Special Diet Services, Essex, UK) and water ad libitum.
Embryo collection and developmental staging
The morning after mating, dams were checked for a copulation plug to confirm successful mating. Midday on day after mating was classified as E0.5. At E3.5, C57BL/6 females were culled by cervical dislocation; dissected uterine horns were immediately placed in the pre-warmed saline solution (BR0053G, Oxoid, UK) and the embryos were flushed out in warm H6 medium supplemented with 4 mg/ml bovine serum albumin (BSA, Sigma, A3311). Reference Nasr-Esfahani, Johnson and Aitken21 Collected embryos were transferred to fresh dishes containing 30 µl embryo culture medium, KSOM (Potassium-supplemented simplex optimised medium) with amino acids, Reference Summers, McGinnis, Lawitts, Raffin and Biggers22 and washed three times in these drops covered with a layer of mineral oil (Sigma Aldrich).
To evaluate the effect of AMA on in vivo development, embryos derived from ten Young and Old dams were staged for the development up to blastocyst and the extent of blastocyst cavity expansion (early, mid or late blastocysts). Mid-expanded blastocysts were washed in H6-BSA and used for embryonic stem cell (mESC) derivation.
Derivation and culture of mESC clones from E3.5 blastocysts
Mid-expanded blastocysts were transferred to freshly prepared mouse embryonic fibroblasts (MEFs), mitotically inactivated with 10 µg/ml mitomycin-C (MMC, Fisher Scientific, 10182953) in the mESC medium [knockout-DMEM supplemented with 15% knockout serum replacement (KO/SR) (Gibco, 10,828), non-essential amino acids (Gibco, 11,140), 1 mM sodium pyruvate (Gibco, 11,360), 100 µM 2-mercaptoethanol (Sigma, M7522), 2 mM glutamine, penicillin (50 U/ml)/streptomycin (50 µg/ml) (Gibco, 10,378) and 1000 U/ml of leukaemia inhibitory factor (LIF)] and incubated undisturbed for 48 h under standard humidified conditions of 37°C in 5% CO2 in air.
Blastocysts from different dams were plated onto different dishes where each blastocyst gave rise to an individual stem cell line. A total of 90 mid-stage blastocysts were utilised to derive 38 mESC lines. By the fourth day post plating of blastocysts from same dam on a single plate, inner cell mass (ICM) outgrowths could be observed to be hatched from the zona pellucida and attached on the MEFs. ICM clumps were enzymatically isolated using trypsin: ethylenediaminetetraacetic acid (EDTA) (0.05%; Gibco, 25,300). Each isolated ICM outgrowth was collected in a different well of a 96-well U-shaped plate containing 50 µl/well pre-warmed trypsin-EDTA, followed by careful pipetting up and down to achieve a single cell suspension. Trypsinised outgrowths were transferred to fresh flat-bottom 96-well MMC-MEF-coated plates, and mESC medium was changed daily. Round, tight clusters of cells marked the first appearance of mESC clones, typically 4–5 d after plating the cells. Mouse ES colonies were cultured in the mESC medium, passaged every 3–4 d by enzymatic dissociation and transferred to dishes with greater surface area when reaching 70% confluency. Once mESCs were expanded for 8–9 passages (P8–9; over 25–30 d), cells were either used directly or frozen at 1 × 10⁶ cells/cryovial in the mESC medium with 20% KO/SR and 10% dimethyl sulfoxide, DMSO (Sigma, D5879). mESCs and MEFs were always counted and seeded in fixed proportions for each cell line, and the cell numbers were kept consistent for individual experiments.
Sex analysis of derived mESC lines
MEFs were eliminated from the mESC co-culture by pre-plating on gelatin-coated dishes where they were attached. After culturing the ES cells, MEF-free, confluent mESCs were pelleted and treated with lysis buffer (10 mM Tris pH 8, 100 mM NaCl, 10 mM EDTA, 0.5% sodium dodecyl sulphate (SDS) and 1 mg/ml proteinase K) and processed with NaCl followed by isopropanol. Reference Ramírez-Solis, Rivera-Pérez, Wallace, Wims, Zheng and Bradley23 Male and female mouse tail samples were used as controls. Genomic DNA concentration and quality were quantified using the Nanodrop ND-100 spectrophotometer. For sex analysis, genes Sry and Zfy, and DxNds3 (or Nds3), located in the sex-determining regions of the Y- and X-chromosome, respectively, were amplified by multiplex PCR. Amplified PCR products were run on agarose gels, and bands were observed at 617 bp for Zfy, 404 bp for Sry and 244 bp for DXNds3. Within the Young group, 11 dams produced a total of 28 embryos that gave rise to 10 mESC lines, of which only 1 was female, whereas, within the Old group, 13 dams produced a total of 62 embryos resulting in 28 mESC lines with 4 being female. The male bias in sex ratio is in line with other mESC derivation studies because DNA methylation is globally reduced in XX mouse ESC lines and consequently may provide the basis for X-chromosome instability. Reference Zvetkova, Apedaile and Ramsahoye24 Given that the Young group generated only one female mESC line, effects of maternal age were evaluated only between male mESC lines. However, as DOHaD animal studies often display sexually dimorphic data, Reference Velazquez, Smith, Smyth, Osmond and Fleming15 sex comparisons were also made within the Old group.
Chromosome counting (karyotyping) of mESC lines
70% confluent mESCs (P9–11) were harvested and treated with colcemid (0.1 µg/ml; Gibco, 15212-012) and incubated for 3 h at 37°C and 5% CO2. Reference Campos, Sartore, Abdalla and Rehen25 Cells were washed, trypsinised, treated with KCl (75 mM, hypotonic solution) and fixed in the fixative solution (methanol:glacial acetic acid 3:1) before producing chromosome spreads. Slides were incubated with Giemsa stain (1:25 dilution; Sigma, G500) and analysed under a phase contrast microscope at 100× magnification. Using ImageJ software, about 70 chromosome spreads were counted from each mESC line. Spreads were categorised as euploid (2× = 40), aneuploid (2× ≠ 40) or polyploid (2× ≥ 80). However, in accordance with the guidelines of American Type Cell Culture (ATCC), only karyotypically normal (>50% euploidy) mESC lines were used for further analysis. For chromosome analysis, six cell lines were screened each for Young and Old Male mESCs, as well as the Old Female mESC group.
mESC proliferation and viability assay
Established mESC lines (30,000 cells/well; P9–11) were cultivated, harvested and seeded onto freshly prepared MMC-MEFs (27,000 cells/well) on 24-well plates in triplicates and cell counts performed at 24-h intervals up to 96 h. For counting unattached or dead cells, spent media were collected and centrifuged. Cells were counted using a Neubauer haemocytometer with viable cells detected by trypan blue (Sigma, T8154) dye exclusion assay. The mean number of cells per well was calculated at each assay time point.
Quantitative PCR (qPCR) analysis
mESCs (400,000 cells/well) were seeded on MMC-MEFs (135,000 cells/well), coated 6-well plates, cultured for 3–4 d, trypsinised and pre-plated to eliminate MEFs. RNA quality was preserved by gently mixing the derived pellet with RNA Later (Sigma, R0901). Total RNA was isolated using the RNeasy mini kit (Qiagen, UK) and quantified using the Nanodrop ND-1000 spectrophotometer. RNA integrity was analysed by the presence of clear 28S and 18S rRNA bands (in 2:1 ratio) by gel electrophoresis. First-strand cDNA was synthesised with 400 ng RNA using a GoScriptTM Reverse Transcription System (Promega, UK) in the DNA Engine® Peltier Thermal Cycler (BioRad, UK). The primer templates were annealed at 25°C for 5 min, extended at 42°C for 1 h, and reverse transcriptase was inactivated at 70°C for 15 min.
Primers used for specific gene targets were from Primerdesign, UK (Supplementary Table S1) and were detected using the SYBR-green 2× PrecisionPlusTM Mastermix (Primerdesign, UK) protocol. Product was amplified using the Chromo4 Real-time Detector (BioRad, UK) and analysed with Opticon Monitor v3.1 software. The amplification programme included enzyme activation at 95°C for 2 min, followed by 40 cycles of denaturation at 95°C for 10 s, annealing (and data collection) at 60°C for 1 min and a final extension step at 72°C for 10 min. Melting curves were generated to confirm target-specific amplification by fluorescence detection between 60°C and 95°C at 1°C steps, holding for 15 s before the programme was terminated. Target genes were normalised to stable house-keeping genes Reference Radonić, Thulke, Mackay, Landt, Siegert and Nitsche26 using the Primerdesign geNorm kit. Reference Vandesompele, De Preter and Pattyn27 Gene stability was determined using qbase+ software, and genes Ywhaz and Rpl13a were identified as the most stable reference genes. Negative RT and water controls did not show amplification in the quantitation graphs. PCR products and primers were qualitatively analysed by gel electrophoresis and showed single bands at correct amplicon size.
Flow cytometry
Data acquisition was performed on a FACSCalibur flow cytometer (BD Biosciences) and analysed by FlowJo v.10 software. Fluorescence-activated cell sorting (FACS) was used to analyse the protein expression of: (i) pluripotency (OCT4, NANOG and SOX2); (ii) proliferation (Ki-67); (iii) apoptosis (Annexin V) and (iv) cell death (propidium iodide, PI) markers (antibodies used are listed in Supplementary Table S2) in undifferentiated mESCs (P9-P10) seeded on MMC-MEFs (135,000 cells/well of a 6-well dish). In addition to using mESC-specific markers, MEF cells were further eliminated by adjusting the forward scatter (FSC, indicating cell size) and side scatter (SSC, indicating cell granularity) plots. While pluripotency analysis was conducted after culturing mESCs (200,000 cells/well) for 3 d; samples for cell proliferation (mESCs seeded at 150,000 cells/well) were collected every 24 h for 96 h. Cells were stained for intracellular (nuclear) markers using Foxp3 Fixation/Permeabilization working solution (Thermo Fisher Scientific, UK). For analysis, samples were re-suspended in flow cytometry staining buffer (PBS with 3% foetal bovine serum, FBS). Samples for cell apoptosis were prepared following eBiosciences AnnexinV-FITC Apoptosis kit protocol (BMS500FI), and mESCs (100,000 cells/well) were harvested every 24 h for 96 h. Anti-tumour agent etoposide (20 µg/ml, incubated for 4 h) induced apoptosis in Annexin V+ control samples, while floating cells were used as positive control for dead cells (PI+). The percentage of apoptotic cells was determined by generating a dual-colour dot plot (Annexin V-FITC (FL-1) versus PI (FL-2)) and then setting a quadrant marker based on unstained and single-labelled control samples. The percentage of cells in each population and gate of interest was quantified for 20,000 cell events.
Immunocytochemistry
mESCs (30,000 cells/well) were cultured on MMC-MEFs (27,000 cells/well) (on sterile coverslips) in 24-well plates. At 70% confluency (3 d in culture), cells were fixed with 4% paraformaldehyde (PFA) and permeabilised in 0.2% Triton X-100 in PBS at room temperature. Non-specific antibody binding was blocked with 3% BSA, and cells were stained with primary antibody at 4°C overnight. Cells were incubated with appropriate Alexa-Fluor conjugated secondary antibody in the blocking solution, for 1 h at room temperature (Supplementary Table S2). Cell nuclei were counterstained with DAPI pre-diluted in Mowiol mounting media. Images were captured using a Leica DM5000 B fluorescence microscope coupled to a Leica DFC300FX camera.
Statistics
For experimental analyses, four mESC lines derived from different blastocysts were used for AMA and control treatments. All lines were derived from separate mothers except two lines from Young male and Old female treatments which were from the same dam. Statistical analysis was performed using Statistical Package for the Social Sciences (i.e. IBM SPSS Statistics 24) with mother as a random variable for relevant sections comprising pluripotency expression, cell proliferation assays, cell death and apoptosis assays and qPCR assays. SPSS analysis showed dam origin had no significant effect. An independent Student’s t-test was also used for embryo development, mESC derivation efficiency, sex differences and karyotype aberrations. Pairwise comparisons were made between Young male versus Old male for effect of AMA on male embryo-derived mESCs, and between Old male versus Old female for effect of sexual dimorphism within the Old group with outcomes from both separate comparisons integrated into the same graphs for conciseness. Data were tested for assumptions of normality using the Shapiro–Wilk normality test (GraphPad Prism v.8 software) and considered normal where values were over significance cut-off (p > 0.05). Variance homogeneity was analysed using the F-test. All data are expressed as means ± Standard Deviation (SD). p < 0.05 was considered statistically significant, and p < 0.1 was considered as a non-significant trend towards significance.
Results
Advanced maternal age (AMA) delays embryo development at E3.5
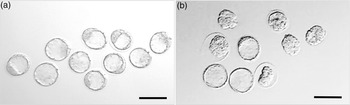
At E3.5, embryos were collected from Young (7–8 weeks) and Old (7–8 months) C57/BL6 mothers and developmental stage assessed (Table 1). Whilst no difference was observed between Young and Old mice in dams becoming pregnant, embryo development was delayed in Old mothers with fewer blastocysts formed (p < 0.05), more present at an earlier stage of expansion (p < 0.05), and at non-significant trend for more morulae and arrested/degenerate embryos (p < 0.1) compared with Young mothers (Table 1) (Fig. 1).
Embryo development from young and old female mice at E3.5

Number (%) of embryos collected; n = number of dams.
* p < 0.05.
† p < 0.1.
Representative images of embryos derived from (a) Young (7–8 weeks) and (b) Old (7–8 months) female mice (C57BL/6 females mated with CBA males) at E3.5. Magnification bar = 200 µm.

AMA did not affect derivation efficiency of mESC lines
Mouse ESC lines were derived from E3.5 blastocysts of Young and Old dams and cultured on MMC-MEFs in an mESC medium. ICM outgrowths were cultured individually, and each mESC line was generated from an individual blastocyst. No differences were found in the derivation efficiency of mESC lines isolated from individual Old dams (45%) compared to Young dams (36%). The number of male mESC lines (86% in Old; 90% in Young) isolated was higher than female lines for both groups; hence, effects of maternal age were evaluated only between male mESC lines. However, sex comparisons were made within the Old group.
mESC lines from old mothers show chromosomal abnormalities
For karyotype analysis, 70% confluent mESC lines (P10–11) were treated with colcemid and hypotonic solution (KCl) and slides stained with Giemsa. From each mESC line, at least 70 chromosome spreads were counted and categorised as euploid (2× = 40), aneuploid (2× ≠ 40) or polyploid (2× ≥ 80) and only those lines with more than 50% euploidy were selected for further experiments. Since mESC karyotype may vary with extended in vitro culture Reference Rebuzzini, Zuccotti, Redi and Garagna28 and lines with apparent normal karyotype (>50%) may have a specific aneuploidy with a higher number of spreads with 38, 39 or 41 chromosomes, Reference Gaztelumendi and Nogués29 aneuploid spreads were further grouped into 2× ≤ 37, 2× = 38 and 2× = 39 (Table 2). Old male mESCs showed reduced euploidy and consequently increased total aneuploidy (2× ≠ 40, p = 0.024) than Young male lines (Table 2). Old male mESCs had increased number of spreads with <37 chromosomes (2× < 37, p = 0.008), with 37 (2× = 37, p = 0.033) and, at non-significant trend, with 38 (2× = 38, p = 0.090) chromosomes, compared to Young male mESC lines. No differences were found between polyploidy levels (2× ≥ 80). Separated by sex, Old male lines showed a greater number of cells with 38 chromosomes (2× = 38, p = 0.03) compared to Old female lines, although no differences were observed between euploidy (Table 2).
Effect of maternal age on karyotype of mESCs lines derived from young and old dams

Data presented as % chromosome spreads; n = number of cell lines analysed (70 spreads from each); x = number of chromosomes.
* p < 0.05.
† p < 0.1 (old males versus young males; old females versus old males).
** p < 0.01.
Effect of AMA on pluripotency and differentiation marker expression of derived mESCs
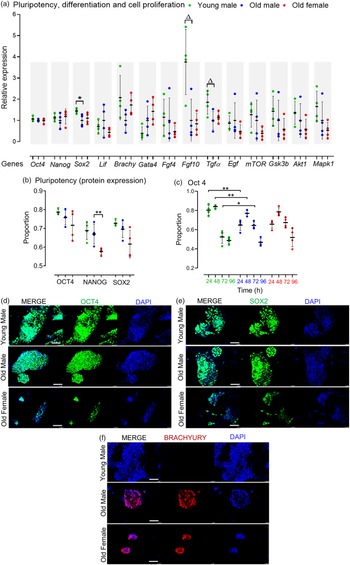
The pluripotency of stem cells is typically divided into naïve and primed states. Reference Davidson, Mason and Pera30 Collectively, AMA did not affect the relative mRNA expression of the naïve pluripotency markers Oct4, Nanog and Lif, but Old male mESCs showed reduced Sox2 expression (p = 0.049) compared to Young male lines (Fig. 2a). Flow cytometry-assisted intracellular (nuclear) staining revealed no significant effect of AMA on the pluripotent protein expression (i.e. OCT4, NANOG and SOX2) of the Old male and Young male mESC lines after 4 d culture (Fig. 2b). However, OCT4 expression appears dynamically regulated over 0–96 h culture with a higher proportion of Young male cells expressing OCT4 up to 48 h (p < 0.001) compared with Old male lines, and while both lines diminish OCT4 expression at 72 h, this is slower in Old male lines (p < 0.05; Fig. 2c). Sexually dimorphic differences were observed within the Old group, where the Old Female mESC lines displayed reduced NANOG-expressing mESCs (p = 0.033) compared to the Old Male group (Fig. 2b).
Pluripotent, differentiation and cell proliferation markers in undifferentiated Young (7–8 weeks) versus Old (7–8 months) male, and Old Male versus Old Female (7–8 months) mESC lines. (a) Genes of interest were normalised to Ywhaz and Rpl13a within geNorm; Old male mESC lines had reduced expression (qPCR) of Sox2 (p = 0.049), and non-significant trend reduction in Fgf 10 (p = 0.0573) and Tgf α (p = 0.0522) relative to Young male lines. (b) Quantitative analysis of protein expression for pluripotent markers. No differences were identified between Old Male versus Young Male lines, but Old Female mESCs had reduced NANOG expression (p < 0.05); mESCs were cultured in triplicate with n = 4 mESC lines per group. (c) Protein expression of OCT4 over time is distinct between Old and Young Male mESCs with reduced expression at earlier times (p < 0.001) and sustained expression at later times (p < 0.05) in Old Male lines. (d–e) Qualitative immunocytochemistry images showed similar expression of pluripotent markers OCT4 and SOX2, and colony size in Young and Old Male mESC lines. Old Female lines however showed reduced colony size with less relative expression of the pluripotent markers compared to the Old Male group. (g) Immunocytochemistry showed no expression of the mesodermal marker, BRACHYURY, in Young male lines although colonies stained positive in Old Male and Old Female lines. Magnification bar = 200 µm. Data presented as means ± SDs based on n = 4 mESC lines per group examined in triplicate; **p < 0.001, *p < 0.05,▵p < 0.1 non-significant trend. Note: for (a–c), comparisons between Old Male and Young Male for ageing effects and between Old Male and Old Female for sex effects were normalised and analysed by t-test separately hence without post-hoc correction and placed in same chart for conciseness.

Maternal age did not influence the gene expression of mesodermal (Brachyury) or endodermal (Gata4) transcripts in cell lines maintained in an undifferentiated state (Fig. 2a). However, Old male mESC lines had, a non-significant trend for reduced transcript levels of Fgf10 (p = 0.0573), important in cardiomyocyte differentiation, and Tgf-α (p = 0.0522), important in regulating cell proliferation and apoptosis (Fig. 2a) but no differences in other signalling and proliferation markers (mTOR, Gsk3b, Akt1, Mapk1). No sex-induced differences were observed within the Old mESC group for these markers (Fig. 2a).
For qualitative analysis, mESC lines were cultured at the same starting density for 4 d (as used in FACS) before immunocytochemistry for OCT4, SOX2, BRACHYURY and Dapi nuclear staining (Fig. 2d, 2e and 2f). Strong expression of OCT4 and SOX2 was present in both Young and Old male lines (Fig. 2d and 2e). Old Female mESC lines, however, showed relatively weak staining and smaller colonies compared to Old Male lines. Old Male and Female lines displayed similar staining for BRACHYURY which was not detected in Young male mESC lines (Fig. 2f).
Effect of AMA on cell proliferation and viability of derived mESCs
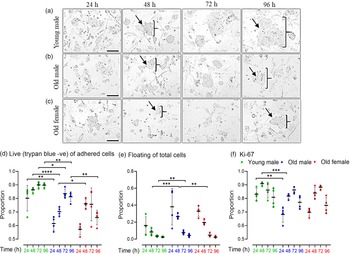
Cell lines were seeded (27,000 cells/well) on 24-well plates for 96 h and harvested every 24 h. Phase contrast images indicated Young male lines (Fig. 3a) to have more and larger colonies at all time points compared to Old male mESC lines (Fig. 3b), whereas Old Female mESC lines (Fig. 3c) had the smallest and least number of colonies at all time points. For analysis, mESCs were separated into unattached (dead) and adhered cells at each time point; adherent cells were trypsinised and stained with viability dye, trypan blue (TB) to distinguish live (TB negative) and dead (TB positive) cells. Young male mESC lines had a higher proportion (p = 0.001) and increased number (p < 0.001) of live adherent cells compared to Old male mESC lines at all time points (Fig. 3d). Consequently, Young male lines had fewer unattached (dead) cells (p < 0.001) compared to Old male lines at 48 h (p = 0.0004) and 72 h (p = 0.015) (Fig. 3e). Relative to Old males, Old female lines had an increased proportion of live cells at 48 h (p = 0.0493) with a consequent decrease in unattached/dead cells (Fig. 3d and 3e). All groups showed an increased rate of cell growth (p < 0.001) over the first 3 d of culture, before reducing by day 4, as expected (Fig. 3d).
Cell proliferation and viability of undifferentiated Young male (7–8 weeks), Old (7–8 months) male, and female mESC lines. (a–c) Representative phase-contrast images of cell proliferation of Young male, Old male and Old female mESCs. After seeding, images were captured every 24 h over a period of 96 h. Images show that Young male (a) mESC lines have larger colonies with increased density of cells/colony compared to Old male (b) mESC lines. Old Female mESC lines (c) present much smaller colony size and fewer mESC clones compared to Old Male mESC lines. Arrows and parenthesis point towards the colony size differences across the groups. Magnification = 100 µm. (d, e) Trypan negative (live) cells are presented as proportion of adherent (live and dead) cells, and floating cells as proportion of total (live, dead and floating) cells. (d) Old male mESC lines had fewer live adherent cells at all time points, and (e) increased proportion of floating cells at 48 h and 72 h, as compared to Young male mESC lines. (f) Protein expression of cell proliferation marker Ki67 over time presented as the proportion positive of total cells (stained and unstained). Ki67 expression was lower in Old versus Young mESC lines at 24 h (p = 0.011) and 48 h (p = 0.001). Data presented as means ± SDs based on n = 4 mESC lines per group. *p < 0.01, **p < 0.001, ***p < 0.0001, ****p < 0.00001. Note: for (d–f), comparisons between Old Male and Young Male for ageing effects and between Old Male and Old Female for sex effects were normalised and analysed by t-test separately hence without post-hoc correction and placed in same chart for conciseness.

Proliferation was further assessed over 24–96 h culture by the level of a nuclear-specific biomarker of cellular growth, Ki67 Reference Preusser, Heinzl and Gelpi31 in viable cells using FACS (Fig. 3f). In agreement with the direct proliferation analysis, Ki67 expression was increased in Young male mESC lines compared to Old male mESC lines at 24 h (p = 0.01) and 48 h (p = 0.001; Fig. 3f), while sex-associated differences were not observed within the Old mESC lines.
Cell apoptosis and death analysis of derived AMA mESCs
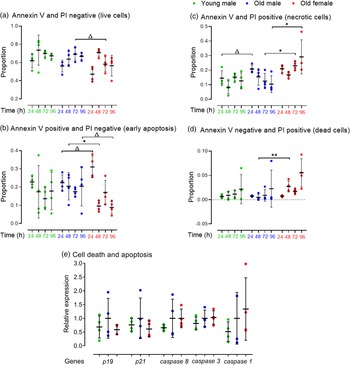
We assessed whether the reduced proportion of live cells and proliferation in Old male mESC lines was contributed by increased apoptosis or cell death assessed by protein expression of Annexin V-FITC and PI using FACS. Cell lines were seeded at defined cell density and analysed every 24 h for up to 96 h. Cells were selected from combined mESCs and MEFs using the pluripotency surface marker, Stage-Specific Embryonic Antigen-1 (SSEA-1) which did not differ between Young and Old male lines (data not shown). SSEA-1 positive cells were further separated into Annexin V and PI negative (live cells), Annexin V positive and PI negative (early apoptotic cells), Annexin V and PI positive (late apoptotic or necrotic cells) and Annexin V negative and PI positive (dead cells). Data are presented as proportion positive of total cells (stained and unstained cells) (Fig. 4). Young and Old male lines had similar proportions of live cells at each time point (Fig. 4a) and also of early apoptotic cells (Fig. 4b). However, differences between Old male and female lines were found including a non-significant trend for more early apoptotic cells in female lines at 24 h but fewer at later time points (p < 0.1; Fig. 4b). Old male lines had a non-significant trend for increased late apoptotic or necrotic cells when compared to Young male lines at 24 and 48 h (p < 0.1), and these cells were increased in Old female lines compared to male lines (p < 0.05; Fig. 4c). Old female lines were also increased in dead cells at 48 h compared to Old male cells (Annexin negative/PI positive; p < 0.01), but no differences were detected between Young and Old male lines (Fig. 4d). Overall, Old Female lines had a non-significant trend for decreased live (p = 0.095) and significantly increased necrotic (p = 0.003) proportion of total cells compared to Old Male lines (Fig. 4a and 4c).
FACS analysis for detection of early apoptosis (Annexin V) and cell death (PI) in undifferentiated Young (7–8 weeks) versus Old (7–8 months) male, and Old male versus Old female (7–8 months) mESC lines. mESCs were cultured in duplicate. (a–d) Data are presented as proportion of total cells. Compared to the Young group, Old mESCs presented (c) increased necrosis at non-significant trend at 24 h (p = 0.075), although the (b) proportion of early apoptotic cells was unaffected by age and time. Sex differences were observed within the Old mESC group where Old Female mESC lines showed (b) increased proportion of early apoptotic cells at non-significant trend (p = 0.059) at 24 h, which decreased at 48 h (p = 0.055) and 96 h (p = 0.085) also at non-significant trend. Old Female mESC lines also exhibited increased proportion of (c) necrotic cells at 72 h (p = 0.035) and 96 h (p = 0.035), and (d) dead cells at 48 h (p = 0.01) compared to Old male mESC lines. (e) However, RT-qPCR analysis of cell apoptotic markers was unaffected by maternal age and sex. Data presented as means ± SDs based on n = 4 mESC lines per group, where▵ = trending p < 0.1, * = p < 0.05 and ** =p < 0.01. Note: for (a–e), comparisons between Old Male and Young Male for ageing effects and between Old Male and Old Female for sex effects were normalised and analysed by t-test separately hence without post-hoc correction and placed in same chart for conciseness.

We next assessed mRNA expression of cyclin-dependent kinase inhibitors p19 and p21 and cysteine-dependent proteases in apoptosis of initiator (caspase 9), executor (caspase 3) and inflammatory (caspase 1) caspases (Fig. 4e). Although no age- or sex-induced differences were observed, Old male mESCs showed a non-significant increase in mean transcript levels for all markers compared to Young male lines.
Effect of AMA on expression of epigenetic modifiers and glucose transportation
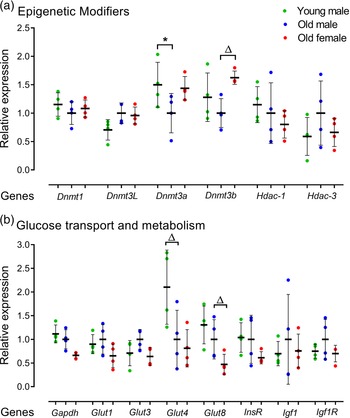
The effect of AMA on mRNA expression of epigenetic modifiers including DNA methyltransferases (Dnmt1, Dnmt3L, Dnmt3a, Dnmt3b) and histone deacetylases (Hdac-1, Hdac-3) was assessed. Old male lines showed reduced Dnmt3a expression (p = 0.049) compared to Young male lines (Fig. 5a). Old male lines also had a non-significant trend for reduced expression of Dnmt3b compared to Old female lines (p < 0.1; Fig. 5a). No age or sex-related differences were observed for Hdac1 or Hdac3.
Relative gene expression for epigenetic modifiers and glucose transporters in undifferentiated Young (7–8 weeks) versus Old (7–8 months) male and Old male versus Old female (7–8 months) mESC lines. Real-time PCR analysis of DNA methyltransferases Dnmt1, Dnmt3L, Dnmt3a and Dnmt3b, histone modifiers Hdac1 and Hdac3; glucose transporters Glut1, Glut3, Glut4 and Glut8 and metabolisers Gapdh, InsR, Igf1 and Igf1R. Genes of interest were normalised to Ywhaz and Rpl13a within geNorm. (a, b) Old male mESC lines showed reduced expression of Dnmt3a (p = 0.049) and Glut4 at non-significant trend level (p = 0.0685) compared to Young male mESC lines. Old Female mESC lines showed reduced expression of Dnmt3b at non-significant trend (p = 0.078) and increased relative expression of Gapdh (p = 0.029) and Glut8 (p = 0.055) at non-significant trend compared to Old Male mESC lines. Data presented as means ± SDs based on n = 4 mESC lines per group. * indicates p < 0.05 and ▵indicates trend p < 0.1. Note: for (a, b), comparisons between Old Male and Young Male for ageing effects and between Old Male and Old Female for sex effects were normalised and analysed by t-test separately hence without post-hoc correction and placed in same chart for conciseness.

We further analysed the expression of metabolic regulators across cell lines including mRNA expression of glucose and insulin metabolisers Gapdh, InsR, Igf1 and Igf1R, and glucose transporter isoforms Glut1, Glut3, Glut4 and Glut8 (Fig. 5b). Here, Old male mESC lines had a non-significant trend for reduced glucose transporter Glut4 levels (p = 0.0685; Fig. 5b), while Old female lines had reduced levels of the glycolytic enzyme Gapdh (p = 0.029) and a non-significant trend for reduced glucose transporter, Glut8 (p = 0.055) compared with Old male lines (Fig. 5b).
Discussion
We have investigated the effects of AMA on mouse blastocyst development and the phenotype of undifferentiated mESCs derived from the ICM. Our primary objective was to develop a model for molecular and cellular analysis of early mechanisms contributing to the poorer fertility and health outcomes known to occur, independent of maternal somatic senescence, as a consequence of AMA. Reference Crawford and Steiner1,Reference Tearne, Robinson and Jacoby6,Reference Cooke and Davidge7,Reference Janny and Menezo14,Reference Velazquez, Smith, Smyth, Osmond and Fleming15 Our model of AMA used 7–8 month females when the decline in fertility is manifested by reduced oestrus cycles, decreased breeding performance with litter size and number of live births declining Reference Nelson, Felicio, Randall, Sims and Finch32,Reference Guo and Pankhurst33 and so is broadly comparable to ∼40-year-old human in terms of age-related reproductive senescence. However, whilst we recognise across different bodily systems, comparison of mouse and human senescence may be complex, with ‘middle age’ compared as 10–14 months versus 37–48 years, respectively, the Reference Flurkey, Currer, Harrison, Fox, Barthold, Davisson, Newcomer, Quimby and Smith34 current focus was on reproductive potential to ensure our model had clinical relevance.
From our previous studies on the effects of maternal undernutrition on early embryo developmental potential, we have shown that derived mESCs do indeed exhibit and retain molecular and cellular changes in phenotype after several passages that match the in vivo condition and facilitate understanding of early mechanisms of adverse programming of health. Reference Sun, Velazquez and Marfy-Smith35,Reference Sun, Denisenko and Sheth36 This has also been shown in one study for mESCs derived from ART treatments to assess phenotypic changes, Reference Assadollahi, Fathi, Abdi, Khadem Erfan, Soleimani and Banafshi19 but in another, mESC stability did not retain ART-mediated effects which may reflect strain differences. Reference Simbulan, Di Santo and Liu37 This strategy can therefore help overcome the inaccessibility and limited size of the pre- and peri-implantation embryo in vivo and reduce animal use in biomedical research.
Our data revealed AMA-induced delay in embryo development (E3.5) but did not affect the derivation efficiency of mESC lines nor the strong bias of male over female cell lines. Female ESC lines are more prone to developing abnormal karyotypes related to reduced cellular function and proliferation. Reference Zvetkova, Apedaile and Ramsahoye24,Reference Hadjantonakis and Papaioannou38 Collectively, mESCs from male AMA blastocysts exhibited a higher incidence of aneuploidy and karyotypic abnormalities, particularly increased occurrence of <40 chromosomes. Normal karyotype AMA lines also displayed an altered pattern of expression of pluripotency genes and evidence of increased cellular senescence with poorer proliferation and increased incidence of late apoptotic cells. Last, AMA mESC lines exhibited reduced expression of genes important in critical cellular processes including epigenetic, metabolic and differentiation pathways. AMA lines also exhibited differences in these criteria dependent upon sex. Thus, these new cell lines exhibit all the characteristics expected of undifferentiated mESCs, but since they have not yet been used to generate chimaeras with full development of all three germ layers, in strict terms, they are mESC-like.
Whilst derivation and in vitro culture of mESC lines may potentially increase the risk of epigenetic abnormalities over time and increasing passage number, we Reference Huntriss and Picton39,Reference Horii, Yanagisawa, Kimura, Morita and Hatada40 consider this unlikely here since passages have been limited and culture of both Old and Young lines normalised throughout experiments. Thus, differences observed between the treatments would already be established and programmed before derivation, permitting the AMA lines to provide a model for analysis of cellular mechanisms of ageing on developmental potential.
The reduced viability and retarded rate of blastocyst development found in the Old group mirrors that shown previously. Reference Assadollahi, Fathi, Abdi, Khadem Erfan, Soleimani and Banafshi19,Reference Fu, Cheng, Hou and Zhu41 Poorer AMA fertility can derive from a combination of maternal cellular deficiencies including reduced mitochondrial efficiency and energy production, increased oxidative stress and declining steroid hormone levels, all of which may contribute to chromosomal and spindle errors as well as reduced early embryo viability. Reference Davison, Bell, Donath, Montalto and Davis42–Reference May-Panloup, Brochard and Hamel45 Indeed, microarray analysis of aged metaphase II mouse oocytes reveals significant altered expression of genes involved in chromatin and spindle organisation, mitochondrial function and oxidative stress Reference Hamatani, Falco and Carter46,Reference Pan, Ma, Zhu and Schultz47 with a similar pattern evident in the human, Reference Grøndahl, Yding Andersen, Bogstad, Nielsen, Meinertz and Borup48 and some but not all pathways altered at the proteomic level. Reference Schwarzer, Siatkowski and Pfeiffer49 Moreover, pharmacological treatments to overcome such cellular deficiencies can reverse these effects of ageing. Reference Silva, Greene, Strauss, Herrick, Schoolcraft and Krisher50,Reference Yoon, Juhn and Jung51 In our previous study on AMA in this strain of mice, blastocysts from aged dams also showed fewer trophectoderm and total cells compared with controls. Reference Velazquez, Smith, Smyth, Osmond and Fleming15 Collectively, these oocyte-derived perturbations continue into post-implantation concept with abnormalities in foetal and placental morphology. Reference Lopes, Fortier, Darricarrère, Chan, Arnold and Trasler52
Whilst embryos from Old mothers showed characteristic poorer quality and viability, ESC derivation efficiency was similar to Young embryos. However, early passage mESCs showed an increased incidence of aneuploidy typical of the AMA phenotype in vivo. In particular, Old male lines exhibited increased percentage of karyotype with 38 or less chromosomes than Young male lines but no differences in the incidence of polyploidy, suggesting instability to be chromosome-specific, as has been shown for mESCs in general. Reference Gaztelumendi and Nogués29 The increase in aneuploidy provides authentication of the AMA phenotype known to contribute to the reduced fertility of older women in ART. Reference Harton, Munné and Surrey53 Indeed, excess aneuploidy is also found in an ART model of mESC formation and increased by maternal age. Reference Assadollahi, Fathi, Abdi, Khadem Erfan, Soleimani and Banafshi19
Alterations in pluripotency marker expression were one notable characteristic of AMA mESC lines. Whilst these lines had normal expression of the naïve pluripotency markers Oct4, Nanog and Lif, AMA lines showed reduced Sox2 expression and an altered profile over time of OCT4 expression at the protein level, reduced in early cultures but sustained in later cultures. The reduction in Sox2 expression may reduce overall pluripotency and increase differentiation of ESCs by disturbing the positive-feedback loop between core-regulatory transcription factors essential in maintaining pluripotency as well as continuous ESC self-renewal. Reference Ivanova, Dobrin and Lu54–Reference Kopp, Ormsbee, Desler and Rizzino57 In doing so, the reduction in Sox2 expression may contribute to the observed dynamic changes in OCT4 expression. Like other pluripotency factors, SOX2 not only maintains self-renewal but also assists in the proliferation of ES cells, Reference Thomson, Liu, Zou, Smith, Meissner and Ramanathan58 so may also contribute to the reduced proliferation and cell survival found in the Old mESC lines.
Old male mESC lines showed an increased proportion of dead cells, reduced live cells, reduced cell proliferation by Ki67 FACS analysis, reduced expression of the mitogen Tgfα and increased proportion of late apoptotic/necrotic cells by Annexin V-PI FACS assay. Although the cyclin-dependent kinase inhibitors (p19 and p21) and apoptosis markers (caspase 9, caspase 3 and caspase 1) showed no transcriptional differences between the groups, Old male mESCs showed increased mean transcript levels for all markers compared to Young male mESC lines. Collectively, these data warrant further evaluation of the role of altered pluripotency expression in this outcome as well as cell death mechanisms such as the Ras/Raf/extracellular signal-regulated kinase (Erk) signalling pathway. Reference Cagnol and Chambard59
The AMA male lines also showed differences in gene expression associated with other cellular processes compared to the control lines. Dnmt3, the key de novo DNA methylation regulator in development, is reduced in Old versus Young male lines which have implications for the epigenetic restructuring that occurs in the embryonic genome during post-implantation lineage allocation. Reference Smallwood and Kelsey60 Consistent with this result, aged oocytes and embryos show reduced DNA methylation both in vivo and in vitro. Reference Yue, Fu and Zhou61 In stem cells, de novo DNA methyltransferases maintain self-renewal, pluripotency and, therefore, affect proliferation and differentiation capacity of these cells, Reference Tadokoro, Ema, Okano, Li and Nakauchi62 suggesting that this epigenetic deficiency may contribute more broadly to our AMA mESC phenotype. Similarly, the reduction in expression of Fgf10 in Old male lines may affect cardiomyocyte differentiation since it plays a critical role in cardiac development in the embryo. Reference Hubert, Payan and Rochais63 Poor cardiac function and hypertension have been shown to be symptomatic of adult offspring in response to adverse periconceptional developmental programming from diverse environments including maternal undernutrition and ART treatments. Reference Fleming, Watkins and Velazquez16 Moreover, mouse maternal ageing leads to increased blood pressure and reduced heart size in offspring. Reference Velazquez, Smith, Smyth, Osmond and Fleming15
Phenotypic differences were also observed in the AMA lines dependent upon sex. Female lines displayed reduced Nanog expression and showed relatively weak staining and smaller colonies compared to male lines. Female AMA lines also displayed increased incidence of apoptotic/necrotic cells than male lines and had differences in level of expression of epigenetic and metabolic genes. Developmental programming has consistently shown differences in phenotype and outcomes between male and female offspring Reference Fleming, Watkins and Velazquez16 including in response to AMA. Reference Velazquez, Smith, Smyth, Osmond and Fleming15 Sex-dependent differences in susceptibility to disease usually arise in utero. Reference Schalekamp-Timmermans, Cornette and Hofman64 Moreover, environmental factors are known to differentially influence cell signalling, gene expression and morphogenesis during development dependent upon sex that can be maintained into postnatal life. Reference Hansen, Dobbs, Denicol and Siqueira65
In conclusion, we have shown that AMA leads to a retardation in preimplantation development and a complex series of phenotypic effects in derived mESC lines at chromosomal, molecular and cellular levels. These perturbations affect pluripotency, cell proliferation and apoptosis with potential to alter epigenetic and differentiative mechanisms throughout development. These novel cell lines derived from natural embryo development provide a model to investigate early mechanisms of AMA effect on developmental programming in the absence of confounding maternal senescence.
Supplementary material
To view supplementary material for this article, please visit https://doi.org/10.1017/S2040174421000325
Acknowledgements
We thank the Biomedical Research Facility staff for animal technical support and the Faculty Flow Cytometry Unit staff for FACS support.
Financial support
This work was supported through the European Union FP7-PEOPLE-2012-ITN EpiHealthNet programme (317146) and FP7-CP-FP Epihealth programme (278418) to T.P.F. and the BBSRC (BB/F007450/1) to T.P.F.
Conflicts of interest
The authors declare that there are no competing interests associated with this manuscript.
Ethical standards
All animal experimentation was performed under license from the UK Home Office in accordance with regulations and with local ethics committee approval.


 Open access