





Introduction
Effective prevention and management of SARS-CoV-2 infections relies on identifying those who are infected or potentially infectious. The most commonly used method for detection is reverse transcriptase quantitative polymerase chain reaction (RT-qPCR) [Reference Wynants1–Reference Jefferson3]. Amplification of genomic sequences occurs in a sample mixture with repeated thermal cycles adding copies of the target nucleic acids, usually measured in cycle thresholds (Ct). The lower the target nucleic acid amount in a sample, the longer it takes to reach a critical ‘threshold’ above baseline based on fluorescent signal detection. The Ct is ‘the thermal cycle number at which the fluorescent signal exceeds that of the background and thus passes the threshold for positivity’ [2].
Transmission from one host to another requires replication-competent SARS-CoV-2 to allow attachment to cellular targets and subsequent invasion. Specimens with a high Ct are unlikely to be culturable and have no potential for SARS-CoV-2 transmission [Reference Jefferson3]. There is a relationship between time of symptom onset, test timing, Ct, and symptom severity in immunocompetent hosts. Qualitative PCR cannot detect infectiousness, requiring integration and interpretation with medical, drug and exposure information, and using probes and methods validated against viral culture and gene sequencing. Few studies report these variables [Reference Bullard4, Reference Lin5].
Non-standardized reporting and testing has created interpretation challenges. For example, Ct reporting can be inconsistent, with differing platforms and testing methodologies, while cultures are expensive, laborious, time-consuming, and cannot be done outside Level 3 laboratories. We explored whether serial Ct measurements from the same individuals, using the same platform in the same laboratory with appropriate internal controls, could be substituted for viral cultures to facilitate decision-making regarding infectiousness. A declining Ct value with or without symptoms could signify an increased viral load and the possibility of becoming or being infectious [Reference Jefferson3], while a reverse situation could facilitate the decision to remove isolation precautions.
In our previous review, we included 29 studies (with searches until 10 September 2020) reporting attempts at culturing or observing tissue infection by SARS-CoV-2 in different specimens [Reference Jefferson3]. We sought to update the searches to explore the possibility of constructing a predictive comparative cohort integrating PCR and viral culture results from respiratory and other clinical specimens and detailed anamnestic, clinical, and epidemiologic data.
Methods
This update addressed the following questions:
-
1. What is the relationship between symptom onset, disease course, infectious status, immunologic status, vaccination, and changes in serial Ct values of SARS-CoV-2?
-
2. What is the relationship between the type of gene platform used and the change in Ct values of SARS-CoV-2?
-
3. Is there a single and/or complex set of variables that makes the association of a Ct more or less likely predictive of culturability and thus infectiousness?
Search
We updated our searches using LitCovid, medRxiv, Google Scholar, and the WHO Covid-19 database. The search terms used for identifying appropriate articles were CPE OR ‘cytopathic effect’ OR ‘Viral culture’ OR ‘virus culture’ OR ‘vero’ OR ‘virus replication’ OR ‘viral replication’ OR ‘cell culture’ OR ‘viral load’ to 30 June 2025. For medRxiv and Google Scholar, the terms coronavirus OR covid-19 OR SARS-CoV-2 were used to identify COVID-19 related articles. An information specialist [JB] undertook searches. Citation matching, forwards and backwards, were undertaken for key relevant articles. Only English-language articles were included. Two reviewers independently screened search results; a third adjudicator was used when required.
Inclusion and exclusion criteria
We included studies reporting attempts to culture SARS-CoV-2 and related them to exposure date, symptom onset to test, and detailed characteristics of the individual tested. We included adult persons exposed to SARS-CoV-2 in any setting who had undergone more than one RT-PCR assay during an acute respiratory episode of SARS-CoV-2 infection providing one or more respiratory or oropharyngeal specimens or other relevant environmental samples in their proximity.
We defined culture as encompassing several methods detecting exponential virus growth in cell culture and confirmed the replicating agent as SARS-CoV-2 (cell culture or live animal inoculation with verification techniques [PCR, immunological staining, or RNA gene sequencing]). Isothermal detection methods were not included.
We assessed observational cohort and case series studies with attempts to culture SARS-CoV-2. A successful comparison between the results of viral culture and surrogate methods, including rapid antigen tests, serial PCR trajectories, measuring Ct cut-offs, PCR targeting sub-genomic RNAs, or quantitative PCR (droplet digital PCR or internally standardized PCR) would support the use of such tests in identifying infectious cases. Identification of such individuals and the likelihood of infectivity would achieve objective 3. We excluded studies reporting aggregate Ct data or graphically displayed Ct values without individual results being available.
Data extraction
One reviewer extracted data, while a second reviewer checked the extractions. We extracted data from individuals tested on PCR positive/total number tested, with as many repeat values over time as possible; details of PCR methodology including use of internal controls, Ct values over time, date of symptom onset, symptoms, and veracity of symptom ascertainment (where available), date of symptom resolution, viral culture results/total number tested, details of viral culture methods, and SARS-CoV-2 identification.
Analysis
We report the number of observations, time from first RT-PCR, and symptom status.
We performed subgroup analyses by platform type, comorbidities, immune status, hospitalization, use of treatments, including immunotherapy, and SARS-CoV-2 lineage.
We tested the hypothesis that there is an association between positive growth of SARS-CoV-2 from cell culture and the first test result for RT-PCR Ct. We examined variables that may influence the interpretation of the Ct: gene, demographics, comorbidities, and baseline laboratory measures within 24 h of specimen collection. We also tested a secondary hypothesis that a trending analysis of serial Cts combined with clinical data from non-immunocompromised COVID-19 patients could reliably predict culture positivity and hence non-infectiousness based on reliable SARS-CoV-2 cell culture techniques done using internal controls, which could be used as a surrogate by clinicians for discontinuation of isolation.
To quantify how exogenous factors may influence Ct values, we fitted linear mixed-effects models with the first Ct value per individual as the outcome. Predictor variables were included as fixed effects, while the study was included as a random intercept to account for clustering of observations across studies. Univariate models were first fitted for each predictor separately. Predictors were prespecified based on clinical relevance and univariate associations (P < 0.10; see Table 1 and Supplementary WebTable 4). Forward selection (entry P < 0.05, removal P > 0.10) was then applied in the multivariable linear mixed-effects model to identify factors independently associated with Ct values. Results are reported as changes in Ct values with 95% confidence intervals (CIs) and adjusted P-values. All analyses were performed in R using the meta and lme4 packages.
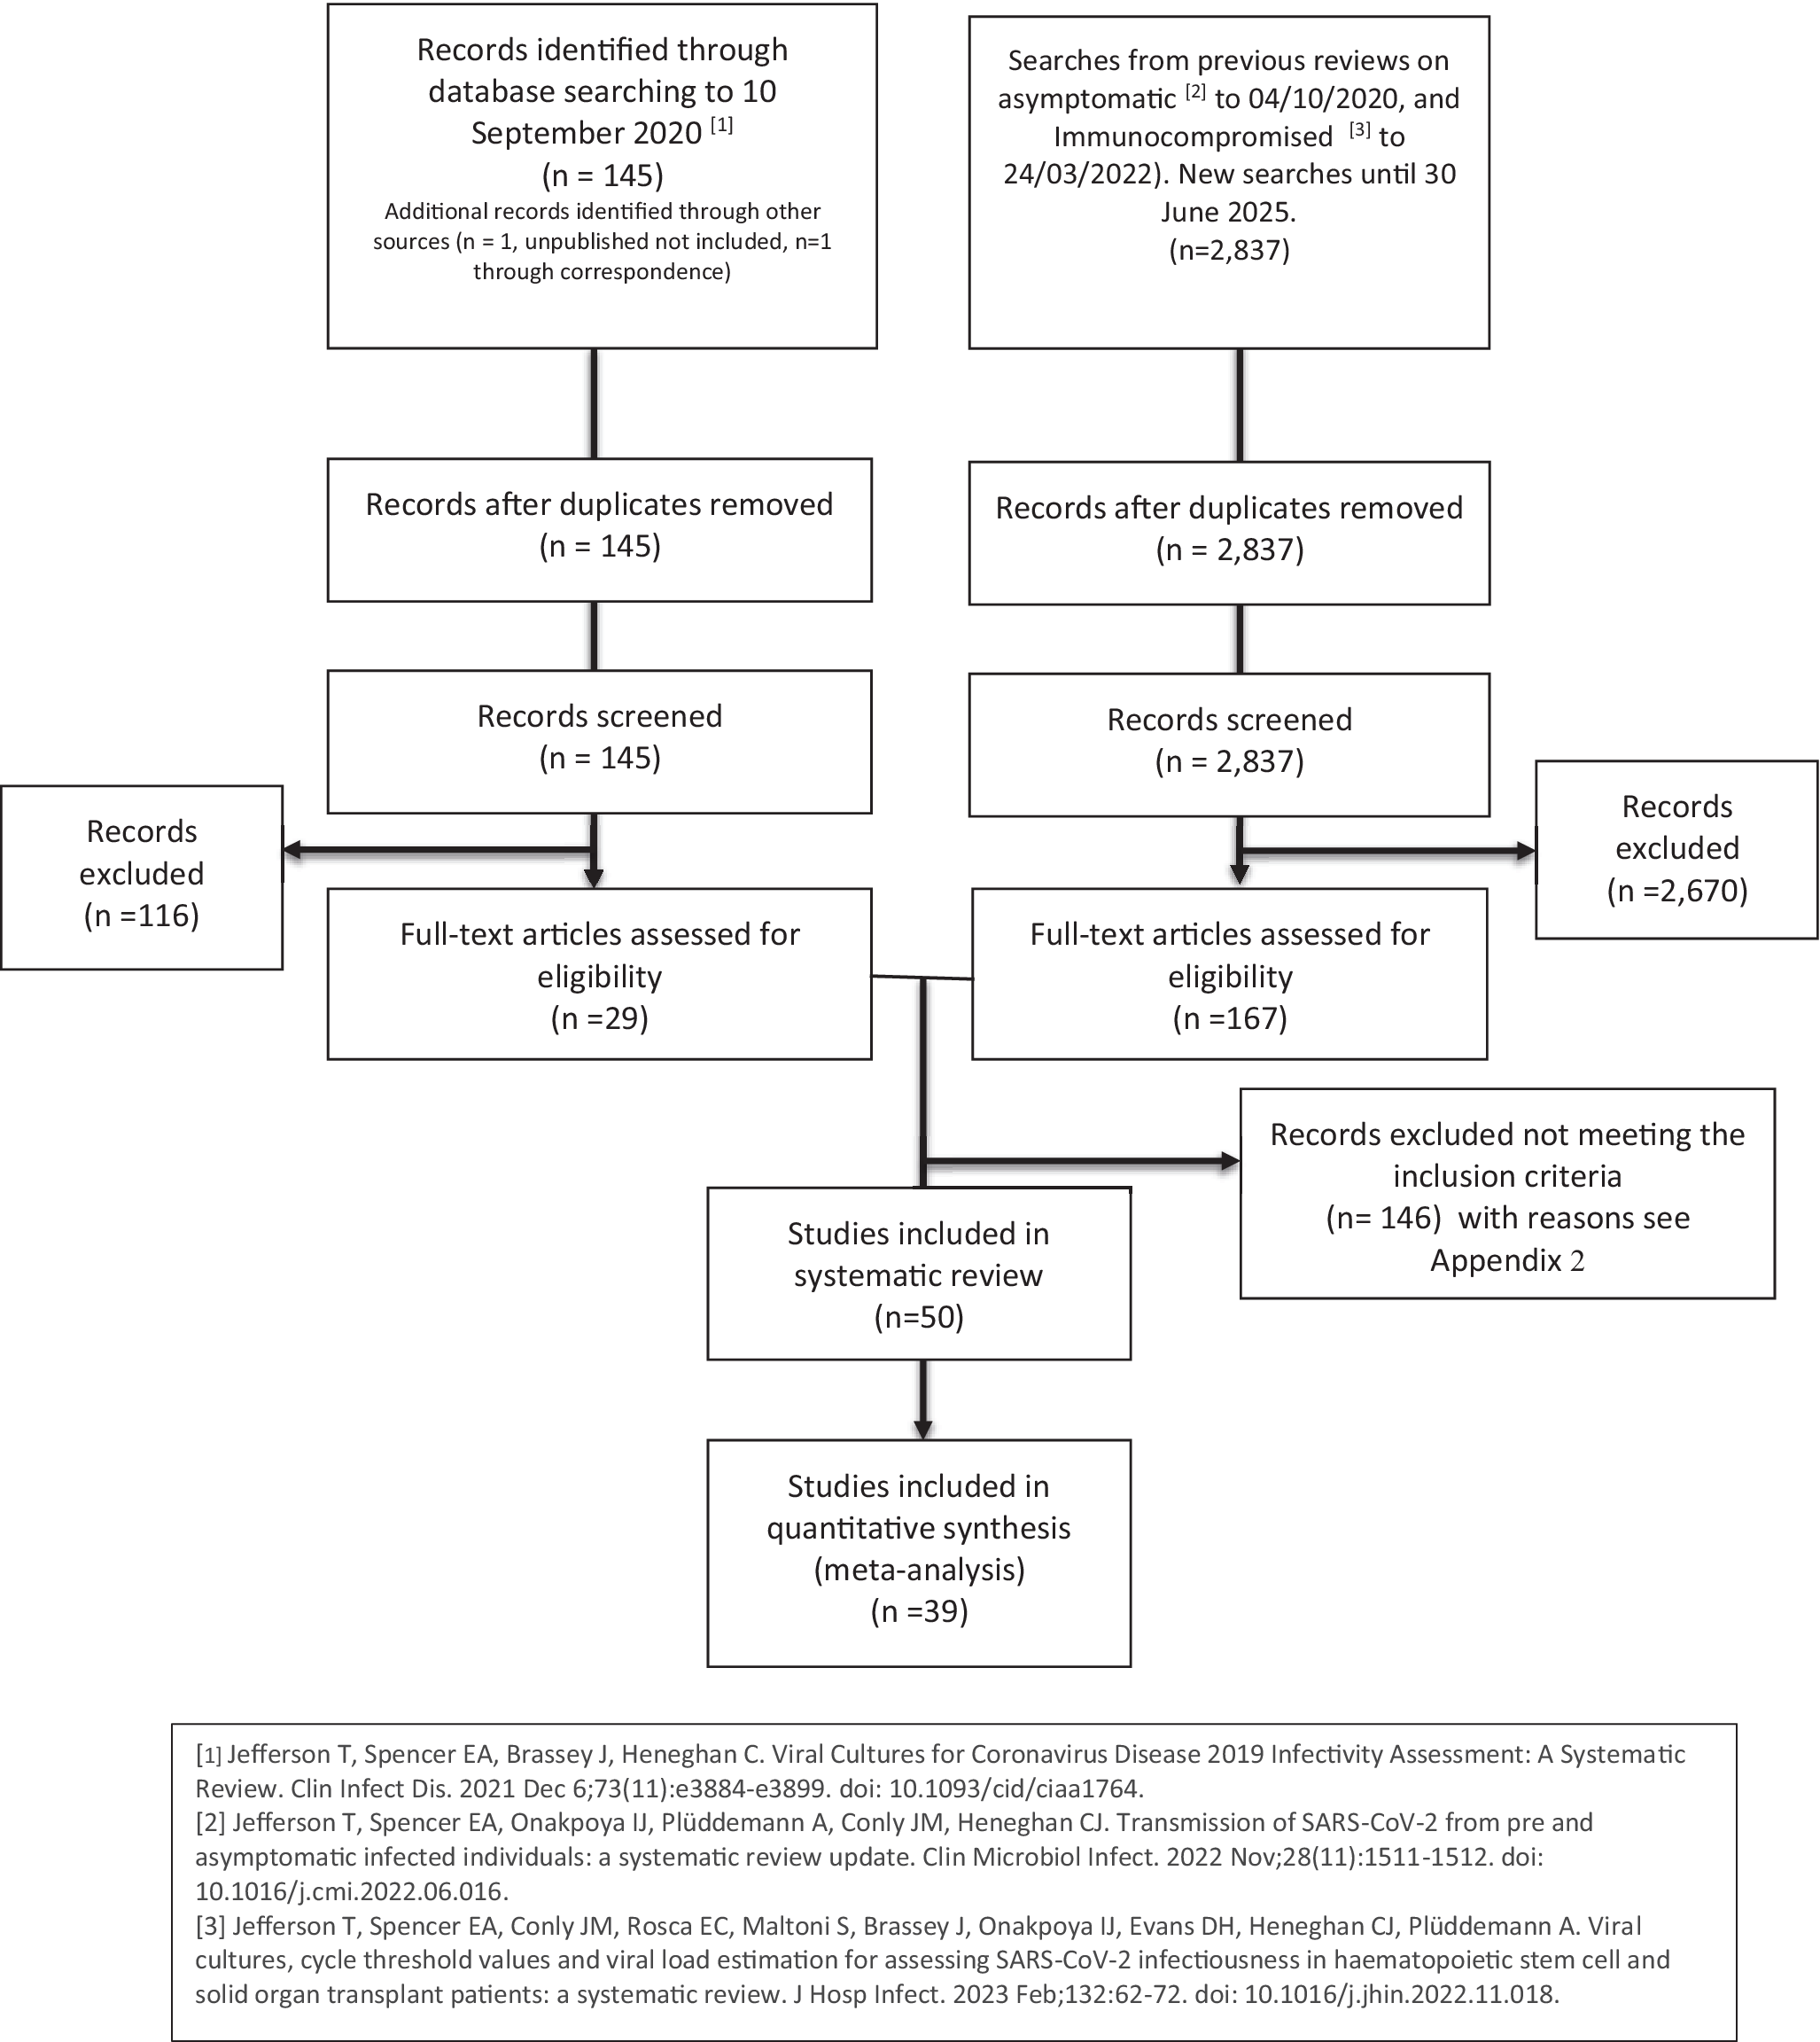
Flow chart.

Figure 1. Long description
At the top, two boxes represent sources: left, ‘Records identified through database searching to 10 September 2020’ with n equals 145; right, ‘Searches from previous reviews on asymptomatic to 04/10/2020, and immunocompromised to 24/03/2022. New searches until 30 June 2025’ with n equals 2,837. Both flow downward to ‘Records after duplicates removed’ (n equals 145 left, n equals 2,837 right). Each proceeds to ‘Records screened’ (n equals 145 left, n equals 2,837 right). Left branch: 116 records excluded, 29 full-text articles assessed for eligibility. Right branch: 2,670 records excluded, 167 full-text articles assessed for eligibility. From the right, 146 records excluded not meeting inclusion criteria. Both branches converge to ‘Studies included in systematic review’ (n equals 50), then to ‘Studies included in quantitative synthesis (meta-analysis)' (n equals 39). Footnotes reference three studies for search details.
We used the same approach to test independent associations in a multivariable model and applied a forward selection method to isolate factors independently associated with the Ct value. We report the univariate associations with changes in Ct values and 95% CIs and multivariate independent associations with Ct values with 95% CIs and adjusted P-values. All analyses were performed in-house using R and the meta and lme4 packages [Reference Balduzzi, Rücker and Schwarzer6, Reference Bates7]. The descriptive trending analysis for Ct values in immunocompetent patients was done using Python 3.13.5 (containing Pandas 2.3.0).
We assessed associations between culture positivity as the main outcome and key clinical and demographic factors (predictors) using a two-stage meta-analysis approach. For each factor, we pooled study-level estimates of the positivity rate stratified by subgroups. We used inverse-variance weighting and logit transformed proportions. Percentage culture positivity with 95% CIs at the subgroup level were estimated and differences in positivity rates between subgroups tested.
Quality assessment
We assessed the quality of the included studies according to modified QUADAS criteria that we have described previously [Reference Jefferson3, Reference Jefferson8] (Supplementary Appendix 1). We followed PRISMA reporting guidelines [Reference Tricco9]. This protocol arises out of our previously published protocol (https://osf.io/5dy6e) [10].
Results
We included searches from previous reviews from the date of our last review search, 20 September 2020 until 30 June 2025. We screened a further 2,837 articles from the 145 already screened in September 2020; we reviewed 196 full-text articles for inclusion. Three reviewers (ES, CR, and TJ) independently assessed all the screened articles for inclusion (Figure 1). After a full-text review, we excluded 146 (Supplementary Appendix 2) and included 50 studies in the review and 39 in the quantitative synthesis (Supplementary Appendix 3).
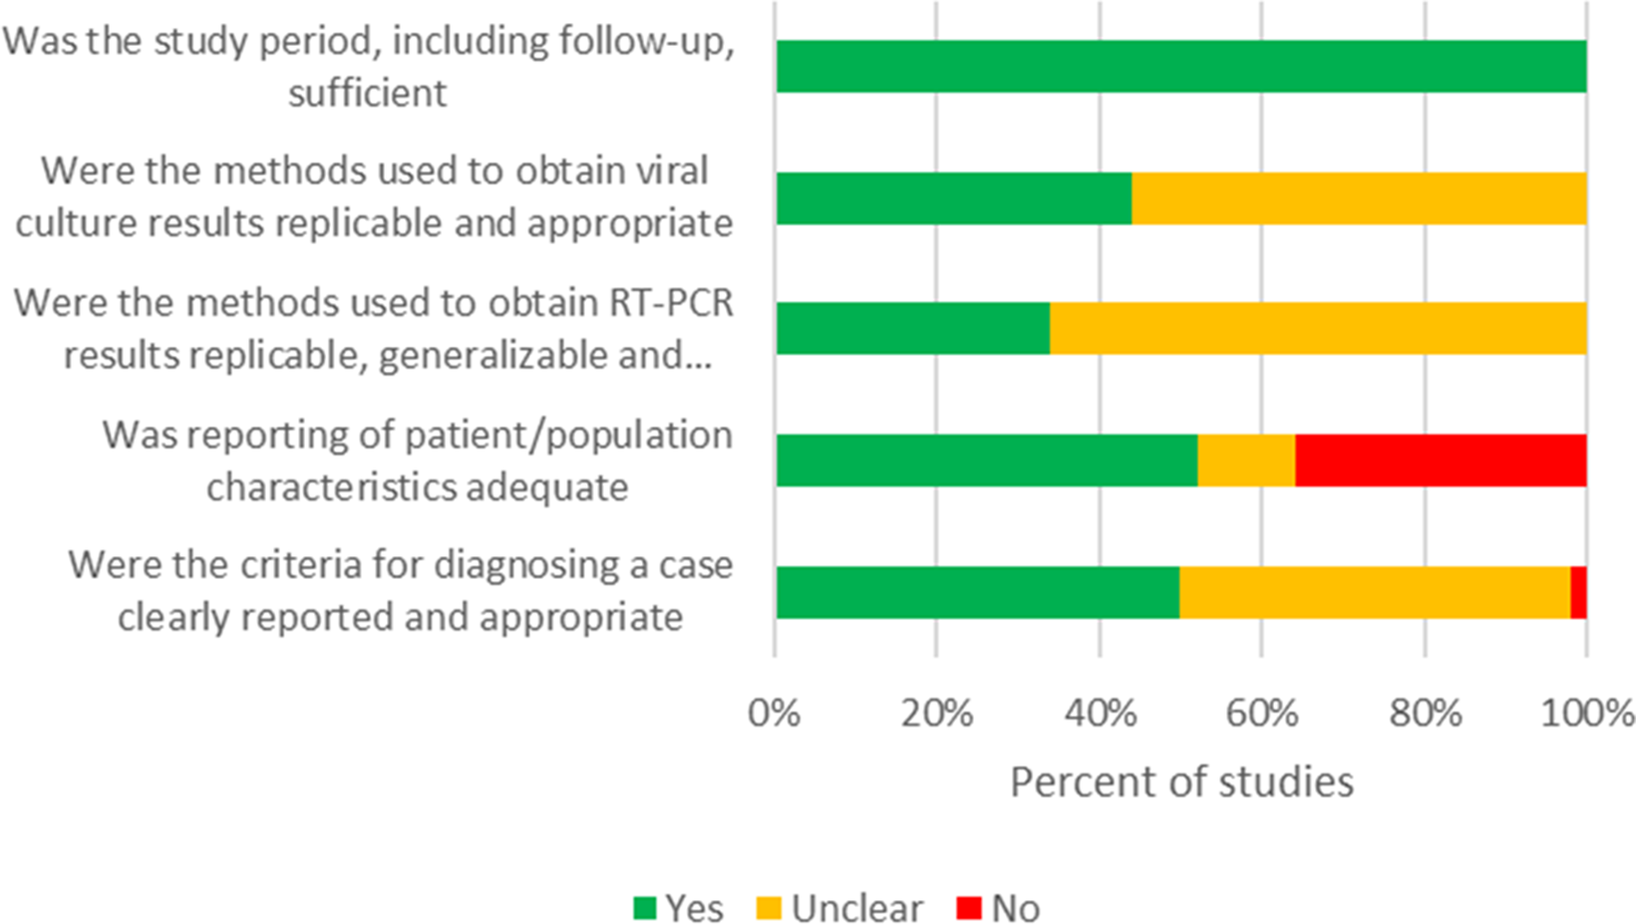
Risk of bias assessment.

Figure 2. Long description
From top to bottom, each horizontal bar represents a criterion. The top bar, ‘Was the study period, including follow-up, sufficient,’ is entirely green, indicating all studies answered Yes. The second bar, ‘Were the methods used to obtain viral culture results replicable and appropriate,’ is about one-third green (Yes) and two-thirds yellow (Unclear). The third bar, ‘Were the methods used to obtain R T dash P C R results replicable, generalizable and…,’ is about one-fifth green (Yes) and four-fifths yellow (Unclear). The fourth bar, ‘Was reporting of patient forward slash population characteristics adequate,’ is about half green (Yes), one-sixth yellow (Unclear), and one-third red (No). The bottom bar, ‘Were the criteria for diagnosing a case clearly reported and appropriate,’ is about one-third green (Yes), two-thirds yellow (Unclear), and a small red segment (No) at the end. The x axis is labeled ‘Percent of studies’ from 0 percent to 100 percent. The color legend at the bottom indicates green for Yes, yellow for Unclear, and red for No.
We excluded 11 studies from the analysis because they did not report individual RT-PCR Ct values. Specifically, three studies provided viral culture data without corresponding Ct values [Reference Monrad11–Reference Garcia-Knight13] and eight reported viral load as log10 copies instead [Reference Choi14–Reference Jung21]. Seven patients from the quantitative synthesis group were excluded because their culture status and Ct value did not align (i.e. not taken simultaneously).
Table 2 shows the characteristics of each study. We extracted data from 619 individuals, with the number of individuals included in each study ranging from 1 to 82. Sixteen studies were conducted in the USA; five in Italy; four in Canada; three each in Austria, Brazil, Korea, and Germany; two studies each in Denmark, Japan, and the UK; and one each in China, France, Israel, Portugal, Saudi Arabia, Spain, and Sweden (Table 2). We included data from 3,745 samples across 50 studies. Supplementary WebTable 1 reports the symptoms, the veracity of symptoms and signs checking, and the associated medical history of the study participants. Supplementary WebTable 2 reports the PCR sample collection methods, management, platform used, culture methods, cell lines, and controls.
We could not identify a protocol for any study. The 50 studies included were all case series and the overall risk of bias was moderate (Table 3, Figure 2).
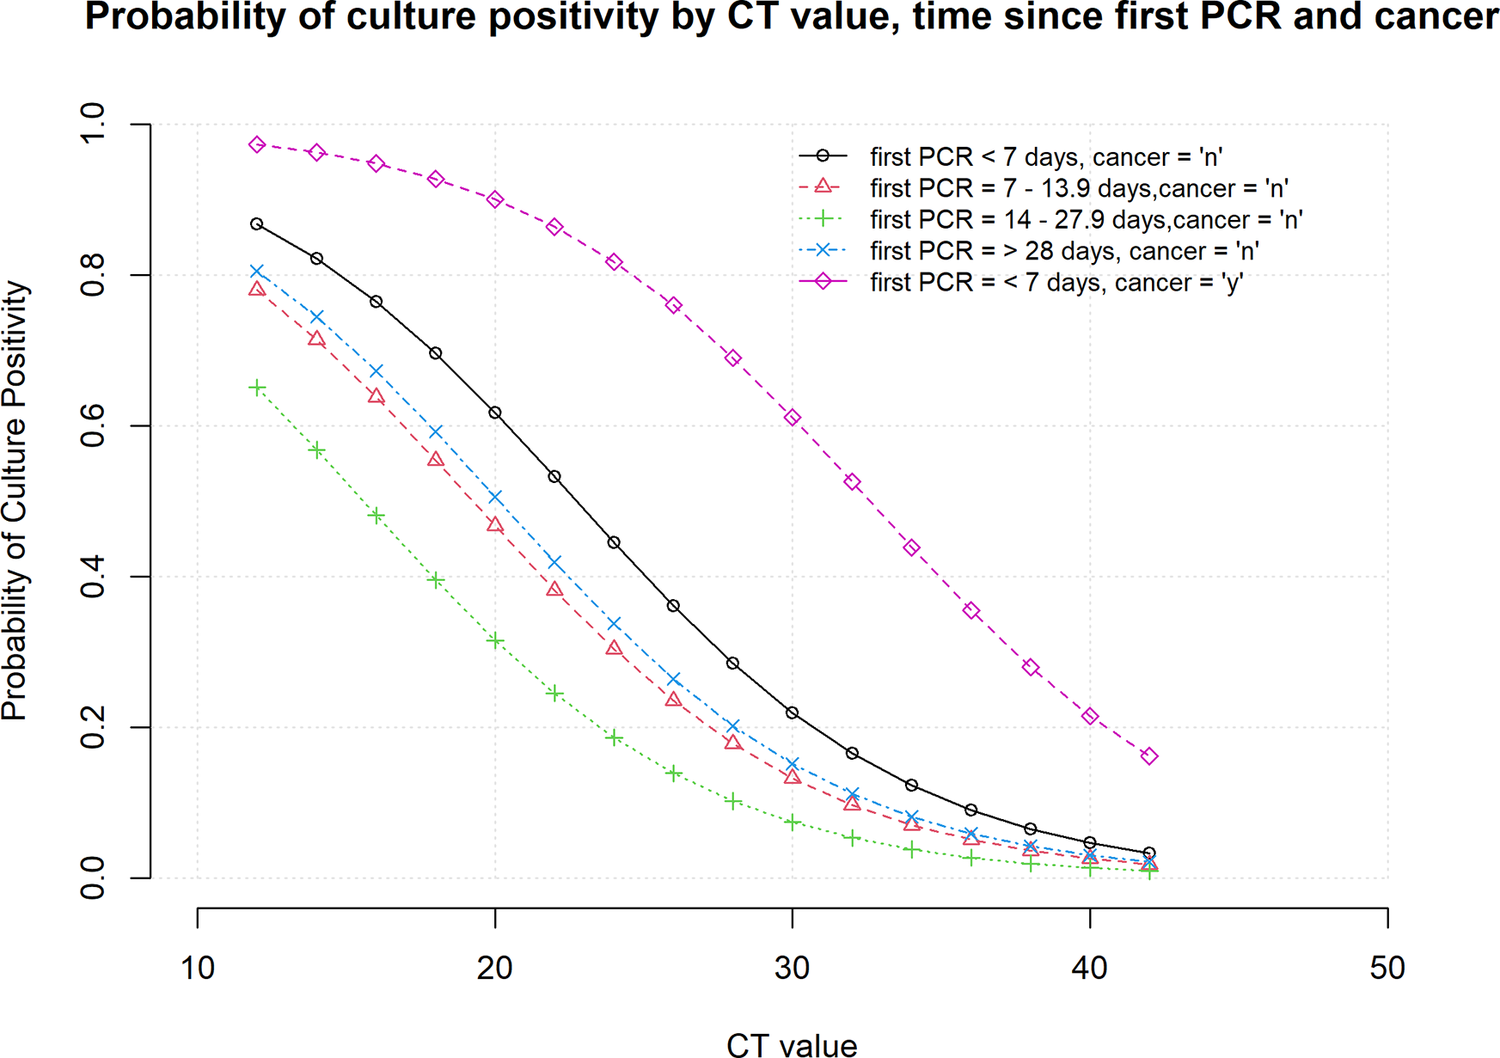
Probability of culture positivity by Ct value, time since first RT-PCR and cancer.

Figure 3. Long description
The x-axis shows C T value from 10 to 45. The y-axis shows probability of culture positivity from 0 to 1.0. Five dashed lines are plotted: black circles for first P C R less than 7 days, cancer equals n; red triangles for first P C R 7 to 13.9 days, cancer equals n; green plus for first P C R 14 to 27.9 days, cancer equals n; blue x for first P C R greater than or equal to 28 days, cancer equals n; magenta diamonds for first P C R less than or equal to 7 days, cancer equals y. All lines show a decreasing trend as C T value increases. The magenta line (cancer equals y) remains highest across all C T values, while the green line (first P C R 14 to 27.9 days, cancer equals n) is lowest. The legend is at the top right.
Relationship between symptom onset, disease course, infectious status, immunologic status, vaccination, and change in Ct values of SARS-CoV-2
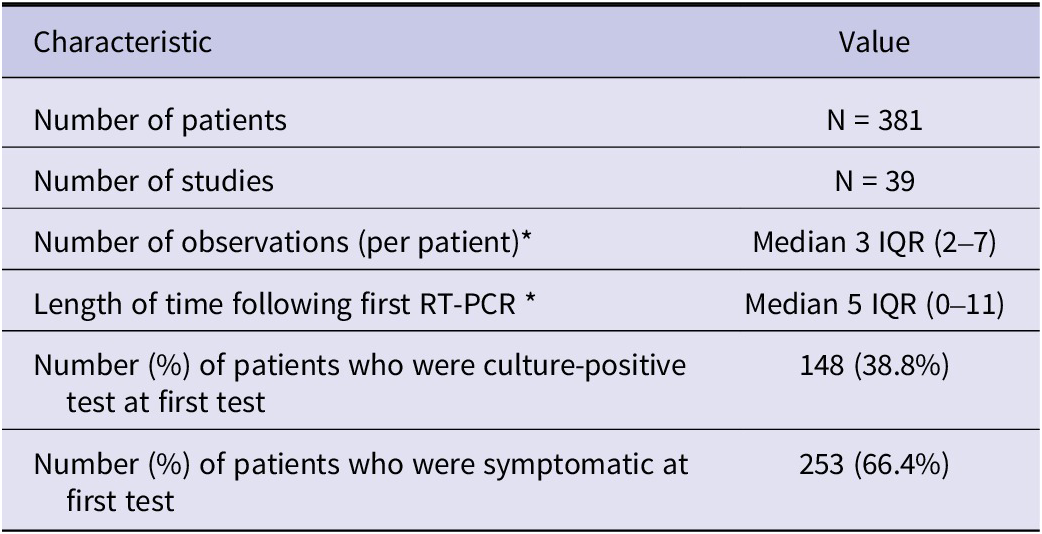
Table 4 reports the first Ct test result. We included 39 studies and 381 patients with a median of 3 (IQR 2–7) observations (per individual) and a median of 5 days (IQR 0–11) from the first RT-PCR test following the first result. The number of individuals who were culture positive at the first test was 148/381 (38.8%), and the number of symptomatic patients was 253/381 (66.4%). A descriptive analysis of serial Cts from non-immunocompromised COVID-19 patients only is shown in Supplementary WebTable 3 (n = 11 studies; n = 186 patients; n = 1,393 Ct values) and revealed a median and interquartile range (IQR) Ct value for positive (336) vs. negative (1057) viral cultures of 19.5 and 6.1 vs. 32.8 and 11.0, respectively. The mean Ct values for samples with positive (20.5) and negative (32.7) cultures were consistent with the median values. An analysis of patients assessing culture positivity as the outcome and sample Ct values <30 and > 2 or more Ct values and with 2 consecutive Cts ≥ 30 or a rising Ct value on serial testing with one value ≥30, demonstrated a sensitivity of 87.5%, a specificity of 96.3%, a positive predictive value of 88.2% and a negative predictive value of 96.0% with predictive values calculated using the observed prevalence of viral culture positivity within the serial Ct cohort of 24.1% in 186 patients. There were a number of outliers where cultures were reported as positive for viral growth despite a Ct ≥ 30 and all either used repetitive subculturing to obtain growth or were a single reported positive growth amidst multiple numbers of repeated negative cultures for the same patient. An analysis of outliers for positive viral cultures with a Ct ≥ 30 using the 1.5xIQR rule found that 14 outliers with a Ct above the upper bound of 32.1 confirmed the latter finding as well. Cultures that were negative for viral growth despite a Ct value of <25.6 (median + IQR for positive cultures) may be due to poor collection techniques, improper handling, freeze–thaw cycles, faulty inoculation, cell line choice, and contamination, all of which are well recognized in cell culture techniques [Reference Sykes Je Fau - Rankin and Rankin22]. Review of the original reports indicated that these outlier observations originated from four studies and often occurred later in infection or required multiple serial culture passages until viral growth was observed or were a single culture-positive sample sandwiched between multiple prior negative cultures and followed by subsequent negative cultures. The choice of a Ct value of ≥30 as a threshold choice was based on several studies using multiple primer sets and cell culture techniques, including quantitative cultures in one study, revealing it to be a consistent cut-off for demonstrating non culturable virus on cell culture [Reference Lin5, Reference Bruce23, Reference Relich24], and some of the authors corroborated their findings using ROC curves.
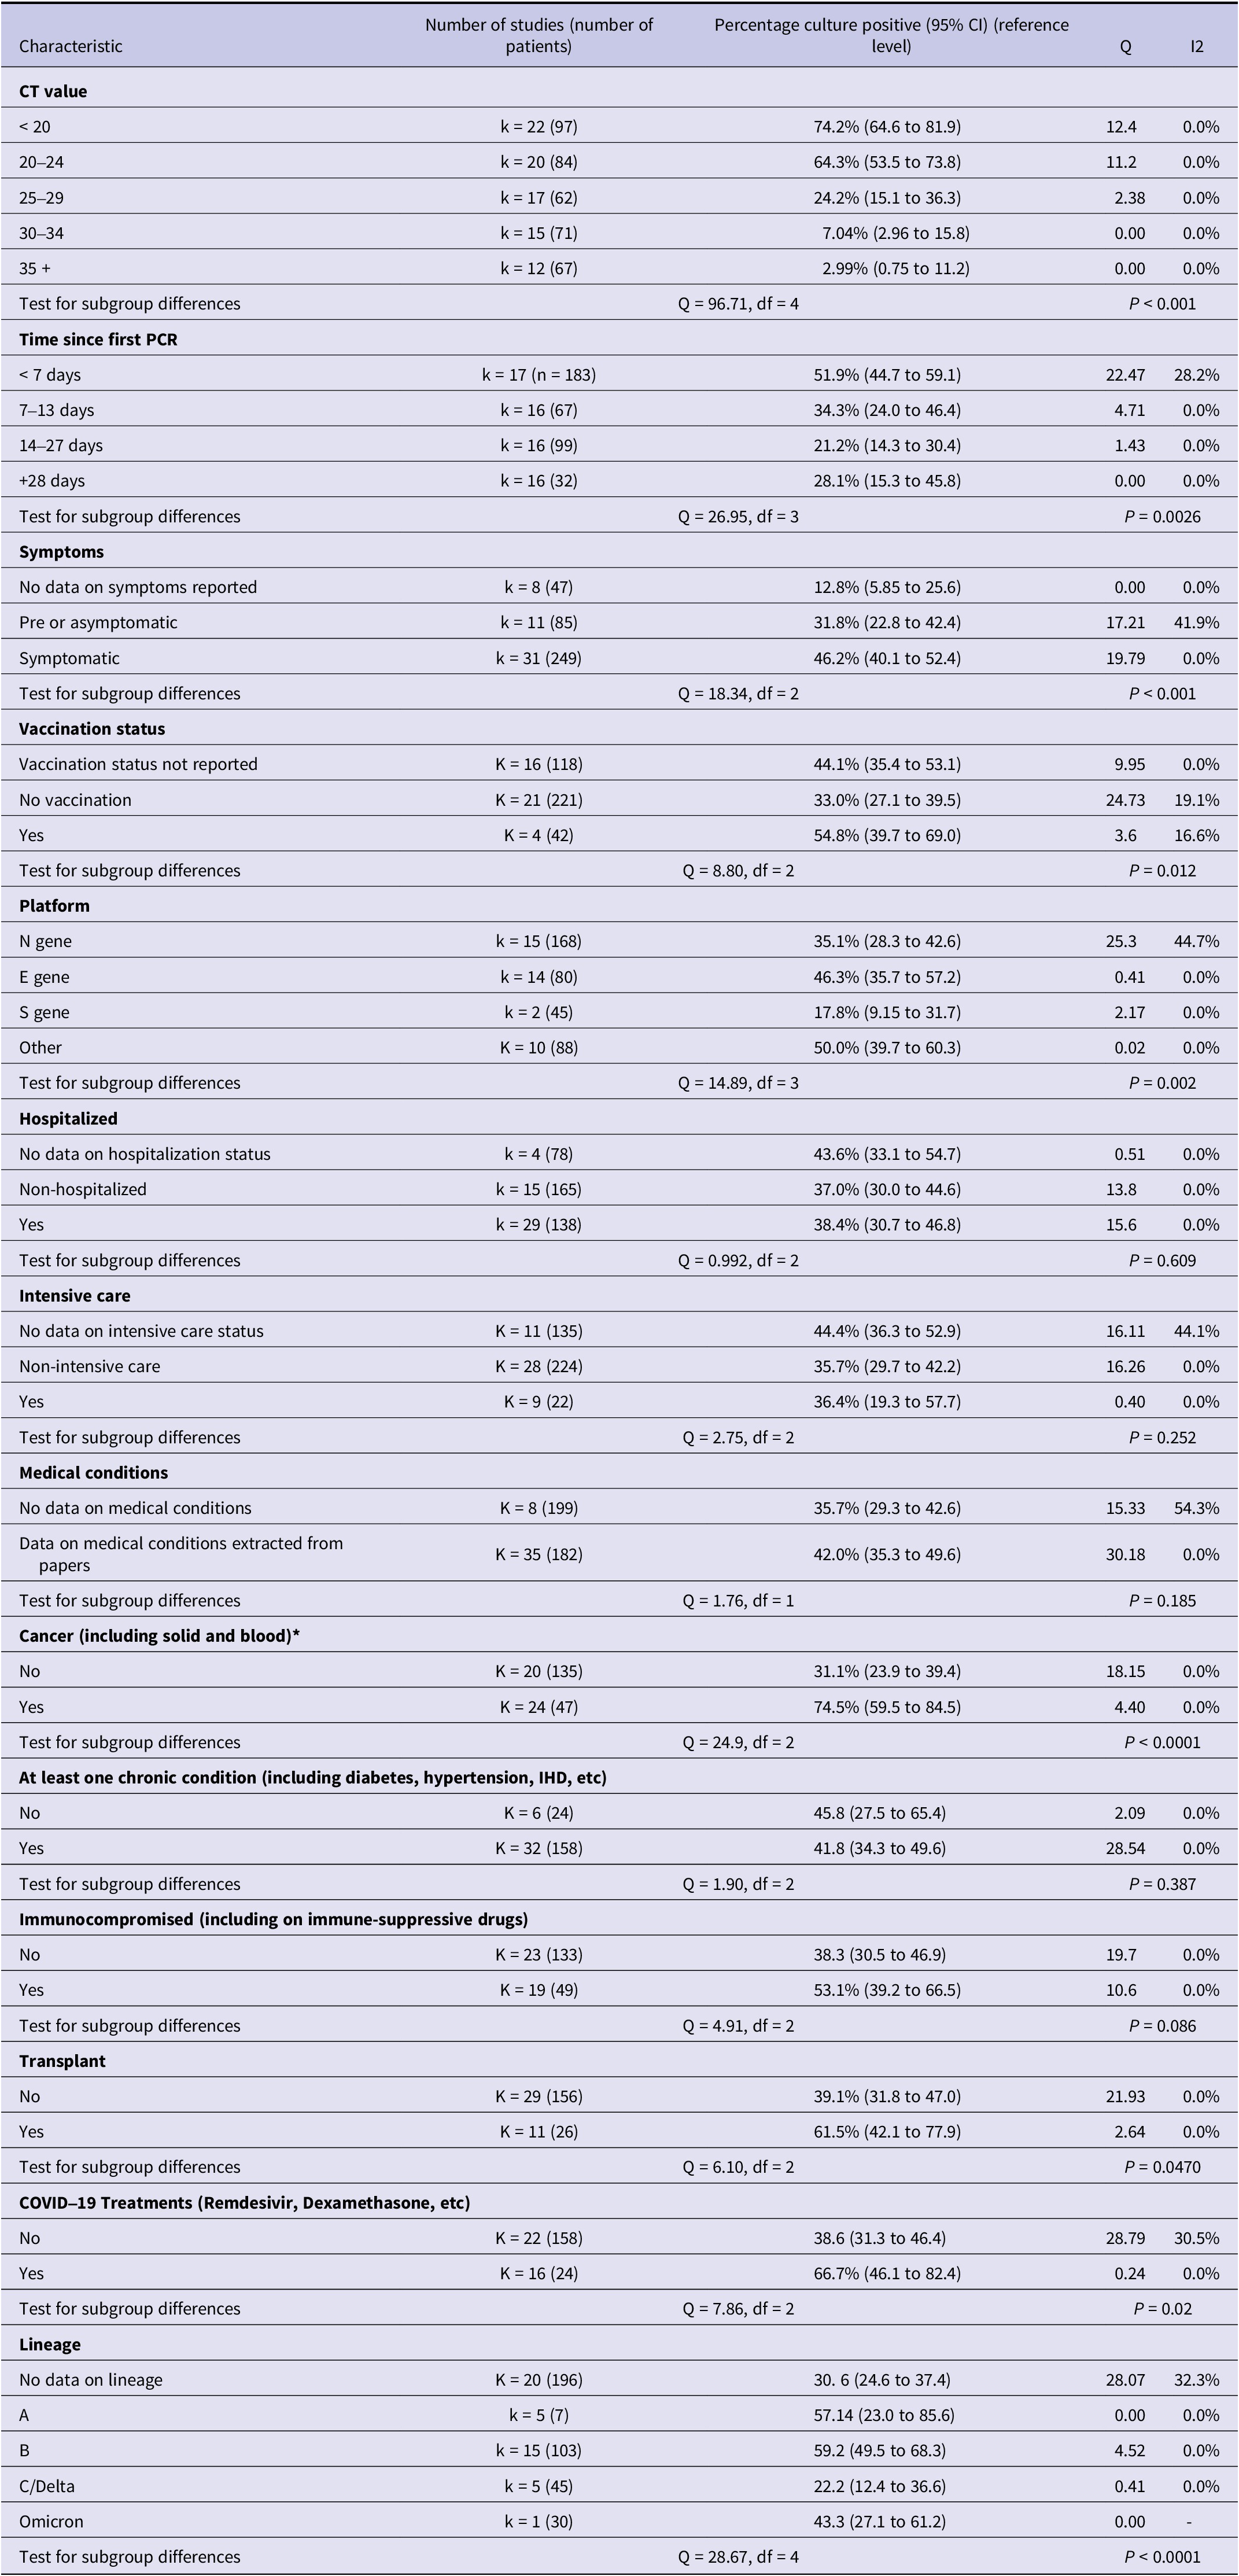
Table 1 reports the overall culture-positivity results using a two-stage meta-analysis approach that demonstrated the percentage of culture-positivity decreases with increased Ct value (test for subgroup difference Q = 96.71, P < 0.001), and with time since the first PCR test (Q = 26.95, P = 0.0026). The presence of symptoms (Q = 20.19, P < 0.01) and vaccination status (Q = 8.80, P = 0.012) increased the proportion of culture-positive results, as did the type of gene platform used (Q = 14.89, P = 0.002). We found a significant interaction for cancer patients (Q = 24.9, P < 0.0001) and patients on COVID-19 treatments such as remdesivir, dexamethasone, and others (Q = 7.86, P = 0.020). There were no subgroup interactions for hospitalization, intensive care admission, or the presence of at least one chronic condition.
Independent associations with the cycle threshold value
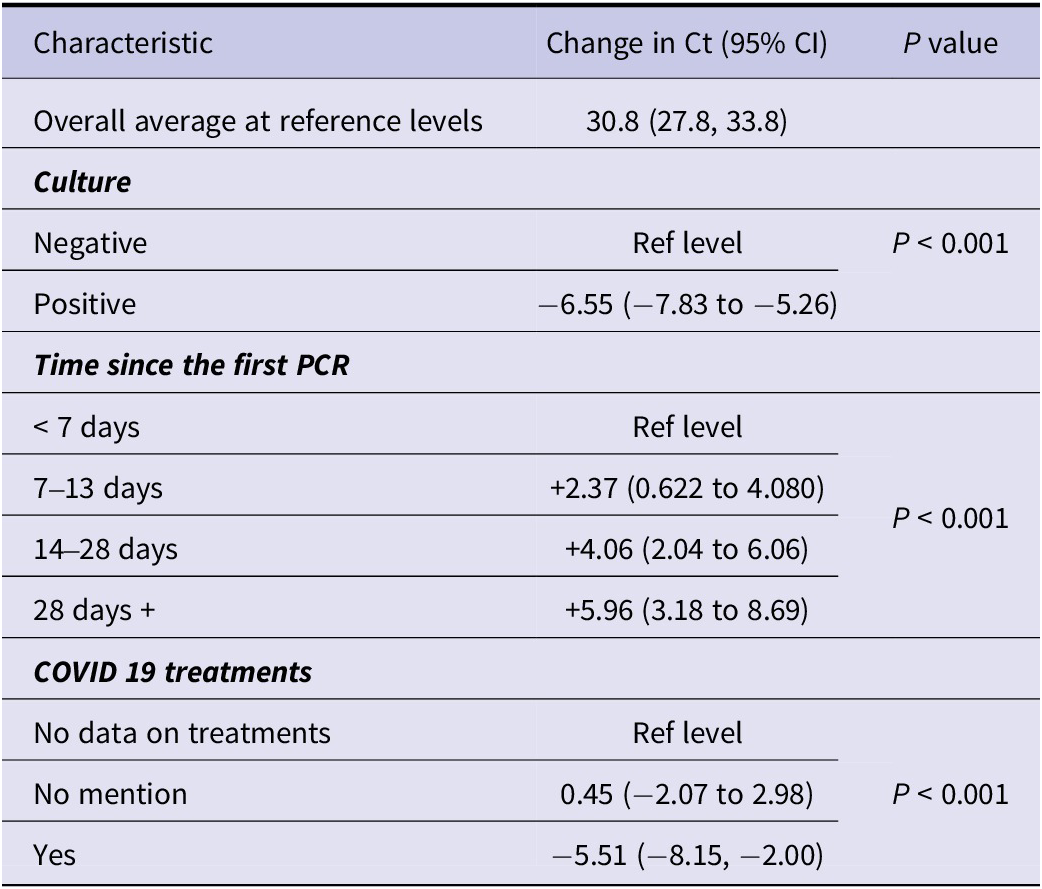
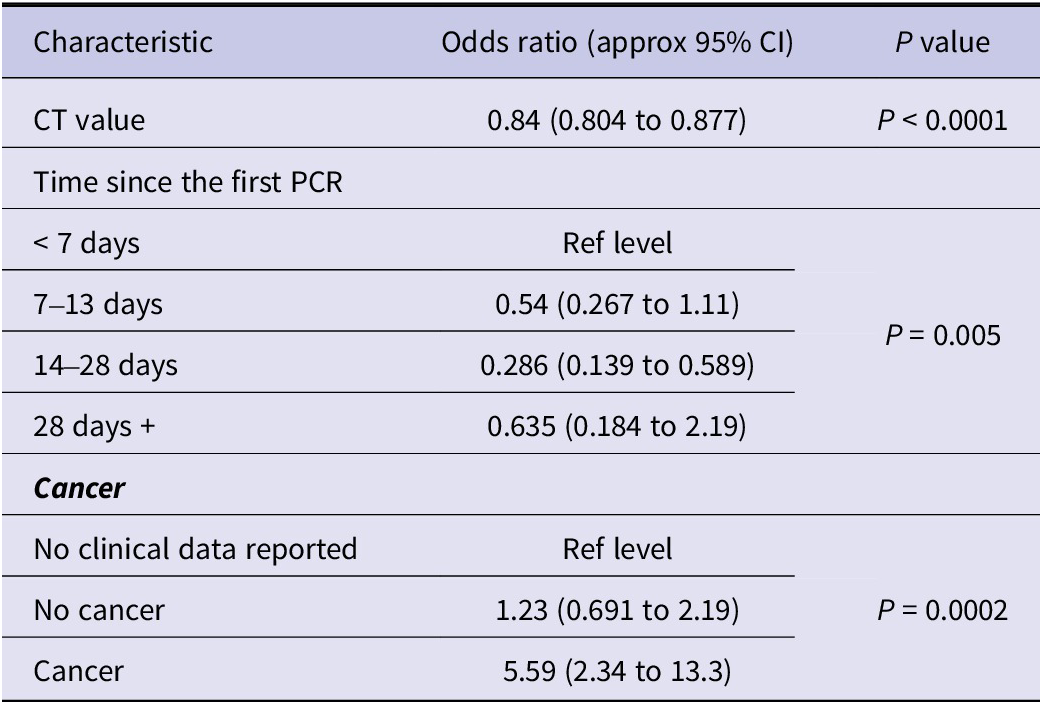
Supplementary WebTable 4 reports univariate associations with a Ct value based on first test values per individual. Table 5 reports the independent associations with Ct values. Culture positivity was associated with a reduction in the Ct value (adjusted change in Ct −6.58, 95% CI, −5.30, −7.86, P < 0.001); time since the first PCR test was independently associated with a Ct increase (P < 0.001); the use of COVID-19 treatments led to Ct reduction (adjusted change in Ct −5.61, 95%CI, −8.78, −2.43, P < 0.001). Table 6 reports multivariate analysis on independent associations with culture positivity. The probability of culture positivity by Ct value, time since first RT-PCR and cancer are presented in Figure 3. The probability of positive cultures was more likely with low Cts.
Culture positivity (using a two-stage meta-analysis approach)

Table 1. Long description
Starting from the top, the table is divided into sections by bolded subgroup labels. For CT value, culture positivity decreases as CT increases: less than 20, 74.2 percent; 20 to 24, 64.3 percent; 25 to 29, 24.2 percent; 30 to 34, 7.04 percent; 35 or more, 2.99 percent. For time since first PCR, less than 7 days, 51.9 percent; 7 to 13 days, 34.3 percent; 14 to 27 days, 21.2 percent; 28 or more days, 28.1 percent. For symptoms, no data, 12.8 percent; pre or asymptomatic, 31.8 percent; symptomatic, 46.2 percent. For vaccination status, not reported, 44.1 percent; no vaccination, 33.0 percent; yes, 54.8 percent. For platform, N gene, 35.1 percent; E gene, 46.3 percent; S gene, 17.8 percent; other, 50.0 percent. For hospitalization, no data, 43.6 percent; non-hospitalized, 37.0 percent; yes, 38.4 percent. For intensive care, no data, 44.4 percent; non-intensive care, 35.7 percent; yes, 36.4 percent. For medical conditions, no data, 35.7 percent; data extracted, 42.0 percent. For cancer, no, 31.1 percent; yes, 74.5 percent. For at least one chronic condition, no, 45.8 percent; yes, 41.8 percent. For immunocompromised, no, 38.3 percent; yes, 53.1 percent. For transplant, no, 39.1 percent; yes, 61.5 percent. For COVID-19 treatments, no, 38.6 percent; yes, 66.7 percent. For lineage, no data, 30.6 percent; A, 57.14 percent; B, 59.2 percent; C or Delta, 22.2 percent; Omicron, 43.3 percent. Each section includes the number of studies and patients, 95 percent confidence intervals, Q, and I squared values. Tests for subgroup differences are reported at the end of each section with Q, degrees of freedom, and P values.
Characteristics of included studies

Table 2. Long description
The table contains six columns. The headers from left to right are Study, Country, Setting, Population or environment, Study individuals’ numbers, and Funding. Each row details a study, beginning with the study name, followed by the country, then the setting such as hospital, community, or specific facility. The next column describes the population or environment, specifying patient types or conditions. The fifth column lists the number of individuals included in each study. The final column provides funding information, including grant numbers, supporting institutions, or notes of no funding. For example, the first row lists Alshukairi 2021 from Saudi Arabia, with hospitalized cases, 7 immunocompromised and 6 immunocompetent patients, 13 individuals, and no funding. Other studies span countries such as USA, Israel, Germany, Korea, Brazil, Austria, Italy, Japan, Sweden, Portugal, Spain, UK, China, France, and Canada. Settings include hospitals, long-term care facilities, community, quarantine facilities, nursing homes, and cruise ships. Populations include immunocompromised patients, health care workers, patients with specific diseases, and general or specific community groups. Funding sources range from national research foundations, government agencies, philanthropic organizations, and some studies report no external funding or not reported.
Quality of included studies

Table 3. Long description
The table contains seven columns. The first column lists study names, including Alshukairi 2021, Avanzato 2021, Aydillo 2020, Baang 2021, Basheer 2021, Choi et al., Decker et al., Garcia-Knight et al., Gniazdowski 2021, Guetl et al., Han 2021, Jung et al., Kang et al., Ke 2021, Kim 2022a, Kim 2022b, Kujavski 2020, Laferl 2020, Lang 2020, Leitão 2021, Leung 2022, Lin et al., Lu 2020, Luna-Muschi 2022, Mancon 2022, McCormick 2023, Mendes-Correa 2021, Mileto 2021, Monrad et al., Murata 2021, Nissen 2021, Niyonkuru 2021, Nomura et al., Pedro 2021, Pérez-Lago 2021, Pickering 2021, Rajakumar 2021, Sepulcri et al., Siedner et al., Singh et al., Spinicci 2022, Sung 2022, Tarhini 2021, Thornton 2022, Tobolowski 2022, Truong 2021, Weigang 2021, Williamson 2021, Zahn 2021, Zupin 2022. The next five columns are: ‘Were the criteria for diagnosing a case clearly reported and appropriate’, ‘Was the reporting of patient/population characteristics adequate’, ‘Were the methods used to obtain R T dash P C R results replicable, generalizable and appropriate’, ‘Were the methods used to obtain viral culture results replicable and appropriate’, and ‘Was the study period, including follow up, sufficient’. Each cell in these columns contains either Yes, No, or Unclear. The final column, ‘Notes’, provides detailed comments for each study, such as missing data on R T dash P C R controls, lack of information on viral culture methods, Ct cutoff values, and limitations in symptom reporting. Some studies, such as Choi et al., Lin et al., Rajakumar 2021, Kim 2022b, and Weigang 2021, meet all criteria with Yes in all columns. Many studies have Unclear or No in one or more columns, with frequent notes about missing Ct cutoff, lack of controls, or insufficient reporting of clinical symptoms or culture methods.
Characteristics of the analysis set based on the first RT-PCR test result (the first test result is used except for the Number of observations and the length of time following the first RT-PCR*)

Table 4. Long description
From the top row, the table has two columns labeled Characteristic and Value. The first row lists Number of patients with N equals 381. The second row lists Number of studies with N equals 39. The third row lists Number of observations per patient with Median 3 and I Q R 2 to 7. The fourth row lists Length of time following first R T dash P C R with Median 5 and I Q R 0 to 11. The fifth row lists Number and percent of patients who were culture-positive at first test with 148 and 38.8 percent. The sixth row lists Number and percent of patients who were symptomatic at first test with 253 and 66.4 percent.
Multivariable model. Independent associations with cycle threshold values

Table 5. Long description
The table presents three main groups: Culture, Time since the first PCR, and COVID 19 treatments. The first row gives the overall average at reference levels with a cycle threshold value of 30.8 and a 95 percent confidence interval of 27.8 to 33.8. Under Culture, the reference level is Negative. Positive culture is associated with a change in cycle threshold of minus 6.55 with a 95 percent confidence interval of minus 7.83 to minus 5.26 and a P value less than 0.001. For Time since the first PCR, less than 7 days is the reference. At 7 to 13 days, the change is plus 2.37 with a 95 percent confidence interval of 0.622 to 4.080. At 14 to 28 days, the change is plus 4.06 with a 95 percent confidence interval of 2.04 to 6.06. At 28 days or more, the change is plus 5.96 with a 95 percent confidence interval of 3.18 to 8.69. The P value for this group is less than 0.001. For COVID 19 treatments, ‘No data on treatments’ is the reference. ‘No mention’ shows a change of 0.45 with a 95 percent confidence interval of minus 2.07 to 2.98. ‘Yes’ shows a change of minus 5.51 with a 95 percent confidence interval of minus 8.15 to minus 2.00. The P value for this group is less than 0.001.
Multivariable model. Independent associations with culture positivity

Table 6. Long description
The table has three columns labeled Characteristic, Odds ratio with approximate 95 percent confidence interval, and P value. The first row lists CT value with odds ratio 0.84, confidence interval 0.804 to 0.877, and P value less than 0.0001. The next section is Time since the first PCR, subdivided into less than 7 days (reference level), 7 to 13 days with odds ratio 0.54 and confidence interval 0.267 to 1.11, 14 to 28 days with odds ratio 0.286 and confidence interval 0.139 to 0.589, and 28 days or more with odds ratio 0.635 and confidence interval 0.184 to 2.19. The P value for this section is 0.005. The final section is Cancer, subdivided into No clinical data reported (reference level), No cancer with odds ratio 1.23 and confidence interval 0.691 to 2.19, and Cancer with odds ratio 5.59 and confidence interval 2.34 to 13.3. The P value for this section is 0.0002.
Discussion
We reviewed the largest cohort of studies reporting viral culture and serial RT-PCR testing: 50 studies, with 39 incorporated in quantitative synthesis. We found a significant decrease in culture-positivity percentage when the Ct value increases, correlated with time since the first RT-PCR test (P < 0.01).
The percentage of culture-positive samples was higher in the first week after the first RT-PCR, decreasing thereafter (Q = 26.95, P = 0.0026). Research on Ct dynamics of other acute respiratory viruses reported Ct values of 25–30 on the day of symptom onset, lower over the ensuing 1–3 days, and progressively higher up to ≥30 after 1 week for most viruses, mirroring patterns seen of SARS-CoV-2 infection [Reference Ehrenzeller25]. Rhinovirus Ct values were higher and more stable over time [Reference Ehrenzeller25]. These findings may be attributed to challenges of identifying the first day of symptoms in mild infections (e.g., rhinovirus), in contrast to more severe diseases such as influenza with abrupt onset. Symptoms of respiratory virus infections, including SARS-CoV-2, are well-described and can naturally fluctuate over time [Reference Smith26, Reference Byambasuren27].
The high rate of culture positivity at first testing (38.8%) could be explained by early testing post symptom onset and/or post exposure. Human challenge studies on SARS-CoV-2 in healthy subjects reported a steep rise in culturable virus in the nose and throat after inoculation, peaking at approximately 5 days [Reference Killingley28]. After a brief plateau, the culturable virus declined rapidly, although very low levels persisted in some subjects to day 12 in the nose. Quantifiable RNA by qPCR lingered longer and was still present on day 14 after inoculation. At these later time points low-level qPCR positivity remained in 33% of participants at day 28 after inoculation [Reference Killingley28]. Between 2020 and 2023, different SARS-CoV-2 strains circulated, some of which, like Omicron, were more difficult to culture [Reference Zhao29]. Some bias might exist in included studies, as methods for viral cultures were unclear in 22/39 (56.4%) studies, and methods of RT-PCR testing were unclear in 29/39 (74.4%) studies.
The presence of COVID-19 symptoms was associated with an increased proportion of culture-positivity (Q = 18.34, P < 0.01), but verification of symptoms was not reported in 22/39 (56.4%) studies. Symptom ascertainment bias was higher earlier in the pandemic [Reference Jefferson8], especially in the very elderly and those with cognitive impairment [Reference Byambasuren27, Reference O’Grady30].
Patients with different cancer types, including solid and blood malignancies, had a higher proportion of positive viral cultures (Q = 24.9, P < 0.0001), consistent with previous findings [Reference Jefferson31, Reference Raglow32]. We combined all types of cancers due to a limited number of reports and our definition of immunocompromised was deliberately broad to avoid bias towards any subgroup [Reference Barnes33, 34]. The immunocompromised subgroup had a longer infection duration, with no significant difference in the non-B-cell malignancy group (0.58 [95% CI 0.31–1.09]) [Reference Raglow32]. The most prolonged interval of positive viral cultures was on day 238 in a patient with non-Hodgkin lymphoma (mantle cell type, blastoid variant stage IV) [Reference Sepulcri35]. We found no subgroup interaction for hospitalization or admission in intensive care units. Various criteria worldwide restrict our confidence in the absence of an association with hospital admissions, especially early in the pandemic, when the admission threshold was lower.
Shah, 2021 found no significant difference in mean Ct values between hospitalized and non-hospitalized patients in line with studies for other pathogens [Reference Shah36–Reference Granados38].
We found no subgroup interaction for the presence of any chronic conditions such as diabetes, hypertension, or IHD, but COVID-19 treatments (e.g., remdesivir, dexamethasone) significantly reduced Ct (adjusted change in Ct −6.02, 95%CI, −9.65 to −2.48, P = 0.002). No firm conclusions could be drawn on vaccination as we only found data on 42/381 patients.
It was not possible to address the influence of age, sex, specific underlying pathologies (e.g., diabetes, hypertension), immunosuppression degree, and laboratory variables on infectiousness, as heterogeneity and limited available individual data precluded performing analyses.
Two-stage meta-analysis showed that association with culture-positivity was higher for the E gene (46.3%; 95% CI 35.7 to 57.2) than for N, S, or other genes used for RT-PCR (Q = 14.89, P = 0.002). Our findings suggest that when the Ct value increases by approximately 6.6 units, the culture positivity rate decreases significantly. This relationship was observed across studies using different PCR platforms; however, Ct values may vary between assays, and therefore, such thresholds should be interpreted within the context of the specific testing platform and laboratory methods used. This may be a valuable and reasonable proxy to rule out infectious SARS-CoV-2, as there is a consistent correlation between a rising Ct value and a decreased likelihood of isolating replication-competent virus. Such a value is helpful guiding clinicians in correlation with other clinical and ancillary data.
Our results agree with the findings of previous systematic reviews on infectious potential periods [Reference Byrne39–Reference Oordt-Speets45]. Not all the systematic reviews cross correlated Ct values with viral culture, instead focusing on viral load and did not consistently differentiate immunocompetent from immunocompromised patients. In addition, none of the previous systematic studies provided the detailed rigour of the analytics which we addressed or performed a two-stage meta-analysis. Our analysis only included studies with high-quality evidence, integrating clinical, epidemiologic, molecular, and laboratory data, narrowing uncertainty over the potential SARS-CoV-2 infectiousness and transmission dynamics [Reference Jefferson46]. Robust research requires thorough serial symptom screening supported by high confirmatory evidence, such as viral culture or longitudinal serial PCRs, to establish replicating and/or infectious virus presence [Reference Jefferson8, Reference Jefferson31, Reference Jefferson46, Reference Onakpoya47].
Collectively, our systematic review results of the use of serial PCR testing and obtaining repeated Ct values ≥30 in immunocompetent patients in conjunction with detailed clinical assessment can be a valuable tool for assisting clinicians in decision-making regarding the risk for forward transmission and de-isolation. Decreasing harms from excessive isolation that may delay discharge, hinder medical treatment [Reference Gohil48, Reference Mowrer49] such as delays in procedures or appropriate placement (e.g., waiting for a single room, declines for transfer to rehabilitation or skilled nursing facilities), restricted visitation, and compromised medical care (e.g., admission to medical ward instead of a psychiatric unit) [Reference Gohil48]. Avoiding unnecessary isolation could contribute to improved contact with patients by healthcare workers (HCWs), less bed blocking, improved psychosocial status, and reductions in deconditioning and mental health deterioration [Reference Abad, Fearday and Safdar50, Reference Idowu, Olalemi and Aiyesanmi51] and less environmental pollution [Reference Idowu, Olalemi and Aiyesanmi51] from a reduction in gloves, gowns, masks, and eye protection devices.
Strengths and limitations
Strengths of the present systematic review include adherence to an established protocol, extensive literature searches, double-checked data extraction, and quality assessment. To our knowledge, this is the largest study on the value of serial Cts and viral culture, with high rigour using internal controls and verification of cultures as SARS-CoV-2, with robust data analysis and interpretation involving a significant amount of clinical, ancillary, and epidemiological knowledge. Additional data for some individuals were included after communicating with the authors.
Limitations of our review include a relatively small number of studies using viral culture and serial RT-PCR with complete data on all individuals, substantial heterogeneity in study design and reporting, and the difficulty in combining data owing to the varied methods used for RT-PCR platforms and culture. Some data were extracted from figures in published articles, potentially resulting in less accurate estimations. Despite prioritizing only studies with high levels of evidence to demonstrate the microbiological and clinical aspects of viral respiratory pathogen transmission, the included research showed a moderate risk of bias, potentially impacting the strength of our findings. Other potential limitations include study populations, timings of investigations, use of various respiratory specimens, and investigation quality constraints between different studies [Reference Theel, Kirby and Pollock52]. The studies used multiple RT-PCR platforms, several types of culture cell lines, and varying culture conditions. Data on verification methods for RT-PCR and cell cultures (i.e., internal controls) was inconsistent. Several factors affecting SARS-CoV-2 isolation were sometimes underreported (e.g., culturing techniques, transport details from the bedside to the laboratory, and sample storage conditions).
Standardization of SARS-CoV-2 isolation using cell culture and RT-PCR methods is essential for evidence development. Laboratories should consistently use specific platforms and internal standards to calibrate the relation between Ct values and genome copies. A consistent format for case series and longitudinal research is essential to prevent data loss, and observation windows should be limited to 3 days during the acute infection phase. Each observation period should describe symptoms, interventions, and Ct values. With Cts <30, researchers should provide information on viral culture, if available. Patient descriptions should include medical history, interventions, and medication interactions. Investigators should indicate reasons for admission, discharge, and isolation changes. Studies should specify the duration of viral shedding by documenting the time between the first positive and negative viral cultures.
Implications
Hospital and intensive care unit (ICU) stay is not necessarily a proxy for infectiousness as by the time the individual has arrived in the ICU, they are often post-infectious unless they acquire an infection in the hospital or the ICU or are immunocompromised for any reason. Unless patients are immunocompromised, Ct values rise in line with virus clearance. The findings from this review with serial Ct values using multiple platforms and primer sets, demonstrating a rise over time at threshold cut-offs of ≥30 and the association with negative viral cultures, used in conjunction with clinico-epidemiologic parameters, may assist clinicians and infection prevention and control personnel in informing de-isolation decisions when interpreted alongside clinical context, assay characteristics, and other relevant laboratory data providing objective criteria for infectiousness and risk of forward transmission. However, as research has demonstrated, clearing residual RNA debris may take longer often giving persistently positive high Ct values.
Conclusion
We found a positive relationship between lower Ct, positive viral culture likelihood, and the symptom onset date. When done serially, preferably using the same platform, a consistent reduction or rise in the Ct value can be used to assess infectiousness status, taking account of several clinical variables that can be utilized to assess infectiousness. This work should feed into guidelines to facilitate interpreting PCR results and could be applied to several other acute respiratory viruses.
Supplementary material
The supplementary material for this article can be found at http://doi.org/10.1017/S0950268826101484.
Data availability statement
All data included in this review are derived from previously published studies and are provided within the manuscript tables and supplementary materials.
Acknowledgements
We did not specifically contact every author for this systematic review. While we recognize the value of primary data collection, our analysis was primarily based on published data. To augment this data, we did contact specific authors to provide additional information of included studies in our previous systematic reviews (Drs Mini Kamboj, Jeroen van Kampen, and Aki Sakurai) [transplant paper, asymptomatic review, and the cruise ship review]. This approach allowed us to expand the scope of our review without compromising methodological rigor. David Evans and John Conly provided detailed additional data from their published studies. Also, we thank Elizabeth Spencer for her invaluable assistance with the present work.
Author contribution
All authors designed the protocol for the study; CH, ECR, and TJ drafted the original version of the manuscript; JB undertook searches; ECR, TJ, and ES screened the papers; ECR, ES, and SM extracted data; JO performed statistical analysis; all authors significantly contributed to revising the manuscript for important intellectual content and approved its last version.
Funding statement
This work is supported by the National Institute for Health Research School for Primary Care Research (NIHR SPCR) Project 569 and by the University of Calgary.
Competing interest
TJ was in receipt of a Cochrane Methods Innovations Fund grant to develop guidance on the use of regulatory data in Cochrane reviews (2015–018). In 2014–2016, he was a member of three advisory boards for Boehringer Ingelheim. TJ was a member of an independent data monitoring committee for a Sanofi Pasteur clinical trial on an influenza vaccine. TJ is occasionally interviewed by market research companies about phase I or II pharmaceutical products for which he receives fees (current). TJ was a member of three advisory boards for Boehringer Ingelheim (2014–2016). TJ was a member of an independent data monitoring committee for a Sanofi Pasteur clinical trial on an influenza vaccine (2015–2017). TJ is a relator in a False Claims Act lawsuit on behalf of the United States that involves sales of Tamiflu for pandemic stockpiling. If resolved in the United States’ favour, he would be entitled to a percentage of the recovery. TJ was a coholder of a Laura and John Arnold Foundation grant for the development of a RIAT support centre (2017–2020) and Jean Monnet Network Grant, 2017–2020 for The Jean Monnet Health Law and Policy Network. TJ was an unpaid collaborator to the project Beyond Transparency in Pharmaceutical Research and Regulation led by Dalhousie University and funded by the Canadian Institutes of Health Research (2018–2022). TJ consulted for Illumina LLC on next-generation gene sequencing (2019–2020). TJ was the consultant scientific coordinator for the HTA Medical Technology programme of the Agenzia per i Servizi Sanitari Nazionali (AGENAS) of the Italian MoH (2007–2019). TJ is Director of Medical Affairs for BC Solutions, a market access company for medical devices in Europe. TJ was funded by NIHR UK and the World Health Organization (WHO) to update Cochrane Review A122, Physical Interventions to interrupt the spread of respiratory viruses. TJ is funded by Oxford University to carry out a living review on the transmission epidemiology of COVID-19. Since 2020, TJ has received fees for articles published by The Spectator and other media outlets. TJ is part of a review group carrying out a Living rapid literature review on the modes of transmission of SARS-CoV-2 (WHO Registration 2020/1077093–0). He is a member of the WHO COVID-19 Infection Prevention and Control Research Working Group, for which he receives no funds. TJ is funded to co-author rapid reviews on the impact of Covid restrictions by the Collateral Global Organisation.
TJ’s competing interests are also online https://restoringtrials.org/competing-interests-tom-jefferson.
CH holds grant funding from the NIHR, the NIHR School of Primary Care Research, the NIHR BRC Oxford and previously the World Health Organization for a series of Living rapid reviews on the modes of transmission of SARs-CoV-2 reference WHO registration No2020/1077093. He has received expenses and fees for his media work. He receives expenses for teaching EBM and is also paid for his GP work in NHS out of hours (contract Oxford Health NHS Foundation Trust). He has also received income from publishing toolkit books and appraising treatment recommendations in non-NHS settings.
DE holds grant funding from the Canadian Institutes for Health Research and Li Ka Shing Institute of Virology relating to the development of Covid-19 vaccines, as well as the Canadian Natural Science and Engineering Research Council concerning Covid-19 aerosol transmission. He is a recipient of World Health Organization and Province of Alberta funding, which supports the provision of BSL3-based SARS-CoV-2 culture services to regional investigators. He also holds public and private sector contract funding for developing poxvirus-based COVID-19 vaccines, SARS-CoV-2-inactivation technologies, and serum neutralization testing.
JMC has held grants from the Canadian Institutes for Health Research (CIHR) on acute and primary care preparedness for COVID-19 in Alberta, Canada and was a co-investigator on a CIHR/WHO/Juravinski Research Institute-funded study led by McMaster University for a randomized controlled trial of medical masks versus N95 respirators conducted during the COVID-19 pandemic. He was also engaged in a WHO-funded study using integrated human factors and ethnography approaches to identify and scale innovative IPC guidance implementation supports in primary care with a focus on low-resource settings during the COVID-19 pandemic and a co-principal investigator for a WHO-funded study using drone aerial systems to deliver medical supplies and PPE to remote First Nations communities during the COVID-19 pandemic. He also currently holds grants from the Synder Institute and a Catalyst Grant from the VPR Office at the University of Calgary for studies on the transmission of SARS-CoV-2 in K18-mice and received funding from BioMérieux Canada in 2022 for accommodations and travel expenses to attend a meeting on AMR hosted by the University of Toronto and received funding from the 2023 ICPIC meeting to attend an IPC Think Tank meeting focused on modelling of infectious diseases, all outside the submitted work. He was a member and Chair of the WHO Infection Prevention and Control Research and Development Expert Group for COVID-19 and is a current member of the WHO Health Emergencies Programme (WHE) Ad-hoc COVID-19 IPC Guidance Development Group, and the WHO IPC Acute Respiratory Infections Guidance Development Group, all of which provide multidisciplinary advice to the WHO and for which no funding is received and from which no funding recommendations are made for any WHO contracts or grants. He is also a member of the Cochrane Acute Respiratory Infections Working Group and an infectious diseases consultant in clinical practice within Alberta Health Services.
SG acknowledges the support of a grant funded by the European Union’s Horizon Europe Research and Innovation Programme under Grant Agreement No 101046016 (Eucare project: EUROPEAN COHORTS OF PATIENTS AND SCHOOLS TO ADVANCE RESPONSE TO EPIDEMICS).
AP holds grants from the NIHR School for Primary Care Research.
IJO, JO, ECR, and SM have no interests to disclose.




 Open access

