





INTRODUCTION
Before a fresh cosmogenic 14C atom (produced by 14N(n,p)14C) enters the main carbon cycle, it almost instantaneously forms 14CO and a such partakes in atmospheric chemistry for a period of a month or so. This brief intermezzo of not yet being fully oxidized in an otherwise fairly long life is of interest to atmospheric chemists. Bernard Weinstock had been a student of Harold Urey and worked on the Manhattan project. Subsequently he was for 20 years research scientist at Ford Motor Company, Dearborn, Michigan, a company with a brilliant scientist researching air pollution and the impact of combustion engine exhaust gases. In 1969, Weinstock published a brief paper in Science in which he estimated the atmospheric residence time of carbon monoxide. Pandow et al. (Reference Pandow, Mackay and Wolfgang1960) already had focused on the fate of 14C recoil atoms (∼95% forms 14CO). Subsequently, MacKay et al. (Reference MacKay, Pandow and Wolfgang1963) achieved the amazing first 14CO measurements (by Minze Stuiver) using CO samples obtained from an air liquification plant (huge air volumes needed to be processed) and Mackay suggested 14CO to be a useful atmospheric tracer. But Weinstock (Reference Weinstock1969) managed to use these 14CO data to estimate the lifetime of 14CO and thus of CO itself (12CO and 14CO for this purpose behave identically). When one of us, as a Dutch student (Groningen Radiocarbon Lab under W. G. Mook and P. M. Grootes) in New Zealand (Institute of Nuclear Science under A. Rafter) in 1976, had written Bernard Weinstock about his approach, proposing to do more 14CO measurements, an encouraging answer arrived within two weeks by airmail. This was an exposure to the generous attitude of American scientists.
Why was this estimate of the lifetime of CO so important? Concern about air pollution (e.g., Los Angeles) was certainly a factor, but moreover; when the number of automobiles increases strongly and each produces about 100 g CO (or more) per gallon gas the question is, “Will this toxic gas accumulate in the global atmosphere?” It was early days for atmospheric chemistry. Christian Junge (1959) had listed a mere 9 atmospheric trace gases in his 1959 “Air Chemistry” paper (he noted: “It is very likely that only a few of the trace gases are known”). Furthermore, consensus was that CO had only an anthropogenic source and that soils and the stratosphere were its only sinks. Having a guess of the input (it was thought that CO was mostly of fossil fuel origin) and of its atmospheric inventory did give a lifetime estimate. A totally independent lifetime calculation however, was worth a lot. Weinstock estimated using a rate of production of 14C at 1.3 × 10¹⁹ atomsec–1, a lower limit of 0.1 year. An excellent number. The big problem in those days was, however, that it was becoming clear that neither the stratosphere nor soils (the known sinks) could take up tropospheric CO (and thus 14CO) at the rate necessary to obtain such a short lifetime.
The fast developments in early atmospheric chemistry led to the landmark paper by Levy (Reference Levy1971) in which he showed that high concentrations of the hydroxyl radical OH do occur in the troposphere. High levels of formaldehyde were predicted too, which would be a source of CO, a partly natural source. Prior to this paper by Levy, it was assumed that OH abundance was negligible. But suddenly, the troposphere turned out to be a true chemical reactor, alike a slowly burning cold flame. OH is the troposphere’s pivotal oxidant. For instance, nearly the entire annual input of CH4 is removed by this radical, in fact >500 Tg/year. Likewise, CO and most Volatile Organic Carbons are removed by OH. It is hard to imagine how a biological-life-friendly atmosphere could function without OH.
The most compelling case for understanding the cycle and tropospheric distribution of OH is the budget of the important greenhouse gas methane. CH4 has been monitored on a large scale for decades and changes in its natural and anthropogenic sources cause variations that are difficult to trace back. Time and again growth rate changes of the global atmospheric burden CH4 have surprised us. The main factor in the budget of CH4 is of course its sink, namely OH. Numerous detailed studies address the role of changes in OH (e.g., Zhao et al. Reference Zhao, Saunois, Bousquet, Lin, Berchet, Hegglin, Canadell, Jackson, Hauglustaine and Szopa2019), which—to complicate matters—are partly attributable to CH4 emission changes and their global pattern.
The UV photolysis of tropospheric O3 leads to O2 molecules and extremely short-lived excited O(1D) radicals. These can react with H2O to form 2 OH radicals. These stable but highly reactive OH radicals live for about a second before reacting with either CH4, CO, organics and so on. One can by measurement of 14CO calculate the abundance of OH radicals, provided one knows the reaction rate constant for 14CO + OH (The rate is pressure dependent, at 200 hPa it is ∼30% lower than at sea level). This is the “14CO method” for determining OH, the subject of this article.
What makes 14CO relevant for OH determination? First of all, OH has a lifetime of seconds only. Its formation by daylight produces a strong diurnal cycle. Its concentration is much higher in summer than winter leading to a seasonal cycle. It is much more abundant in the tropics than at high latitudes. Its abundance varies with altitude due to mainly water vapour and UV flux gradients. In short, OH is extremely variable in space and time at different scales. Peak values are below 107 radicals per cm3, sub parts per trillion levels. This rarity combined with its high reactivity made it initially impossible to detect OH, but successful detailed experiments to use tracer 14CO in a flow reactor with ambient air were done (Felton et al. Reference Felton, Sheppard and Campbell1992). This radiochemical method proved to be problematic. To date, in-situ measurement of OH still pose an experimental challenge in atmospheric chemistry (Cho et al. Reference Cho, Hofzumahaus, Fuchs, Dorn, Glowania and Holland2021). And even though presently one can obtain in-situ OH data, no large-scale distribution of OH can be reconstructed this way as too many detection systems globally distributed would be needed. Indirect methods for gauging OH are therefore called upon. Instead of trying to measure OH, one observes the removal of certain trace gases that react specifically with OH. The indirect methods have the advantage of mapping the effect of OH on reactive gases, all of which have different reaction times, sources and distributions. The in-situ OH detection is on the other hand essential in achieving a detailed understanding of radical chemistry. Atmospheric chemistry models allow us to construct OH fields, but for verification, measurements are needed. The indirect methods use a trace gas with known input into the atmosphere that predominantly reacts with OH. Initially (Singh Reference Singh1977; Prinn et al. Reference Prinn, Rasmussen, Simmonds, Alyea, Cunnold and Lane1983) this was methylchloroform (CH3CCl3). However, methylchloroform has been almost eliminated from the atmosphere thanks to the Montreal Protocol measures. A recent paper by Patra et al. (Reference Patra, Krol, Prinn, Takigawa, Mühle and Montzka2021) notes: “Estimations of tropospheric OH trends and variability based on budget analysis of methyl chloroform (CH3CCl3) and process-based chemistry transport models often produce conflicting results.” In their paper they show that no major change in the chemical removal is likely.
Apart from this problem of phasing out, an inherent problem remains that uncertainties about the rate of release exist, which also applies to other industrial trace gases that potentially may be applied in constraining OH estimates. The conclusions about OH from the use of tracers like methylchloroform, often in painstaking work and finest analytical work and modeling support over decades, are not always in agreement.
Alternatively, 14CO is a geophysical tracer that will be around for a long time. Work is even in progress to use 14CO measurements in air extracted from firn and ice to reconstruct OH concentrations in the past. We review the application of 14CO in atmospheric science with some explanation for a broader readership. We also mention a few less successful studies to help to avoid pitfalls in future research. We do not deal with in-situ production of 14C in solids (e.g., ice).
APPLICATION
Distribution of Tropospheric OH Concentration
Figure 1 shows the zonally averaged distribution of OH over one year derived with an atmospheric chemistry model. These ever more sophisticated models incorporate hundreds of chemical reactions that take place in the atmosphere. They are in essence atmospheric transport/climate models with embedded chemistry modules dealing with trace gases, particles, their sources, clouds, precipitation chemistry and so on. The tantalizing aspect is that these models show us a distribution of OH that we cannot measure, in contrast for instance to the model derived distribution of O3, which is the most widely measured reactive trace gas. Different models have different OH distributions. Nicely et al. (Reference Nicely, Duncan, Hanisco, Wolfe, Salawitch and Deushi2020) show that there are still large differences between OH distributions generated in current models. The main feature of model results is the high concentration of OH in the tropospheric tropics (the tropics are the atmosphere’s cooking pot). Basically, the amount of UV light, ozone and water vapor determine OH. With most anthropogenic emissions (which are considerable compared to natural emissions in this period of the Anthropocene; Crutzen Reference Crutzen2021), including the key catalyst NO that sustains the oxidating cycle, being in the northern hemisphere, most models produced a higher OH abundance in the Northern Hemisphere. The publication by Spivakovsky et al. (Reference Spivakovsky, Yevich, Logan, Wofsy, McElroy and Prather1991) on OH has been frequently cited, underscoring the key role of OH. Work on using trace gases for assessing OH distribution is of course ongoing. For instance, Wolfe et al. (Reference Wolfe, Nicely, Clair, Hanisco, Liao, Oman, Brune, Miller, Thames and González Abad2019) mapped the variability of OH throughout the global remote troposphere via the synthesis of airborne and satellite formaldehyde observations.
Annual zonal mean OH concentration in 106 cm–3 (volume, not STP) as simulated with the EMAC chemistry climate model (Jöckel et al. Reference Jöckel, Tost, Pozzer, Kunze, Kirner and Brenninkmeijer2016). The dashed line is the tropopause. Tropospheric OH is slightly higher the NH.

Over the years, much has been learned about OH, in particular its degree of recycling (Lelieveld Reference Lelieveld, Dentener, Peters and Krol2004). For instance, when an OH radical reacts with CH4, it is lost. However, some of the follow-on products are again radicals and with NO these can lead to the re-formation of OH. To “definitely” remove one OH radical takes up to 20 CO molecules (Gromov Reference Gromov2013).
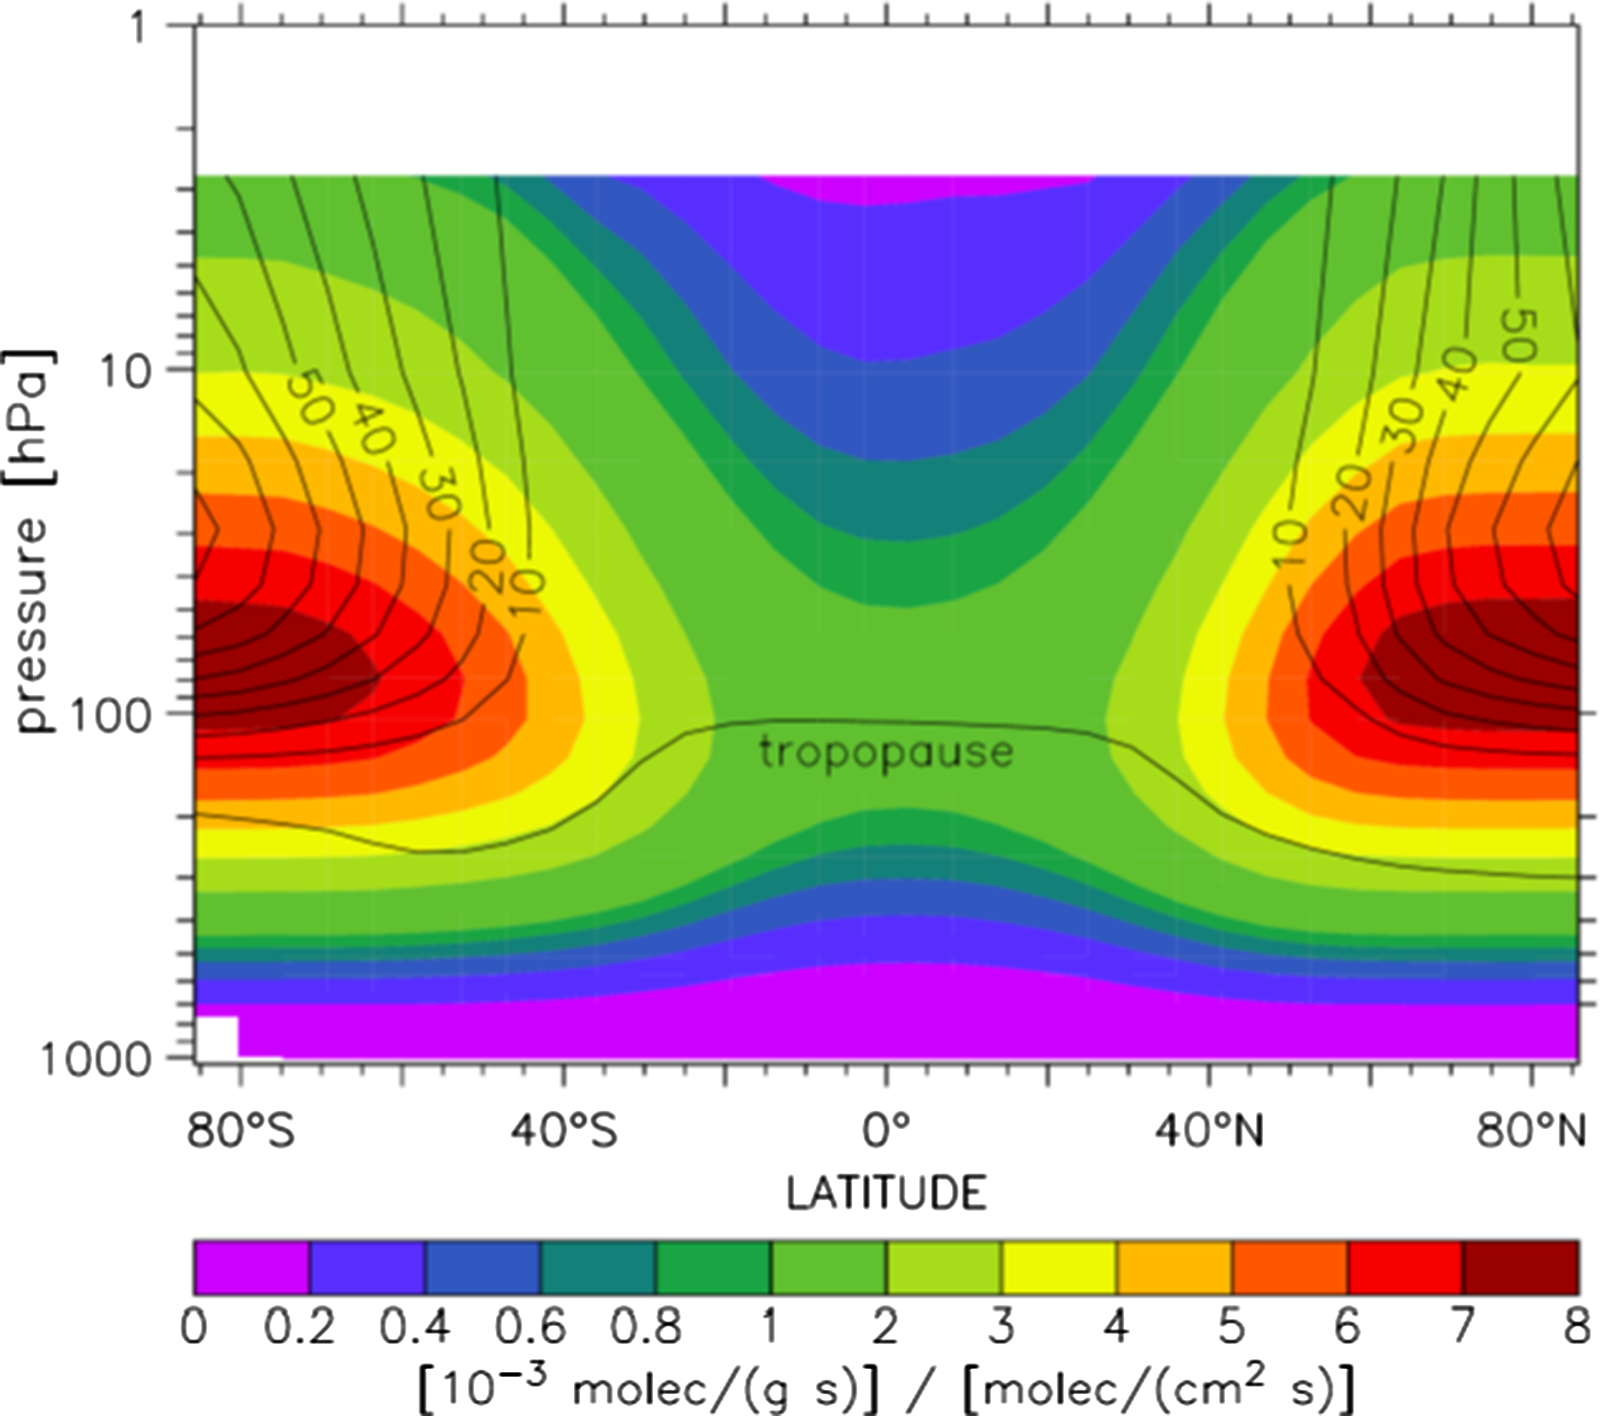
Distribution of 14CO Production
Figure 2 shows the calculated production rate distribution of 14CO based on Lingenfelter (Reference Lingenfelter1963). The mismatch with the OH distribution is large. We see high 14CO production rates at high latitudes and higher altitudes determined by the interaction of cosmic rays with the atmosphere and the nudging by the Earth’s magnetic field. Lowest production is in the tropics. High production combined with the longer lifetime of 14CO in much of the stratosphere (by mass) implies that its rate of transport into the troposphere (overall variable with season and stronger in the NH) is a key factor. In the troposphere 14CO is transported as well, be it to a degree that depends on its regional lifetime, ranging from one (tropics) to several months (at high latitudes).
Zonal-annual-mean galactic cosmic ray 14CO production rate (Lingenfelter Reference Lingenfelter1963). The unit is 10–3 molec g−1 s−1 normalized to a global average production rate of 1 molec cm–3 s−1. The yield of 14CO from 14C oxidation is assumed to be 95%. The contour lines refer to 14C production by solar protons which is discussed later in the text. (Figure from Jöckel Reference Jöckel2000.)
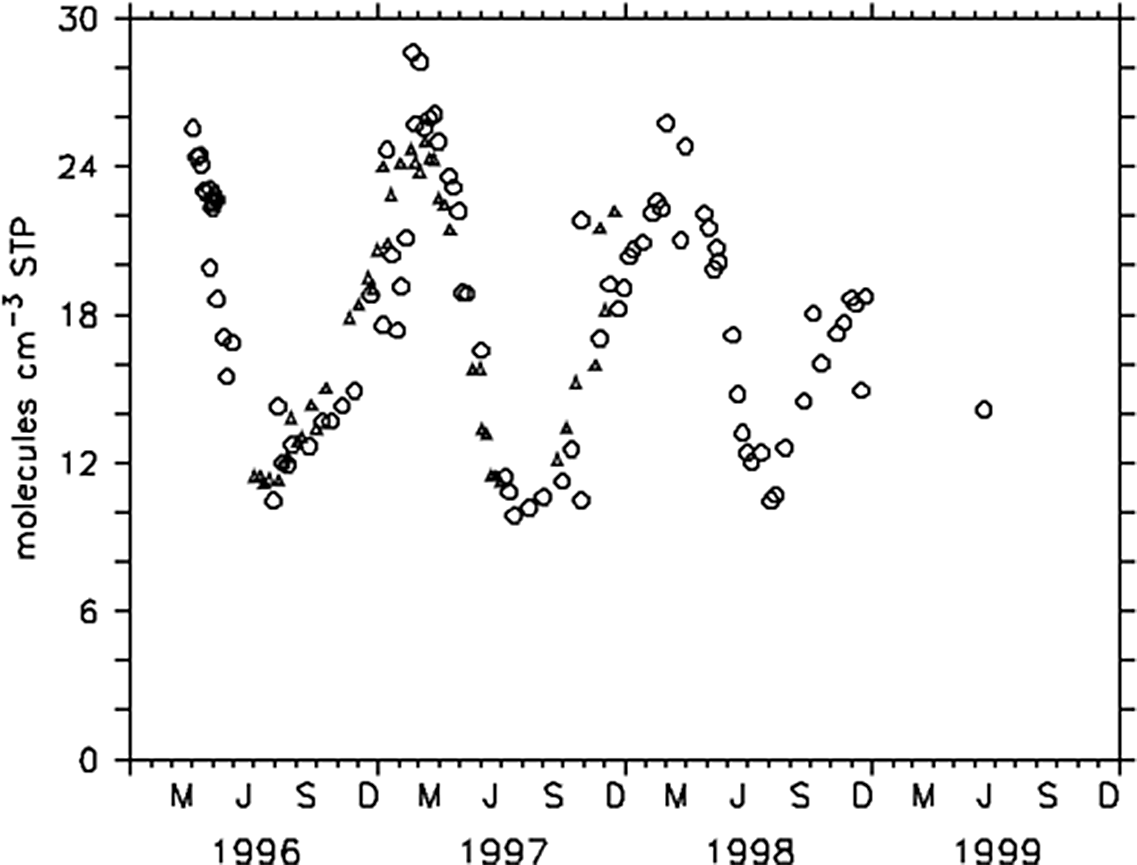
The result of the contrasting distributions of the rate of 14C production (Figure 2) and of OH (removal) is shown in Figure 3 as the resulting distribution of 14CO itself. A model takes transport and the pressure dependence of the reaction rate constant into account. 14CO mixing ratios are high in the maximum production region (Figure 2) and almost exactly there, OH bottoms out. Moreover, in the tropics where 14CO is rarer, annual variations are small. High concentrations occur at higher latitudes, accompanied by large annual variations reflecting OH seasonality. Figure 4 shows a high latitude annual cycle of 14CO measured at Spitsbergen and Alert (Ellesmere Island, Canada), as a result of the ongoing production of 14CO, its transport and mixing of air masses, the annual averaged level of OH and its strong local seasonal cycle. 14CO accumulates in the high latitude winter limited only by transport and mixing with air masses at mid latitudes (lower 14CO). In summer local photochemical removal by OH becomes important.

Measured annual cycle of surface 14CO at Ny Ålesund (78.90°N, 11.88° E, circles) and Alert (82.45°N, 62.52°W, triangles). The annual cycle is large. Accumulation of CO (mainly pollution) and 14CO (subsidence of stratospheric air and local production) takes place during polar night (no photo-chemistry, low OH) attenuated depending on the degree of exchange and mixing with air masses from lower latitudes.
Not all atmospheric 14CO is of direct cosmogenic origin. When we consider an air mass its CO content is highly variable because of its relatively short lifetime and the occurrence of concentrated sources, for instance industry (fossil fuel) and forest fires. Forest fires (biomass burning in general) releases copious amounts of CO into the troposphere with a 14C content determined by that of the burned matter. Likewise, the ongoing global removal of CH4 by mainly OH leads to 14CO production in the atmosphere itself. This “recycled 14C” in the form of biogenic 14CO forms a complication in the use of cosmogenic 14CO for reconstructing OH. Besides this biogenic source, there are poorly quantified sources of 14CO from the nuclear power industry and possibly from the use of 14C containing radio-chemicals/pharmaceuticals. There are no indications so far that these two types of sources play a significant role for the total atmospheric 14CO inventory, but no detailed research has been done so far. To correct for biogenic 14CO (∼20%) one has to subtract its contribution from measured 14CO values. Knowledge about the cycle of CO is necessary and measuring stable isotopic composition of CO namely 13C, 18O, and 17O (a mass independent effect exists (Röckmann et al. Reference Röckmann, Brenninkmeijer, Saueressig, Bergamaschi, Crowley, Fischer and Crutzen1998)), is helpful. The contribution of recycled 14CO is higher in the NH and more use could be made of 13CO observations to improve the corrections. Detailed experimental work on CO isotopologues is available (Röckmann Reference Röckmann, Jöckel, Gros, Bräunlich, Possnert and Brenninkmeijer2002) complemented by use of modeling (Gromov 2010, Reference Gromov2013). A rule of thumb is that 30 nmole/mole biogenic CO is equivalent to 1 molecule 14CO per cm3 (Brenninkmeijer Reference Brenninkmeijer1993). A 10% uncertainty in the estimate of biogenic 14CO results in a ∼2.5% uncertainty of the inferred amount of cosmogenic 14CO.
RESULTS
After Mackay’s pioneering data, Volz et al. (Reference Volz, Ehhalt and Derwent1981) carried out systematic 14CO measurements. They removed CO2 from 200 m3 sample air at the sampling site, oxidized its CO content to CO2 (20–40 mL) which was collected for proportional counting. They obtained the first seasonal cycles of 14CO and measured at different locations, including shipboard measurements. Using a global 2D model they derived a tropospheric OH concentration below 106 per cm3.
Subsequently 14CO measurements were set up at the Institute of Nuclear Sciences in Lower Hutt, New Zealand. Roger Sparks and colleagues had turned a decommissioned Pelletron accelerator from Australia into a 14C AMS system (Sparks et al. Reference Sparks, Wallace, Bartle, Coote, Ditchburn and Lowe1984). Using AMS the required sample size for 14CO dropped from 200 to less than 1 m3. AMS was a breakthrough for 14CO applications, especially because air samples of that smaller size could be collected in pressurized cylinders anywhere for processing in the laboratory. The required air sample size can be estimated as follows. When a conservative estimate of the efficiency of 14C detection of 1% is used in relation to the initial amount of 14C in the CO2 sample and a 1% precision is required, the presence of 10 14CO molecules per cm3 air STP implies a minimum air sample size of 100 L. Besides 14C determination, the CO derived CO2 samples are analysed by stable isotope mass spectrometry to determine the 13C/12C and 18O/16O ratio. These numbers are useful for reconstructing the local budget of atmospheric CO which helps to estimate the mentioned biogenic 14CO fraction.
The CO extraction method is described by Brenninkmeijer (Reference Brenninkmeijer1993). Sample air is cryogenically purified by means of “Russian doll” traps submerged in liquid nitrogen. These traps consisting of nested borosilicate glass fibre thimbles remove all condensable gases and achieve the reduction of the CO2 content of the air to below 0.1 nmole/mole. Depending on the sample CO content, the specific activity of CO is up to 1000 pMC (lowermost stratosphere) at CO mixing ratios down to 50 nmole/mole or less. Residual traces of CO2 would dilute the 14CO samples in terms of pMC. After this purification step, the CO content is specifically oxidized to CO2 using an iodine pentoxide-based reactant. The resulting micromole CO2 samples are measured manometrically which gives the value of the CO mixing ratio. After off-line stable isotope mass spectrometry, the small sample is diluted with “dead” CO2 for obtaining a CO2 sample of sufficient size for target preparation. The advantage of the oxidant used (I2O5) is that it does not scramble the original oxygen isotopic composition of the CO because it merely adds an oxygen atom of known isotopic composition to a CO molecule. Insofar air samples are collected in cylinders the CO content can increase in time. This spurious CO would generally affect the 14C result little because of a low or zero 14C content. Sampling and storage systems limit spurious CO “growth” to less than the percent level. Irrespective of this, delay between sampling and processing can lead to significant in situ produced additional 14CO, for which a correction must be applied (Lowe et al. Reference Lowe, Levchenko, Moss, Allan, Brailsford and Smith2002).
The accuracy and precision of a 14CO determination is composed of the AMS error, the manometric error in dilution of the CO sample (dilution up to a factor 10), and the error in determining the CO content of the air sample and can be kept at about 1%. Adding the larger uncertainty of the biogenic fraction estimation of 2%, gives a combined uncertainty that is below the variability of 14CO in most air masses (remote SH air showed the least variability) during a typical 1-hr air sample collection period using a high-pressure compressor. Recently, Petrenko et al. (Reference Petrenko, Smith, Crosier, Kazemi, Place and Colton2021) reported an air sample collection and processing method for much smaller air samples, namely less than 100 L. This avoids the use of high-pressure sample air cylinders, which are more expensive and time consuming to transport from the point of collection to the laboratory.
Using this method (with on-site CO extraction, however) Brenninkmeijer et al. (Reference Brenninkmeijer, Manning, Lowe, Wallace, Sparks and Volz-Thomas1992) had measured 14CO data at the clean air station Baring Head, New Zealand and compared the results for the seasonal cycle with those of Volz et al. (Reference Volz, Ehhalt and Derwent1981) for Schauinsland, Germany. Lowest summertime values at Baring Head were about 5 molec cm–3, compared to 10 at Schauinsland. These are two totally different sites from an atmospheric chemistry point of view, namely clean mid-latitude maritime SH air against continental NH air in the Black Forest. After correcting for the effect of the solar cycle and the difference in latitude and accounting for the biogenic 14CO fraction, Brenninkmeijer et al. (Reference Brenninkmeijer1993) concluded that OH levels in the SH were higher.
Using a large set of 14CO data Jöckel and Brenninkmeijer (2002) developed a climatology by which Jöckel et al. (Reference Jöckel, Brenninkmeijer, Lawrence, Jeuken and van Velthoven2002) could evaluate global atmospheric transport (including stratosphere-troposphere exchange) and the hydroxyl radical (OH)-based oxidation in three-dimensional (3-D) atmospheric chemistry transport models (CTMs) and general circulation models (GCMs). They showed that the correct representation of phase (annual cycle) and strength of the STE, including its asymmetry between NH and SH, is essential to reproduce the observation based seasonal cycle of 14CO. Moreover, their results did not support the previously inferred interhemispheric asymmetry in the OH abundance with an on average higher concentration in the SH.
A question that had to be addressed was the response time of the 14CO concentration to changes in total 14C production caused by modulation through solar activity (Jöckel et al. Reference Jöckel, Brenninkmeijer and Lawrence2000) which is related to, but not the same as the lifetime. Figure 5 shows model lifetimes of 14CO throughout the atmosphere. At the surface lifetimes are below 1 month for parts of the NH tropics.
Lifetime of 14CO in days (color scale) simulated with the EMAC chemistry climate model (year 2000, Jöckel et al. Reference Jöckel, Tost, Pozzer, Kunze, Kirner and Brenninkmeijer2016). The troposphere shows a considerable asymmetry with higher OH abundance in the NH. (Please see electronic version for color figures.)

Quay et al. (Reference Quay, King, White, Brockington, Plotkin and Gammon2000) applied a 2D transport model to their measured and several other 14CO datasets. They found good agreement and emphasize that in their model an increase in advection and slower stratosphere-troposphere exchange in the SH would best explain the lower 14CO levels of Baring Head.
The properties of 14CO in relation to OH and transport have been characterized in detail using the TM5 global chemistry transport model and inverse modeling (Krol et al. Reference Krol, Meirink, Bergamaschi, Mak, Lowe and Jöckel2008). It was established that in the tropics 14CO is sensitive to regional OH. Therefore, it is a useful indicator for the local “speed” of the rate of removal of reduced gases. At the hemispheric scale however, transport of 14CO plays a bigger role. Variability is introduced by synoptic scale processes. The model research also compares 14CO with CH3CCl3, which appears to be more sensitive to bulk tropical OH. The model results closely follow the annual cycle of 14CO at baring Head, NZ, with an offset probably due to the assumed production rate. Recommendation about optimizing locations for measurements can be gleaned from this work.
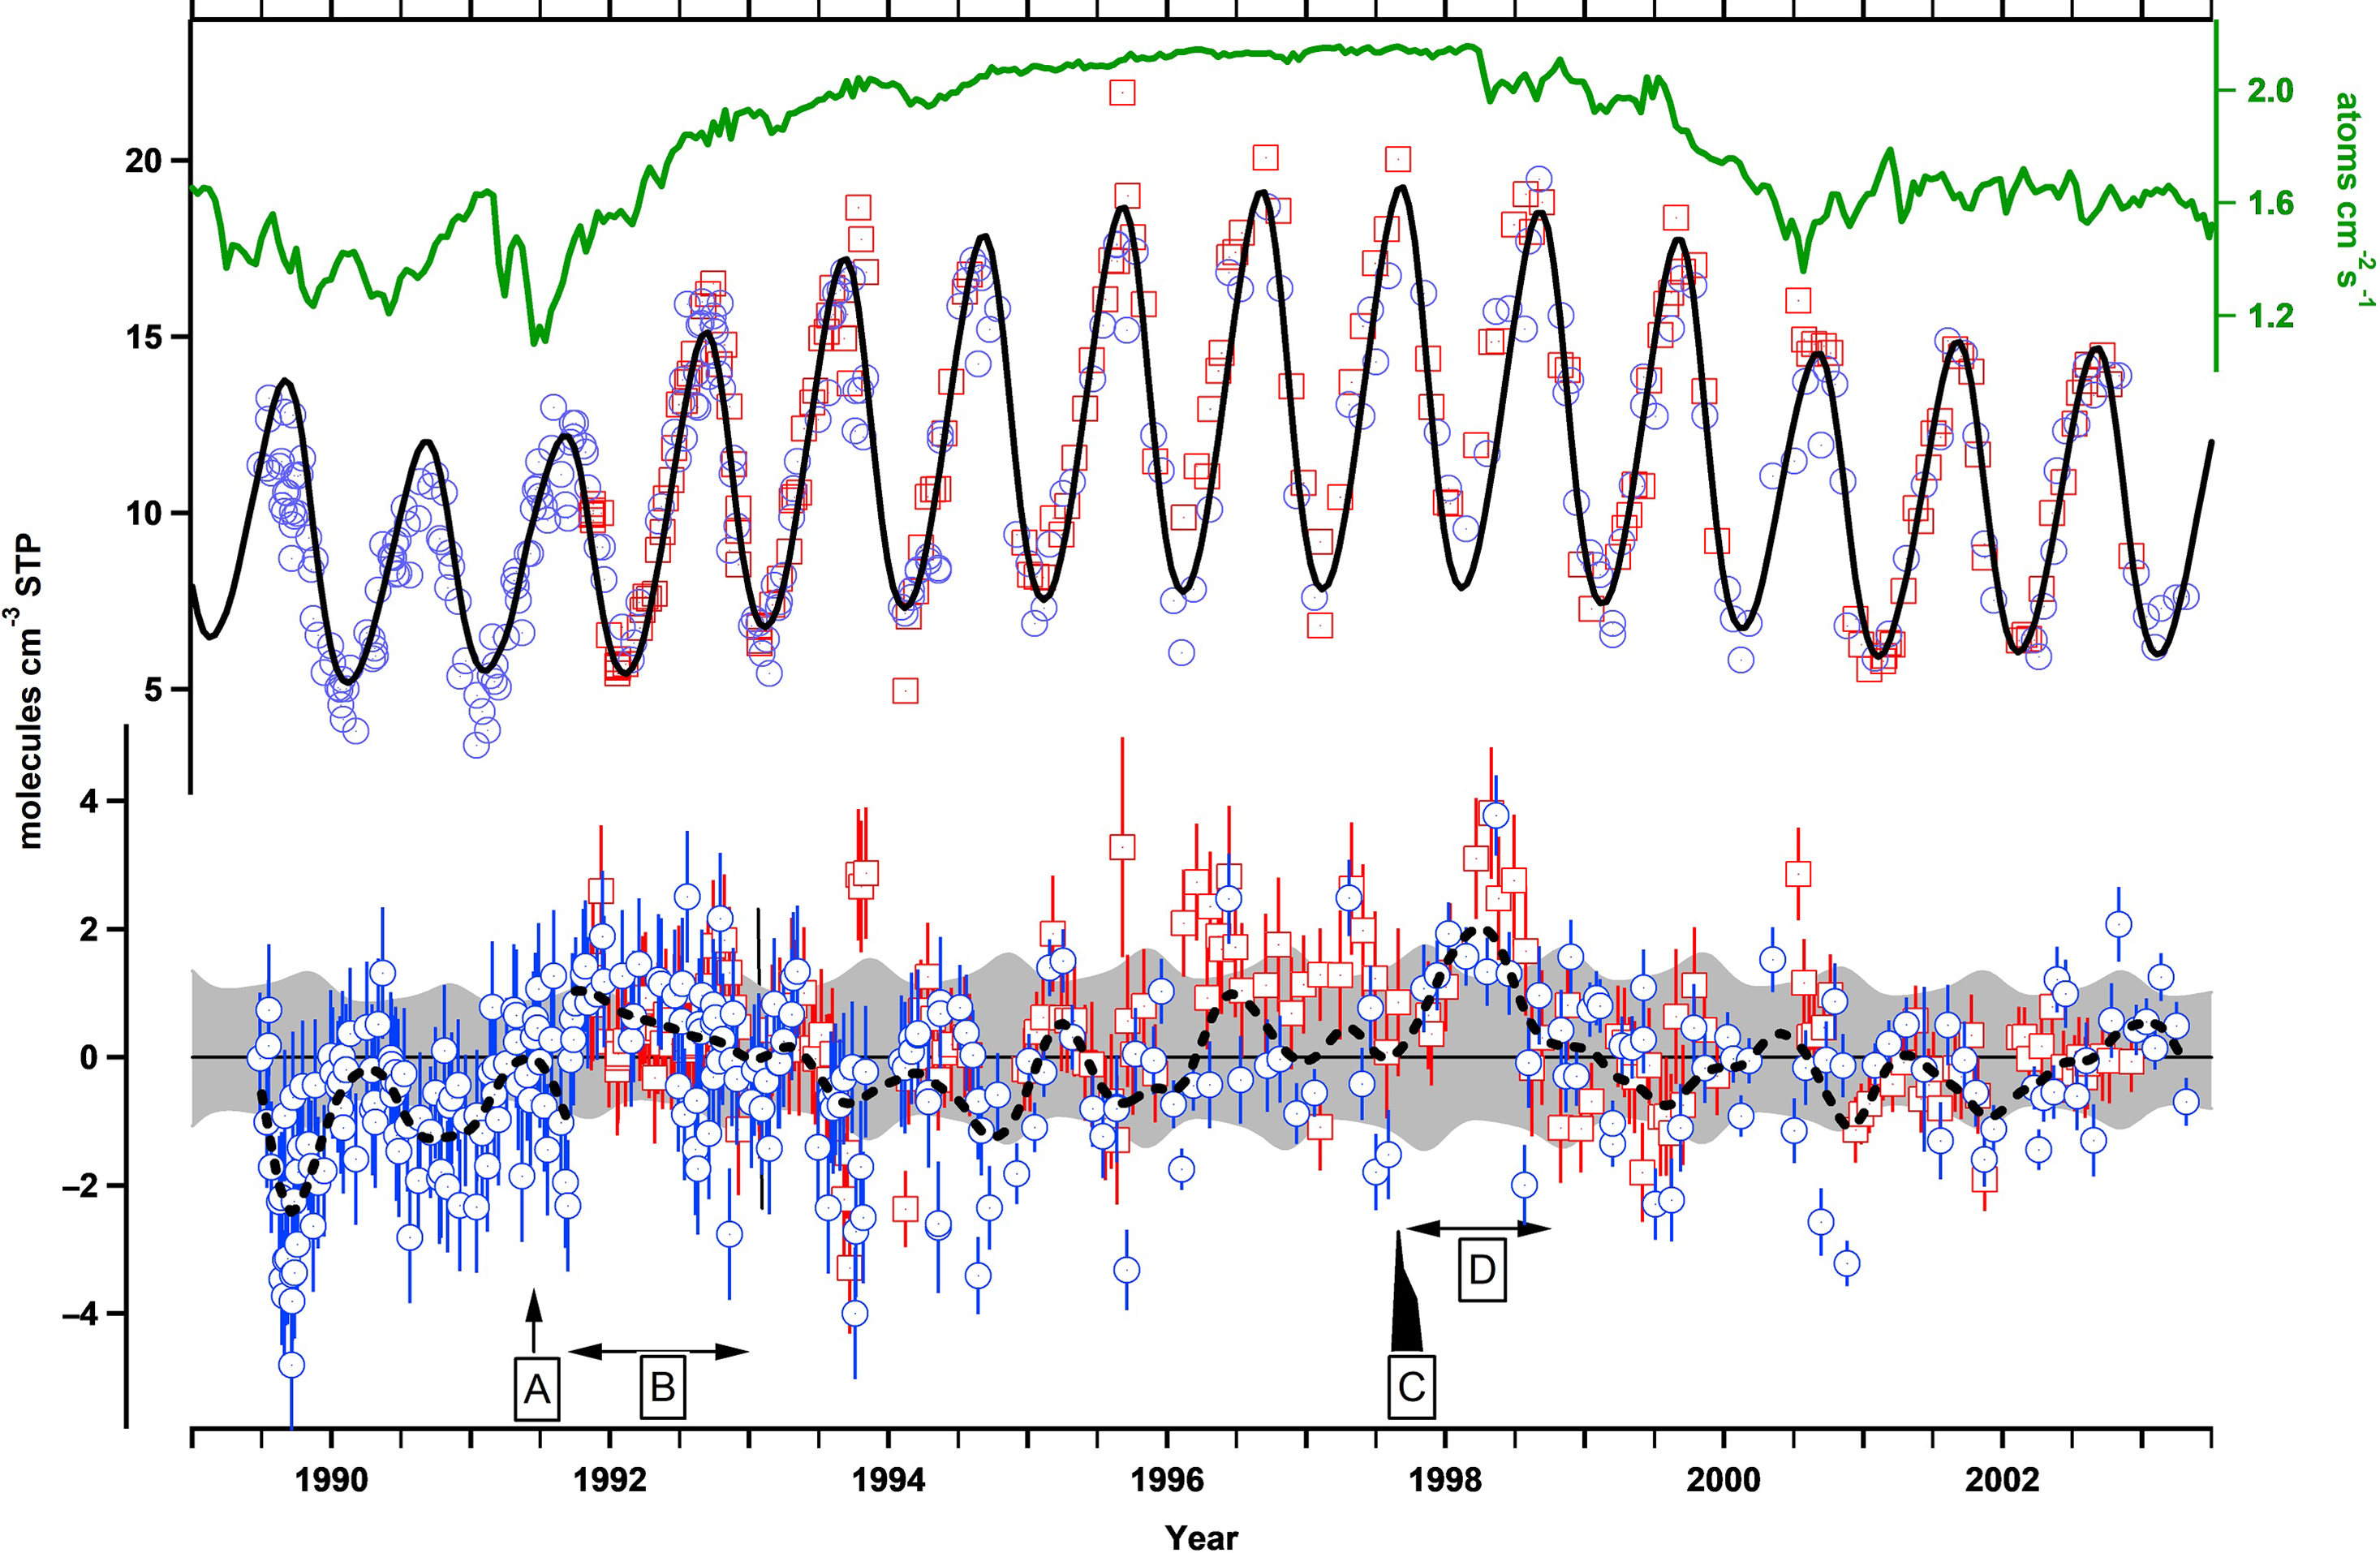
The success of the 14CO method for inferring changes in OH is best illustrated by Figure 6 from Manning et al. (Reference Manning, Lowe, Moss, Bodeker and Allan2005). It shows the longest available record, namely that of Baring Head including data from Scott Base, Antarctica. Cylinders with sample air from Antarctica often were stored on site for months before shipment was possible. Lowe et al. (Reference Lowe, Levchenko, Moss, Allan, Brailsford and Smith2002) corrected the 14CO content for in-situ production. One clearly sees the solar cycle induced change of about 20% for the period 1989 until 2003. The seasonal cycle due to OH is about ± 40%. When taking the 14CO production variations into account and applying an atmospheric model the residuals relative to a fitted curve are within 10%, except for two periods. The first one is in 1991, after the eruption of Mount Pinatubo. Reduced UV radiation in the troposphere did lead to a reduced production of OH (Dlugokencky et al. Reference Dlugokencky, Dutton, Novelli, Tans, Masarie, Lantz and Madronich1996) and thus an increase in 14CO. The second period is 1997/1998. During this period a strong El Niño led to intensive biomass burning (Southeast Asia, particularly Indonesia) thus burdening the troposphere with reduced gases apparently leading to a reduction in OH in this part of the SH. Also, radiative effects of a large atmospheric load with soot can have influenced OH levels. There are no other observations of this kind that document such changes in OH.
The calculated 14C production rate (uppermost curve) and the measured 14CO concentrations at Baring Head (blue circles) and Scott Base (red squares). The black curve is the best-fit simulated 14CO. The lower section shows the residuals with about 10% variability and two major events (cf. Manning et al. Reference Manning, Lowe, Moss, Bodeker and Allan2005).
Several experiments have addressed free tropospheric and lowermost stratospheric 14CO measurements using air samples collected using aircraft. Initially modified scuba diving compressors were used (Mak and Brenninkmeijer 1994) and later membrane compressors (Brenninkmeijer et al. Reference Brenninkmeijer, Crutzen, Boumard, Dauer, Dix and Ebinghaus2007; Brenninkmeijer and Roberts Reference Brenninkmeijer and Roberts1994) with the low ambient pressure being a challenge considering the large amount of air required.
Detection of 1989 Solar Proton Events
Figure 6 shows the calculated 14C production rate during solar cycle 22. The effect of the modulation of the cosmic ray flux by solar activity is considerable. Apart from this 11-yr gradual modulation, short-term fluctuations in 14C production do occur. For calculating the actual variation in the production of 14C, neutron count rates were used (Lowe et al. Reference Lowe, Levchenko, Moss, Allan, Brailsford and Smith2002). Both these longer-term and short-term variations have to be taken into account when reconstructing the actual 14C production rate for application to OH.
Besides this, independent, sporadic bursts (lasting days only) of atmospheric 14C production are due to high energy solar protons from coronal mass ejections. Such events can occur throughout a solar cycle and lead to elevated neutron count rates at ground level (Ground Level Enhancements, GLE). Lingenfelter and Flamm (Reference Lingenfelter and Flamm1964) estimated the average 14C production due to solar protons to be at most 5% of the cosmogenic production. For events to be of significance for 14C production the proton energy has to exceed ∼30MeV and the flux has to be sufficiently high. During solar cycle 22 several high energy proton events occurred. Three of these events between August and December 1989 carried sufficient high energy protons to produce—via additional neutrons—14C that was detectable above the background. The GLE on 29 September 1989 was the largest recorded since the giant event of 23 February 1956 (Hessel de Vries submitted a paper about its effects on background count rates in low level 14C proportional counters a mere 2 weeks later; de Vries Reference de Vries1956). Figure 2 (contour lines) shows that the solar protons in 1989, despite their high energy, produced 14C higher in the polar stratosphere than the typical maximum of the production by galactic cosmic rays. By analysing the Baring Head 14CO record, using modeling and satellite data for the proton flux, Jöckel et al. (Reference Jöckel, Brenninkmeijer, Lawrence and Siegmund2003) established that between 3 and 30% additional 14C production due to solar protons had occurred in 1989. Such an application of 14CO is a unique case. To extract the solar flare signal (Figure 7) the period June 1990–June 1991 was used a reference (no significant solar flares). The model calculated increase overlaps with the measured 14C enhancement.
Observed (black) and solar cycle corrected (red, scc) enhancement of 14CO for June 1989 to June 1990 relative to June 1990 to June 1991 (reference year) at Baring Head. The length of the three arrows corresponds to the estimated total solar flare 14C production. The blue lines show the model prediction for normal cut-off rigidity (lower line) and an 80% reduced cut-off rigidity (upper line). The purple line shows the observations smoothed with a time window of T=4 weeks and corrected for the solar cycle (scc). (Figure from Jöckel et al. Reference Jöckel, Brenninkmeijer, Lawrence and Siegmund2003; Creative Commons Attribution-NonCommercial-ShareAlike 2.5 License.)

Calculated Production of 14CO in the Atmosphere
The application of 14CO requires accurate information about the 14C production distribution (on average about 7 kg 14C is produced annually). Its subsequent fate by oxidation to 14CO2 is then determined by transport and OH chemistry, with a difficult aspect being its transport from the stratosphere (14C production but low OH) into the troposphere (also production but high OH). The calculation of 14C production by Lingenfelter (Reference Lingenfelter1963) (Figure 2) has been used most. Obviously, the position of the tropopause (the dynamic interface between the two spheres) is of no relevance to the 14C production field. All neutrons generated by nuclear reactions in the earth atmosphere lead to the production of 14C via 14N(n,p)14C. Lingenfelter used neutron count rates to derive 3D neutron production rates for solar maximum and minimum conditions. O’Brien et al (O’Brien et al. Reference O’Brien1979) carried out calculations based on hadronic cascades in the atmosphere. Masarik and Beer (Reference Masarik and Beer1999) developed a pure physical model. All three approaches give a few % more 14C production in the SH due to the Earth’s magnetic field distribution. In the given order of principal author 52 (Lingenfelter), 57 (O’Brien) and 64% (Masarik), respectively, is produced in the stratosphere (Jöckel Reference Jöckel2000). Whereas SH-NH differences are small, the vertical distribution needs attention in view of the role of stratosphere-troposphere exchange. Jöckel et al. (Reference Jöckel, Lawrence and Brenninkmeijer1999) showed by means of a model that tropospheric 14CO concentrations are relatively insensitive to these source differences and therefore not critical for the 14CO method. More extensive and refined work on cosmogenic isotope production was carried out by Usoskin and coworkers (Poluianov et al. Reference Poluianov, Kovaltsov, Mishev and Usoskin2016). Not only did this work at long last close the gap between calculated global 14C production and observations in the carbon cycle but also revealed a larger solar modulation of 14C production than in previous works.
Figure 8 shows vertical profiles of production rates from the four approaches. There are significant differences of a factor 5 at the surface and in the free troposphere. The steep production rate gradient in the troposphere is a lesser concern because of the relatively rapid vertical exchange of air masses and thus mixing of 14CO in the vertical. For local 14CO production the gradient matters.
Vertical profile of the zonally averaged 14C production rate at 80°N for January 2000 (heliospheric potential of 752MV). The colour coding is for calculated results from Poluianov et al. (Reference Poluianov, Kovaltsov, Mishev and Usoskin2016, black), Lingenfelter (Reference Lingenfelter1963, red), Masarik and Beer (Reference Masarik and Beer1999, green), and O’Brien (Reference O’Brien1979, blue). The dashed horizontal lines delineate the tropopause. Please note that we use here a linear vertical scale and that the production rate is per volume unit, not per mass unit.

In-Situ 14CO Production Experiments
From an experimentalist’s point of view, it is comforting to know that (in principle) it is straightforward to measure the actual production of 14C (as 14CO) by exposing a quantity of air to cosmic radiation. Mak et al. (Reference Mak, Brenninkmeijer and Southon1999) reported on such experiments based on exposing cylinders with compressed air at different altitudes and latitudes (South Pole Station and Mount Cook, NZ) and at different heights on a tall tower (Boulder Atmospheric Observatory, USA). The fundamental problem is that production rates at the surface are low (production peaks at 100 hPa), which renders the result as a measure for the column integrated production intrinsically less informative. An additional complication is the enhancement of the neutron flux close to the surface. The purpose of the tall tower experiment was to deal with this. The results showed that measured production rates were consistently lower by ∼50% than values derived from Lingenfelter’s calculations.
Further experiments were made using cylinders with compressed air stowed in passenger aircraft (Ramsey et al. Reference Ramsey, Brenninkmeijer, Jöckel, Kjeldsen and Masarik2007). Such experiments are ideal from the point of view that civil aircraft happen to cruise at altitudes where 14C production peaks. By simulating the aircraft flights over weeks between cylinder exchanges in a model of the 14C production field expected accumulated production could be calculated. Also, calculations were carried out to correct for local neutron enhancement due to aircraft structure and payload. But there also was a big obstacle. Namely, only cylinders that were certified to fly on passenger aircraft could be used. These aviation oxygen supply (mild steel) cylinders were not the treated inert aluminum cylinders normally used in 14CO air sampling and storage. During the experiment, the aviation cylinders had to undergo hydraulic pressure tests. Altogether 90 experiments could be carried out. Sets of cylinders were kept in the laboratory for background testing. Measured was not only 14CO but also 14CO2. The results showed not a 14CO2 to 14CO ratio of about 5%, as expected on the basis of the early radiochemistry experiment, but about 20%. No explanation could be given. Furthermore, production rates were well above those calculated using the Masarik and Beer distribution. Despite a considerable effort the results were less conclusive.
14CO as the Precursor of 14CO2
Because soils and oceans take up negligible amounts of 14CO and the chemical fate of CO is its oxidation, nearly all primary cosmogenic 14CO molecules will form 14CO2. In equilibrium both 14CO and 14CO2 have exactly the same flux (some deviations occur because of 14C from the nuclear weapons tests and variations in the rate of uptake of 14CO2 by the biosphere and oceans). As a result of their vastly different residence times however, the atmospheric inventory of 14C as 14CO is more than 1000 times smaller than 14C as 14CO2. Also, their distributions in the atmosphere bear no resemblance. Kanu et al. (2016) calculated an independent cosmogenic production rate of 14C using data from air samples collected in the stratosphere up to above 30 km. Their 14CO2 data show a compact correlation with decreasing N2O mixing ratios, a gas that is destroyed in the stratosphere. ∆14CO2 reached about 140 per mil. Brenninkmeijer et al. (Reference Brenninkmeijer, Müller, Crutzen, Lowe, Manning, Sparks and van Velthoven1996) report 14CO values in the lowermost stratosphere over Antarctica of up to 150 molec cm3, 10 times tropospheric values. To our knowledge, no model analysis for 14CO2 production from 14CO in the stratosphere have been published so far. Our preliminary model calculations show that ∼30% of 14CO produced in the stratosphere is exported to the troposphere. About 10% of the tropospheric production (which is less than 50% of the total) ends up in the stratosphere. Therefore, the net 14CO loss for the stratosphere is only 20%. Consequently, 80% of 14CO in the stratosphere is oxidized there to 14CO2.
Firn Air Measurements of 14CO
The analysis of air extracted in-situ from firn allows reconstruction of past atmospheric composition of lesser reactive trace gases. In the case of 14CO hopes were high to be able to shed some light on changes in OH over past decades. Indeed, CO itself appeared to be stable in firn air. Although the in-situ production of 14C of the air retained in the firn layers is small, in situ production in the solid phase appeared to complicate matters. As can be seen in the paper by Assonov et al. (Reference Assonov, Brenninkmeijer and Jöckel2005) 14CO levels in firn air (Dronning Maud Land, Dome Concordia and Berkner Island) were above atmospheric levels and increased considerably near pore close-off depth. This points to a very complicated situation when one wishes to reconstruct past OH concentrations. In-situ production of 14C (Jull et al. Reference Jull, Lal, Donahue, Mayewski, Lorius, Raynaud and Petit1994) complicates the use of 14CO in firn air. A sufficiently accurate correction for in situ production in the 14CO firn air application, will be difficult, if possible, at all. Nevertheless, work on this is in progress (Petrenko et al. Reference Petrenko, Hmiel, Dyonisius, Smith, Neff and BenZvi2020).
Suggested Improvements for the 14CO Application
Given the lack of alternatives for OH and the improvements in modeling including the recent 14C production calculation by Usoskin’s group, 14CO work should continue with improved methods. The optimal number and location of sampling sites can be better determined now (Krol et al. Reference Krol, Meirink, Bergamaschi, Mak, Lowe and Jöckel2008). From an air sampling method point of view, a degree of time integrated collection optimizes the results. Short term variations are average by this. Up to now it has been a major effort to collect, compress and ship a dry air sample, but why this fast sampling? There is a lot of air for sampling, in contrast to many other 14C AMS applications where smallest amounts need to be assayed. Volz et al. (Reference Volz, Ehhalt and Derwent1981) and Brenninkmeijer et al. (Reference Brenninkmeijer, Manning, Lowe, Wallace, Sparks and Volz-Thomas1992) used on-site extraction, which was cumbersome. Thereafter, Mak and Brenninkmeijer (1994) used the experience obtained in Boulder (NOAA) for using high-pressure air (diving air) compressors. This facilitated getting samples from remote locations enormously and many 14CO data were collected (e.g., Rom et al. Reference Rom, Brenninkmeijer, Ramsey, Kutschera, Priller and Puchegger2000; Gros et al. Reference Gros, Bräunlich, Röckmann, Jöckel, Bergamaschi and Brenninkmeijer2001). An excellent example of a sampling technique is the pioneering work by Östlund (Reference Ostlund1970), who measured the Tritium content of atmospheric H2 already in 1970 using automated collection systems (HT is rarer in the atmosphere than 14CO) at remote locations, including Baring Head.
For the 14CO application one should ironically not think about small air samples as we did so far. We propose here that sample air, say 5000 L (flowrate of 1 L/min) is dried using Nafion® and subsequently cryogenically purified using Russian Doll traps. The next step is oxidation of the CO content at ambient temperature using a CO selective catalyst (e.g., Sofnocat®). The resulting CO2 is collected on a molecular sieve cartridge for shipment to the AMS lab. Alternatively, molecular sieve cartridges are used for the thorough pre-purification after sample air drying. A large volume cartridge with molecular sieve would lead to a CO gas chromatography separation effect. Smaller cartridges in parallel, that are sequentially heated and backflushed for re-generation, avoid such a problem. After this set of traps one final molecular sieve cartridge acts as a safety barrier before the air flow reaches the catalyst. Another advantage of using molecular sieve (instead of the Russian doll traps) is that cooling systems are not required. Moreover, the air processing occurs at above atmospheric pressure. Cryogenic purification requires sub-ambient pressures.
The advantages compared to the method developed by Brenninkmeijer et al. (1999) are (1) large, “robust” CO-derived CO2 samples, (2) time-integrated air sampling, (3) samples can be shipped without restrictions, (4) storage will most likely not lead to in situ 14C formation, and (5) the difficult I2O5 oxidant need not to be used (this “Schütze reagent” is very sensitive to moisture and difficult to prepare). The disadvantage is that no δ18O(CO) information is obtained in this way. CO mixing ratios are already obtained at may sampling sites in the framework of Global Atmosphere Watch. What remains difficult is the collection of air samples using civil aircraft. The CARIBIC Boeing 737 used for 14CO work (Brenninkmeijer et al. Reference Brenninkmeijer, Crutzen, Boumard, Dauer, Dix and Ebinghaus2007) had a typical cruise speed of well over 800 km per hour, which meant that with the given air sample collection time of about ½ hour, sampling in the tropopause region where civil aircraft most frequently fly at mid-latitudes an averaging between 14CO in tropospheric and stratospheric air masses was inevitable.
CONCLUSIONS
The distribution and possible changes of OH in the troposphere have been a bone of contention for years (one can find several lively discussions in the literature, e.g., Spivakovky Reference Spivakovsky, Yevich, Logan, Wofsy, McElroy and Prather1991). It was (and still is) not known if OH does change over large parts of the troposphere or even globally on a scale of several years and if OH remained stable at all over the current decades of the Anthropocene. The clear detection of reductions in OH due to the 1991 Mount Pinatubo eruption and the 1998 El Nino by Manning et al. (Reference Manning, Lowe, Moss, Bodeker and Allan2005) is an important demonstration of the use of 14CO. Over many years emphasis has been on using methyl chloroform records, but this substance disappears from the atmosphere after having been banned by the Montreal Protocol. Its mixing ratio dropped from over 100 to a few pmole/mole (lifetime about 5 years). Clarissa Spivakovsky wrote about CH3CCl3 based estimates of tropospheric OH “Last Offerings of a Departing Friend” (Spivakovsky et al. Reference Spivakovsky, Logan, Montzka, Balkanski, Foreman-Fowler and Jones2000). A main concern is uncertainty about its source strength, the role of the oceans with a dwindling atmospheric abundance. Nevertheless, a recent paper seems to have given methyl chloroform back a brief lease of life (Patra et al. Reference Patra, Krol, Prinn, Takigawa, Mühle and Montzka2021). Some other industrial trace gases also help to “constrain” OH, but there remain inherent uncertainties. It is difficult.
The initial interest in 14CO from an atmospheric application point of view was definitely the determination of OH. In the application of atmospheric models to support this use, 14CO also proved to be a tough test for the simulated transport processes (Jöckel et al. Reference Jöckel, Brenninkmeijer, Lawrence, Jeuken and van Velthoven2002). A difficult aspect in this is the cross-tropopause transport. At civil aircraft cruise-altitude we frequently measured changes from 10 to almost 100 14CO molecules per cm3 STP when crossing tropopause folds (CARIBIC unpublished results). 14CO correlates closely with O3 in the lowermost stratosphere. This strong tropopause gradient means that a cut-off low releases 14CO enriched air into the troposphere. Such information—detailed as it is—is difficult to model. Today’s models can have a higher vertical degree of resolution in the tropopause region, which is helpful.
Given the improved 14C production calculations and continued 14CO applications it is worthwhile to carry out improved in-situ production experiments by exposing air samples. It seems to be a trivial undertaking, but so far, no really useful conclusions have been reached.
14CO has the great advantage that it tracks closely the seasonal cycle of OH. Corresponding variations in CH3CCl3 are below 3% only. 14CO can help to derive OH levels on a regional scale. 14CO has a source that is probably not affected noticeably by industrial emissions, it is a geophysical tracer. From this point of view is stands to reason to continue 14CO observations, and indeed recently further improvements were just reported (Petrenko et al. Reference Petrenko, Smith, Crosier, Kazemi, Place and Colton2021). Current atmospheric chemistry models are of great complexity and the reconstructed rate of removal of trace gases by OH remains an essential piece of output. The discussion about OH is ongoing. In this, measurement of 14CO provides a definite test option, in absence of other suitable trace gases. Support for long-term times series, namely Baring Head (the 14CO “Mauna Loa”), will be most helpful.
In summary, given a need to gauge tropospheric OH in a changing atmosphere and the lack of suitable trace gases, and given the improvements in cosmogenic 14C production knowledge, and given improvements in atmospheric modeling, and knowing an optimized sampling strategy and using an improved 14CO measurement methodology as suggested, continued progress is possible.


 Open access

