

Introduction
Each year, hundreds of new candidates enter the academic job market, trying to capture one of the competitive tenure-track or permanent positions in political science departments around the world. It is, by design, that only a small proportion of applicants can land their dream job and build a successful career in academia. While some factors like the ability to publish in prestigious journals, the ability to secure grant-funding, or teaching experience play a role in the decision-making of search committees, one further variable of interest seems to be the applicants’ alma mater. Prestigious universities generally place their candidates more frequently and in more competitive departments, but prestige cannot be used as an exact proxy for placement success (Oprisko 2013). As none of the well-regarded department rankings consider placement success, it seems that this metric is currently absent from public evaluations of departmental reputation.
This article tries to take a step toward the integration of placement records into the assessment of departments. As this metric is of critical importance for prospective graduate students, making it more transparent and accessible is a worthwhile endeavor. The article first discusses some of the established departmental rankings, before introducing an original data set and presenting novel and up-to-date rankings of placement success at the most renowned political science departments across North America and Europe. Last, it also puts the spotlight on the gender dimension of faculty placements, highlighting the large gender gap in placement success. Placements outside academia, for example at think tanks or non-academic research organizations, are not considered in this article for two reasons: firstly, data on these industry placements are much harder to systematically gather, and secondly, it is difficult to determine the success or prestige of a non-academic placement.
Prior attempts at ranking political science departments
There are many existing methodologies for ranking political science departments, both from within the discipline and from outside. Most of these rankings base their evaluations on departmental prestige, research productivity, and citation counts (Masuoka et al. Reference Masuoka, Grofman and Feld2007). The two largest outside rankings for global comparisons of political science departments are the Shanghai Ranking (Jiatong University Shanghai 2021) and the QS Ranking (Quacquarelli Symonds Limited 2021). While the former has a strong focus on quantitative research output, the latter gives greater weight to academic and employer reputations. The most influential outside ranking for the US departments, the US News Best Political Science Schools (US News World Report 2021), is based on a similar methodology as the QS ranking and relies on reputational surveys. An approach like that of the Shanghai ranking has already been used within the discipline by Simon Hix, who has come up with perhaps the first comprehensive ranking of political science departments (Hix Reference Hix2004). There, the absolute and relative numbers of peer-reviewed journal publications are indicative of a successful department. None of these rankings considers placement records in their evaluations. This is not necessarily a bad thing, as it is impossible to include all relevant factors in one ranking and weigh them in an objectively fair manner. It should, however, not be forgotten that placement records are one of the most important metrics, especially for younger scholars at the very start of their academic career, and can thus not be left out of the discussion of which departments are the most desirable to study at.
The first article that showcased rankings based on placements was that by Schmidt and Chingos (Reference Schmidt and Chingos2007). This approach has later been replicated in a similar fashion by Oprisko et al. (2013) and was also used for a ranking of economics departments (Amir and Knauff Reference Amir and Knauff2008). Building on Schmidt and Chingos, the following analysis expands their ranking in several ways: firstly, it includes not just the top US departments, but also the top European departments in the data collection, while Schmidt and Chingos´s ranking only considers placements at the US American universities, by the US American Ph.D.’s. This ignores the fact that there is a diffusion of job market candidates both from North America to Europe and vice versa, and that Europe has its own active and relevant political science community. Secondly, their ranking rightfully considers the varying prestige between placements. Applications for a tenure-track position at Harvard are significantly more competitive than at a smaller, less prominent department. However, by basing this prestige on their own placement ranking, they mischaracterize the incentives for junior scholars. While an undergraduate student choosing Ph.D. programs to apply for might place a high weight on placement records, a Ph.D. holder or ABD applying for faculty jobs arguably puts more weight on a department’s academic reputation and research output. To account for that this paper will weight placements by a combined measure of the Shanghai ranking and the QS ranking of 2021. Lastly, as some years have passed since the publication of Schmidt and Chingos´s article, it only scrutinizes Ph.D. graduates between 1990 and 2004. By presenting an up-to-date ranking that includes Ph.D. graduates between 2000 and 2022, this paper gives a more reliable view of the current job market situation.
Data
Since only a few universities present transparent information about their graduate placements, the data had to be collected through the recipient, instead of the sending institutions. Big political science departments often present short profiles of their faculty members on their departmental websites, including their educational backgrounds. Additionally, many professors now have personal websites, which allowed me to fill in many of the blanks that were left by incomplete departmental websites.
Before collecting the data on placements from these sources, a sensible case selection of recipient institutions had to be decided. I chose to compare placements at the most renowned and competitive departments, because Universities placing their graduates in these departments are likely also successfully placing them in other departments. This paper considers two dimensions by which departments are commonly ranked: their prestige and their research output. These dimensions are explicitly measured in the QS ranking (prestige) and the Shanghai ranking (research output), which is why only placements at departments that do well in these two rankings are observed. To be included in the sample of recipient institutions, a department must be at least in the top 100 in one of these rankings, and at least in the top 200 in both. This does not imply that departments outside the top 100 or top 200 are not desirable locations for an academic career, but it merely serves as a pragmatic frame for the sample size and considers the fact that job offers at more prestigious departments usually receive more applications and are thus more competitive.
Eighty-eight departments fulfill both criteria in the 2021 versions of these rankings, forty-five of which are in North America, and forty-three of which are in Europe. A list of all departments from which information is gathered can be seen in the publicly available dataset in the supplementary materials. Within these departments, full-, associate-, and assistant-professors, as well as other permanent, full-time academic staff like senior lecturers and senior researchers are considered as faculty, but not temporary positions like postdoctoral researchers, visiting-, or interim-professors. Emeriti faculty are included when mentioned on the departmental websites.
For political science departments, every member of the aforementioned group of faculty with a social science Ph.D. is considered, even if their dissertation was in a related field like sociology or economics. In broader themed social science departments, only political science Ph.D.’s are considered. Faculty without a Ph.D. are not considered. This leaves a sample of 3777 faculty members of which information on their educational background was collected for 3548 people from departmental and personal websites in February and March of 2022. The missing 229 people did not publicly disclose any information about their educational backgrounds. The full data set including redacted observations of all individual faculty members can be accessed from the supplementary materials. For the calculation of the placement ranking, only the Ph.D. granting institution matters. Neither postdocs nor undergraduate degrees are taken into account.
Placement rankings
The main ranking only considers placements of faculty members that acquired their Ph.D. in the twenty-first century. This cutoff is introduced to ensure that the ranking is more representative of the current job market and not simply an artifact of the past. Reputation weights are included to give more importance to placements at highly prestigious departments because placements at those departments are the most competitive. As this ranking is, however, already based on placements at the most internationally renowned departments, which can all be expected to have competitive application cycles, the reputation weights increase the importance of higher placements only slightly.Footnote 1 Finally, to make sure that the ranking is not excessively long, only those universities that placed at least five graduates at top departments are included. The ratings are adjusted to show each department’s rating as a percentage of that of the leading institution.
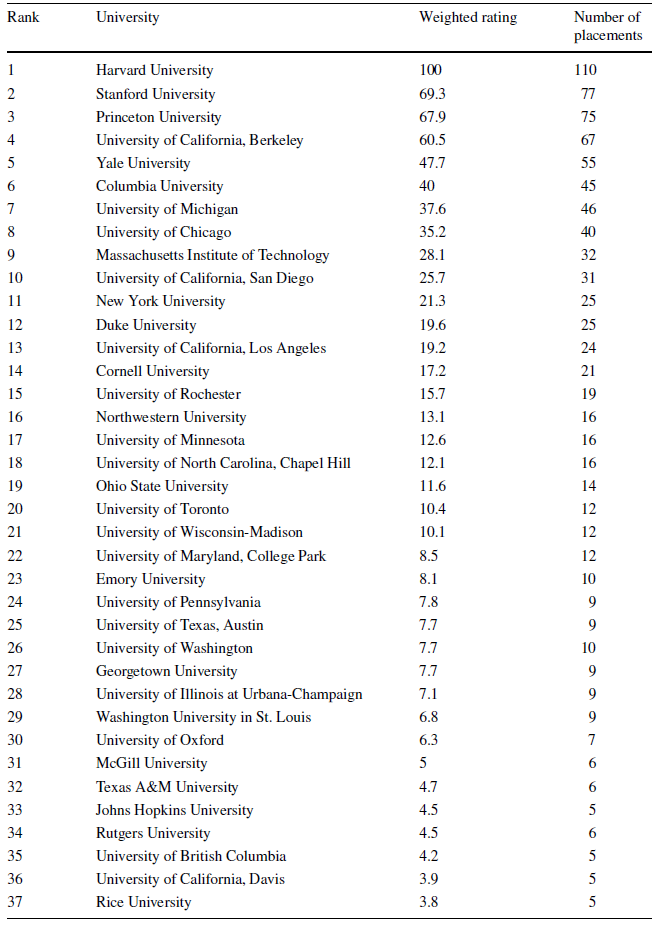
Table 1 presents the ranking for placements on the North American continent. Harvard University is the leading institution by a large margin, with more than thirty additional placements ahead of the second place. The best Canadian university is the University of Toronto at rank twenty, and the only European university is the University of Oxford at rank thirty.
Placements at renowned north american departments (2000–2022 Sample)

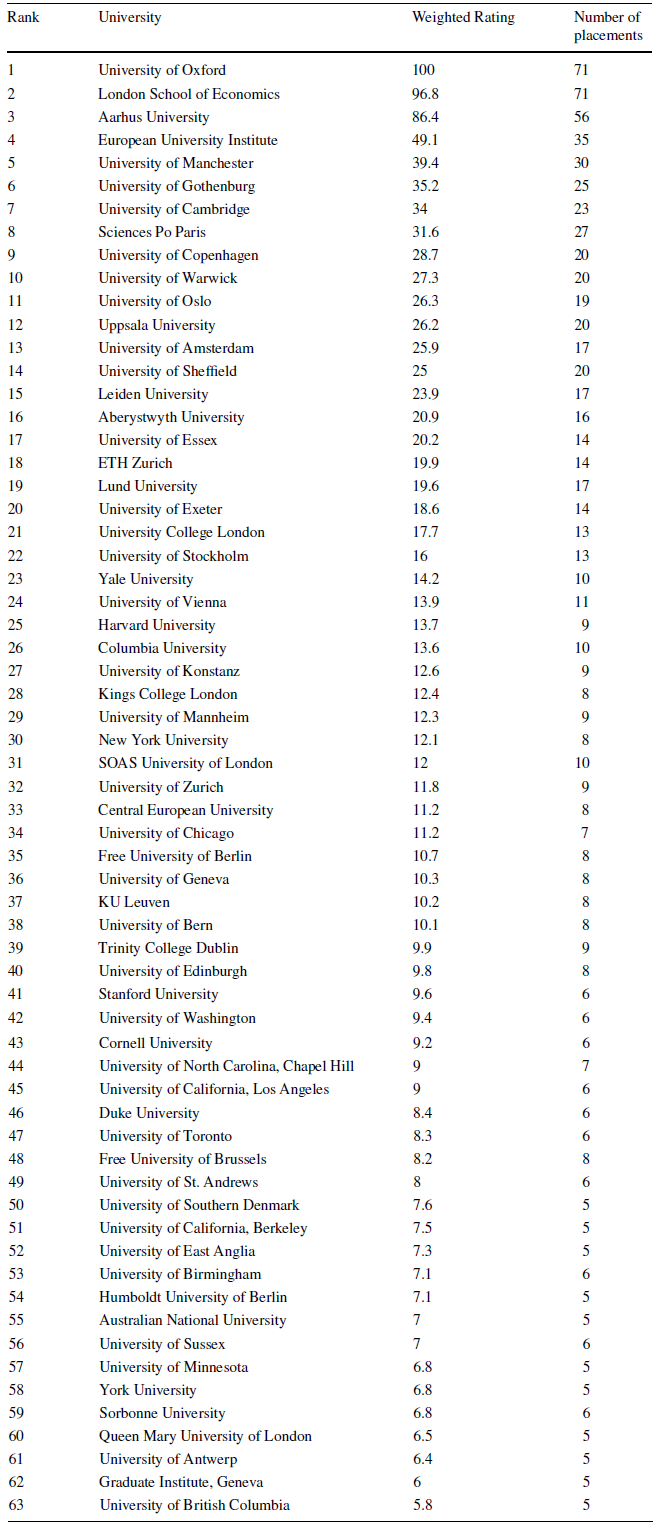
Table 2 presents the ranking for placements on the European continent. One apparent difference between the two regions is the higher spread of European faculty members across various alma mater. While only thirty-seven universities have placed five or more recent graduates at the top North American departments, sixty-three have placed five or more recent graduates at the top European departments. When including those graduates from universities with fewer than five placements, the recently graduated faculty at the North American departments originate from 110 universities in total. In comparison, the recently graduated faculty at the European departments originate from 210 universities in total.
Placements at renowned european departments (2000–2022 Sample)

The second visible difference is a much higher share of American graduates at European universities than vice versa. While only one European university managed to place more than five graduates at top North American departments in our observed time frame, sixteen North American departments placed well in Europe, even though none of them managed to break into the top twenty. Australian graduates also seem to be well-regarded on the European market, as the Australian National University makes it into this ranking as the only university that is located in neither Europe nor North America. The University of Oxford is the leading institution on the European job market, though the London School of Economics placed the same number of graduates, albeit at slightly less prestigious departments in comparison. A combined ranking for placements on both continents is included in Appendix 1.
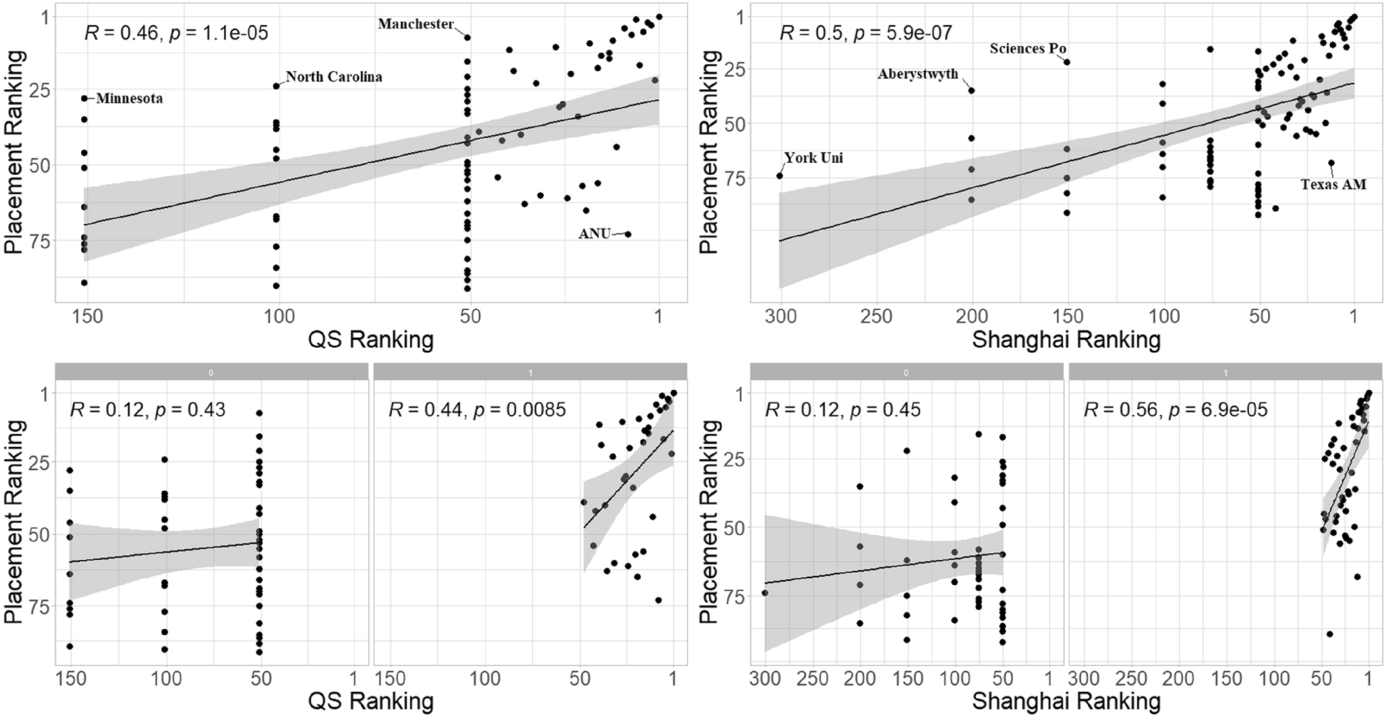
As documented in Fig. 1, placement success is positively correlated with departmental prestige.Footnote 2 Highly ranked departments in the QS and the Shanghai rankings tend to also place their graduates well on the academic job market. The Pearson correlations between the established rankings and the placement ranking are 0,46 (QS) and 0,5 (Shanghai), respectively. Some outliers place their graduates exceptionally well despite lower rankings in the QS ranking (see, e.g., University of Minnesota, University of North Carolina, University of Manchester) and the Shanghai Ranking (see, e.g., York University, Aberystwyth University, Sciences Po Paris). Others, like the Australian National University, place fewer graduates at renowned European and North American departments despite a very high initial ranking.Footnote 3
Association between QS/Shanghai rankings success and placement success. Note: For the bottom row, the sample has been split to isolate those departments placing in the top 50 of the QS/Shanghai rankings, because the other departments are clustered in steps of 25/50 in those rankings. The Y-axis has been flipped in all graphs for illustration purposes. The gray areas represent 95% confidence intervals

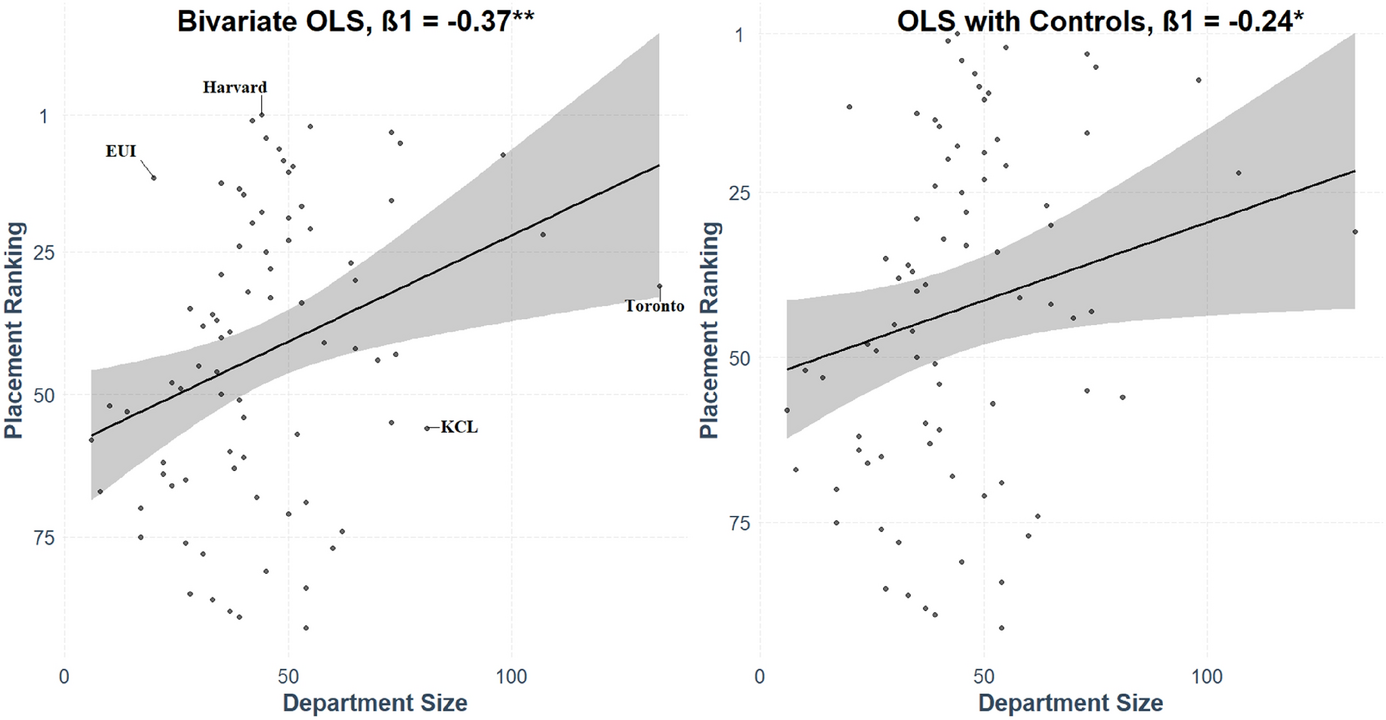
Department size is a highly significant predictor of placement success, as can be seen in the linear model in the left column of Fig. 2. With ten additional faculty members, a department is predicted to rise almost four spots in the placement ranking.Footnote 4 Departments with a higher placement ranking than predicted can then be considered as outperforming their department size. This association between department size and placement success becomes slightly weaker when including regional fixed effects and controlling for the QS/Shanghai rankings of departments, as can be seen in the right column. Regression tables for these models are included in Appendix 2. Admittedly, department size, measured here by the number of permanent faculty members, is only an imperfect proxy for Ph.D. cohort size. For this variable, public information is sadly scarce among many departments.
Department size and placement success. Note: The Y-axis has been flipped in both graphs for illustration purposes. The gray areas represent 95% confidence intervals. ** = p < 0.01; * = p < 0.05

Gendered placements
While the rankings give a good overview of the volume of graduates that departments manage to place well into the job market, they do not tell us who is getting these placements. The following section illuminates the gender dimension of placements, showing that none of the best-placing departments have achieved gender parity yet.
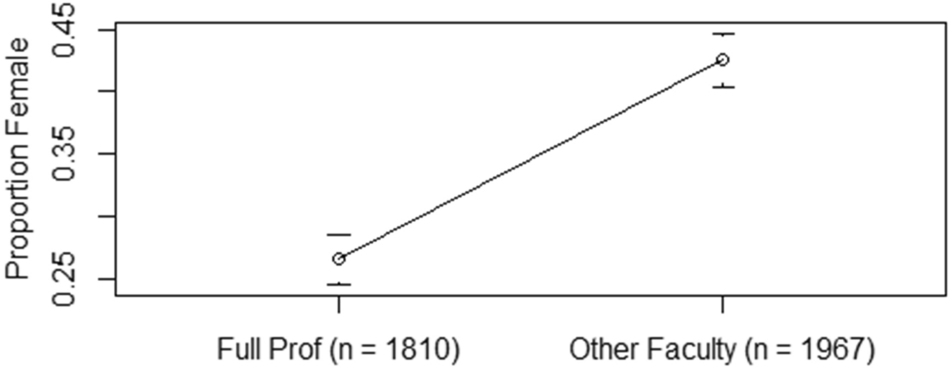
Women are underrepresented at every seniority level included in the data. As depicted in Fig. 3, the gap is especially large among full professors, where only slightly above twenty-five percent of positions are filled by female scholars. For less senior positions like assistant- and associate-professorships, this number goes up to slightly above forty percent. This might partially be due to a heightened awareness of gender issues nowadays compared to thirty years ago when the older generation of current scholars started their careers, but it also seems to be influenced by gendered hurdles in promotion decisions that still exist to this day (Hesli et al. Reference Hesli, Lee and Mitchell2012). The gender gap in faculty placements persists across both continents. As the gap is even larger when looking at the entire discipline (Sedowski and Britnall Reference Sedowski and Britnall2007), it seems that the most renowned departments might put a slightly higher emphasis on gendered hiring practices than others.
Proportion of female faculty at renowned departments. Note: The error bars represent 95% confidence intervals

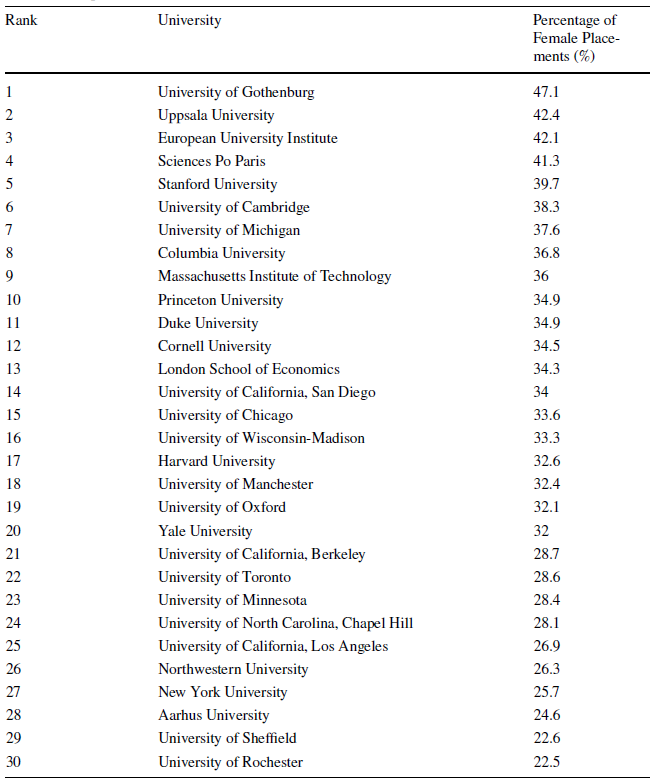
In Table 3, the percentage of women among all placed graduates is shown for the thirty Universities with over thirty placements across the entire sample. We can see that not one of the highest-placing departments managed to place as many women as men. At the bottom of the list, less than one-fourth of all placed graduates are female. The highest percentage can be seen at the University of Gothenburg with roughly forty-seven percent women among all their placements in the sample, while the University of Rochester at less than twenty-three percent has the lowest percentage of women among their placements. Appendix 3 shows the same table including only the most recent placements. Here, three of the thirty departments, namely the University of Gothenburg, the University of Uppsala, and the European University Institute, managed to place women as frequently as men.Footnote 5 Overall, the percentage of female placements goes up from thirty-three to forty-one percent when looking only at the most recent placements, suggesting a positive trend in time.
Percentage of female placements at renowned departments among the highest placing universities (Full Sample)

These analyses show how important it is to not only look at the overall volume of placements but also at the identities of individuals. A department that successfully places a large volume of men into the academic job market, but only a small number of women, might not be the most desirable place to do a Ph.D. for women interested in academic careers.
Discussion
The data at hand are based on the number of graduates that universities are able to place at renowned political science departments across North America and Europe. It should, however, not be interpreted as a direct indication for prospective graduate students as to how good their chances will be on the job market, depending on the department they choose to go to. With such a deterministic interpretation, larger departments that admit more graduate students would be inherently advantaged by the given methodology in this ranking. The ranking also does not tell us precisely how good of a chance North American graduates have at receiving jobs on the European continent or vice versa. While the number of European graduates on the North American continent is very low, and North American graduates are also comparatively underrepresented on the European continent, with the given data we cannot causally establish to what degree this is due to low intercontinental application rates or due to intercontinental discrimination against foreign applicants. Finally, as alluded to before, industry placements are not considered in this ranking. Some departments might put a stronger emphasis on preparing candidates for the non-academic job market and could thus be undervalued here.
The ranking can be seen as a purely descriptive look at each universities´ influence on the academic political science landscape through the representation of their graduates. In conclusion, this article makes two valuable contributions: (1) because many universities do not publicly share their placement records on their departmental websites, a comprehensive comparison of departments creates a new layer of transparency. The rigorously collected and summarized data on the educational backgrounds of over 3500 faculty members makes it easier for prospective graduate students to evaluate departments on a multitude of dimensions, other than just rankings based on reputation or research output. It might also motivate others to continue these data collection efforts in the future and perhaps even institutionalize them through bodies like the APSA or the ECPR. These dynamics might then mobilize departments to put more effort into the systematic preparation of their advanced Ph.D. students for the job market.
(2) The empirics also give an indication of which departments currently put a higher emphasis on gender equality at the level of job market preparation.Footnote 6 It is shown that women secure fewer placements than men across all the best-placing institutions, with some departments placing three times more men than women into the academic job market. While a positive trend in time can be observed, these inequalities are still far from being remedied. Increased transparency and open data in this area might motivate departments and graduate schools to take gender equality more seriously and invest resources into the appropriate mentoring of women in their final years of graduate school, for example through advanced peer mentorship (Cassese and Holman Reference Cassese and Holman2018).
Acknowledgements
The author would like to thank Richanet Grace Bolina for her support and the reviewers and editors for their helpful feedback.
Funding
Open access funding provided by European University Institute - Fiesole within the CRUI-CARE Agreement.
Data availability
All replication files are available in the supplementary materials at https://github.com/fresej/Replication-Files-Placement-Records-.
Declarations
Competing interest
The author declares none.
Appendix 1
Placements at renowned north american or european departments (2000–2022 sample).

Appendix 2
Regressing the placement ranking on the department size.

*p < 0.05; **p < 0.01
Appendix 3
Proportion of female placements at renowned departments among the highest placing universities (2000–2022 Sample).


 Open access