


1. Introduction
Seasonal snow cover is linked with the surrounding environment through feedback mechanisms which may intensify or weaken global environmental change. Because snow has high surface albedo, the extent of terrestrial snow cover has a significant effect on the planetary radiation budget (Groisman and others, Reference Groisman, Karl and Knight1994; Brown and Robinson, Reference Brown and Robinson2011). The disappearance of snow or changes in the snow depth or in the length of the snow cover period will induce changes in the underlying permafrost, seasonal soil frost and in the vegetation carbon uptake further linking the snow cover changes with the global carbon cycle (Pulliainen and others, Reference Pulliainen2017). These make the extent and duration of snow cover vital variables for climate change research (Vaughan and others, Reference Vaughan and Stocker2013) and emphasize the need for continuous and correct snow cover information.
Due to the high reflectance of snow in the visible (VIS) and near infrared (NIR) parts of the electromagnetic spectrum, optical satellite remote sensing is an efficient method to monitor the extent and duration of snow cover (Dietz and others, Reference Dietz, Kuenzer, Gessner and Dech2012). By nature the snow reflectance is variable both spatially and temporally, and it exhibits considerable changes, from the dry snow period through the melt season due to snow metamorphism, melting, addition of impurities and changing measurement and illumination geometry (Warren, Reference Warren1982; Hall and others, Reference Hall, Foster and Chang1992; Winther, Reference Winther1993; Pulliainen and others, Reference Pulliainen, Salminen, Heinilä, Cohen and Hannula2014). The dependency of different snow reflectance quantities on the prevailing environmental and observational conditions, and their implications for optical remote sensing have been widely investigated in the literature (Zhou and others, Reference Zhou, Li and Stamnes2003; Dozier and others, Reference Dozier, Green, Nolin and Painter2009; Painter and others, Reference Painter2009). Spectral unmixing or inverse model-based methods can be used to retrieve the snow cover area (SCA), or within a satellite pixel, the fractional snow coverage (FSC) from the optical satellite data (Vikhamar and Solberg, Reference Vikhamar and Solberg2002, Reference Vikhamar and Solberg2003; Painter and others, Reference Painter, Dozier, Roberts, Davis and Green2003, Reference Painter2009; Metsämäki and others, Reference Metsämäki, Anttila, Huttunen and Vepsäläinen2005, Reference Metsämäki2012, Reference Metsämäki2015; Dozier and others, Reference Dozier, Green, Nolin and Painter2009). These methods describe the scene reflectance as a combination of spectral signatures of model parameters (i.e. end-members), such as snow, forest canopy and snow-free ground. Thus the derived snow cover estimates are sensitive to the inadequate description of the predetermined input parameter variability, such as snow reflectance that is further propagated to the uncertainty of the snow cover maps (Salminen and others, Reference Salminen, Pulliainen, Metsämäki, Kontu and Suokanerva2009, Reference Salminen2018; Metsämäki and others, Reference Metsämäki2015). The reflectance of an end-member and its variability can be determined by field measurements, modelling or by the optical satellite data itself. The variability of the snow reflectance, on the other hand, is a function of its physical properties such as liquid water content and grain size but is also dependent on the view-illumination geometry (Vikhamar and Solberg, Reference Vikhamar and Solberg2002). Thus snow reflectance information gathered in the laboratory or in the field with concurrent in situ measurements, describing the micro- and macro-physical characteristics of snow, can be utilized to further develop the snow algorithms used in satellite remote sensing, and to decrease the existing uncertainties of retrievals.
In this study, earlier estimates of snow reflectance obtained by modelling (Green and others, Reference Green, Dozier, Roberts and Painter2002; Painter and Dozier, Reference Painter and Dozier2004; Kokhanovsky and others, Reference Kokhanovsky, Aoki, Hachikubo, Hori and Zege2005) and field measurements (Aoki and others, Reference Aoki2000; Peltoniemi and others, Reference Peltoniemi, Kaasalainen, Näränen, Matikainen and Piironen2005; Salminen and others, Reference Salminen, Pulliainen, Metsämäki, Kontu and Suokanerva2009) were complemented and extended by quantifying snow reflectance variability under controlled laboratory conditions by measuring a notable amount of undisturbed samples of natural boreal snow. The aim was to investigate the effects of snowpack characteristics, including organic matter inclusions, without the typical inaccuracies related to field measurements (due to changes in illumination conditions between measurements, tilts in snow surface/surface roughness and challenges in calibration), and thereby, offer more accurate snow reflectance information to be used as an input for snow cover mapping algorithms.
The four main snow types investigated were (1) dry snow; (2) moist snow; (3) wet snow and (4) wet snow with a littered snow surface. Six different dry snowpack conditions were investigated and one snow occasion represented dry snowpack with moist surface snow. Spectroradiometer observations from wet snow samples with an un-littered surface were obtained for two occasions and one measurement occasion represented wet snow with a littered surface. Multiple samples for each snow condition were measured and Std dev. for each snow type was defined from sample-wise reflectance variability. Although the most important impurities decreasing snow surface albedo are soot, continental dust and volcanic ash (Warren, Reference Warren1984), the organic material originating from surrounding trees and snow-free patches (Winther and others, Reference Winther1999) lower the snow surface albedo and enhance the solar absorption. This increases snowmelt and changes snow surface roughness when the litter particles are melting through the snow and may hamper SCA estimation from satellite data (Melloh and others, Reference Melloh, Hardy, Davis and Robinson2001). However, there has been little investigation regarding the effect of the organic material on snow spectral reflectance, although this may be a significant factor during the melt season, in particular in forested areas.
The measurement data of different snow types were resampled to correspond to various relevant satellite instrument bands with slightly different band configurations, in order to quantify the effect of these differences on the snow reflectance. This comparison indicates the possible effect of slightly varying channel configurations on snow reflectance, which is relevant concerning the use of different satellite instruments (e.g. Sentinel-2 and −3) for the mapping of snow cover. These algorithms typically apply reference (end-member) reflectances of the Earth's surface spectral contributors (Vikhamar and Solberg, Reference Vikhamar and Solberg2002, Reference Vikhamar and Solberg2003; Painter and others, Reference Painter, Dozier, Roberts, Davis and Green2003, Reference Painter2009). In addition, resampling of reflectance of all the measured snow types to correspond to various bands of one sensor, moderate-resolution imaging spectroradiometer (MODIS), was implemented, and the corresponding normalized difference snow index (NDSI) calculated to investigate the sensitivity of these often applied band indices for varying snow microstructures. Finally, the results obtained here were compared with the field dataset (Salminen and others, Reference Salminen, Pulliainen, Metsämäki, Kontu and Suokanerva2009) currently used for the characterization of the snow reflectance and its variability in the semi-empirical reflectance model-based method (SCAmod), operated by the Finnish Environment Institute (SYKE) (Metsämäki and others, Reference Metsämäki, Anttila, Huttunen and Vepsäläinen2005, Reference Metsämäki2012, Reference Metsämäki2015). The SCAmod method derives the fractional snow coverage within a satellite pixel by inverting a radiative transfer-based forward model which describes the scene reflectance as a combination of snow-free ground, (wet) snow cover and forest canopy. An average and Std dev. of snow reflectance has been determined from observations executed in various illumination and snow circumstances. Thus the measured reflectance variability is due to both changes in illumination conditions and in the snow properties which may result in increased uncertainty in the FSC estimate.
2. Quantification of snow reflectance variability
In earlier research, the effects of the snow microstructure on the reflective properties of snow, and vice versa, the retrieval of different quantitative snow parameters (e.g. surface albedo and grain size) from snow reflectance data have been studied through models (Xie and others, Reference Xie, Yang, Gao, Kattawar and Mishchenko2006; Painter and others, Reference Painter2009). The characteristics of snow reflectance have been studied both in the field, and in the laboratory with artificial snow or by destroying the original snow microstructure (Nakamura and others, Reference Nakamura, Abe, Hasegawa, Tamura and Ohta2001; Kaasalainen and others, Reference Kaasalainen2006). To our knowledge, only Dumont and others (Reference Dumont, Brissaud, Picard, Gallet and Arnaud2010) have executed bidirectional reflectance distribution function (BRDF) laboratory measurements with four (n = 4) natural undisturbed (alpine) snow samples. In the initial state three of these samples represented wet snow and one dry snow. Although controlled laboratory measurements (Zender and others, Reference Zender, Dominé, Gallet, Picard, Pedersen, Bernsten, Gerland and Warren2009; Hadley and Kirchstetter, Reference Hadley and Kirchstetter2012; Lv and Sun, Reference Lv and Sun2014) may offer valuable information, these may not capture the complexity of snow under natural conditions. The advantages in the laboratory, however, are the control of exact geometrical measurement conditions and the almost nonexistent part of the diffuse irradiation (Sandmeier and others, Reference Sandmeier, Müller, Hosgood and Andreoli1998). The disadvantages are the possible mechanical and thermal stress that may affect the microstructure of the snow sample during sampling and between the time of the sampling and the measurements, the difference between the lamp and the sun irradiance with respect to remote sensing applications, and the possible fluctuations of the artificial illumination intensity. Available facilities, size of the sampled snow and the characteristics of the sample container often limit the measurement geometries in the laboratory. On the other hand, it is difficult to control all the desired parameters in the field. In particular, the portions of diffuse and direct components of light, which are dependent on cloud cover and atmospheric composition, affect irradiation spectral distribution (Warren, Reference Warren1982) and can change fast.
The measured reflectance values of this study approximate to the conical–conical reflectance factor (CCRF), the measureable quantity of the bidirectional reflectance factor (BRF) (Schaepman-Strub and others, Reference Schaepman-Strub, Schaepman, Painter, Dangel and Martonchik2006). BRF is defined as the ratio of the reflected radiant flux of a distinct surface area to the reflected radiant flux of a perfectly Lambertian surface of the same area in the same view and illumination geometry (Nicodemus and others, Reference Nicodemus, Richmond, Hsia, Ginsberg and Limperis1977). Here, the general term of spectral reflectance is used to refer to CCRF. Field and satellite sensor reflectance measurements are usually mentioned to approximate to BRF if the illumination is composed only of a direct component and the field of view (FOV) is small (Bruegge and others, Reference Bruegge, Martonchik and Stahler2000). Top-of-atmosphere reflectance observed by a satellite can be converted to a bottom-of-atmosphere (BOA) value by using an atmospheric correction which is also a significant source of error in the BOA estimates (Claverie and others, Reference Claverie2018). As such, laboratory results can be compared with reflectance values observed in the field and from a satellite under clear sky conditions. However, the instrument FOV and the angular pattern of the incoming irradiance are always different between the measurements made from a satellite and those executed at ground or in a laboratory (even if atmospheric correction is assumed to be ideal).
3. Material and methods
3.1. Snow sample collection and reference data
All measurements were made in the Arctic Space Centre of the Finnish Meteorological Institute (FMI-ARC), located in Sodankylä, northern Finland (67.368 N, 26.633 E). The measurements were conducted over eight days in the springs of 2013–15 and were executed in a dark laboratory. Snow samples were collected in the immediate vicinity of the laboratory – with one exception in 2014 when samples were collected from a nearby wetland site.
For each snow type, several samples (sampled from the same ~ 5 m × 5 m homogeneous area) were taken and measured. The snow was sampled by cutting an even wall into the snowpack and carefully pushing an aluminium sampler (35 cm × 35 cm) into the snow, placing the sample in an insulated black box after removal. The measurement room had been cooled by air conditioning and cool air flowing from outside while moving the samples, but air temperatures below zero were not achieved. The snow sampler had been painted inside with a black matte color and the sampler depth was 23 cm. The maximum penetration of light into snow occurs around the blue region (Warren, Reference Warren1982). King and Simpson (Reference King and Simpson2001) reported 480 nm irradiance to decrease into ~3% of the original value at the depth of 20.5 cm within homogeneous snow with a typical grain size of 0.2 mm and a density of 0.24 g cm−3. Comparison of several measurement results of liquid equivalent e-folding depths (density scaled penetration depth) for snow presented by King and Simpson (Reference King and Simpson2001) showed a maximum penetration depth of 6.5 cm. As such, we considered the sample to be deep enough to minimize the absorbing effect from the sampler bottom.
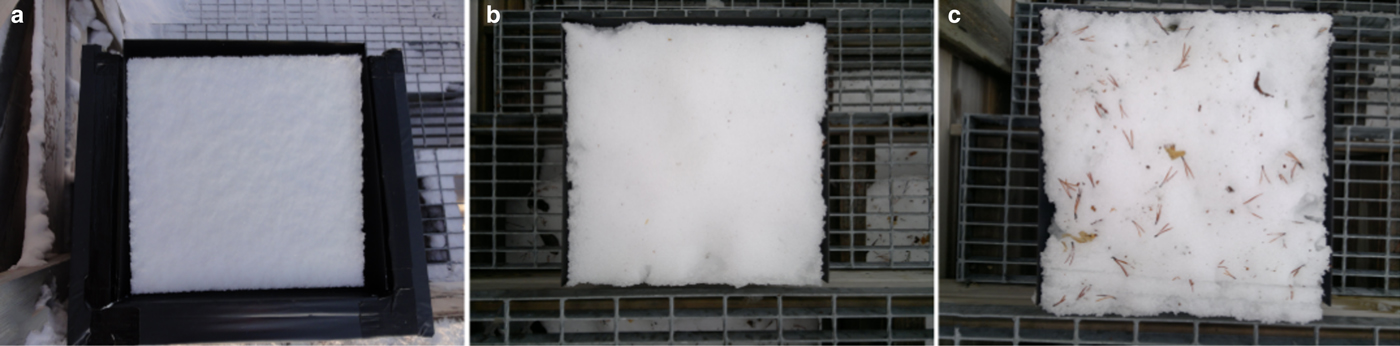
All sampling dates, snow types and the corresponding acronyms are presented in Table 1. During the first measurement day, dry snow from a shadowed area (D_shadow13) and an area exposed to direct sunlight (D_sun13) were sampled. During the second laboratory day, samples from pure wet snow (W_pure13) and wet snow affected by surface litter (W_litter13) were collected. The litter was mainly composed of yellowish needles and seeds fallen from the nearby pine and birch trees, and in part of the cases, of brown-yellow thin fragments of bark and grey lichen. In 2014–15, four dry snow types, D_decomposed14, D_crust14, D_dendrites15 and D_small15, one dry snow type with moist surface snow M_rimed14, and one wet snow type W_pure14 were sampled. The acronyms follow the sampling year and the snow type in general (wet/moist/dry/pure/litter) or is referring to the snow grain type on the sample surface. The snow type was defined wet if the average fraction of liquid water was ≥ 3% (Fierz and others, Reference Fierz2009) and the snow temperature profile was at 0 C° indicating melting. Accordingly, the snow type was considered dry if the fraction of liquid water was <1% and the snow temperature profile was below 0 C°. The temperature profile of M_rimed14 was otherwise below zero but the moist surface layer was affected by the above zero air temperatures. Thus we separated M_rimed14 as moist snow. An example of the snow sample of D_sun13, W_pure13 and W_litter13 is presented in Figure 1.
The sampling dates (YYYYMMDD), the snow types measured and the corresponding snow type acronyms during the laboratory experiments

Air temperature during each sampling date, the average liquid water content and the average density for the sampled snow depth of 23 cm are presented. The typical visual maximum grain diameter (D max) was weighted by the respective layer depth and averaged separately for the whole snow sample depth and for the 10 cm surface layer. The optical equivalent grain diameters (D 0), derived from the averaged SSA-values, are accordingly presented if measurement data were available. SSA measurements in 20130418 are marked with **as the snow wetness might have been in the limit of the measurement capability of the instrument. In the last two columns, the number of snow samples taken from each snow type and the number of spectral acquisitions executed from each snow sample are shown. Snow types are ordered by increasing average D max (23 cm).
Example of (a) a dry snow sample (D_sun13), (b) a wet and pure snow sample (W_pure13) and (c) a wet and littered snow sample (W_litter13).
Snow pit measurements were made at representative sites of each sampling area in order to record the differences between the snow types. Snow layers were visually detected based on hardness, density and grain size differences. Snow grains of each layer were macro-photographed against a one millimetre grid, and the average snow grain size was discretized to every 0.25 mm on the basis of the typical maximum grain diameter (D max). A snow grain type for each layer was defined (Fierz and others, Reference Fierz2009). The specific surface area (SSA) of the snow grains in every 3 cm was measured with IceCube, manufactured by A2 photonic sensors, France (Gallet and others, Reference Gallet, Domine, Zender and Picard2009). The instrument measures hemispherical reflectance of snow at 1310 nm which is related to SSA (e.g. Domine and others, Reference Domine2006). The SSA-value describes the relationship of the snow grain surface area to its volume. An optically equivalent ice sphere diameter of the snow grains (D 0) can be derived from the SSA values by using the theoretical relationship between SSA and the optical grain diameter (e.g. Kokhanovsky and Zege, Reference Kokhanovsky and Zege2004). However, IceCube was not available during all the measurement days and on 18 April 2013 the snowpack was very wet, possibly too wet for laser detection, the measurement principle of the instrument. Thus these results should be interpreted with care. Additionally, temperature (every 10 cm) and density (every 5 cm) profiles were recorded, and Snow Fork (Sihvola and Tiuri, Reference Sihvola and Tiuri1986) measurements, offering density and liquid water content information, were made every 10 cm. Every snow sample of W_litter13 was photographed for later analysis of the surface organic matter contents.
3.2. Laboratory setup
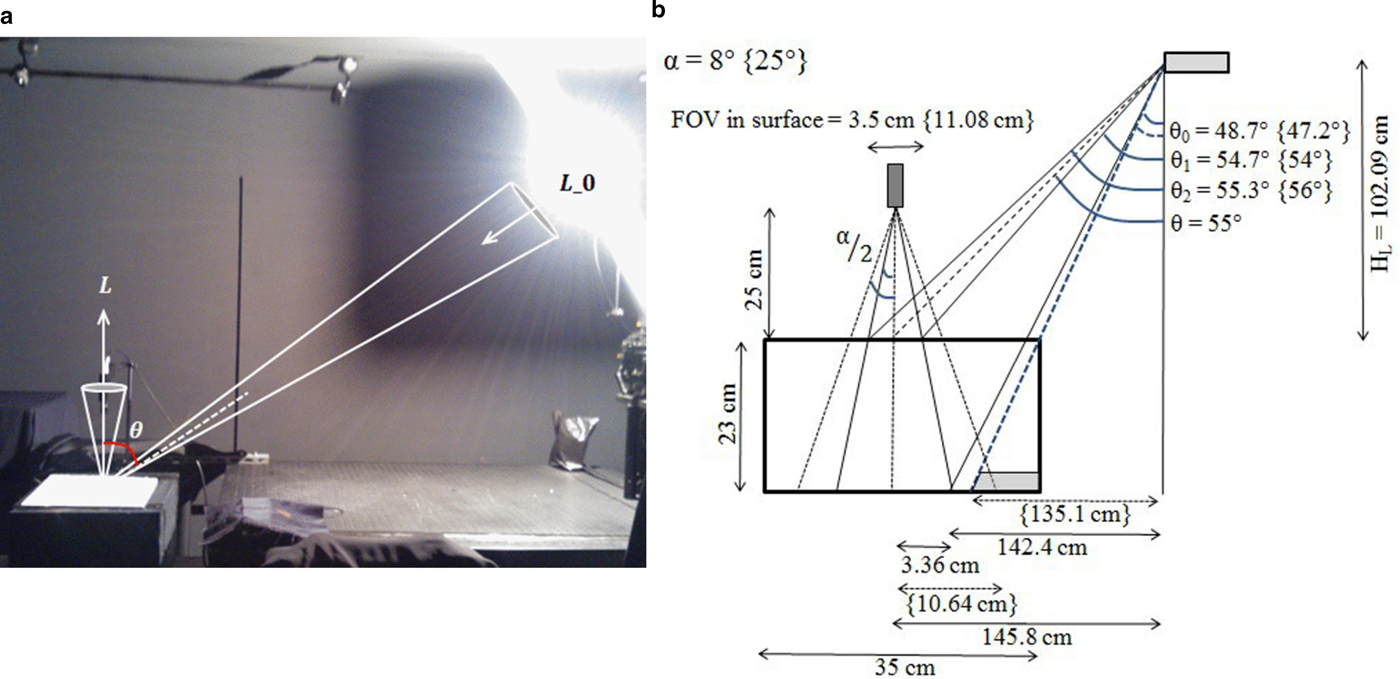
The collected snow samples were measured with an ASD Field Spec Pro JR Spectroradiometer (ASD Inc., Boulder, Co, USA). The instrument measures spectral radiance between 350–2500 nm with one silicon photodiode array (350–1050 nm), and two indium gallium arsenide photo-diode detectors (900–1850 nm and 1700–2500 nm). The measurement head was set at nadir at a height of 25 cm from the snow sample surface (Fig. 2). In 2013 a bare fiber optic with FOV of 25° was used. In 2014–15 a foreoptic with FOV of eight degrees was used. These corresponded to footprint sizes (support) of 3.5 cm and 11.08 cm for 8° and 25° FOV, respectively. The small footprint reduced the effects of nonparallelism of the light source (Sandmeier and others, Reference Sandmeier, Müller, Hosgood and Andreoli1998), which was a 1000 W Tungsten halogen lamp, calibrated to 250–2500 nm. During measurements, the lamp current was controlled and kept at 8 (± 0.0008) A.
A photo and a schematic of the laboratory measurement setup. (a) The measured reflectance values were defined to approximate to the CCRF, the measurable quantity of the BRF (Schaepman-Strub and others, Reference Schaepman-Strub, Schaepman, Painter, Dangel and Martonchik2006) and analogously to Salminen and others (Reference Salminen, Pulliainen, Metsämäki, Kontu and Suokanerva2009). The light zenith angle during the measurement is denoted by θ. In (b) the geometric details of the measurements are shown including the effect of the non-collimated light source on the actual incident zenith angles/irradiance levels. The transparent grey box in the sample bottom illustrates the area (not in scale) shaded by the sample holder edge when the 25° FOV was used. The angle θ 0 for 25° FOV is represented with a dashed line.
One light zenith angle (θ = 55°) was used resembling the typical sun zenith angle at high latitudes during late spring. To solve the spectral reflectance, a calibrated white reference panel (Spectralon) representing a nearly Lambertian reflector was measured at the beginning and at the end of each measurement session. From each snow sample, 10–30 spectra were measured at one second intervals (Table 1). The number of individual spectral acquisitions was decreased from 30 and 20 to 10 when snow types representing new or nearly new snow were to be measured as these snow types are subject to fast metamorphism.
3.3. Spectral data post-processing
In post-processing the (30/20/10) spectra of each snow sample were averaged. The average absolute reflectance R(λ, θ) of the snow was determined at each wavelength:

where R Cal(λ) is the spectral calibration coefficient of the white reference panel provided by the manufacturer, L(λ, θ) is the averaged radiance (W m−2 sr−1 nm−1) of snow at the wavelength λ and at the light zenith angle θ and L 0(λ, θ) is the measured average radiance of the reference panel. An average and Std dev. of spectral reflectance for each snow type were determined based on spectral data of the snow samples, i.e. Std dev. indicates the deviation between different snow samples of each investigated snow type.
To assess the implications of different snow types and various band configurations for SCA estimation, spectrometer-derived spectral reflectances were resampled to correspond to relevant instrument channels specified in Table 2. For each snow sample measurement, a weighted average based on the wavelength dependent relative spectral response functions (SRF) made available by the data providers was calculated. The snow samples were grouped as dry snow (all dry snow types), moist snow (M_rimed14), wet snow (W_pure13 and W_pure14), or wet and littered snow (W_litter13) and an average and Std dev. (deviation between different samples of the same snow type) of the observed reflectance at each band was determined. To investigate the sensitivity of band reflectance on varying snow microstructures, separate resampling of all the measured snow types to correspond to bands of one sensor, MODIS, was implemented, and the respective NDSI indices calculated. MODIS is currently one of the most widely used instruments for SCA mapping. The amount of the organic material for W_litter13 was determined from digital images by comparing the number of pixels consisting of organic litter vis-à-vis to pixels consisting of pure snow within the FOV of the instrument.
Mean and Std dev. of different satellite instrument band specific reflectance values derived from the laboratory measurements

The wavelength range and bandwidth for each band are indicated. For MODIS, relative changes (%) between reflectance of M_snow, W_snow and W_litter in relation to D_snow are shown. The bands are organized with equivalent bands one below another to facilitate the comparison. In the lowermost row, the NDSI indices utilizing the MODIS bands are given.
*Sentinel-3 SLSTR has ~ the same channel.
Finally, average and Std dev. of MODIS band specific reflectances for wet and dry snow types were compared with those obtained by field spectroscopy and provided by Salminen and others (Reference Salminen, Pulliainen, Metsämäki, Kontu and Suokanerva2009). Reflectance characterization of the SCAmod method currently relies on this field dataset. The field measurements have been collected in the surroundings of FMI-ARC in 2007–08 with a similar ASD Field Spec instrument as used in this study and the average and Std dev. of reflectance for wet and dry snow represent conditions described in Table 3. Snow was categorized as wet or dry based on snow temperature measurements and the so-called snowball test. If the snowpack surface was moist the snow type was categorized as wet.
Details of the field dataset used for the characterization of snow reflectance in the SCAmod method (Salminen and others, Reference Salminen, Pulliainen, Metsämäki, Kontu and Suokanerva2009)

3.4. Geometric limitations and sources of error and uncertainty
With a noncollimated light source, the irradiance reaching different points of the snow sample had a gradient. Figure 2b shows how the light zenith angles corresponding to the irradiance reaching the nearest (θ 1) and furthest (θ 2) points of the nominal FOV on the sample surface, as well as the angle corresponding to the irradiance reaching the FOV edge in the snow sample bottom (θ 0) are deviated from θ = 55°, determined for the middle point below the measurement head. The responsivity of the ASD optic fibers is not uniform within the FOV meaning that radiance at different wavelengths may have been measured from different locations (Mac Arthur and others, Reference Mac Arthur, MacLellan and Malthus2012). Combined with the noncollimated light source this constructional characteristic of the instrument may affect the comparability of the results of different wavelengths. With eight degree FOV the nominal support was small (3.5 cm) and the difference in the light zenith angle θ 2–θ 1 within the nominal FOV on the sample surface was 0.6° at the highest, whereas the light zenith angle at the bottom of the sample (θ 0) deviated 6.3° from the nominal zenith angle (θ). Mac Arthur and others (Reference Mac Arthur, MacLellan and Malthus2012) found the responsivity of different detectors in ASD to both overlap more and better fill the nominal FOV when smaller support was used. The corresponding backscattering angles reaching the instrument within the FOV varied between 51.3–58.7° and 41.5–43.5° for 8° and 25° FOV, respectively (when direct backscatter is noted by 0°).
Due to the low illumination angle, the possible blockage of irradiance by the snow sampler leading edge was investigated. With eight degree FOV there was no shading of irradiance. In 2013, a 25° FOV was used, potentially increasing the sources of error described above. For these measurements, the deviation in light zenith angles within the instrument FOV is shown in parenthesis in Figure 2b. The light zenith angle at the bottom of the sample (θ 0) deviated 7.8° from the nominal zenith angle, whereas the maximum difference in the light zenith angle within the surface support was 2°. With 25° FOV, the sample holder edge blocked some of the incoming irradiances. However, this mostly affected the response from the sample bottom closer to the light source where the path length of the incoming irradiance within snow is long, leading to an attenuation of the irradiance close to zero. Many studies suggest that most of the responses of snow reflectance are coming from the ~10 cm surface depth (Wiscombe and Warren, Reference Wiscombe and Warren1980; King and Simpson, Reference King and Simpson2001; Zhou and others, Reference Zhou, Li and Stamnes2003). With the larger FOV the measurement error and uncertainty were increased due to the combination of a noncollimated light source and the biased responsivity of the spectroradiometer. To extend the available dataset, these measurements were retained in the analysis but are marked with an asterisk in the following sections.
Other possible sources of error and uncertainty in the laboratory included anisotropic characteristics of the reference panel and the possible stray light generated by any reflecting surfaces. The accuracy of light zenith angle adjustment was not determined during the experiments. For example, an error of + /− 1 cm in the lamp height would introduce a deviation of + /− 0.26° from the desired zenith angle of 55°.
The consequent radiance acquisitions (10–30) of each snow sample and reference panel allowed the estimation of the integrated precision of the measurements. This was defined by:

where S is the precision, and L s1 and L s2 are the standard deviations of either the spectralon (n = 2–4) or snow (n = 10–30) radiance acquisitions at wavelength λ for the individual reference panel and snow samples 1 – N, respectively. Excluding the areas of the low signal-to-noise ratio (SNR) in the beginning and in the end of the spectrum (<400 nm, >2200 nm) and around the detector edges (1000 nm and 1800 nm) the precision error for snow radiance was between ~8.0 × 10⁻⁷–1.0 × 10⁻⁵ W m−2 sr−1 nm−1 and for reference panel radiance between ~2.0 × 10⁻⁶–8.0 × 10⁻⁶ W m−2 sr−1 nm−1. Any fluctuation in the stability of the instrument or measurement conditions will be integrated into the observed reflectance values. Defining S from the standard deviations of individual snow sample reflectances, defined against the daily averages of 2–4 reference measurements, showed that S varied between 0.0003–0.002 for most of the wavelengths (excluding the areas of low SNR). For the second shortwave infrared (SWIR) detector (1700–2500 nm) S was lower, varying between 0.003–0.004. For snow with a reflectance value of 0.93 these would show a difference of 0.03–0.21% for the first two detectors and 0.32–0.43% for the second SWIR detector.
Separated from the statistical deviations described above are the instrumental uncertainties. The ASD Field Spec utilized in the measurements has undergone absolute radiance and wavelength calibration at the manufacturer on a regular basis. Dark current is a property of the detector, the amount of electronic current due to thermal electrons added to that induced by the incoming photons. Twenty-five dark current measurements were taken, averaged and automatically subtracted from each measured target or reference panel spectrum. The SNR was increased by spectrum averaging. The noise is more apparent where the measured signal strength is low as it was in the range of the second SWIR detector showing the lower precision values above.
Snow always experiences some mechanical and thermodynamic stress when separated from the natural snowpack; slight changes e.g. in snow surface grains may have evolved during the laboratory measurements especially due to the change in ambient temperature. However, this effect was kept small by minimizing the time between snow sample extraction and the spectroradiometer measurements. The measured snow types also represent only part of the snow types occurring in nature; notably, very small and very large surface snow grain sizes (e.g. surface hoar) are not present in the dataset. However, the measured snow types and grain sizes represent well the most typical situations in the boreal environment of FMI-ARC as seen from the grain size observations of winters 2011–12 and 2012–13 (Leppänen and others, Reference Leppänen, Kontu, Vehviläinen, Lemmetyinen and Pulliainen2015).
4. Results
Table 1 and Figure 3 summarize the quantitative in situ data available from the measured snow types. Averaged variables describing the snow microstructure for the sampled surface snow (23 cm), determined by the snow pit work at the time of the measurements, are presented in Table 1. The visually estimated typical maximum grain diameters (D max) were weighted by the respective layer depths and the averaged value for the whole snow sample and the surface snow depth of 10 cm were calculated separately. Accordingly, the optical equivalent grain diameter (D 0) is provided if SSA information for the snow type was available. Figure 3 shows the variation of D 0 within the snow samples and the layered snowpack structures with different grain types and sizes. Grain types identified in the snow pit work are presented in Table 4.
The snow layers detected in the different snow types based on density, grain size and hardness differences within the snow sample height (23 cm). The snow depth values refer to the actual snow depths of the total snowpack (zero being the ground). For each layer, the snow grain type (Table 4) and the typical grain diameter D max visually estimated to the closest 0.25 mm are presented. Variation of optical equivalent grain diameter (D 0) derived from SSA measurements is identified by the blue line when available. ** is marked for W_litter13 and W_pure13 as the snow wetness may have been in the limit of the SSA instrument measurement capability. Snow types are ordered by increasing D max averaged for the whole snow sample depth (23 cm) (Table 1). Snow types measured with 25 FOV are indicated with *.

Classified grain types defined by the snow pit work

According to the snow pit observations, dry snow and wet snow types were characterized by wetness, grain size and density differences, the latter having larger (≥1 mm) typical average grain size and higher average density (Table 1). Figure 3 illustrates how the natural snowpack in a boreal environment is both structurally complicated and highly variable in time.
The averaged spectral reflectance (%) for all the measured snow types is presented in Figure 4. The reflectance of dry snow types was close to one in the VIS region. Only D_crust14 deviated from this behavior with slightly lower reflectance in the VIS. More differences between the dry snow types were seen in the NIR region, which is sensitive to the snow grain size and shape. M_rimed14 showed lower reflectance at these longer wavelengths due to moist surface snow. For wet snow types, a distinct drop in reflectance occurred in the NIR region. Surface organic matter in W_litter13 introduced a larger deviation in the observed reflectance values. The amount of organic litter in the snow sample surface within the nominal FOV varied between 0.22–9% two samples being practically free from the litter within this area. The overall Std dev. of reflectance among the different snow types varied between 0.001–0.125 being mostly higher than the precision error of the measurements defined in chapter 3.4.
Average spectral reflectance for different snow types measured with θ = 55°. Shadowed belts show + /− Std dev. determined from snow sample-wise averaged reflectance. Snow types are ordered by increasing (left to right, top to bottom) D max averaged for the whole snow sample depth (23 cm) (Table 1). Snow types measured with 25° FOV are indicated with *.

All the largest differences in the instrument-wise band specific reflectance values within all four snow types (grouped as dry/moist/wet/littered) were detected in NIR bands (Table 2). The maximum difference was 0.05 detected for M_snow and W_litter between TM and AVHRR. In the VIS bands, the reflectance values for different band configurations were almost identical with a maximum difference of 0.01. Using MODIS as an example, in the VIS bands, the reflectance of pure and wet snow decreased by ~10% compared to dry snow whereas the decrease for wet and littered snow was almost 20% (the relative decrease in reflectance (%) for different snow types marked in Table 2). In the NIR bands, the wetness and the consequent grain size growth alone decreased the reflectance by ~18% compared to dry snow and further decrease by ~7% were detected due to addition of impurities. The effects of litter and the snow wetness were partially mixed because W_litter13 represented the wettest snow type measured. The largest decrease due to snow wetness and the organic litter was observed in MODIS 6 (1628–1652 nm) and equivalent bands, where D_snow reflectance was already low but dropped to near zero for the other snow types.
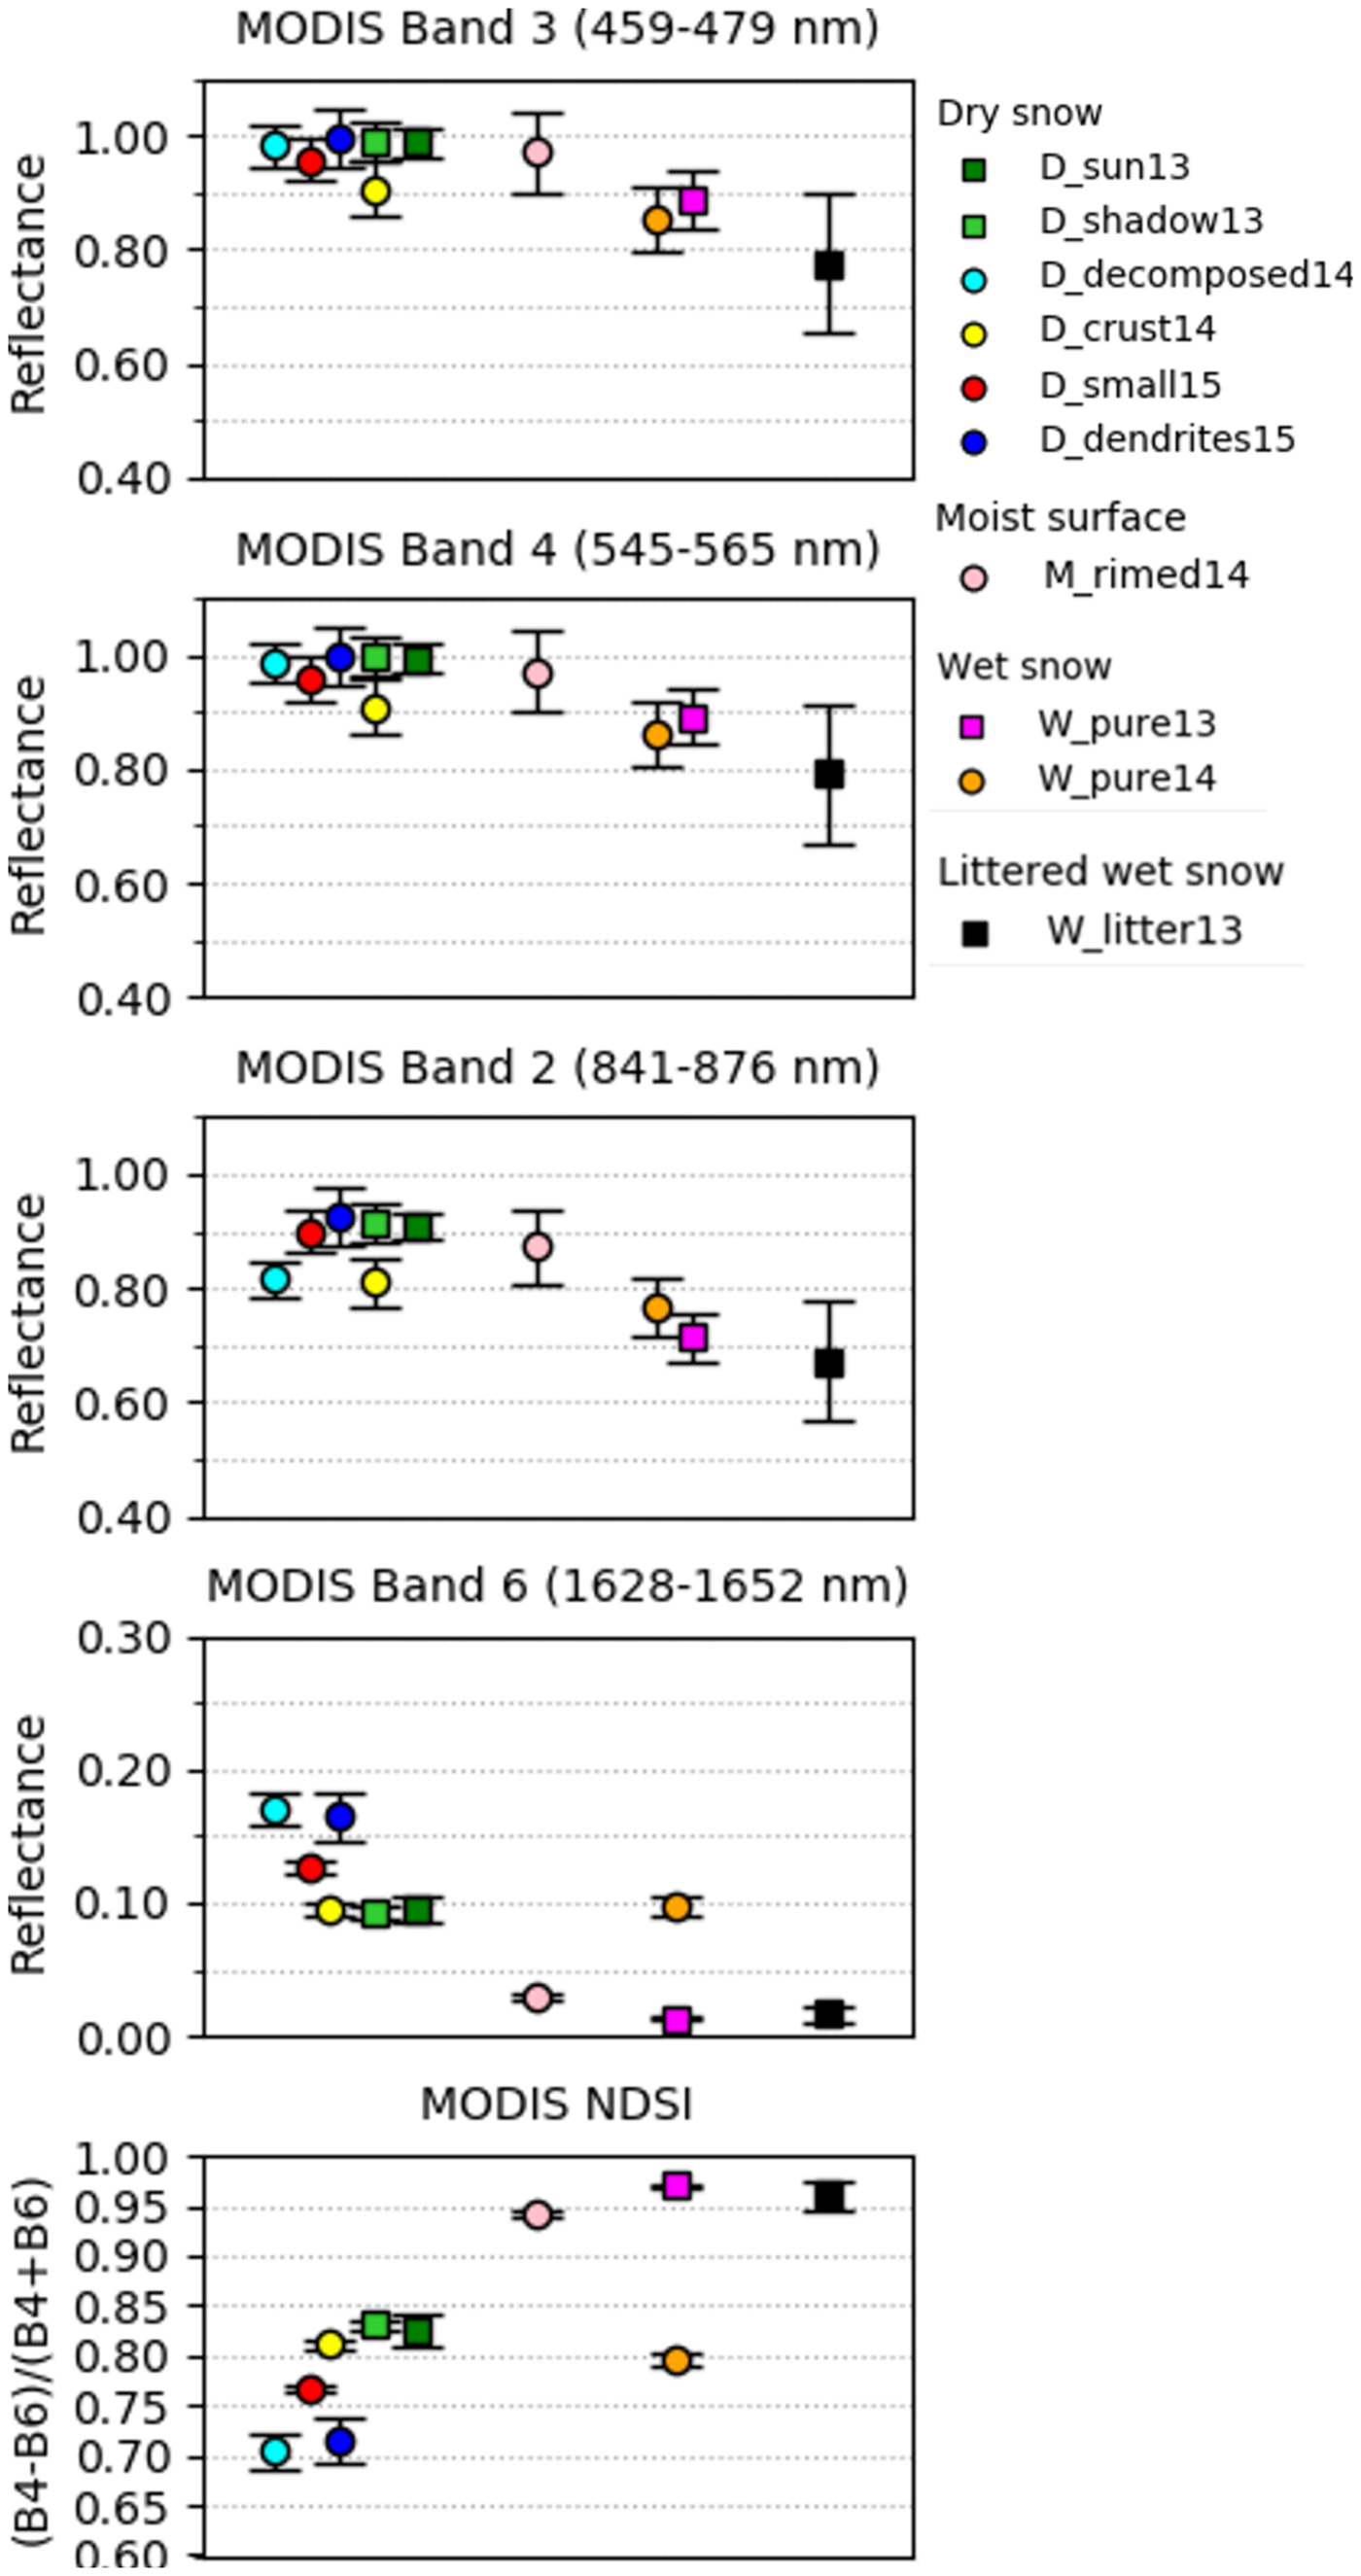
Figure 5 illustrates the MODIS band specific reflectance values and NDSI separately for all ten snow types measured. All snow types showed slightly different band reflectance values. The band specific reflectance or NDSI of wet and littered snow was not unambiguously lower than those of other wet snow types. The NDSI indices for different snow types varied between 0.71–0.97. Finally, in Table 5, the MODIS band specific reflectance values for dry and wet snow types are presented along with those obtained from the field dataset currently utilized in the snow parameterization of the SCAmod method. The values for dry snow are close to each other but differences are more evident for wet snow; for wet snow the laboratory measurements showed lower values by 0.08 and 0.06 for MODIS 3 and MODIS 4, respectively.
MODIS band specific reflectance values and NDSI for all the different snow types resampled from the laboratory measurements. The whiskers show + /− Std dev.. Measurements conducted with 25° FOV are shown by rectangle shapes.
Field measurement results for MODIS band specific reflectance by Salminen and others (Reference Salminen, Pulliainen, Metsämäki, Kontu and Suokanerva2009) in direct illumination

The corresponding values from laboratory experiments are shown in italics.
5. Discussion
5.1. Spectral reflectance of different snow types
Two distinct groups can be separated based on the averaged spectral reflectance curves presented in Figure 6; dry snow showing high reflectance all over the spectrum and wet snow showing lower reflectance all over the spectrum. Within both groups some differences between the individual snow types could be recognized and in the SWIR range the reflectance of these two groups is partially overlapping. From the deviation in snow reflectance for different snow types in Figure 4 follows that in some occasions wet snow may show higher reflectance than dry snow and vice versa. The total variation in snow reflectance is defined by the maximum and minimum values measured for dry snow and wet snow types, respectively. M_rimed14 with moist surface snow as well as D_crust14 were located in between of these two clear groups. In the following, the factors affecting the different spectral reflectance behavior of the snow types are discussed.
(a) Average spectral reflectance of all the snow types measured. The wavelength used for SSA measurements is indicated with a dotted line. Snow types measured with 25° FOV are indicated with *. In (b) the average, minimum and maximum for two explicit snow type groups, wet and dry snow, defined by their spectral behavior are presented.
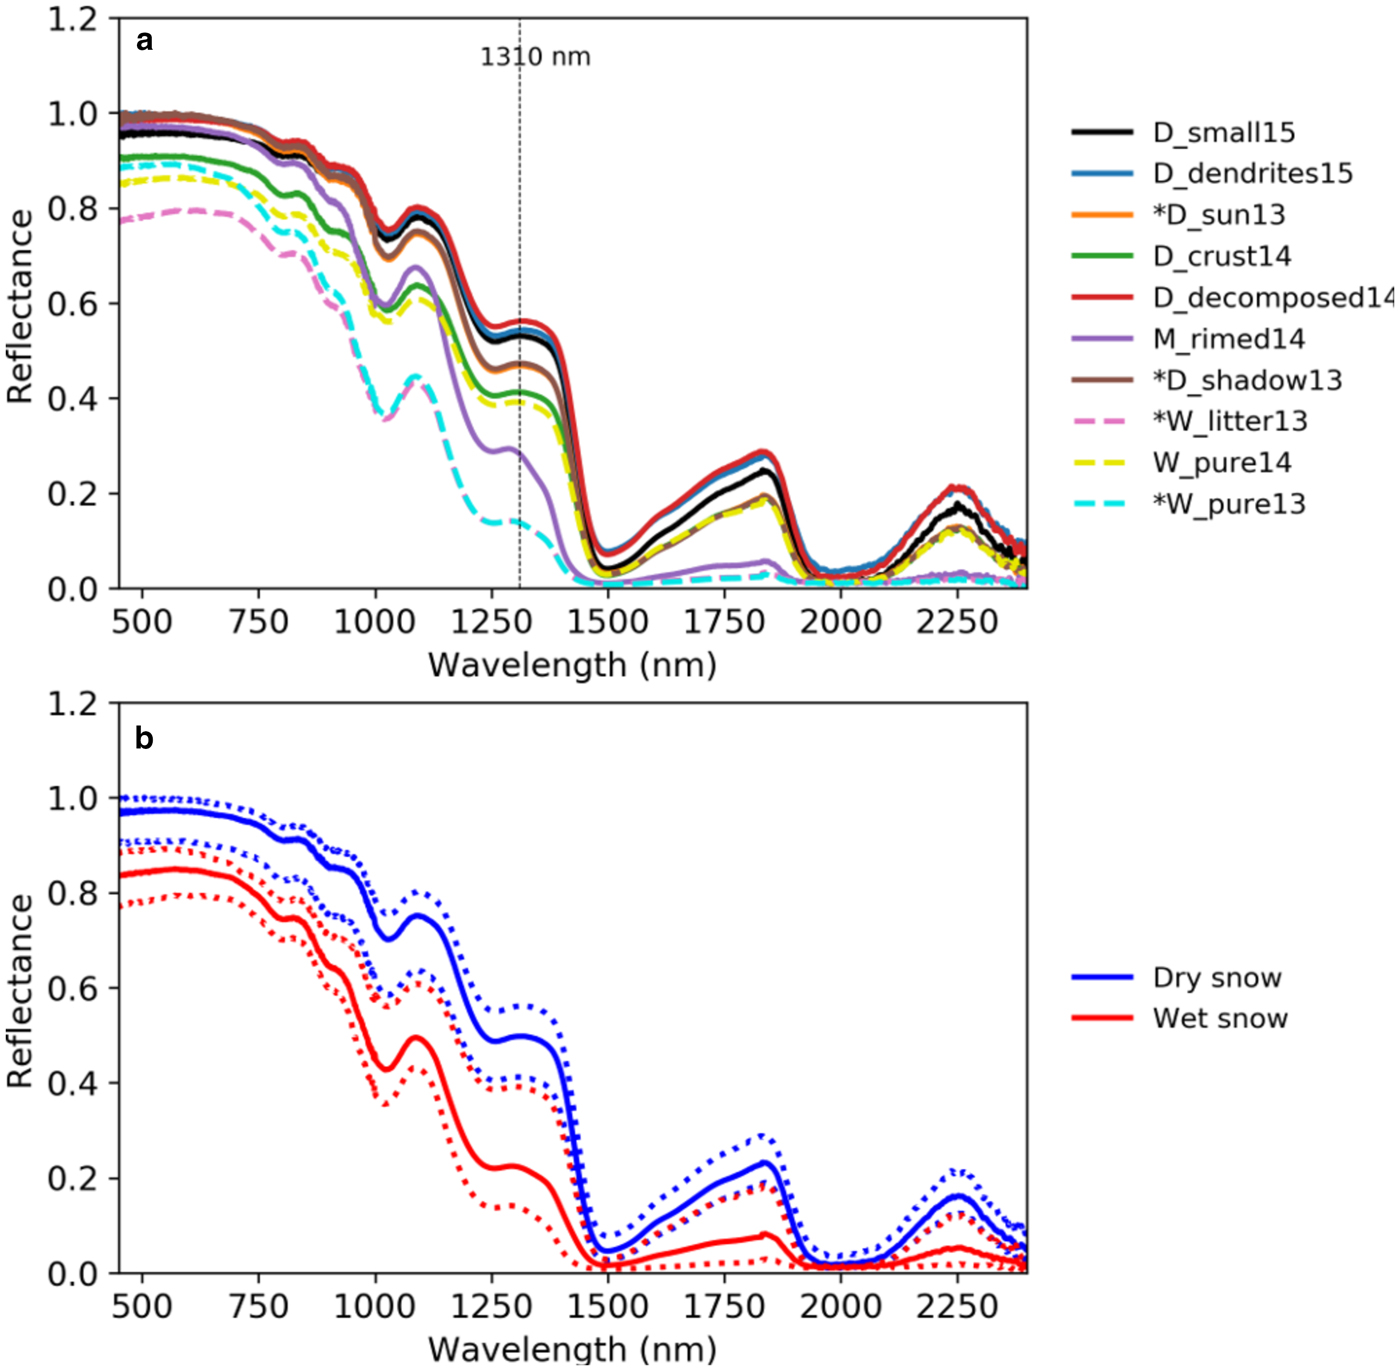
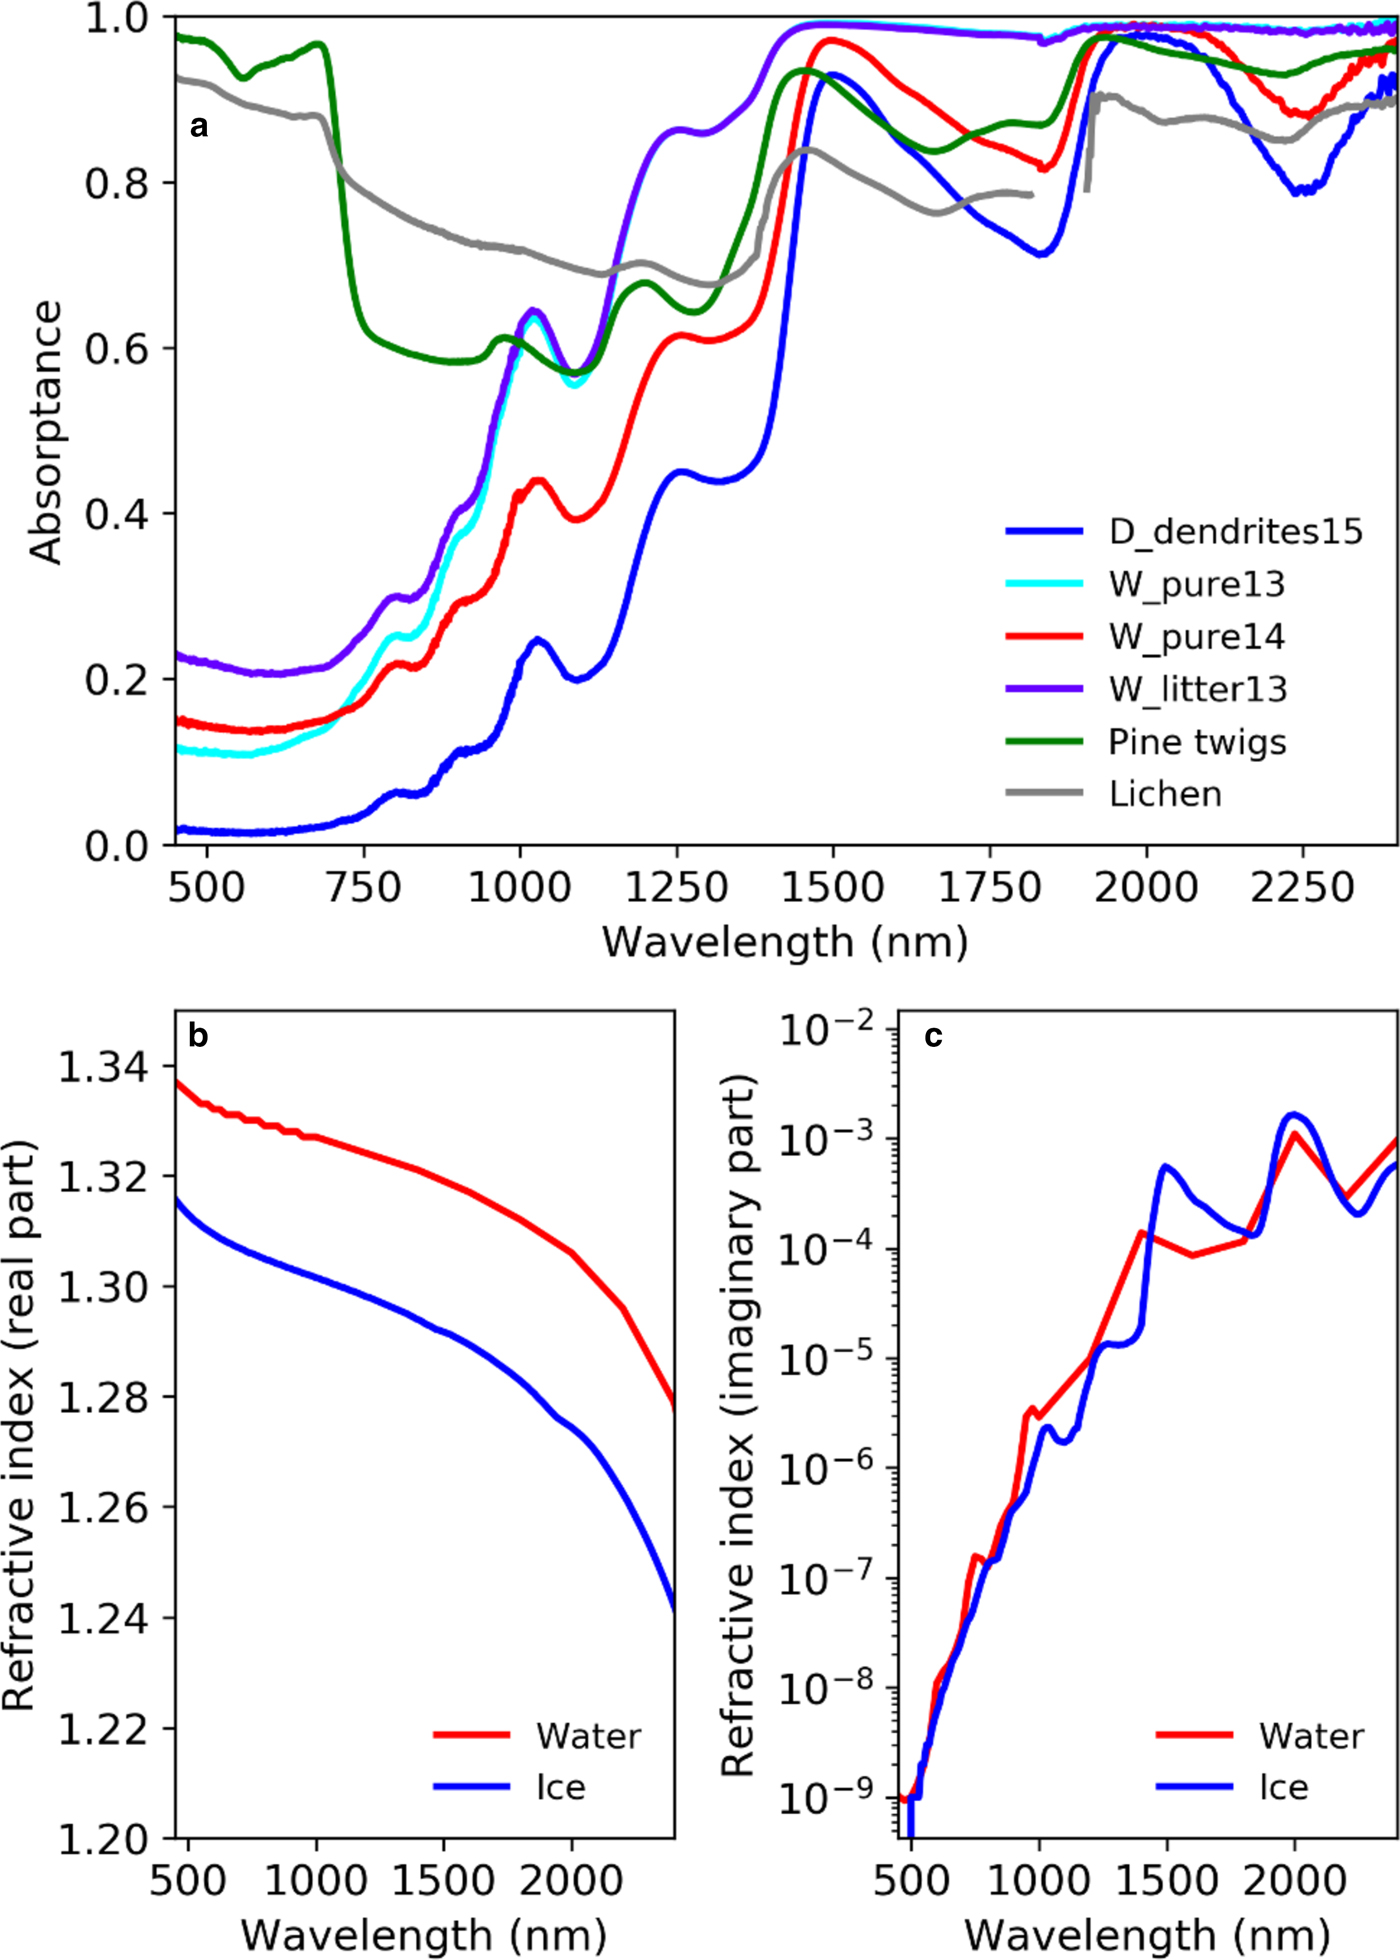
Among the wet snow types, the reflectance of W_pure13 was higher than the reflectance of W_pure14 in the VIS but in the NIR region the difference between the two reversed. The amount of liquid water (Table 1) as well as the visual (D max) and optical equivalent (D 0) grain sizes showed higher values for W_pure13 explaining the reflectance difference. The general consensus is that in wet snow the VNIR (visible-near infrared) spectral surface albedo decreases, not specifically because of the liquid water content, but because of the increase in effective grain size. Liquid water and ice have very similar refractive indices and thus water replacing air between snow grains increases the effective grain size and decreases the surface albedo. In addition, liquid water accelerates the metamorphic grain growth (Wiscombe and Warren, Reference Wiscombe and Warren1980) and promotes the formation of snow grain clusters. This accordingly explains the drop in reflectance for M_rimed14 in the NIR range. Although the difference in the real part of the refractive indices for ice (Warren and Brandt, Reference Warren and Brandt2008) and water (Hale and Querry, Reference Hale and Querry1973) is not significant in VNIR and the spectral variation is small (Fig. 7b) the fact that the imaginary part (i.e. the absorption) varies by seven orders of magnitude (Fig. 7c) and that the indices are slightly shifted in wavelength allow, for example, the detection of liquid water content in the snow surface and the identification of the thermodynamic phase of clouds at 1600 nm (Green and others, Reference Green, Painter, Roberts and Dozier2006; Painter and others, Reference Painter2009; Warren, Reference Warren2019).
(a) An example of the absorptance spectra (1 – reflectance) for pine twigs and lichen as well as for D_dendrites15 and the different wet snow types. The wavelengths at the water absorption band ~1900 nm were removed for lichen spectra due to the low SNR. In (b) real part and in (c) imaginary part of the refractive index for ice and water are presented.
The wet and littered snow showed expectedly the lowest reflectance in the VIS range, otherwise resembling the reflectance curve of W_pure13 measured during the same day. The impurities in snow have most effect at the VIS wavelengths where ice is weakly absorptive (Warren, Reference Warren1982). However, since the amount of liquid water content was highest for W_litter13 (Table 1) the effects of wetness and litter inclusions were mixed. In Figure 7a the absorption spectra (1 – reflectance) for pine twigs (Niemi and others, Reference Niemi2012) and lichen (spectrometer measurements of snow and bare ground targets and simultaneous measurements of snow conditions/SYKE; FMI) along with spectra for different wet and dry snow types are shown to demonstrate that in the VIS the absorption of the vegetation fragments significantly differs from those of snow. It is expected that the spectral signature of degraded pine needles differs from that of green pine twigs. However, Melloh and others (Reference Melloh, Hardy, Davis and Robinson2001) and Huete (Reference Huete, Artiola, Pepper and Brusseau2004) have shown that the absorption remains high until the red edge (680–750 nm) also for bark and nonphotosynthetic litter. Another observation made for W_litter13 was how the organic inclusions had sunk through the snow surface. Peltoniemi and others (Reference Peltoniemi2015) deposited high concentrations of soot, silt and volcanic ash on natural snow and noticed that because of the sinking of impurities, the measured BRF darkened at nadir but snow appeared brighter when observed from larger view angles. They continued that an assumption of homogeneous distribution of impurities in models may under- or overestimate the effect of impurities on snow surface albedo. It must be noted that this relationship is dependent on melting conditions, impurity characteristics, view-illumination geometry and whether sufficiently large amounts of organic litter over a large area would exist to have an effect on surface albedo estimates from remote sensing data.
Among the dry snow types, the highest spectral reflectance all over the spectrum was found for D_denrites15 and D_decomposed14 representing new snow. The optical diameter for both, small snow grains and dendrites is small introducing high spectral reflectance. The reflectance of D_sun13 and D_shadow13 dropped after 1000 nm which is in accordance with the larger observed average D 0. D_crust14 showed differing (lower) reflectance behavior from the other dry snow types. A reason may lie in the stratigraphy/microstructure of the snow type; a 0.5 cm thick surface layer of precipitation particles overlie a 2 cm thick melt-freeze crust, followed by a 2 cm of rounded snow grains and another melt-freeze crust. The precipitated snow at the surface probably increased the overall reflectance of this snow type, whereas melt-freeze crusts lowered the amount of scattering. For example, Legagneux and others (Reference Legagneux, Cabanes and Dominé2002) measured SSA values for melt-freeze layers which resembled those of rounded grains; before freezing the snow grains have grown and rounded. The reflectance curve of D_crust14 resembled the curve of W_pure14 despite the rather different stratigraphy observed in the snow pit measurements (Fig. 3).
It is challenging to separate the contribution of snow microstructure on snow spectral reflectance more precisely, as even the critical depth of snow which the measured reflectance is representing may vary between different snow types. The penetration of light in snow is dependent on scattering and absorption mechanisms within the medium (Warren, Reference Warren1982). These mechanisms vary along wavelength and are affected by impurities, density and snow grain size and grain shape variations. According to Zhou and others (Reference Zhou, Li and Stamnes2003) and Wiscombe and Warren (Reference Wiscombe and Warren1980), in the VIS range, the 5–20 cm surface snow is the most important for optical remote sensing. Furthermore, Warren (Reference Warren1982) has noted that for the vertical grain size changes to have an effect on snow spectral surface albedo the grain size change must be abrupt and clear, which is the case, for example, when a thin layer of newly precipitated snow overlies a deep layer of old snow. In our experiments, a rather thin layer of precipitated surface snow seemed to dominate over the deep underlying layer of more metamorphosed snow (e.g. 1 cm in D_decomposed14).
Especially in the NIR range, also the grain shape affects the spectral reflectance (Xie and others, Reference Xie, Yang, Gao, Kattawar and Mishchenko2006). In their numerical study, Picard and others (Reference Picard, Arnaud, Domine and Fily2009) showed that spheres reflected 20–30% less than other grain shapes for the same SSA. Snowpacks with very similar average snow grain sizes but differing snow stratifications (varying snow layers and grain sizes) can yield very different spectral surface albedos (Zhou and others, Reference Zhou, Li and Stamnes2003). For broadband surface albedo, taking into account the vertical variation in snow grain size produces satisfactory results as this averaged quantity is not very sensitive to details of the angular distribution of scattering. Directional quantities including spectral reflectance (here approximating BRF) are more sensitive to the effects of the snow grain shape which affects the scattering phase function (Jin and others, Reference Jin, Charlock, Yang, Xiw and Miller2008). Snow reflectance anisotropy has been observed to increase along increasing wavelength, grain size and solar zenith angle and depends on the grain shape as well (Carroll and Fitch, Reference Carroll and Fitch1981; Warren, Reference Warren1982; Steffen, Reference Steffen1987). Although these laboratory experiments measured at nadir do not offer information on the reflectance angular distribution, it is noted that differing scattering phase functions for different snow grain shapes may explain some of the differences observed in the reflectance behavior of the snow types measured. For example, comparisons by Xie and others (Reference Xie, Yang, Gao, Kattawar and Mishchenko2006) of five different ice crystal habits showed that BRF for all shapes decreased along with increasing effective grain size in the NIR region but at different rates; BRF for aggregates decreased slowest whereas the reflectance of plates showed the highest variations.
The importance of snow density on snow reflectance is emphasized by its effect on the optical depth. Light penetrates deeper into snow with low density and/or large snow grain size than snow with high density and/or small snow grain size; the vertical variation in snow density affects the critical snow depth the measured reflectance is representing (Zhou and others, Reference Zhou, Li and Stamnes2003). Low density offers more air/ice interfaces for light scattering and increases the path length of a photon at wavelengths where scattering is dominant. On the other hand, longer path length enhances the probability for a photon to become absorbed. The measured reflectance per wavelength is thus defined by a complex relationship of the ability of each snow layer to absorb, scatter and penetrate the light into snow (King and Simpson, Reference King and Simpson2001).
5.2. Band specific reflectance of different satellite sensors
Despite the various band configurations of the different satellite sensors they produced almost equal results in the VIS range. However, more dispersion was observed in the NIR and SWIR range, refer to Table 2. For example, the relative maximum difference in reflectance in NIR bands was 2.2, 5.6, 5.4 and 7.4% for D_snow, M_snow, W_snow and W_litter, respectively. In the SWIR range the band specific reflectance of TM and AVHRR for D_snow differed 26.7%. An increase of differences from the visible towards the longer wavelengths is in accordance with the fact that the reflectance is more sensitive to snow characteristics, such as grain size and liquid water content on the NIR and SWIR regions.
The largest deviations from the average values seem to be produced by the widest bands such as AVHRR band 2 (275 nm) or TM band 5 (200 nm) whereas the maximum differences between the narrower bands was 0.01. In addition to different band configurations, the varying spectral response functions affect the reflectance values. Trishchenko and others (Reference Trishchenko, Cihlar and Li2002) found that for similar surface spectral reflectance and atmospheric conditions, for example, MODIS 1 and 2 showed a difference of up to 30–40% in reflectance and NDVI relative to AVHRR due to different satellite sensor SRFs. The information that there is not necessarily any particular change in snow reflectance for close-by bands is relevant for the use of different historic or present satellite sensors (e.g. AVHRR, Sentinel-2 and −3) for the mapping of snow cover, especially concerning the production of long climate data records with multiple instruments.
The best bands to detect the difference between dry and wet snow proved to be the bands located in the NIR range where the most pronounced decrease in reflectance was seen due to snow wetness and the consequent snow grain size growth. The changes in the SWIR bands produced high relative differences due to low reflectance values. Higher NDSI indices for moist and wet snow types than for dry snow were obtained (Table 2, last row) being in accordance with findings of Negi and others (Reference Negi, Singh, Kulkarni and Semwal2010) and Niemi and others (Reference Niemi2012), who observed that NDSI increased along snow aging and increasing snow moisture content.
Since SSA has been observed to be linked to SWIR reflectance (Picard and others, Reference Picard, Arnaud, Domine and Fily2009) it has been suggested if the SWIR wavelengths (e.g. MODIS 6) observed from space could offer a method to follow the evolution of snow microphysical characteristics (Domine and others, Reference Domine2006). For example, Salzano and others (Reference Salzano, Lanconelli, Salvatori, Esposito and Vitale2016) kept the reaction of SWIR reflectance on precipitation events, and as such, on snow type changes, in their experimental data from Ny-Ålesund, Svalbard, as a promising observation. In these laboratory experiments, the difference between newly precipitated snow (e.g. D_dendrites15) and wet snow (e.g. W_pure13) was clear, but for example, dry snow D_sun13 and wet snow W_pure14 introduced quite similar results to each other (Fig. 5). In MODIS 2 the Std dev. e.g. between W_pure14, D_crust14 and D_decomposed14 was overlapping; the wet snow reflectance was not always lower than the reflectance of dry snow, nor was reflectance of wet littered snow always lower than that of pure wet snow. The latter was affected by the high variability in the amount of litter inclusions. However, it is noted that for the averaged values, obtained for the snow types grouped either as dry or wet, the difference between the band reflectance values was clear. As indicated by Table 2, the discussion about the MODIS band reflectance values of different snow types is also valid for other sensors.
5.3. Improvement of snow reflectance parameterization for snow mapping algorithms
The field spectroscopy-based MODIS band specific reflectance values were close to those retrieved from the laboratory experiments (Table 5). The differences were more evident for wet snow. The effect of the illumination angle on the observed reflectance values is widely recognized and usually taken into account when in situ data of snow reflectance are used as a model input parameter or as validation/calibration data for the model output in SCA mapping (e.g. Painter and others, Reference Painter2009). However, the SCAmod method characterizes dry and wet snow (end-member) reflectance simply as a static average and Std dev. of the observations collected under various snow and illumination conditions. The inaccuracy in the pre-determined reflectance values propagates in the uncertainty of snow cover maps. The wet snow reflectance obtained from the field data for MODIS 3 and 4 was comparatively high, taking into account that the measurements observed with higher light zenith angles should lower the mean value (e.g. Painter and others, Reference Painter and Dozier2004). The results suggest that the field spectroscopy-based values (Salminen and others, Reference Salminen, Pulliainen, Metsämäki, Kontu and Suokanerva2009) for dry snow reflectance characterization are quite good but values used for wet snow reflectance in remote sensing data retrieval algorithms may be too high (Metsämäki and others, Reference Metsämäki2015).
6. Conclusions
In this study, we assessed the reflectance variability of natural snowpacks based on measurements of snow samples under controlled illumination conditions. The laboratory measurement setup facilitated the retrieval of the effect of snow characteristics and organic impurities on snow reflectance without the disturbance by changing illumination evident in field spectroscopy. The results of this study can be directly used to refine accuracy characterization and parametrization of snow mapping algorithms utilizing reflectance information of spectral end-members, such as snow. Better characterization of the true variability of snow reflectance will decrease the uncertainty of the snow cover maps produced by optical remote sensing.
The results indicated that most of the snow types could be grouped either as dry or wet based on their spectral behavior. However, some snow types were located between these two distinct groups, such as snow with the moist surface and snow with the near-surface melt-freeze crusts. The relationship between varying snow sample microstructures and snow spectral reflectance proved to be challenging. It was hypothesized that this was due to differing critical surface snow depths contributing to the measured spectral reflectance, and combined effects of the snow grain size and shape differences between the several snow surface layers. From the snow characteristics, only snow grain size increase connected to the snow wetness and the addition of organic litter inclusions systematically changed the observed spectral reflectance.
The resampling of the laboratory measurements to correspond to various satellite instrument bands indicated that despite the various band configurations the results were similar for most of the bands with a maximum difference of 0.01. More deviation was seen in the NIR and SWIR bands which are more sensitive to the snow grain size and liquid water content. Largest deviations in the band reflectance values were produced by the widest band configurations. The laboratory results were compared by means of MODIS band specific reflectance values with field spectroscopy observations currently used to describe the snow reflectance variability in the snow cover mapping method SCAmod. The results suggested that the values used for wet snow reflectance in remote sensing data retrieval algorithms may need refinement, e.g. field spectroscopy results (Salminen and others, Reference Salminen, Pulliainen, Metsämäki, Kontu and Suokanerva2009) reported slightly higher values than those obtained here for channels relevant to snow detection (Metsämäki and others, Reference Metsämäki2015). These results are also valid for other sensors as the observed effect of different band configurations and SRF on snow reflectance were indicated to be small.
Acknowledgements
This research was funded by Maj and Tor Nessling foundation. It has also been supported by the A4-project (Arctic Absorbing Aerosols and Albedo of Snow, decision No. 254195), Nordic Top-level Research Initiative (TRI) ‘Cryosphere-atmosphere interactions in a changing Arctic climate’ (CRAICC), funded by the Academy of Finland.
Author contribution
HRH was responsible for the planning, coordination and execution of the laboratory experiments. She analyzed the data and wrote most of the paper. JP was behind the measurement idea, took part in the writing work and acted as the scientific supervisor.


 Open access