


1. Introduction
Implications of glacier mass loss span global (Gardner and others, Reference Gardner2013; Marzeion and others, Reference Marzeion2017; Zemp and others, Reference Zemp2019) to local scales (e.g. Moore, Reference Moore1992; O'Neel and others, Reference O'Neel2015; Sass and others, Reference Sass, Loso, Geck, Thoms and Mcgrath2017; Schoen and others, Reference Schoen2017). Yet resolving regional patterns of mountain glacier mass loss remains challenging (e.g. Gardner and others, Reference Gardner2013; Box and others, Reference Box2018; Menounos and others, Reference Menounos2018), in part due to the paucity of long-term records, and in part due to the complex response of glaciers to climate forcing (Oerlemans, Reference Oerlemans2000; Roe, Reference Roe2011). Modern remote-sensing capabilities enable rich analytical insight, but direct glaciological observations remain irreplaceable for capturing short-term (seasonal, interannual) changes and contributing to the process-based understanding of mass balance. However, comparisons drawn from these field-based records can be complicated by differences in data collection and analysis methods. For example, glacier-wide mass-balance estimates can be produced using multiple approaches to extrapolate point measurements to the entire glacier area, including mass-balance profiles (Fountain and Vecchia, Reference Fountain and Vecchia1999; Krimmel, Reference Krimmel2000), an area-weighting (site-index) method (e.g. March and Trabant, Reference March and Trabant1996; van Beusekom and others, Reference van Beusekom, O'Neel, March, Sass and Cox2010), linear regressions between a single stake to robust observations from previous years (Krimmel, Reference Krimmel and Oerlemans1989), contour mapping (Meier and others, Reference Meier, Tangborn, Mayo and Post1971), as well as inclusion of ad-hoc correction factors (e.g. van Beusekom and others, Reference van Beusekom, O'Neel, March, Sass and Cox2010). The magnitude of variance and resultant uncertainty from mixing these approaches has never been quantified and could be significant, highlighting the need for common intercomparison and interpretation frameworks for mass-balance datasets (Huss and others, Reference Huss, Bauder and Funk2009). Additionally, systematic reanalyses of mass-balance time series (e.g. Zemp and others, Reference Zemp2013) helps facilitate refinement of ongoing practices of long-term field programs by providing insight into biases introduced as technology evolves, and by linking individual steps of the analysis to overall estimates of uncertainty in mass-balance estimates.
The main objective of this study is to present a unified mass-balance reanalysis for the five US Geological Survey (USGS) Benchmark Glaciers (Gulkana, Wolverine, Lemon Creek, South Cascade and Sperry glaciers). To accomplish this, we first describe in detail a consistent, adaptable approach for estimating glacier-wide mass balance at annual and seasonal time steps from an inconsistent suite of observations. Our reanalysis includes an examination of several point-balance extrapolation and geodetic calibration approaches that capitalize on the increased availability and quality of aerial and space-borne imagery to minimize systematic errors in field data. Finally, we use the reanalysis results to gain broad spatial and temporal insight into glacier response to climate forcing.
2. Background and setting
The concept of a continental scale investigation of North American glacier-climate linkages dates to the 1957 International Geophysical Year (IGY; American Geographical Society, 1960). USGS initiated a mass-balance program at Washington's South Cascade Glacier as part of the IGY (Meier, Reference Meier1958), which was the first step towards a long-term programmatic effort to document and understand glacier-climate linkages. During 1966, as part of the International Hydrological Decade (IHD), the project expanded to Gulkana and Wolverine glaciers in Alaska (Meier and others, Reference Meier, Tangborn, Mayo and Post1971) and more recently to Montana's Sperry Glacier in 2005 (Clark and others, Reference Clark, Fagre, Peitzsch, Reardon and Harper2017). We also include mass-balance data from southeast Alaska's Lemon Creek Glacier, traditionally maintained by the Juneau Icefield Research Program (JIRP). This glacier fills the geographic gap between the glaciers of the contiguous USA and mainland Alaska, prompting USGS to initiate seasonal mass-balance observations that augment the ongoing JIRP's summer-season efforts (Pelto and others, Reference Pelto, Kavanaugh and McNeil2013). Logistics and scientific value played fundamental roles in site selection, with consideration of access, hazards and in some cases a history of previous research (Meier and others, Reference Meier, Tangborn, Mayo and Post1971; Fountain and others, Reference Fountain, Krimmel and Trabant1997). Representativeness of regional climate also influenced the selection process. The study glaciers span the primary North American climate regimes that support glaciers: midlatitude maritime, midlatitude continental, high-latitude maritime and high-latitude continental (Fig. 1a).
(a) USGS Benchmark Glacier locations (colored circles), with North American glacier extent from Global Land Ice Measurements from Space database (GLIMS) shown in cyan (GLIMS and NSIDC 2005, updated 2018). Individual glaciers and surrounding topography are mapped in panels (b–f): (b) Gulkana, (c) Wolverine, (d) Lemon Creek, (e) South Cascade and (f) Sperry glaciers show the modern glacier outline in a color corresponding to the glacier in panel (a), and midcentury (1948–58) glacier extent in black. Mass-balance measurement sites (index sites) are labeled with site names and dots. Large dots indicate long-term index sites, and small dots indicate shorter length records. Local weather stations used for climate forcing are shown with a pink star at Wolverine and Gulkana glaciers. Additional weather stations adjacent to the glaciers are shown with a green star. Streamgages at Gulkana, Wolverine, and South Cascade glaciers are shown with a blue square. Scale bars vary among panels.
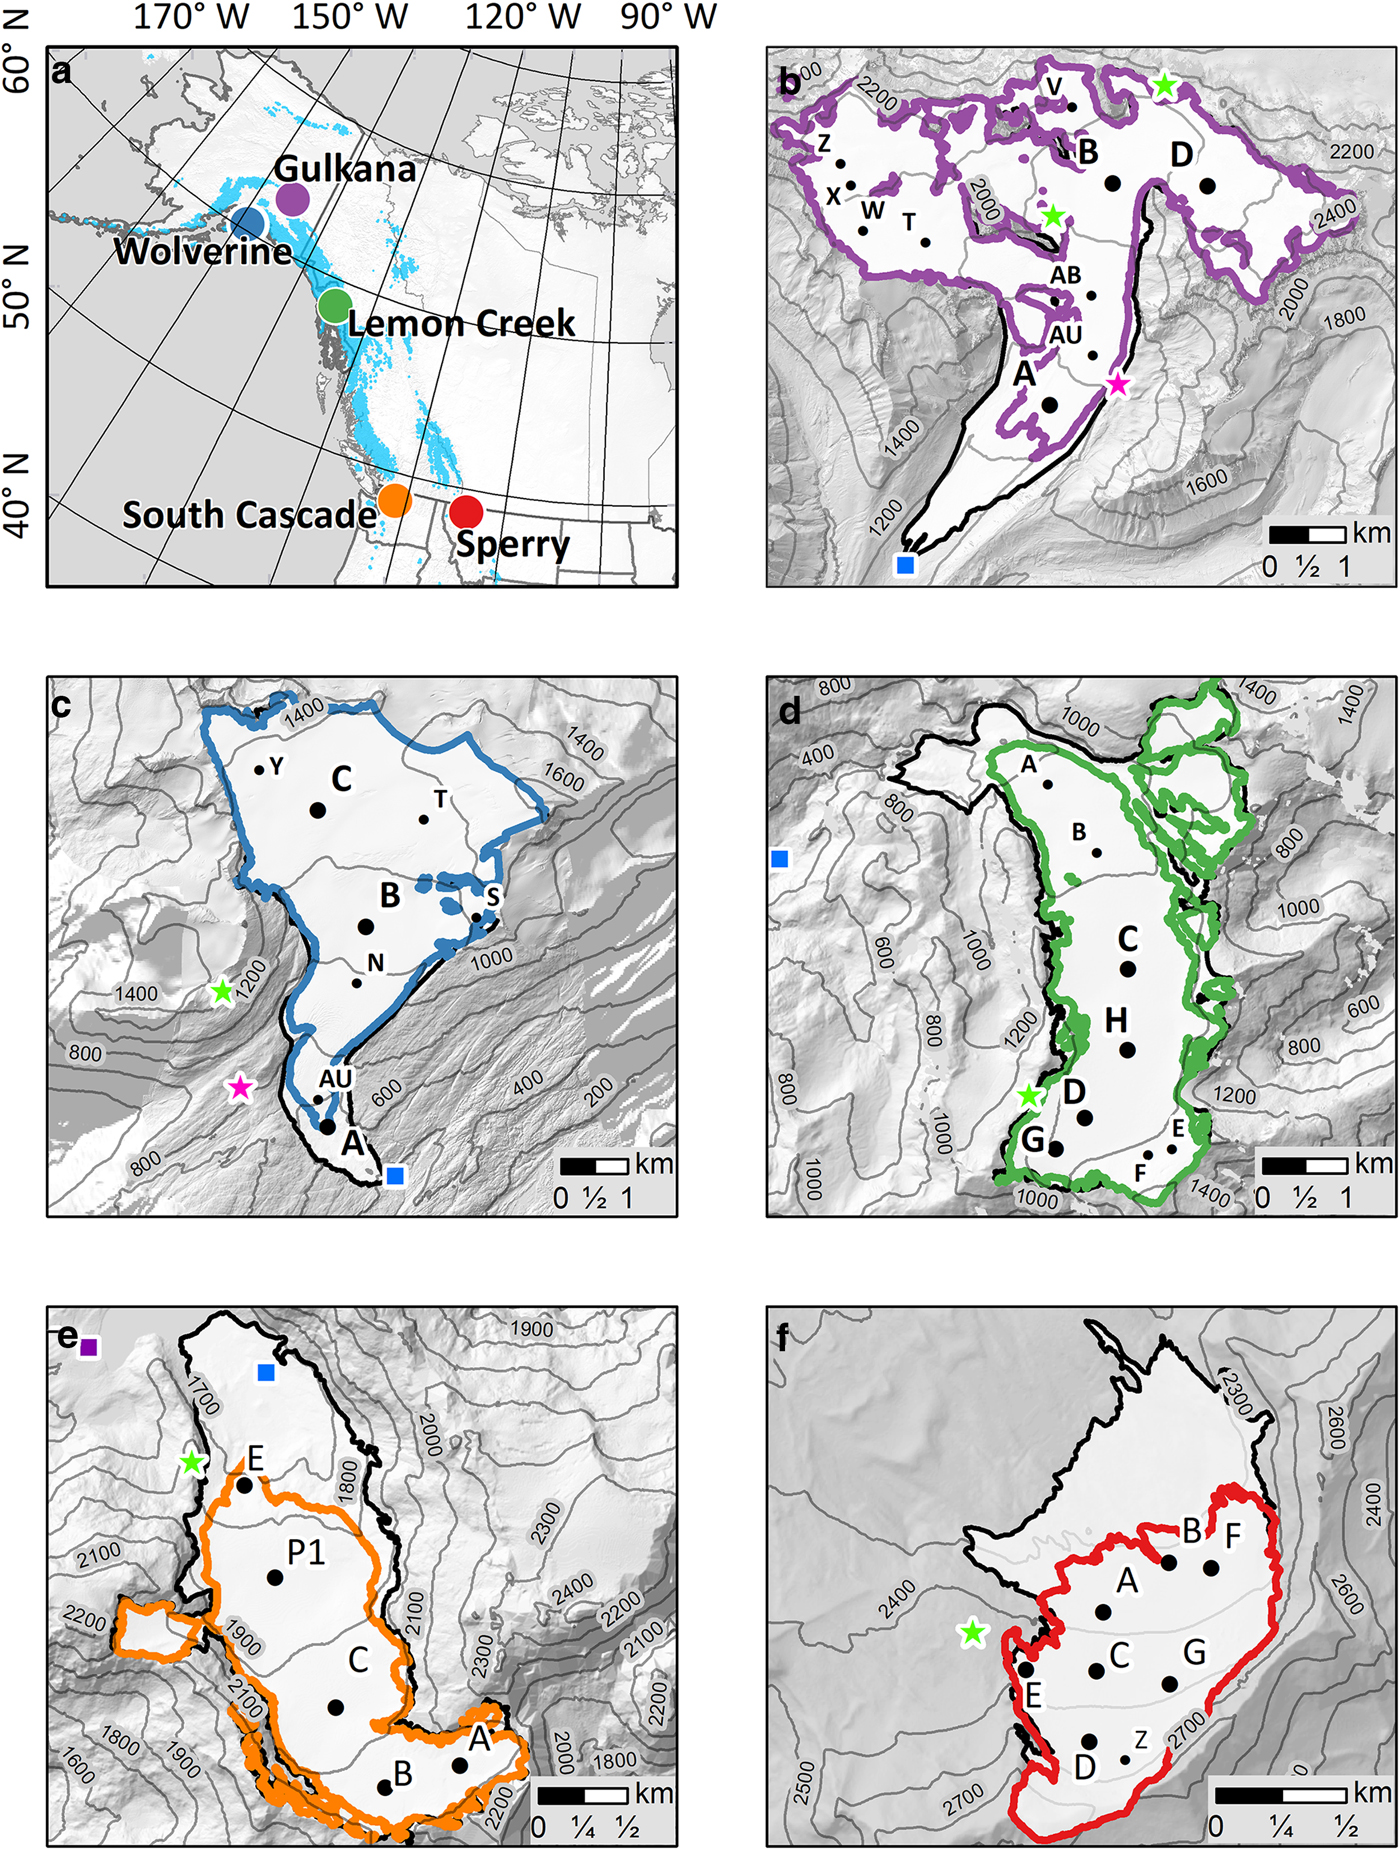
Gulkana Glacier (GG; Fig. 1b) is located in the high-latitude continental climate regime of Alaska's Delta Mountains. USGS established an observation program here that included measuring snow and ice mass balance at three sites (nominally), a weather station (air temperature, precipitation, wind) installed on the glacier margin below the long-term equilibrium line (ELA) and a streamgauge on the outlet stream below the glacier. Two auxiliary weather stations were added to the network after 2010. The basin area above the USGS streamgauge is 31.5 km2, and the glacier area decreased from 18.7 to 16.0 km2 from 1967 to 2016 (Table 1).
Geodetic analyses data including acquisition year, mass balance, glacier area (km2) and fractional area change relative to the reference DEM

The reference DEM is indicated with bold, italicized text.
Wolverine Glacier (WG; Fig. 1c) is found in the high-latitude maritime climate regime of Alaska's Kenai Mountains. In 1966, simultaneous with GG, USGS established an observation program that included measuring snow and ice mass balance at three sites (nominally) (Mayo and others, Reference Mayo, Trabant and March2004; O'Neel and others, Reference O'Neel, Hood, Arendt and Sass2014), a weather station (air temperature, precipitation, wind) installed on the glacier margin below the long-term equilibrium line (ELA) and a streamgauge on the outlet stream below the glacier. An additional weather station was added in 2012. The basin area above the USGS streamgauge is 24.6 km2, and the glacier area decreased from 17.1 to 15.6 km2 from 1969 to 2018 (Table 1).
Lemon Creek Glacier (LCG; Fig. 1d) is located in the maritime high-latitude climate regime. Snow and ice mass-balance observations began in 1953, making LCG the longest record presented here (Miller and Pelto, Reference Miller and Pelto1999; Pelto and others, Reference Pelto, Kavanaugh and McNeil2013). Extensive observations characterize the efforts through the first two decades of research, which transitioned into the modern five-site network following the IHD, ~1970. The early program included weather observations near the glacier, and a streamgauge on the outlet stream. However, in our analyses, frequent and extended discontinuities required using nonlocal meteorological data from the Juneau Airport. The airport is located 13 km from the glacier at sea level (Station ID: USW00025309; ncdc.noaa.gov). The basin area above the USGS streamgauge is 31.9 km2 and the glacier area decreased from 12.8 to 9.7 km2 between 1948 and 2018 (Table 1).
Research began at Washington State's South Cascade Glacier (SCG; Fig. 1e) in 1958 (Meier, Reference Meier1958). SCG represents the midlatitude maritime climate, characteristic of the North Cascade Mountains. The glacier program included weather measurements (air temperature, precipitation, intermittently maintained) and a streamgauge on the outlet stream of the lake in front of the glacier. A new, seasonal gauge was installed just below the glacier in 2002. Measurements strategies (e.g. stake networks, measurement dates) varied through time, but, on average, five seasonally measured sites form a continuous record of mass-balance observations. The basin area above the USGS streamgauge is 6.1 km2 and the glacier area decreased from 2.9 to 1.8 km2 between 1958 and 2015 (Table 1). SCG is the only Benchmark Glacier that calved icebergs for a portion of its record. The glacier terminated in a lake from ~1930–1975, but calving is thought to not have influenced mass balance significantly (Horlings, Reference Horlings2016).
Sperry Glacier (SG; Fig. 1f) is located along the Continental Divide within Glacier National Park, Montana, and represents the midlatitude continental or transitional climate. Seasonal mass-balance observations began in 2005 at six sites, complimented by historic photographic and topographic map records (Johnson, Reference Johnson1980) that provide longer-term context to the 14-year field program. A weather station installed on the glacier's western margin during 2006 records temperature, humidity, wind speed, wind direction and solar radiation. The glacier resides in a ~4 km2 hanging cirque, that contains several small, ungaugeable outlet streams that pour over cliffs at the cirque boundary. As of 2015, the glacier had an area of 0.80 km2 (Fagre and others, Reference Fagre, McKeon, Dick and Fountain2017), only slightly reduced from the 1950 area of 1.3 km2, making SG the smallest of the benchmark glaciers (Table 1).
3. Data
Glacier-wide mass-balance estimates require several classes of data, including direct glaciological measurements (accumulation and ablation), meteorological data (temperature and precipitation) and descriptions of the glacier hypsometry (area, area-elevation distribution), which are derived from the air- and space-borne imagery. The comprehensive dataset used in the reanalysis is available for download (Baker and others, Reference Baker2018).
3.1 Point mass-balance data
A primary emphasis of this reanalysis involved consistent aggregation of ablation stake and snowpit data to estimate point mass balances. All possible data were incorporated into surface height change estimates before they were scaled by material (snow, firn, ice) density to obtain a mass balance (m w.e. a−1). We prescribe an ice density of 900 kg m−3. For snow pits or cores, density is measured through the entire snowpack, from which a column-average density is calculated. Stakes are used to estimate ablation in a stratigraphic, floating-date time system by measuring the snow or ice level relative to the presumably fixed stake (Cogley and others, Reference Cogley2011). Measurement sites were established at fixed locations (index sites) early in each project. Stakes are installed upstream of, or at index sites, then replaced seasonally (SCG, SG), biennially (GG, WG, LCG) or as needed to prevent meltout or flow into a different mass-balance regime. When the glacier surfaces are snow-covered, depth measurements to ice or the previous summer surface (firn) are performed in snow pits or by extracting a core if snowpack exceeds ~2 m. Identification of the previous summer surface can be challenging in cores, which intermittently led to this surface being marked with sawdust, colored chalk or hardware cloth to facilitate interpretation. Probe observations often augment snow pits to better capture spatial variability of seasonal snow depths.
Field visits are scheduled to approximately coincide with the mass extrema, though our reanalysis approach (Section 4.1) accounts for mass changes that may occur between measurement date and seasonal mass extrema. To minimize the magnitude of these modeled adjustments, we measure winter ablation that occurs after fall field visits (measured the following spring) and summer accumulation (measured during fall visits) to ensure that these components are distributed to the appropriate balance years. Reconstructing these mass-balance components was not always possible in the early record when mass-balance practices were still being refined.
Measurement networks and protocols vary among the glaciers and in time commensurate with changes in staff, funding and the ever-evolving knowledge base. In all cases, measurement sites were located in areas thought to be representative of broad regions of the glacier (Fig. 1). Except for SG, original site selections predate all current project staff.
Three fixed sites characterized the WG and GG programs over most of the record, distributed with the intention to represent the mass-balance regime of the ablation zone, the equilibrium line altitude (ELA) region and the accumulation zone. At SCG and LCG, site consistency was not emphasized over much of the record; rather, measurements occurred in general regions (typically, 5–10 sites). JIRP assembled the majority of the LCG record, which is characterized by a single late-summer, accumulation dominated set of annual observations (Pelto and others, Reference Pelto, Kavanaugh and McNeil2013; McNeil, Reference McNeil2016). Data from LCG and SCG required additional efforts to prepare input for standard processing (Supplementary Material). At SG, the influence of wind and avalanching was recognized early on, leading to a stake network that spans both the width and length of the glacier.
Upgrades to observation networks occurred throughout the project history. Since the late 1990s, SCG sites were distributed at quasi-regular elevation intervals along the glacier centerline. Network size increased two- to threefold at GG and WG after 2010 (Fig. 1). Seasonal measurements began at LCG in 2013. The number of snow pits used to determine accumulation rates and gradients remained variable among the glaciers, ranging from one annually on SG to five on LCG. New index sites have been periodically established to accommodate retreat beyond the lowest elevation sites at many of the glaciers. In accord with the concepts of the USGS Benchmark Glaciers, extensive ablation stake networks were used early on to determine sparse-network site representativeness (e.g. Tangborn and others, Reference Tangborn, Krimmel and Meier1975), but these efforts were later halted, and only recently reinitiated.
3.2 Meteorological data
For WG and GG, meteorological stations installed within the watershed (Fig. 1) provide daily estimates of average air temperature and total precipitation catch, but discontinuous local records for SCG, LCG and SG required the use of continuously operating distant weather stations (Wheler and others, Reference Wheler2014). We chose to use the local stations at GG and WG, as relatively few data gaps exist (Table S1), and regional lapse rates are poorly defined. At these two stations, we fill short (<3 day) gaps using linear interpolation and long gaps via monthly regressions with data from distant stations, typically at lower elevations (van Beusekom and others, Reference van Beusekom, O'Neel, March, Sass and Cox2010). Further details of the USGS-maintained instrumentation, changes to instrumentation and quality control are provided in the Supplementary Material.
3.3 Geospatial data
A suite of 33 DEMs provide geometric and geodetic constraints on the mass-balance reanalysis (Tables S2–S6). Through ~2008, stereo aerial photography of SCG, LCG, WG and GG was episodically acquired as time and budgets allowed. These historic data were reprocessed using Structure from Motion (SfM) photogrammetric methods to produce higher-accuracy DEMs (e.g. Westoby and others, Reference Westoby, Brasington, Glasser, Hambrey and Reynolds2012). Since 2008, airborne imaging has largely been replaced by optical commercial satellite imagery from the DigitalGlobe constellation (Neigh and others, Reference Neigh, Masek and Nickeson2013). This sub-meter resolution imagery along with automated processing engines have streamlined the DEM production process (e.g. AMES stereo pipeline; Shean and others, Reference Shean2016). Exceptions to optical acquisitions include the 2000 (SRTM; https://earthexplorer.usgs.gov/) and 2013 (IfSAR; http://ifsar.gina.alaska.edu) LCG DEMs, which were produced from synthetic aperture radar products, and the 2016 WG DEM, which was produced from airborne lidar.
Glacier hypsometry (area-elevation distribution) was first determined by digitizing the glacier margins in available orthophotographs to obtain total glacier area. The elevation distribution was then assembled by partitioning glacier surface elevations (from available DEMs) into elevation bins commensurate with the total elevation range of each glacier (SG: 30 m, SCG: 50 m; LCG, GG, WG: 100 m). Because the DEMs exist on approximately decadal time steps, we linearly interpolate the changes in the area within each bin between subsequent DEMs to produce annual hypsometries.
4. Analysis
To improve confidence in and reproducibility of mass-balance estimates, as well as to allow direct intercomparison of otherwise disparate glacier records, we developed a flexible yet consistent reanalysis approach (Fig. 2). The approach provides the capacity to evaluate glacier-wide seasonal and annual surface mass balance in a variety of time systems, reference frames, extrapolation types and geodetic calibration styles (Supplementary Material). Common to other mass-balance programs, this approach centers on fitting a mass-balance profile to point observations (Fig. 3), then integrating (extrapolating) the profile over the coincident glacier hypsometry to estimate seasonal and annual mass balances. The cumulative glacier-wide mass balance is calculated, then compared with the cumulative geodetic mass balance. If the two series diverge beyond geodetic uncertainties, a calibration is performed. We use the word calibration to describe a least-squares adjustment of the in situ glaciological data to minimize the difference with geodetic data (Zemp and others, Reference Zemp2013). Many of the analysis steps require the use of a mass-balance model (Section 4.2) to resolve changes in mass among observations (e.g. direct measurements and image acquisitions) or to coincide with the floating-date time system.
Flow chart showing reanalysis steps. The extrapolation step (*) uses the glacier hypsometry derived from geospatial data.
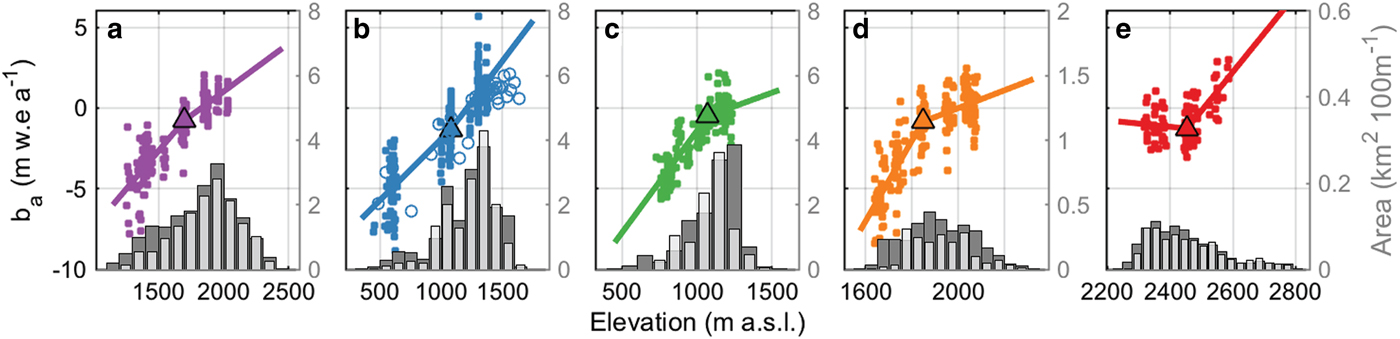
Mass-balance profile curve fitting. Using annual balance (ba) as an example (seasonal balances in Fig. S6), we show piecewise-linear fits to all available point balance data from each glacier with colors matching all other figures (left-hand axis, shown only in (a)). From left to right, (a) Gulkana, (b) Wolverine, (c) Lemon Creek, (d) South Cascade and (e) Sperry glaciers. Open circles in (b) represent results from a short-term (2016) extensive stake network but these data are not used to constrain the fitted profile. Hypsometries are shown as bar plots below the profiles (right-hand axes, in gray) The initial hypsometry is shown in dark grey and the modern hypsometry in lighter grey.
4.1 Estimating glacier-wide mass balance
Mass-balance profiles (e.g. Fountain and Vecchia, Reference Fountain and Vecchia1999; Cogley and others, Reference Cogley2011) provide an elevation-based parameterization of point observations (b(z)), through which glacier-wide mass balance (B) is calculated. For each profile fit, we required a minimum of three distributed point balance observations: one in the ablation zone, another in the vicinity of the ELA and a third in the accumulation zone. We explore sensitivity to various interpolation and extrapolation schemes (Section 4.5) by producing a solution set with multiple forms of balance profiles (e.g. linear, piecewise-linear) and the site-index method historically used at GG and WG (Fig. S5). Ultimately, we use a piecewise-linear balance profile for interpretation, and the other methods to constrain uncertainties arising from the balance profile. This piecewise approach can be applied to almost all seasonal and annual datasets, allows variable profile slopes in the accumulation and ablation zones, and collapses to a linear profile under many sparse data cases. Extenuating circumstances occasionally prohibited field data collection at more than two sites requiring infilling as described in the Supplementary Material.
Resolving glacier-wide mass balance in floating-date time systems requires estimates to be coincident with seasonal glacier mass extrema (Cogley and others, Reference Cogley2011). The first step in resolving extrema is modeling point balance time series at the highest and lowest elevation sites to bracket the timing of the glacier-wide extrema. Then daily glacier-wide solutions through the bracketed interval yield the timing and balance at the glacier-wide extrema (Fig. S3).
Finally, challenges unique to LCG and SCG prohibited the reanalysis from extending to the beginning of the record (Supplementary Material, Table S7), and required splicing with data from previously published results (WGMS, 2017).
4.2 Mass-balance model
Many time systems require resolving the timing mismatch among observations (e.g. stakes, DEMs) using a mass-balance model (e.g. van Beusekom and others, Reference van Beusekom, O'Neel, March, Sass and Cox2010). Model adjustments are generally applied over short-time intervals (i.e. days–weeks). We estimated daily point mass balance (b) as the sum of ablation (a) and accumulation (c):

Ablation was modeled, using the positive degree-day approach, as:

where $T_{(T \gt 0^\circ )}$ is a positive air temperature estimate for each measurement site on the glacier and k s,i is an ablation coefficient (degree-day factor) for snow (s) or ice (i) determined for each glacier. Site temperatures were calculated from weather station observations using a constant adiabatic lapse rate of −6.5 °C km−1 (Barry, Reference Barry1992) to account for elevation differences. Ablation coefficients (k s,i) were solved for each glacier using all data over the entire study period (Table S8) and show general agreement with literature values (e.g. Braithwaite, Reference Braithwaite1995).
Snow accumulation was estimated as:

where P is recorded precipitation when the temperature was lower than 1.7 °C and γ a scale factor between the total winter snow accumulation at a mass-balance site and the respective weather station (van Beusekom and others, Reference van Beusekom, O'Neel, March, Sass and Cox2010). For routinely measured sites, site-specific scale factors (γ) were determined, but for sites measured fewer than three times, we applied a glacier-wide average scale factor (Table S9).
4.3 Geodetic mass balance and calibration
Geodetic mass-balance time series were constructed from DEM data (Table 1) to assess and reduce (through calibration) systematic biases in the glaciological cumulative balance (Zemp and others, Reference Zemp2013). The combination of abundant high-quality space-borne imagery and rapid changes to the glaciers prompted us to explore several time-windowed approaches.
4.3.1 Geodetic mass balance
For each glacier, DEMs were produced in a common geospatial reference frame (WGS84) and projection (UTM), and then aligned using a universal co-registration method (Nuth and Kääb, Reference Nuth and Kääb2011). The co-registration minimizes apparent elevation changes across stable (bedrock), snow-free, off-glacier terrain. The highest quality DEM in each time series is designated as the ‘reference,’ with which all other DEMs were aligned (Table 1). Once co-registered, DEMs were differenced from the reference DEM to yield elevation change across the glacier surface (Shean and others, Reference Shean2016; Sass and others, Reference Sass, Loso, Geck, Thoms and Mcgrath2017). Voids in the difference map exceeding 5% of the glacier surface were filled using a regression between the change in surface elevation and the reference surface elevation (Larsen and others, Reference Larsen2015). Glacier volume change from the DEM differencing was converted to mass change by specifying a material density of 850 ± 60 kg m−3, which accounts for the unknown changes in firn density and volume (Huss, Reference Huss2013). We do not explicitly account for internal accumulation or ablation (Oerlemans, Reference Oerlemans2013; Andreassen and others, Reference Andreassen, Elvehøy, Kjøllmoen and Engeset2016), but given representative precipitation rates and glacier elevation ranges we can assume none of the glaciers is subject to significant internal accumulation. We also estimated the physical limit of internal melting from dissipative heat and found it to range only between 0.01 and 0.06 m w.e. a−1 across the study glaciers.
4.3.2 Geodetic calibration
As the first step in geodetic calibration, we rejected DEMs with >60% snow-covered area to minimize uncertainty related to poor constraints on the density of seasonal snow. Next, we addressed the temporal mismatch between field campaigns and image acquisition, as acquisition rarely coincides with the timing of mass minima (Tables S2–S6). Using the mass-balance model, we adjust the geodetic mass-balance results to account for mass gains or losses between the DEM dates and the timing of mass extrema. These adjustments were on average 25 ± 18 days which amounted to a −0.45 ± 0.51 m w.e. average adjustment on the cumulative geodetic mass balance. Once both datasets were migrated to a common time, calibration of the direct time series occurred.
The most commonly adopted calibration approach involves applying a sequential adjustment to the direct time series for each DEM pair in the geodetic time series (Fig. S7; Zemp and others, Reference Zemp2013). Sequential calibrations minimize the residual difference of cumulative direct and geodetic mass-balance time series for each geodetic interval independently. This approach may be appropriate when a limited number of DEMs exist (e.g. decadal or longer time spans between acquisitions), and offers the advantage of resolving permanent solutions over the majority of the record. However, when differencing over short-time intervals (<5 years), changes in firn structure and the associated density assumption can introduce substantial aliasing errors in the geodetic mass-balance time series.
Alternatively, a global calibration can be developed, with a single weighted least-squares fit over the entire time series (e.g. van Beusekom and others, Reference van Beusekom, O'Neel, March, Sass and Cox2010; O'Neel and others, Reference O'Neel, Hood, Arendt and Sass2014). Weights were derived from the uncertainties of each DEM. The slope of the least-squares fit describes the annualized rate of systematic bias, which was then applied to calibrate the direct time series (Fig. S7). This global approach has the benefit of fitting through the maximum number of data points, but the distinct disadvantage that it assumes a uniform bias in the direct method over the entire period of record. A constant bias may exist for constant measurement networks, small changes in glacier geometry or under steady climate conditions, but is highly unlikely to apply uniformly through periods of substantial glacier change. Furthermore, it results in changes (generally small) to the entire calibrated time series each time a new DEM is produced, which may not be warranted.
We developed a third, hybrid approach, where a piecewise-linear calibration is fit over ~10-year intervals (longer if necessary), each of which must contain at least three DEMs (Fig. S7). This breakpoint approach maximizes the incorporation of geodetic data while minimizing errors that arise from simple density assumptions when there is substantial interannual variability in glacier mass balance (Huss, Reference Huss2013). It allows calibration intervals to coincide with changes in glacier hypsometry, measurement networks and/or climate. Regardless of the calibration approach used, annual calibrations are distributed equally between the accumulation and ablation seasons.
4.4 Variability and trend analyses
Mass balance and meteorological time series were analyzed for correlations, variability and the presence of trends using parametric (c.f. Medwedeff and Roe, Reference Medwedeff and Roe2017) and nonparametric methods (e.g. O'Neel and others, Reference O'Neel, Hood, Arendt and Sass2014). Our parametric approach involved forming linearly – detrended anomalies, evaluating the normality of residuals, then using decade-normalized t-statistics (after Roe, Reference Roe2011) to evaluate and intercompare the presence of significant trends. To improve confidence in our statistics, a similar process was followed using the nonparametric Mann-Kendall test (Hamed and Ramachandra Rao, Reference Hamed and Ramachandra Rao1998) on anomaly time series.
4.5 Sensitivity and uncertainty
Traditional error assessment is commonly done from the bottom up: investigators begin with point balance errors and arrive at error estimates for glacier-wide balance (e.g. Cogley and Adams, Reference Cogley and Adams1998; Zemp and others, Reference Zemp2013; Beedle and others, Reference Beedle, Menounos and Wheate2014). However, this approach requires assumptions about the relation between point measurements and the glacier-wide mass balance that are largely untestable, notably that point measurements adequately represent mass-balance variability over the entire glacier.
We endeavor to avoid those assumptions using a top-down approach that partitions the total uncertainty in glacier-wide mass balance into two components. The first component reflects uncertainty in the temporal trend (i.e. cumulative mass balance), and the second component relates to annual balance uncertainty. Trend uncertainty derives from the geodetic balance, while uncertainty in annual balance follows from quantifying the magnitude of variance from the different extrapolation and calibration methods. The two terms can be combined to define characteristic uncertainties for the mass balance at each glacier (Thibert and Vincent, Reference Thibert and Vincent2009).
4.5.1 Geodetic mass-balance uncertainty
Geodetic mass-balance uncertainty arises from errors in computing glacier volume change, and errors in the material density assignment required to convert volume to mass. Volume change error has two sources: elevation error and elevation data gaps.
Elevation error is characterized by off-glacier elevation differences remaining after co-registration. In all cases, spatial autocorrelation areas were smaller than the glaciers, and in some cases the spatial autocorrelation area may be as small as an artifact of the total DEM area, which leads to a potential underestimate of uncertainty. Hence, we use the more conservative normalized median absolute deviation N z, as a robust estimate of variance in a non-Gaussian distribution,

where Δz are the remaining off-glacier elevation differences between the aligned DEMs, m Δz is the median of the Δz values and the coefficient scales the rank-based statistic to provide a robust estimate of variance compared to the standard deviation (Höhle and Höhle, Reference Höhle and Höhle2009; Shean and others, Reference Shean2016).
Error from infilling elevation data gaps is nonzero when elevation data are missing over >5% of the glacier surface (Tables S2–S6). Gaps are infilled using a linear interpolation model across the glacier surface (Larsen and others, Reference Larsen2015). We evaluate uncertainty due to gap interpolation with the mean absolute error statistic M, given by,

where r is the residual between observed and infilled surface elevation changes, and n is the number of measured values over the glacier surface.
We combined these two elevation uncertainty components using the fraction of the glacier surface that required interpolation (f) and the fraction that did not need interpolation (1 − f) to yield σ dz, the total elevation uncertainty, given by,

Finally, we take the total geodetic mass-balance error σ g (m w.e.) as the quadratic sum of the volume change term and a density term (Beedle and others, Reference Beedle, Menounos and Wheate2014),

where dh is the area-averaged surface elevation change (m), and γ and λ σ are unitless factors to convert length to water equivalent units. γ takes a value of 0.85 (i.e. 850 kg m−3/1000 kg m−3) to convert σ dz, and λ takes a value of 0.06, i.e. 60 kg m−3/1000 kg m−3 (Huss, Reference Huss2013). σ g represents the total uncertainty over the geodetic differencing interval, but can be expressed in terms of annual error with units m w.e. a−1.
4.5.2 Sensitivity tests
Evaluating different methods of point measurement extrapolation and geodetic calibration offers insight into how the number and distribution of point measurements affect the resolution of glacier-wide mass-balance estimates. We characterize the sensitivity of our methodology by producing a set of nine mass-balance time series, each of which has a different spatial-extrapolation and/or geodetic-calibration approach. The solution set consists of the historically used site-index method (March and Trabant, Reference March and Trabant1996) and two profile fitting variations (linear and piece-wise linear). Each of these three variants is further subjected to three geodetic calibration approaches (sequential, breakpoint, global; Fig. S7). To characterize uncertainty, we calculated the normalized median absolute deviation (N s, Eqn (4) substituting ΔB for Δz) across the solution set, with the deviation ΔB defined as the difference between any given estimate and the preferred solution. The combined characteristic uncertainty is then estimated as the root sum of squares of the trend and annual balance components for each glacier. Several other parameters such as lapse rates or degree-day factors were explored separately and found to have a much smaller influence on solutions (e.g. adjusting the lapse rate by 1 °C only impacted solutions by 10−2 m a−1, whereas the differences between geodetic calibrations are 10−1 to 100 m a−1).
5. Results
We designed this reanalysis with the goal of comparing results with climate and constraining uncertainties from variations in methods. The approach yielded a suite of solutions from which we quantify the magnitude of variance arising from various extrapolation and calibration methods (i.e. sensitivity testing). We selected a preferred solution in a floating-date (as opposed to a fixed-date system; Cogley and others, Reference Cogley2011) ‘stratigraphic’ time system designed to quantify the duration of the accumulation and ablation seasons and to keep mass changes from any given season within a single mass-balance year. It uses time-variable glacier hypsometries, yielding conventional mass balances (Elsberg and others, Reference Elsberg, Harrison, Echelmeyer and Krimmel2001; Cogley and others, Reference Cogley2011). The solution incorporates a piecewise-linear mass-balance profile, and is geodetically calibrated using the breakpoint approach.
5.1 Mass Balance
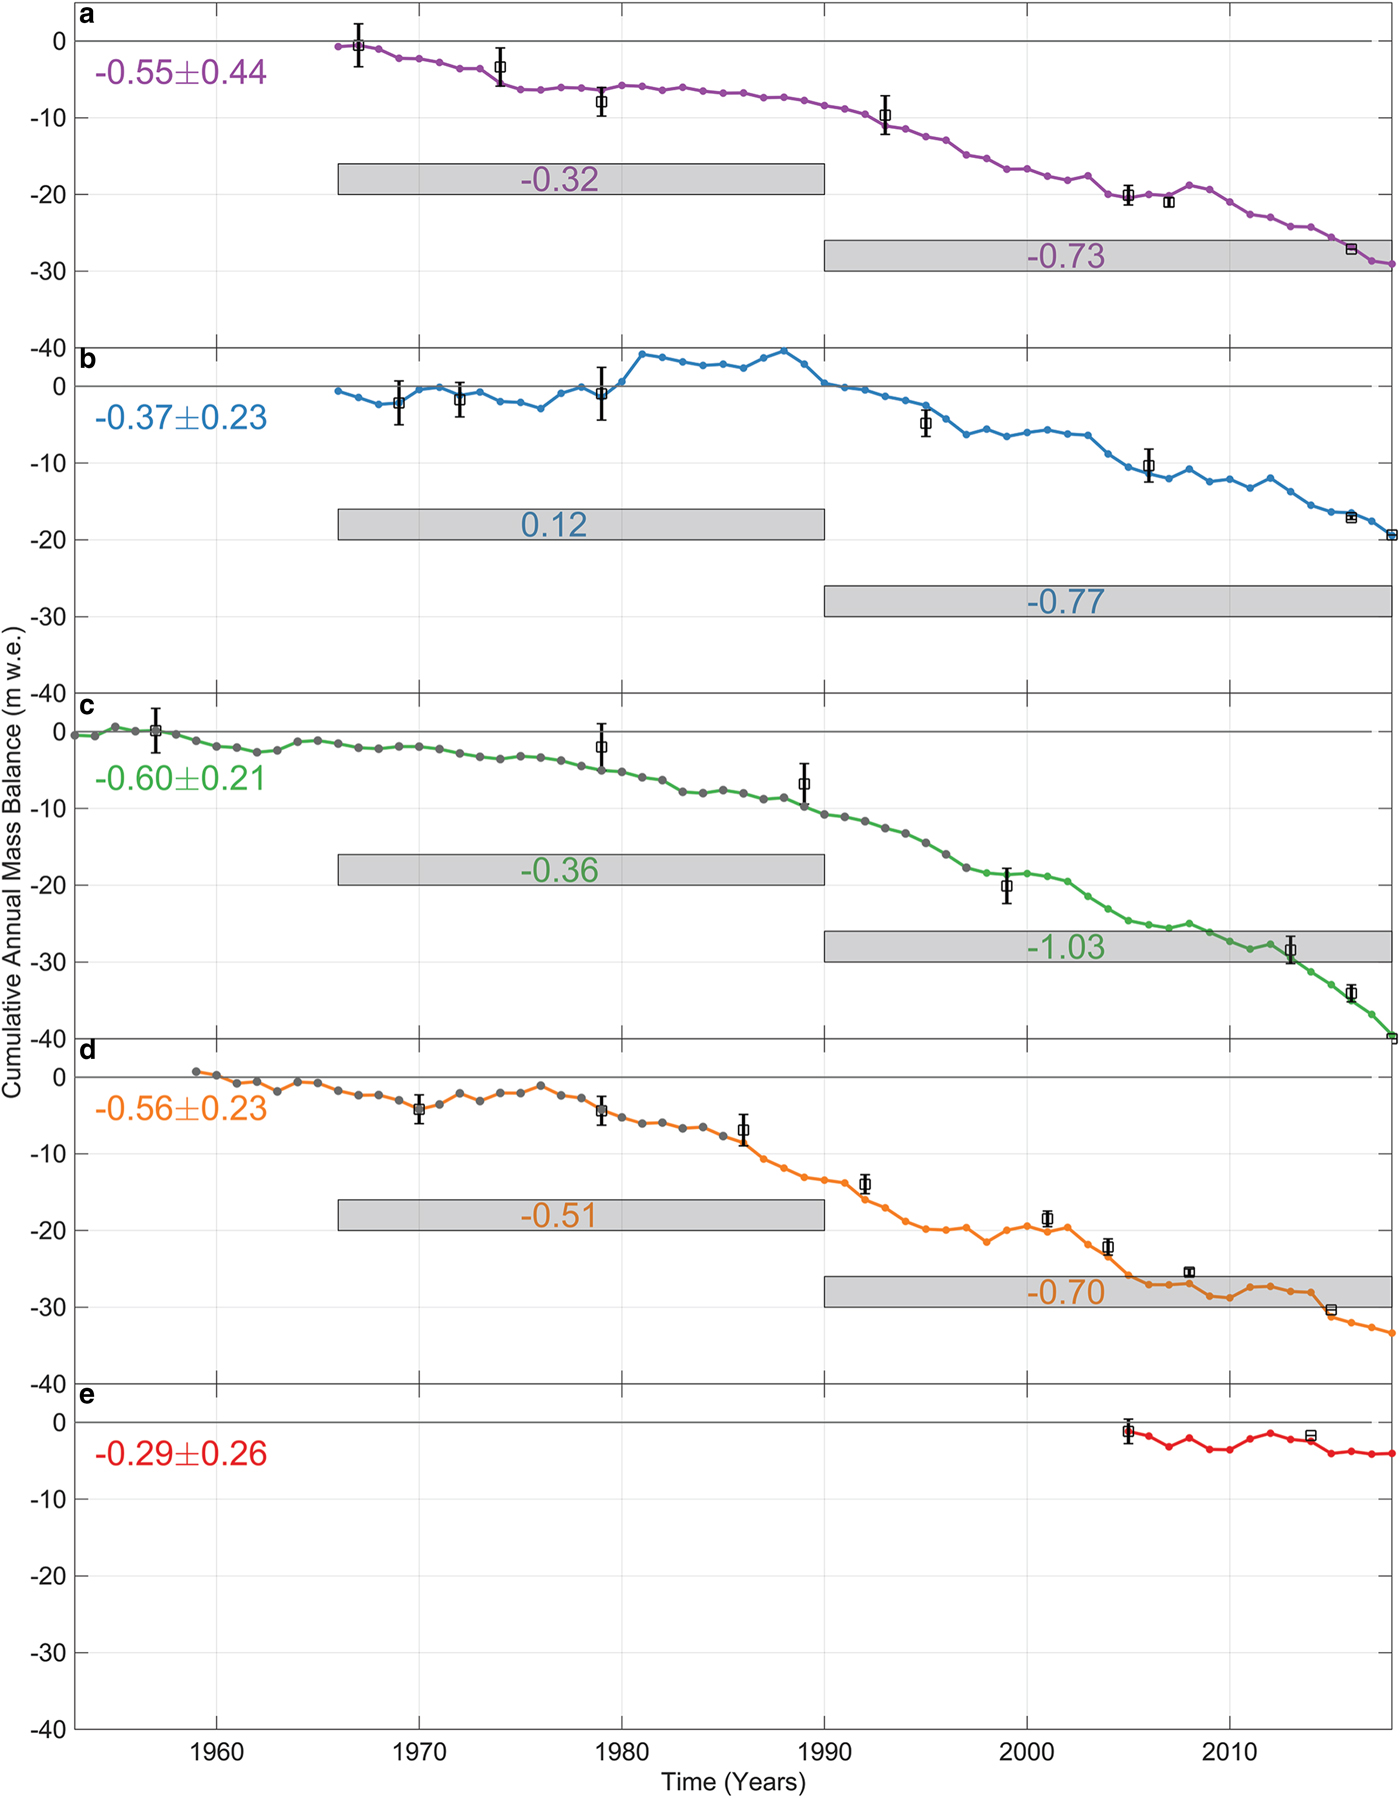
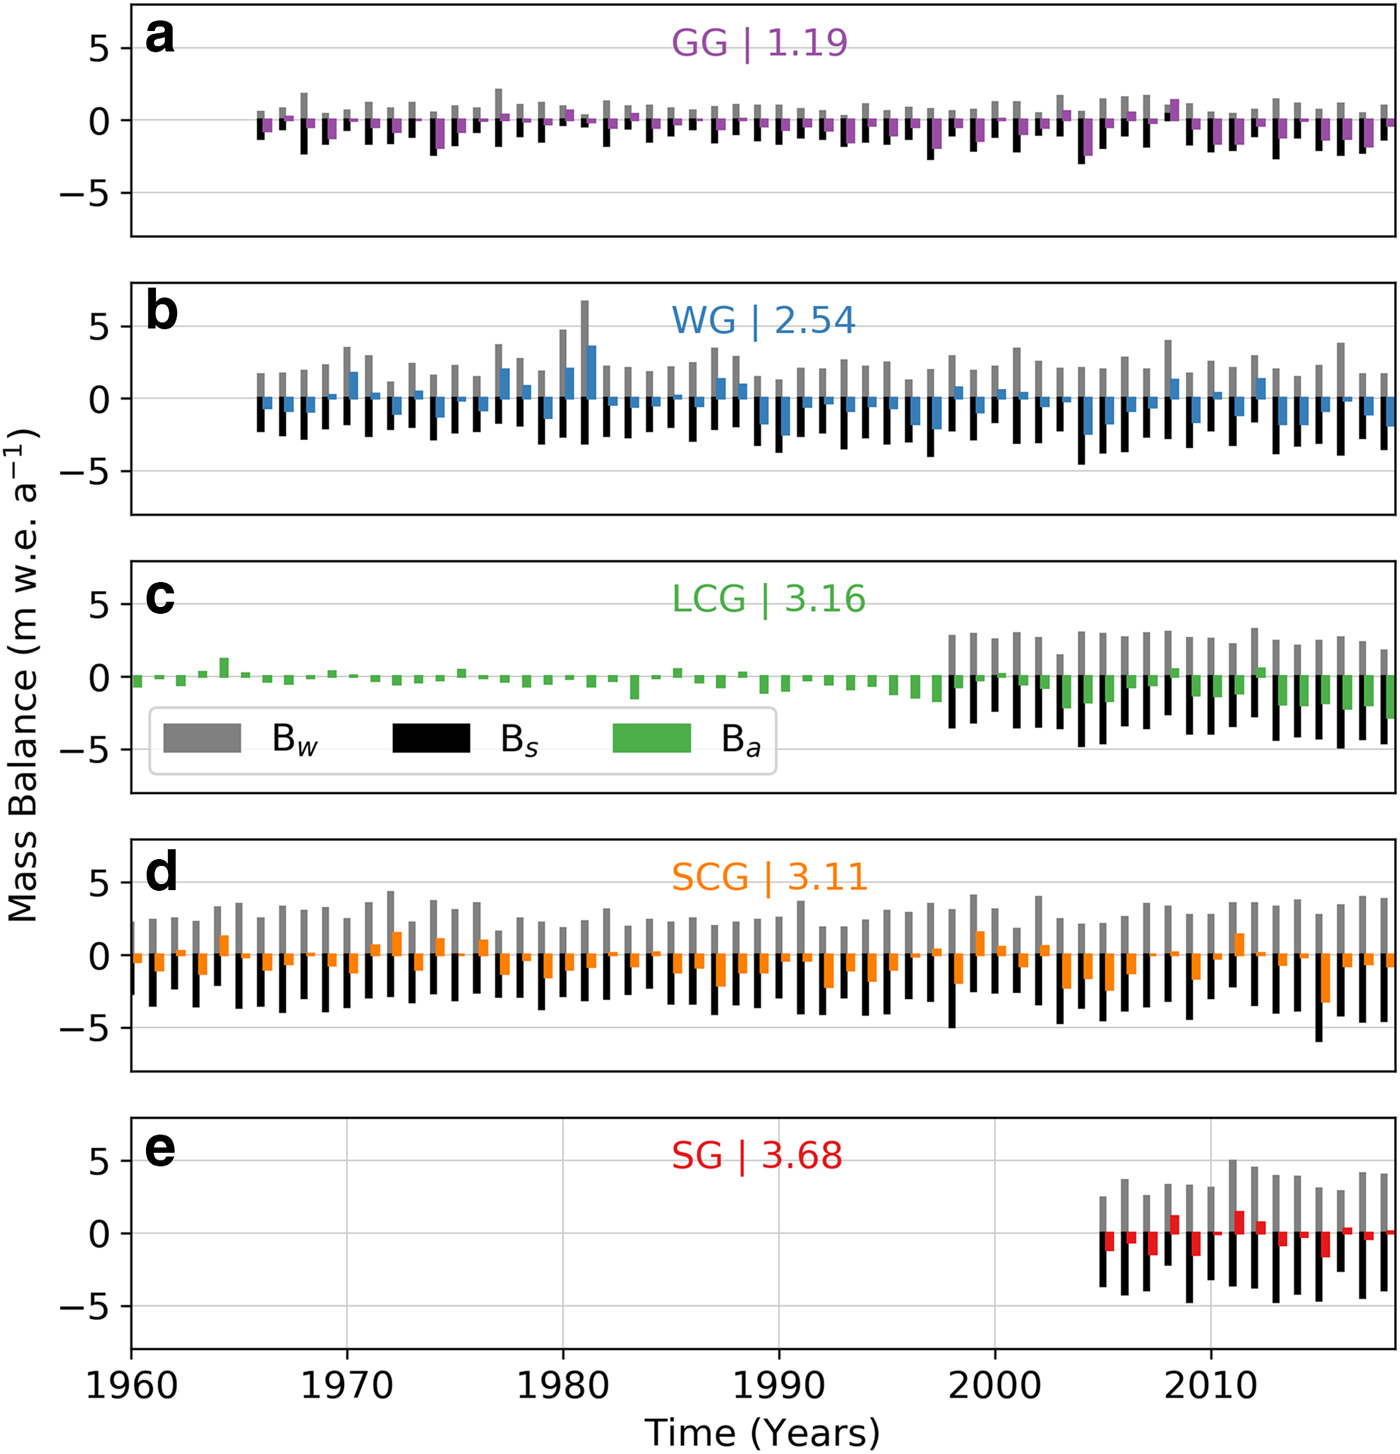
Mass loss at the benchmark glaciers over the study interval is ubiquitous (Fig. 4). Average mass loss rates range from −0.28 to −0.58 m w.e. a−1, with uncertainty ranging between ±0.22 and 0.42 m w.e. a−1 (Table 2). Averaged over their entire records, LCG exhibits the highest rate of mass loss and SG the lowest. Average rates calculated before and after 1990 (approximate midpoint) reveal that the rate of mass loss increased in all cases. Continental GG lost mass continuously through the study, whereas the maritime glaciers were initially closer to equilibrium conditions (Fig. 4). Figure 5 shows that annual mass balances are predominantly negative at all glaciers, especially in the latter half of the records. Mass turnover, as assessed via the average of seasonal balances (Fig. 5), can be categorized into continental (low turnover, 1.2 m w.e. a−1 for GG) and maritime classes (high turnover, e.g. 3.1 m w.e. a−1 for LCG). Annual balance variability, as quantified by the standard deviation (Fig. S8), ranges between 0.6 and 1.1 m w.e. a−1, and is lowest at LCG, and highest at WG, both of which are maritime climate settings. No progression in variability between the continental and maritime exists. Summer balance variability is equal to or exceeds winter variability except at WG, where winter balance variability exceeds summer.
Calibrated cumulative annual balance time series for each glacier. (a) Gulkana, (b) Wolverine, (c) Lemon Creek, (d) South Cascade and (e) Sperry glaciers. Black symbols with error bars show geodetic mass-balance estimates as estimated with Eqn (7). For LCG and SCG grey dots indicate where pre-existing records were spliced to reanalyzed data. The annotated value on the left is the mean balance rate and uncertainty over the entire interval, and pre- and post-1990 mean values are highlighted with grey bars that are not linked to the y-axis.
Reanalyzed results presented as seasonal (Bs, Bw) and annual (Ba) mass balance. (a) Gulkana, (b) Wolverine, (c) Lemon Creek, (d) South Cascade and (e) Sperry glaciers. Time-averaged mass turnover (m w.e. a−1), expressed as the absolute value of the mean of the winter (black) and summer (gray) balances, are annotated in color for each panel.
Solution uncertainty partitioned into annual balance (N s) and volume change (σ g) components
Total reflects the characteristic uncertainty for each glacier through the combination of the two components.
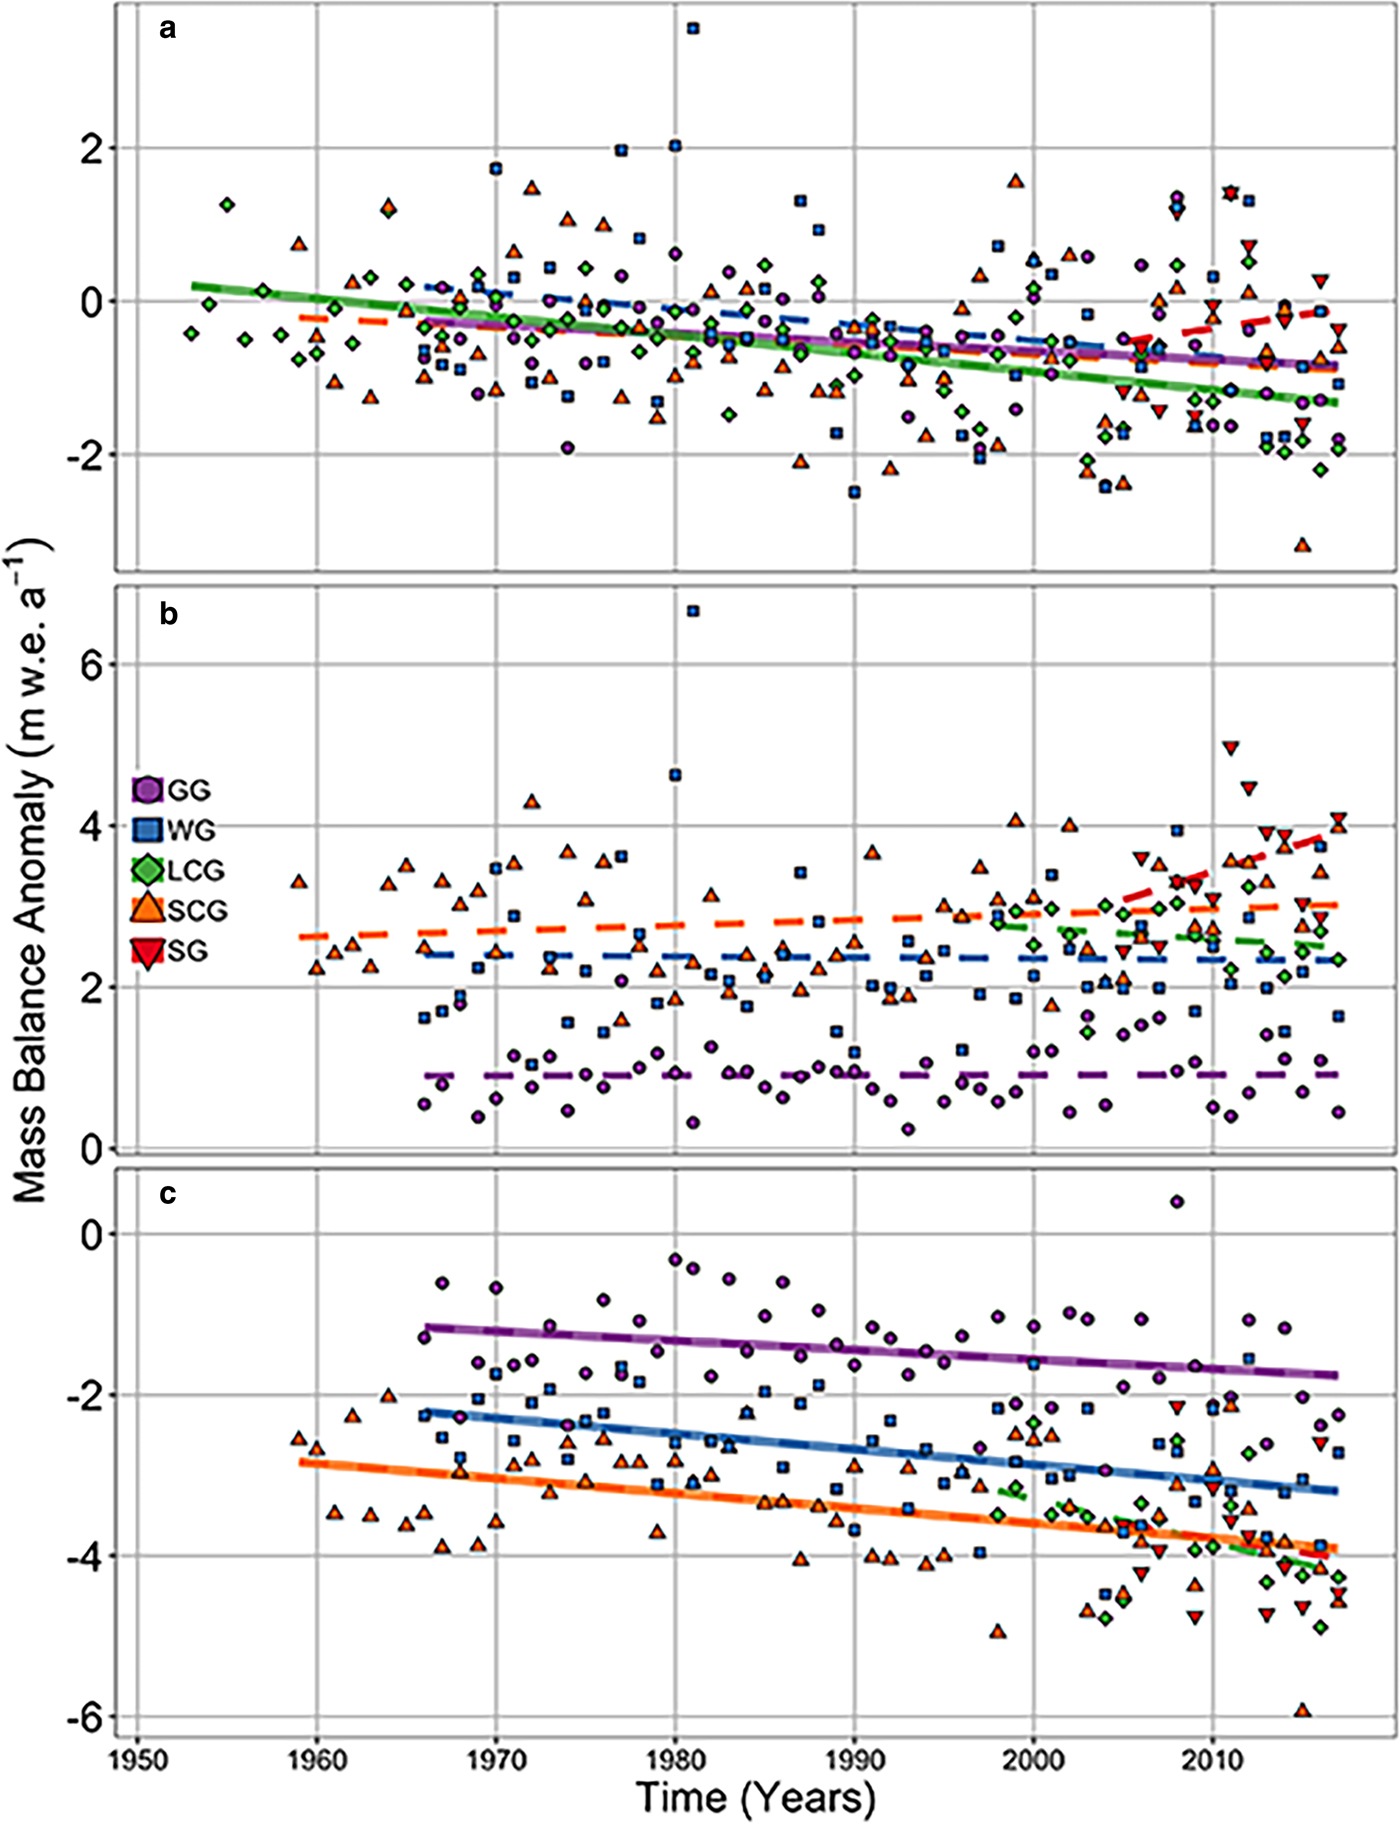
Annual balances exhibit field-significant (α = 0.10, or 90% confidence) negative trends for all but SG, and trends at GG and LC are 95% confident (Fig. 6a and Table S11). Winter balance trends exhibit variable slopes and sign, and none are significant (Fig. 6b). Statistically significant trends in summer balance exist at GG, WG and SCG (Fig. 6c). Temperature data used in this analysis show long-term summer and annual-averaged warming trends (Fig. 7), offering a mechanistic explanation for mass-balance trends and the relatively high correlations between summer and annual balances (Table S12). Confidence in precipitation data is inadequate to interpret trends in any detail.
Glacier-wide mass-balance anomaly (linearly detrended, as described in Section 4.4) time series. (a) annual balance anomaly (b) winter balance anomaly (c) summer balance anomaly. Dots represent individual values, and lines least-squares fits. Solid lines represent statistically significant trends at 95% confidence levels as evaluated with the two-sided t-test.
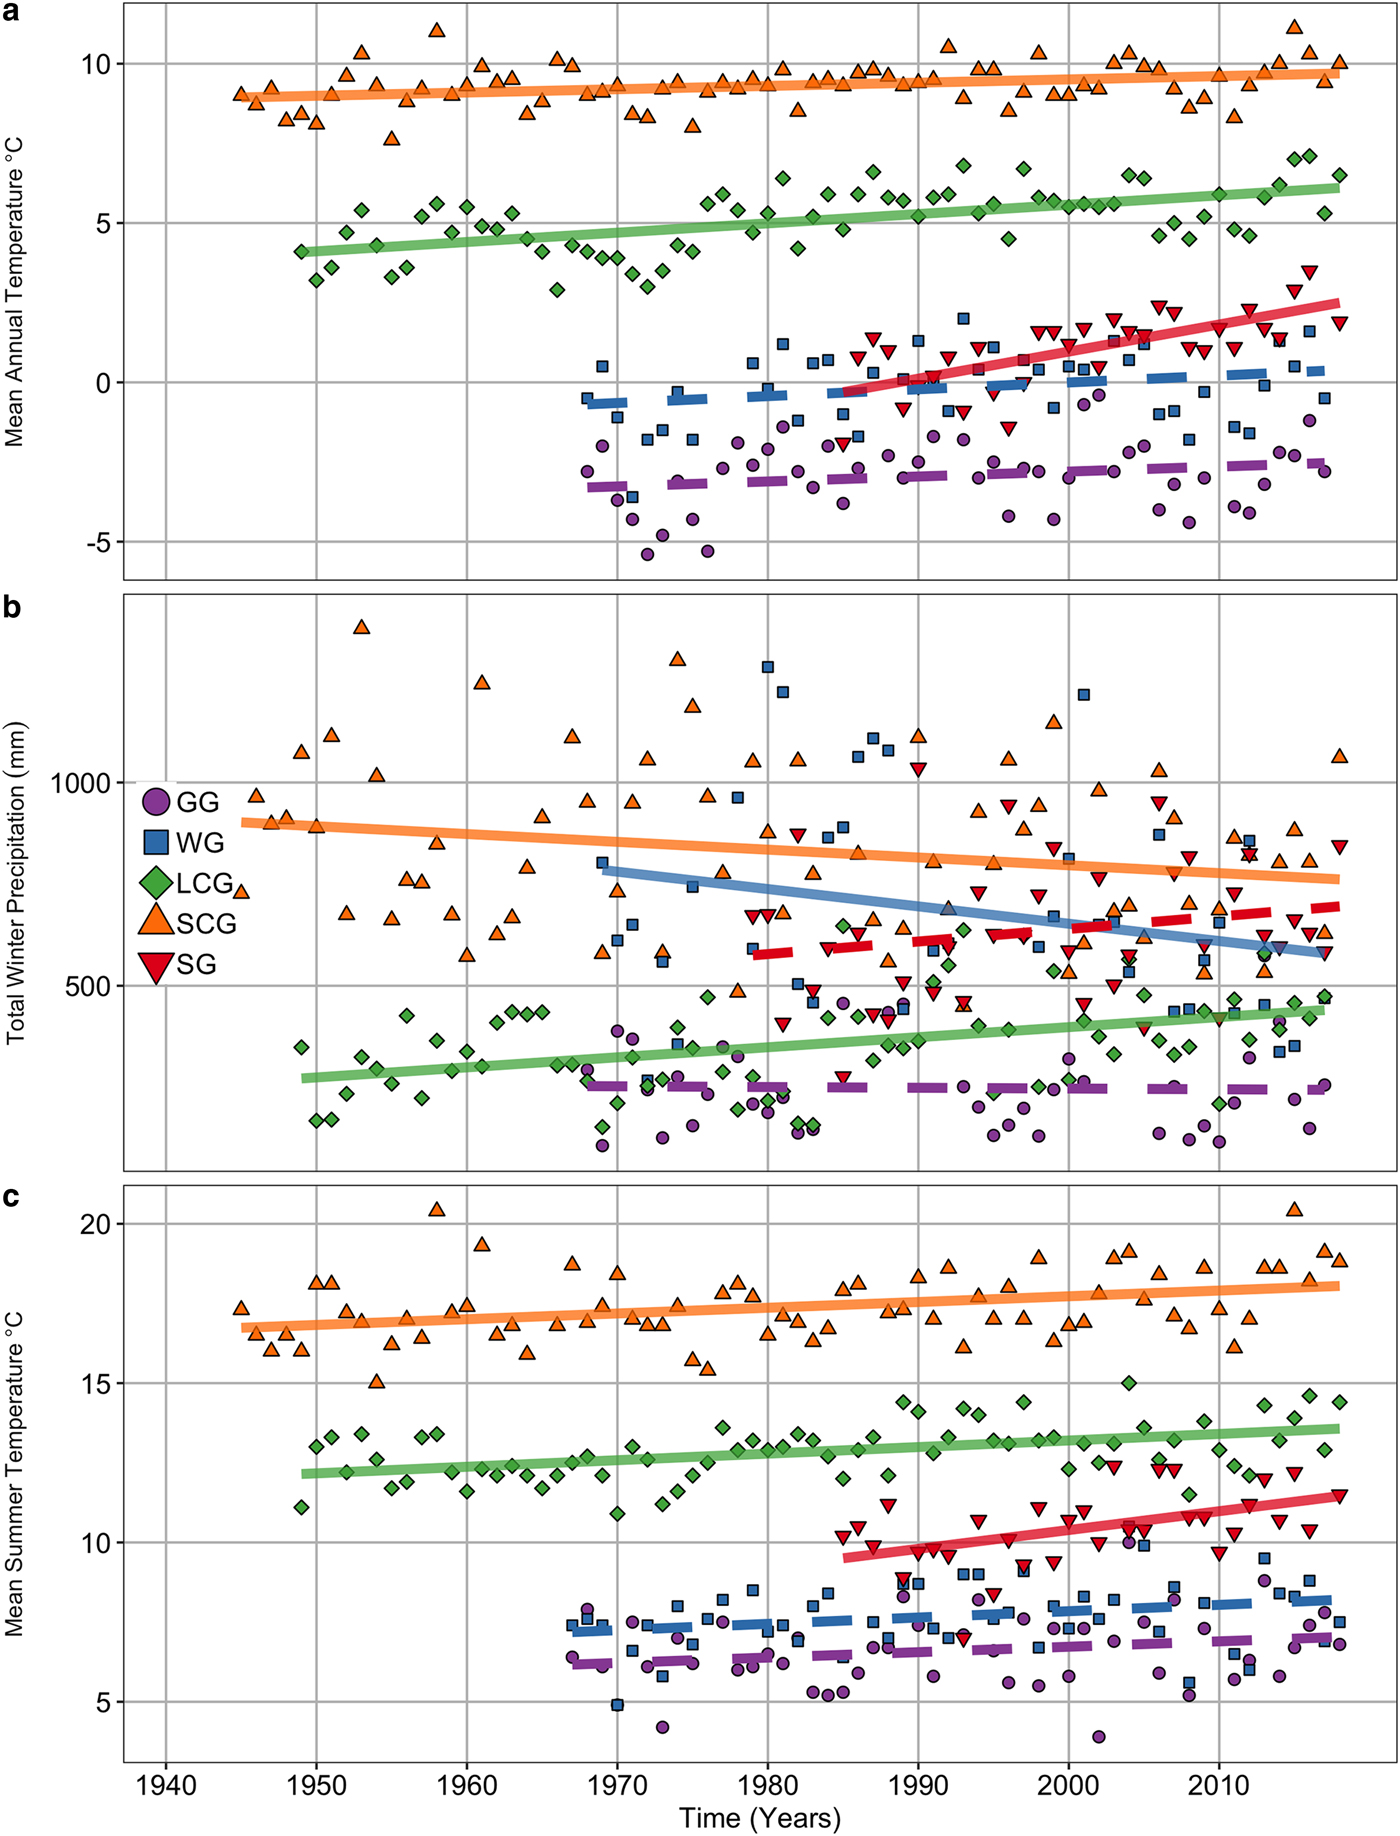
Meteorological trends at weather stations used in the reanalysis. (a) Mean annual temperature (°C). (b) Total winter (November–March) precipitation (mm) and (c) ablation season (May–September) temperature (°C). Data representing South Cascade Glacier are from Diablo Dam weather station; Lemon Creek Glacier is represented by Juneau Airport; Sperry Glacier by Flattop Snotel. Solid lines are indicative of significant trends, as evaluated with the modified Mann-Kendall test.
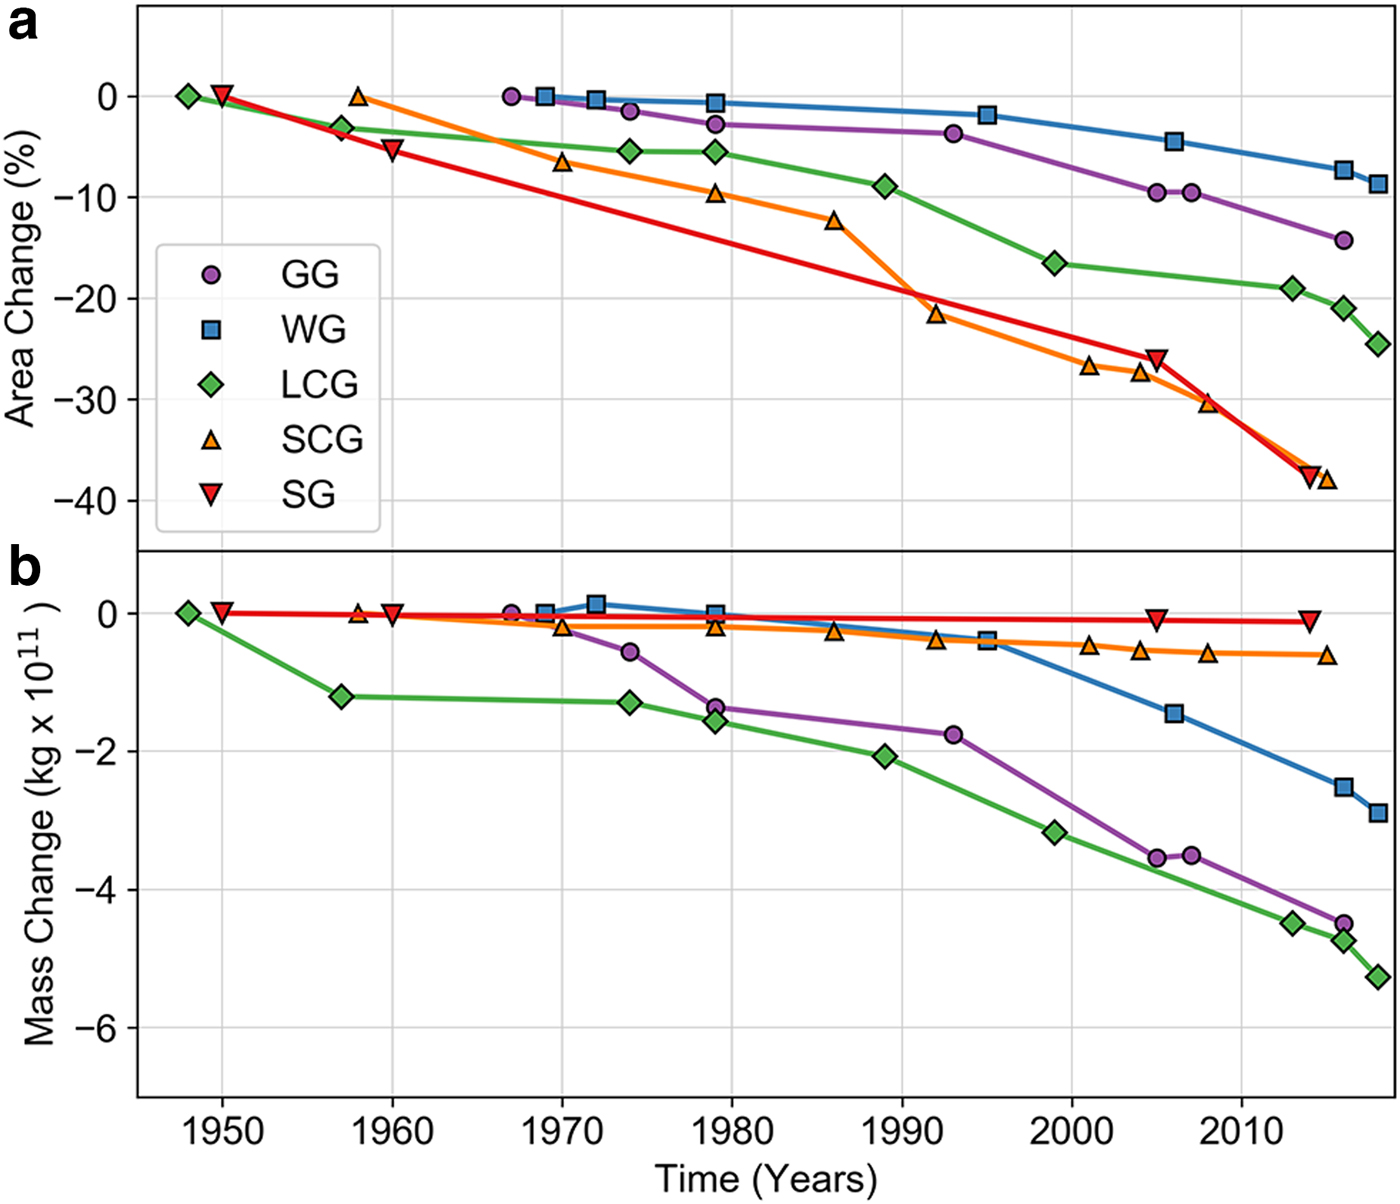
All five of the glaciers lost area over the study interval (Fig. 8a), with fractional area losses generally increasing from north to south (Table 1). However, area losses do not track with absolute mass change (Fig. 8b). For example, LCG lost <30% of its area yet lost the most mass of any benchmark glacier during the period of record.
(a) Fractional area change, expressed as a percentage of the initial glacier area. Initial year varies by glacier. (b) Absolute mass change, as determined geodetically.
5.2 Sensitivity and uncertainty
Total uncertainty consists of a component related to geodetic mass balance and a component related to the direct glaciological mass balance. The uncertainty in the geodetic calibrations varies between ±0.1 and 0.2 m w.e. a−1, and this term is dominated by time system adjustments (which average 25 days). Uncertainty in the direct approach is estimated using N s for glacier-wide annual balance, which ranges between 0.1 and 0.4 m w.e. a−1. This metric reflects solution sensitivity to the various combinations of the extrapolation and calibration methods. Total uncertainty estimates average ~0.2 m w.e. a−1, except at GG, which has a higher uncertainty of 0.44 m w.e. a−1 (Table 2).
6. Discussion
Long-duration glacier mass-balance records offer insight into long-term changes in climate from forcing and response perspectives (Pepin and others, Reference Pepin2015; Medwedeff and Roe, Reference Medwedeff and Roe2017). They provide valuable observational constraints for climate, hydrological and Earth system models (Beamer and others, Reference Beamer, Hill, Arendt and Liston2016; Huss and Hock, Reference Huss and Hock2018). However, loosely standardized computation and/or analysis methods impede interpretations of the often-complex relationship between glaciers and climate. Advances in understanding of mass-balance processes, technology and numerical methods improve our capability to assess glacier mass balance, but also require careful and consistent application to avoid introducing further bias and/or scatter within or among historical records. To address these problems, we reanalyzed USGS Benchmark Glacier datasets, with attention to tightened temporal consistency, solution sensitivity and comparability. Our work reinforces the necessity of geodetic calibration (e.g. Zemp and others, Reference Zemp2013), illustrates the impact of elevation-independent mass-balance drivers and offers insight into broad spatial and temporal patterns of glacier change.
6.1 Glacier-wide solutions
Traditionally, the primary goal of glacier mass-balance programs is to reduce multiple forms of measurement into a single number representing glacier-wide average mass balance. This simple output facilitates subsequent use of the data (e.g. by the sea-level rise or decision-making communities), but tends to mask key assumptions and uncertainties required during formulation. This reanalysis was designed to provide exact, data-driven understanding of these aspects of mass balance.
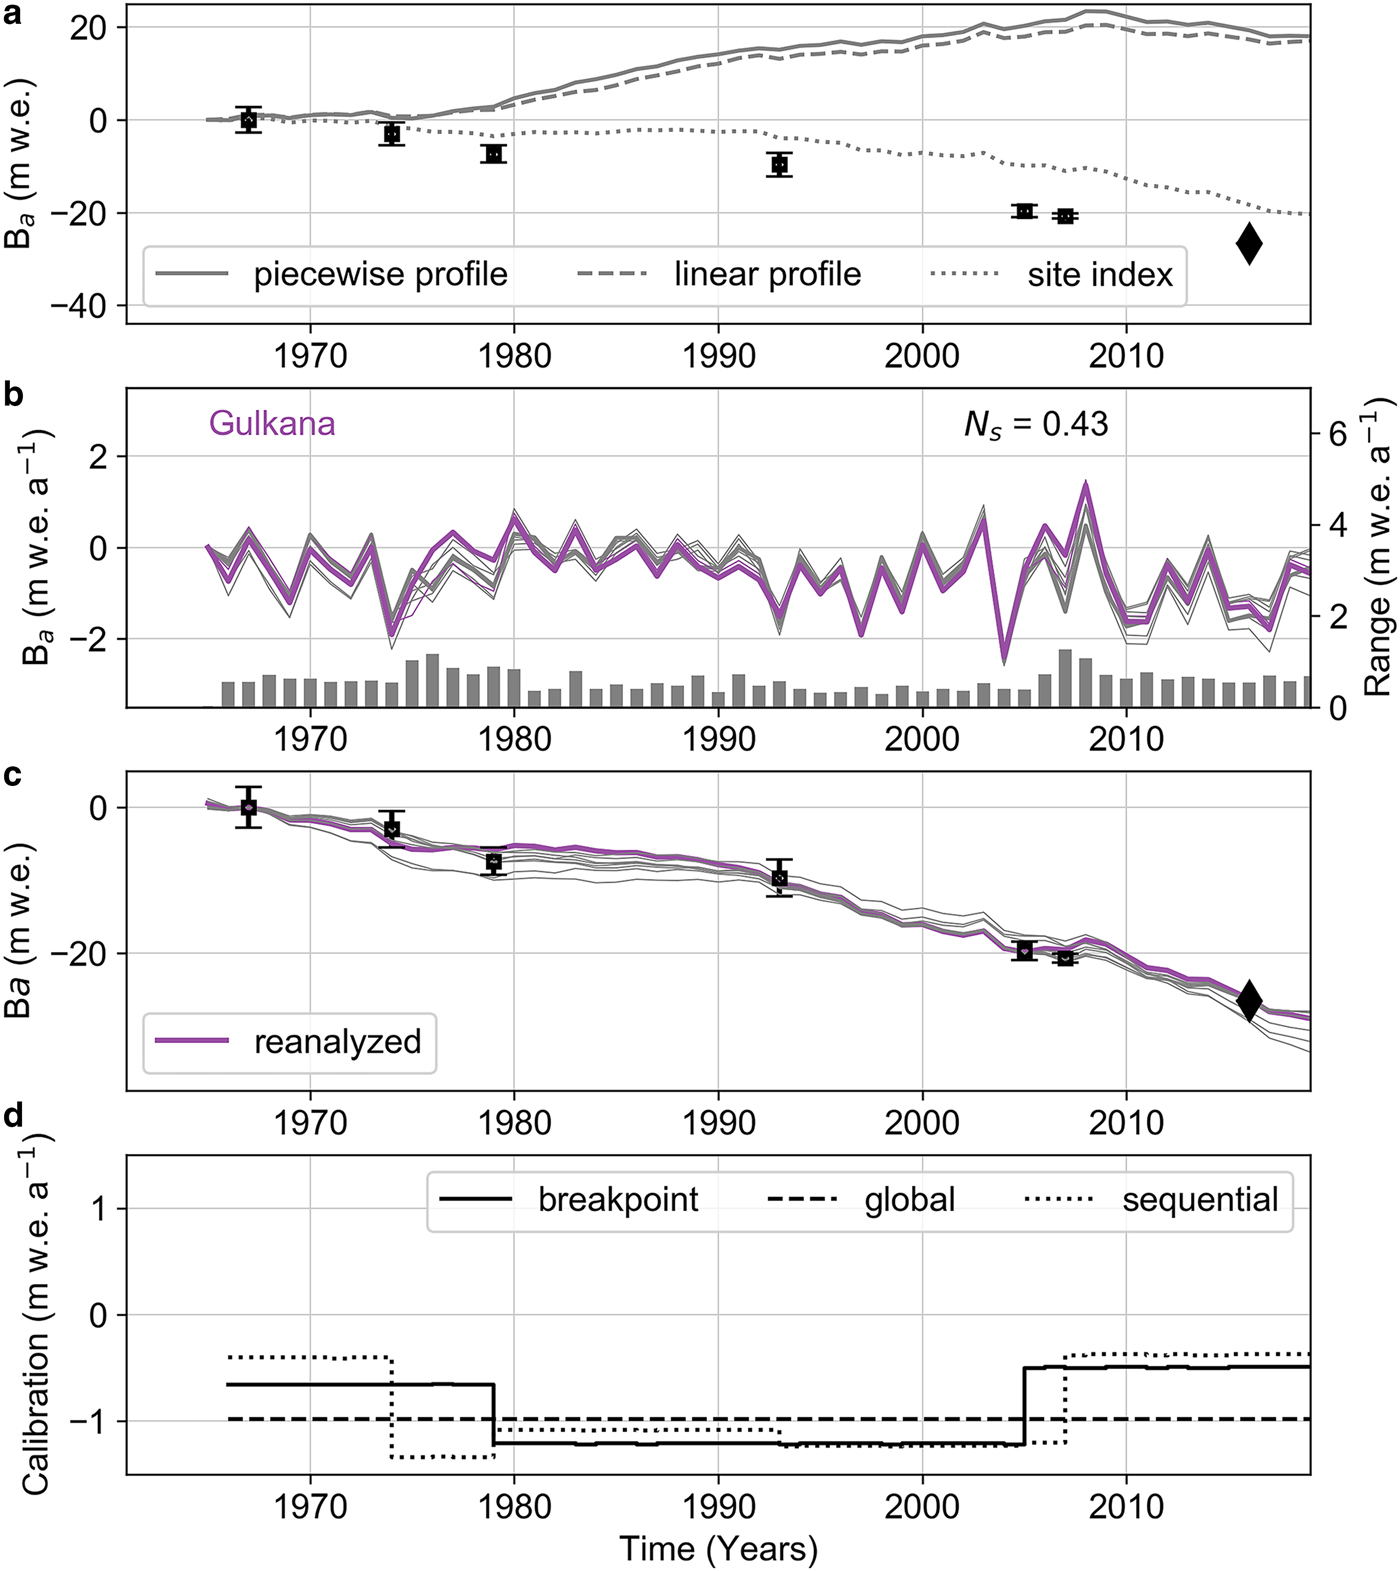
Figure 9a shows that uncalibrated solutions vary broadly at GG, and diverge from geodetic balances in excess of uncertainty, demonstrating the need for calibration prior to evaluating trends. The apparent ability of the site-index method to outperform the profile approach is largely an artifact of the maximally sparse stake networks that were used over the majority of the time series and the way this approach caps (instead of extrapolates) the mass-balance rate at the upper measurement site (Fig. 9a). Annual balance solution variants (Fig. 9b) show similar patterns of interannual variability, which do not appreciably influence the goodness-of-fit in the calibration process (Fig. 9c). Results for the other benchmark glaciers are provided in Figs S9–S12. Given the lack of observational constraints over the upper regions of balance profiles and the greatly reduced uncertainty of historic DEMs following SfM re-processing, we chose not to adjust (beyond fitting) balance profiles (e.g. clipping of the upper tail) to improve agreement with geodetic results. Rather, we apply systematic fits to point balance data and allow the geodetic calibration process to resolve biases between the time series (Cox and March, Reference Cox and March2004; Thibert and Vincent, Reference Thibert and Vincent2009).
Sensitivity test results for GG. (a) Uncalibrated solutions according to different balance profile fitting methods. Geodetic mass-balance results (black squares, black error bars) plotted with the year of the reference DEM indicated (black diamond). (b) Preferred reanalyzed solution for annual mass balance (colored line) compared to other calibrated solution variants (gray lines). The range between these nine solutions for every year in the reanalysis time series is shown as gray bars keyed to the secondary y-axis. (c) Calibrated cumulative mass balance for the preferred reanalyzed (colored line) and other solutions. (d) Geodetic calibration coefficients for the breakpoint (solid black line), global (dashed black line), and sequential (dotted black line) methods. Other glaciers presented in Figs S9–S12.
Although the increased availability of high-resolution geodetic data fuels a desire to difference DEMs over shorter and shorter intervals, confidence in geodetic mass balance decreases proportionally to the differencing interval. Errors arising from co-registration relate solely to the quality of DEM alignment but are amortized over the difference interval, such that long intervals minimize uncertainty. Errors arising from the volume-to-mass conversion (i.e. glacier thinning/thickening) relate to limits in our understanding of near-surface material density variability across the glacier. Material density is commonly specified as a constant (850 ± 60 kg m−3; Huss, Reference Huss2013), thus this uncertainty scales with volume change. Realistically, this uncertainty should scale with the fraction of the observed volume change attributable to firn or snow. In many cases this fraction will be inversely proportional to the DEM difference interval, suggesting that over short intervals, this formulation is likely to underestimate true uncertainty (e.g. Klug and others, Reference Klug2018). In contrast, material density is better constrained for large volume changes (generally longer intervals), and the uncertainty is likely to be overestimated (Huss, Reference Huss2013). Improved understanding of temperate glacier firnification processes is essential to constrain volume conversion to mass, especially as differencing intervals continue to shorten.
Until a comprehensive firn-densification model is developed, we suggest that these errors can be reduced using fitted calibrations applied over optimal (decadal) time intervals. For example, given the nominal case of a 50-year mass-balance record with 10 DEMs acquired more frequently in the last 20 years, a global calibration distributes a single correction uniformly across the time series, regardless if measurement networks, balance rates or glacier geometry undergo significant change. Sequential calibration represents an opposite end-member, distributing corrections stepwise for every available geodetic mass balance, where large density errors may alias geodetic balances over the recent sub-decadal differencing intervals (Fig. 9d and Fig. S10d). The breakpoint calibration offers a compromise to these two end-member approaches, maximizing the incorporation of geodetic data, while also minimizing impacts of the evolving relationship between glaciological and geodetic balances.
All of the USGS Benchmark Glaciers required geodetic calibration, which resulted in small changes to recently published values (e.g. O'Neel and others, Reference O'Neel, Hood, Arendt and Sass2014; Le Bris and Paul, Reference Le Bris and Paul2015; Clark and others, Reference Clark, Fagre, Peitzsch, Reardon and Harper2017; WGMS, 2017; Florentine and others, Reference Florentine, Harper, Fagre, Moore and Peitzsch2018). At four of the five glaciers in this study, geodetic balances are more negative than their direct glaciological counterparts (Fig. 9 and Figs S9–S12), suggesting a consistent tendency for direct observation networks to underestimate ablation (or overestimate accumulation) across the suite of glaciers. These results strongly support the concept that uncalibrated mass-balance solutions will possess bias unless an independent geodetic assessment shows otherwise (Krimmel, Reference Krimmel1999; Cox and March, Reference Cox and March2004; Huss and others, Reference Huss, Bauder and Funk2009; Zemp and others, Reference Zemp2013).
The mismatch between direct and geodetic time series is common but remains poorly understood. Perhaps the most commonly suggested driver for the mismatch is internal or basal mass balances (Cogley and Adams, Reference Cogley and Adams1998; Zemp and others, Reference Zemp2013; Andreassen and others, Reference Andreassen, Elvehøy, Kjøllmoen and Engeset2016). However, at the benchmark glaciers, estimates for these processes are <0.06 m w.e. a−1, and constitute only ~15% of the average calibration (Table S10), suggesting alternative processes drive the mismatch.
6.2 Elevation dependence
The balance profile method has become standard for extrapolating point observations over the glacier area (Beedle and others, Reference Beedle, Menounos and Wheate2014; Barandun and others, Reference Barandun2015; WGMS, 2017). The central tenet of this method is that elevation provides a higher-order control than local effects such as snow redistribution, topographic shading or surface features in glacier-wide mass-balance estimates. Local effects are unlikely to be captured by logistically feasible measurement networks, and are often assumed to be negligible. However, the frequent divergence between geodetic and direct mass balances suggests that important processes elude the elevation-based parameterization.
At WG, ~20 m amplitude drift and scour patterns characterize ~20% of the accumulation zone (Fig. 10a; McGrath and others, Reference McGrath2018). Safety and logistical practicalities prohibit the routine collection of a distributed set of measurements from this region, precluding an estimate of average mass within this region of extreme local variability. Sub-annual DEM analyses on glaciers may help to reveal and resolve the complex spatial patterns in snow accumulation, but require extensive, typically unavailable, data to constrain sub-annual changes in surface elevation and its partitioning into components driven by ice flow, changes in material density and mass-balance processes (Sold and others, Reference Sold2013).
Orthophotos produced from Worldview imagery acquired on (a) Wolverine Glacier, 12 September 2018 and (b) South Cascade Glacier, 14 October 2015 with insets showing the full glacier extent. Both photos illustrate elevation-independent accumulation variability.
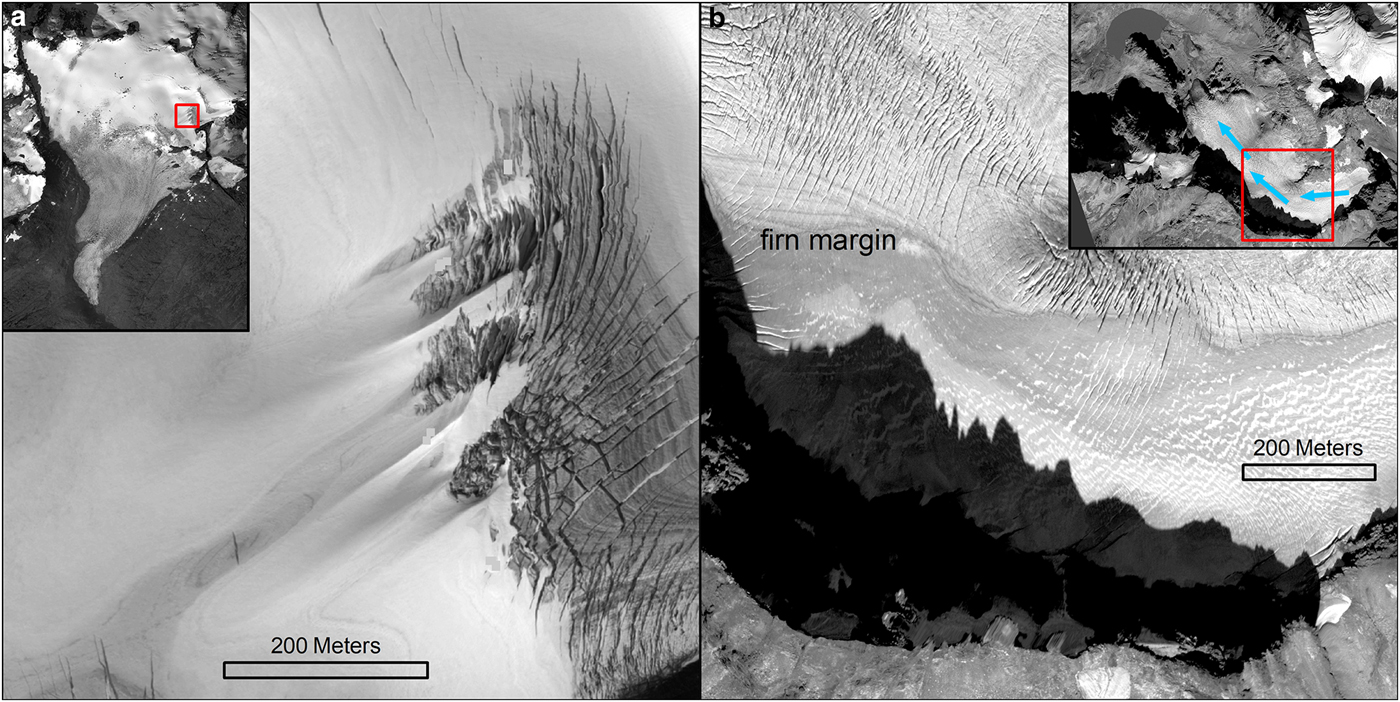
At SG, avalanching constitutes a primary snow accumulation process, yet avalanche input is irregularly recorded by the measurement network, which can alter winter balance estimates in both directions (Clark and others, Reference Clark, Fagre, Peitzsch, Reardon and Harper2017). The steep headwalls serving as avalanche source regions during winter also provide topographic shading during the ablation season, resulting in an inverted summer balance profile and a larger mass turnover rate than expected from regional climate forcing (Figs 3, 5 and Fig. S6). Roughly 80% of the local forcing can be attributed to augmentation of the accumulation budget and 20% to the ablation budget by shading (Florentine and others, Reference Florentine, Harper, Fagre, Moore and Peitzsch2018). As shown in Figure 10b, SCG displays similar local controls; spatial distributions of firn align with shading patterns along the glacier margin rather than with elevation. Finally, crevasse fields and icefalls increase surface roughness and area-volume ratios, and in turn melt rates via changes to turbulent and latent heat fluxes (Colgan and others, Reference Colgan2016). One such example is found in the icefall between sites AU and N at WG (Fig. 1c) where ablation rates measured within a 15 m elevation range differ by more than 3 m w.e. (Fig. S5). Although hazards present in icefalls tend to dissuade direct observations, the enhanced melt occurring in such areas may be essential to include in glacier-wide balance estimates.
Measurement networks rarely span the entire elevation range of a glacier, which can markedly influence the slope of the balance profile (Fig. 3 and Fig. S4), and may consequently explain a substantial fraction of the divergence between direct and geodetic cumulative balances. For example, Figure 9a shows the 1967–2018 uncalibrated cumulative balance at GG reaches +20 m w.e. whereas the calibrated value is ~−30 m w.e. Efforts can be made to constrain the profile, either by imposing limits on mass-balance rate (e.g. Sold and others, Reference Sold2016), or by using short-term (1–3 years) expanded measurement networks (i.e. stakes, pits, GPR, DEMs) to sample logistically challenging regions of the glacier. However, incorporation of short-term results into long-term programmatic efforts can introduce additional bias over earlier intervals of the record, instead of reducing overall modern biases. Expanded measurement networks help to understand processes driving mass-balance variability and trends (e.g. McGrath and others, Reference McGrath2018), which can subsequently be used to adjust measurement networks, especially if calibration breakpoints are established at a similar time (e.g. GG, 1974; Fig. 9b). Periods of overlap between old and new measurement networks are essential to fully understand changes in bias resulting from changing the network geometry.
For example, expanded measurement networks and GPR analyses at GG and WG suggest that the long-term measurements underestimate accumulation (McGrath and others, Reference McGrath2018). Yet the same expanded networks and the geodetic calibrations suggest that the historically sparse networks underestimate ablation. Indeed, negative geodetic calibrations prevail in existing reanalyses worldwide, with roughly two-thirds of reanalyses producing more negative geodetic balances (Zemp and others, Reference Zemp2013; Andreassen and others, Reference Andreassen, Elvehøy, Kjøllmoen and Engeset2016; Klug and others, Reference Klug2018), suggesting widespread neglect of important ablation processes. Our calibration coefficients (9 of 13 are negative) corroborate this tendency for glaciological mass-balance estimates to have positive bias (Table S10).
These examples highlight processes that result in mass-balance anomalies where safety or logistical factors challenge measurement via direct observation networks. This problem is not unique to the USGS Benchmark Glacier reanalysis; many of the long-term mass-balance records globally are drawn from glaciers with similar logistical challenges and hazards (e.g. WGMS, 2017). A measurement network with a truly random and adequate spatial distribution to accurately capture mass balance directly without a geodetic calibration would be cost-prohibitive at most glaciers (e.g. Cogley and Adams, Reference Cogley and Adams1998), underscoring the limitations of measurement networks and the absolute necessity for geodetic calibration.
6.3. Glacier–climate interactions
Glaciers help to inform many aspects of Earth's changing climate system by integrating climate processes over basin scales and filling high-elevation knowledge gaps (McAfee and others, Reference McAfee, Walsh and Rupp2013; Pepin and others, Reference Pepin2015; Medwedeff and Roe, Reference Medwedeff and Roe2017). The Benchmark Glacier reanalysis provides an opportunity to assess how traditional glacier-climate paradigms are evolving under ongoing atmospheric warming. For example, do mass changes at maritime glaciers remain linked to winter precipitation and continental glaciers to summer temperature forcings (e.g. McCabe and Fountain, Reference McCabe and Fountain1995; Hodge and others, Reference Hodge1998)?
Our results do not show latitudinal patterns (e.g. south-to-north gradient) in balance rates. Rather continentality exerts a stronger influence on mass balance (Fig. 5). Historically, the maritime (WG, LCG, SCG) glaciers, buffered by abundant snow and cooler summers, exhibited reduced mass loss rates. Compared to earlier analyses, we found increasingly strong correlations between summer and annual balances at all the glaciers (Table S12), regardless of continentality (Hodge and others, Reference Hodge1998; Josberger and others, Reference Josberger, Bidlake, March and Kennedy2007; O'Neel and others, Reference O'Neel, Hood, Arendt and Sass2014). Meteorology and mass-balance time series show significant trends for ablation season processes (Figs 6 and 7). Trends in precipitation are less robust due to snow undercatch issues, especially in the windy conditions that characterize the alpine environment (Kochendorfer and others, Reference Kochendorfer2017), but suggest a non-uniform role for precipitation forcing. Precipitation trends are negative (or the environment is becoming windier) at SCG and WG, while LCG, despite exhibiting the most negative mass-balance trend, is experiencing an increase in winter snow (Fig. 7b). Together, these analyses suggest that increases in ablation processes serve as the primary driver of mass loss at all benchmark glaciers, in agreement with recent global and regional assessments of mass balance (Zemp and others, Reference Zemp2015; Box and others, Reference Box2018). In Alaska, warming trends recorded at the benchmark glaciers are of lower magnitude than at low-elevation stations, which is likely reducing mass loss rates compared to regions with elevation-dependent warming (Bieniek and others, Reference Bieniek, Walsh, Thoman and Bhatt2014). This observation contrasts elevation-dependent warming trends known to be occurring in midlatitude mountains (e.g. Pepin and others, Reference Pepin2015; Palazzi and others, Reference Palazzi, Mortarini, Terzago and von Hardenberg2019). As warming continues to increase the fraction of precipitation falling as rain, we expect further increases to mass loss rates from the maritime glaciers due to reductions in snow accumulation and associated processes (e.g. albedo feedback; McAfee and others, Reference McAfee, Walsh and Rupp2013; McGrath and others, Reference McGrath, Sass, O'Neel, Arendt and Kienholz2017).
Regional climate only partially controls surface mass balance. Microclimate, calving, albedo, debris cover, ice thickness and glacier geometry all modify the relationship between glacier-wide mass balance and regional climate (e.g. Colgan and others, Reference Colgan2016; McGrath and others, Reference McGrath, Sass, O'Neel, Arendt and Kienholz2017; Florentine and others, Reference Florentine, Harper, Fagre, Moore and Peitzsch2018). Many of these factors influence the benchmark glaciers, though our understanding of their significance remains largely qualitative. For example, SCG retreated into an overdeepened basin in the 1920s, forming a lake. Subsequent calving increased mass loss rates through ~1970. At SG, local processes largely govern the mass balance (Figs 3, 5 and Fig. S6), as seen at other cirque glaciers (DeBeer and Sharp, Reference DeBeer and Sharp2009; Haugen and others, Reference Haugen, Scambos, Pfeffer and Anderson2010; Carturan and others, Reference Carturan2013). As the microclimate of the cirque has become increasingly important, the influence of regional climate diminished, thus slowing SG's eventual demise (Florentine and others, Reference Florentine, Harper, Fagre, Moore and Peitzsch2018). Figure 8 shows each glaciers' area change as a function of time, revealing the expected size dependency of glacier area change. The data also demonstrate a clear disconnect between mass change and areal extent, a further caution against the use of area or length as proxy measures for mass balance (Roe and O'Neal, Reference Roe and O'Neal2009; Roe, Reference Roe2011; Bahr and others, Reference Bahr, Pfeffer and Kaser2015). All USGS Benchmark Glaciers experienced accumulation area reductions over the study interval. As the ELA rises, the overall albedo value decreases because more of the surface is bare ice and therefore darker, which drives a positive feedback with the mass balance (Yde and Paasche, Reference Yde and Paasche2010; Naegeli and Huss, Reference Naegeli and Huss2017). Debris can further complicate this feedback, depending on whether it is thin and increases the ablation rate, or if it becomes thick enough to insulate the ice as it does near the terminus of GG (e.g. Pratap and others, Reference Pratap, Dobhal, Mehta and Bhambri2015).
Glacier thickness influences the rate at which glacier geometry can evolve, which determines the response time for the geometry to achieve equilibrium with climate (e.g. Jóhannesson and others, Reference Jóhannesson, Raymond and Waddington1989; Christian and others, Reference Christian, Koutnik and Roe2018). GG is in the process of dividing into two independent glaciers with different thickness profiles (Farinotti and others, Reference Farinotti2019) and thereby different response characteristics (Paul and others, Reference Paul, Kääb, Maisch, Kellenberger and Haeberli2004; Jiskoot and Mueller, Reference Jiskoot and Mueller2012). The terminus area fed by the west branch (sites X, W, T) retreated more than 1 km since 1993 and is in the process of fragmenting and disconnecting from the main trunk of the glacier. In contrast, the main trunk (sites B, D, V), characterized by lower surface slopes and overdeepened ice, has thinned but retreated only ~650 m. We expect continued retreat from the disconnecting lobe, which will likely contrast the overdeepened trunk that is more susceptible to altitude-mass-balance feedbacks, as observed across other low-sloping Alaska glaciers (Sass and others, Reference Sass, Loso, Geck, Thoms and Mcgrath2017). This divergent response to the same climate highlights the complex nature of linkages among mass balance, glacier geometry, response time and regional climate forcing.
7. Conclusions
A consistent and comprehensive reanalysis of data from the USGS Benchmark Glaciers informed uncertainties, facilitated intercomparison and allowed insight into climate forcing of five North American glaciers. In agreement with other studies, our efforts underscore the importance of geodetic calibration to accurately assess mass-balance trends, and the irreplaceable ability of direct measurements to resolve processes driving glacier change.
Mass loss from the USGS Benchmark Glaciers is ubiquitous since measurements began, with an increase in the rate of mass loss since 1990 at four of the five glaciers. The exception is SG, where local controls, including avalanching and topographic shading, now influence mass balance more than regional climate. We observed no evidence of latitudinal influence on mass-balance rate but found an increasingly important role of summer balance in governing annual balance. The reanalysis revealed that elevation-independent processes (crevasses, shading, snow redistribution) provide important, often neglected, influence on glacier-wide mass balance. Reanalysis reduced uncertainty in annual glacier mass balance, increasing our confidence in deducing the rate at which glaciers are losing mass. Given current projections of continued summer warming (e.g. IPCC, Reference Stocker, Qin, Plattner, Tignor and Allen2013) and the decadal response times for mountain glaciers (Harrison and others, Reference Harrison, Elsberg, Echelmeyer and Krimmel2001; Christian and others, Reference Christian, Koutnik and Roe2018), we expect continued mass loss with potential for further acceleration in loss rates from the USGS Benchmark Glaciers, as well as the thousands of other glaciers in Western North America and Alaska. Improved resolution of mass-balance processes documented here is essential for developing physically accurate models and to better resolve linkages among glaciers, climate and ecosystems. As our confidence in our ability to resolve mass changes at glaciers increases, it opens a new and important layer of questions that address the wellbeing and function of our ecosystems and planet in a warmer future.
Supplementary material
The supplementary material for this article can be found at https://doi.org/10.1017/jog.2019.66.
Acknowledgements
Countless individuals helped with fieldwork and historical data reduction. We are particularly appreciative of program maintenance from Mark Meier, Bob Krimmel, Larry Mayo, Dennis Trabant and Rod March. Recently Adam Clark, Erin Whorton and Zach Miller provided invaluable assistance with field and data preparation. Thanks to the Juneau Icefield Research Program for data sharing, access and collaboration, in particular to Mauri Pelto for guiding us through the history of data collection by JIRP. Comments from Jack Kohler, Liam Colgan, Mike Loso and an anonymous reviewer greatly improved the manuscript. Funding for the work came from USGS under the guise of many programs throughout the years. Today, support is granted by the Land Resources Mission Area, Climate Research and Development Program. Any use of trade, firm, or product names is for descriptive purposes only and does not imply endorsement by the US Government.
Author contribution
The following authors Shad O'Neel (S0), Christopher McNeil (CM), Louis Sass (LS), Caitlyn Florentine (CF), Emily Baker (EB), Erich Peitzsch (EP), Dan McGrath (DM), Andrew Fountain (AF), Dan Fagre (DF), contributed to this work. Concept and design were done by SO, LS, CM; programming was done by CM, LS, CF, SO, EP, EB; formal analyses by LS, CM, CF, SO, EP, DM; validation was done by LS, CM, EP, CF, EB, DM; data curation by EB, CM; writing was done by SO, LS, CF, CM; edit and review by LS, CF, AF, DM, CM, EB, EP; visualization was done by SO, EB, CF, EP; funding acquisition and project administration/supervision were done by SO, DF.


 Open access